Dating Pupae of the Blow Fly Calliphora vicina Robineau–Desvoidy 1830 (Diptera: Calliphoridae) for Post Mortem Interval—Estimation: Validation of Molecular Age Markers


Abstract
1. Introduction
2. Materials and Methods
2.1. Specimens
2.2. Identification of Genetic Markers for Age Determination
2.3. Isolation of Total RNA
2.4. Primer Design
2.5. One-Step Quantitative Polymerase Chain Reaction
2.6. Gene Expression and Data Analysis
3. Results and Discussion
4. Conclusions
- Ideally, RNA should be extracted as soon as possible after asservation. If the samples cannot be processed immediately, they should be preserved in 70–90% Ethanol or Trizol [40] to avoid significant RNA damage.
- The indicator of a certain age is a massive increase of the corresponding marker compared to stage A, the white prepupa (and most other phases of metamorphosis). Thus, all presented eligible markers should be typed in order to gain a detailed overall impression.
- Since development and the indicated ADD value is temperature dependent, the occurrence of a highly expressed marker must be translated into absolute age. For C. vicina and many other forensically-relevant blow fly taxa, reference data on the duration of development and the required ADD values at different constant temperatures since oviposition exist [8,38,39].
Supplementary Materials
Author Contributions
Conflicts of Interest
References
- Villet, M.H.; Amendt, J. Advances in entomological methods for estimating time of death. In Forensic Pathology Reviews; Turk, E.E., Ed.; Humana Press: Heidelberg, Germany, 2011; pp. 213–237. [Google Scholar]
- Forensic Entomology: International Dimensions and Frontiers; Tomberlin, J.K., Benbow, M.E., Eds.; CRC Press Taylor & Francis Group: Boca Raton, FL, USA, 2015. [Google Scholar]
- Greenberg, B. Flies as forensic indicators. J. Med. Entomol. 1991, 28, 565–577. [Google Scholar] [CrossRef] [PubMed]
- Smith, K.G. A Manual of Forensic Entomology; Cornell University Press: London, UK, 1986. [Google Scholar]
- Frederickx, C.; Dekeirsschieter, J.; Verheggen, F.J.; Haubruge, E. Responses of Lucilia sericata Meigen (Diptera: Calliphoridae) to cadaveric volatile organic compounds. J. Forensic Sci. 2012, 57, 386–390. [Google Scholar] [CrossRef] [PubMed]
- Paczkowski, S.; Nicke, S.; Ziegenhagen, H.; Schütz, S. Volatile emission of decomposing pig carcasses (Sus scrofa domesticus L.) as an indicator for the postmortem interval. J. Forensic Sci. 2015, 60, 7. [Google Scholar] [CrossRef] [PubMed]
- Dekeirsschieter, J.; Verheggen, F.J.; Gohy, M.; Hubrecht, F.; Bourguignon, L.; Lognay, G.; Haubruge, E. Cadaveric volatile organic compounds released by decaying pig carcasses (Sus domesticus L.) in different biotopes. Forensic Sci. Int. 2009, 189, 46–53. [Google Scholar] [CrossRef] [PubMed]
- Amendt, J.; Campobasso, C.P.; Gaudry, E.; Reiter, C.; LeBlanc, H.N.; Hall, M. Best practice in forensic entomology—Standards and guidelines. Int. J. Legal Med. 2007, 121, 90–104. [Google Scholar] [CrossRef] [PubMed]
- Arnaldos, M.I.; Garcia, M.; Romera, E.; Presa, J.; Luna, A. Estimation of postmortem interval in real cases based on experimentally obtained entomological evidence. Forensic Sci. Int. 2005, 149, 57–65. [Google Scholar] [CrossRef] [PubMed]
- Richards, C.S.; Crous, K.L.; Villet, M.H. Models of development for blowfly sister species Chrysomya chloropyga and Chrysomya putoria. Med. Vet. Entomol. 2009, 23, 56–61. [Google Scholar] [CrossRef] [PubMed]
- Wells, J.D.; LaMotte, L.R. Estimating maggot age from weight using inverse prediction. J. Forensic Sci. 1995, 40, 585–590. [Google Scholar] [CrossRef]
- Fraenkel, G.; Bhaskaran, G. Pupariation and pupation in Cyclorrhaphous flies (Diptera): Terminology and interpretation. Ann. Entomol. Soc. Am. 1973, 66, 418–422. [Google Scholar] [CrossRef]
- Bainbridge, S.P.; Bownes, M. Staging the metamorphosis of Drosophila melanogaster. J. Embryol. Exp. Morphol.. 1981, 57–80. [Google Scholar]
- Martin-Vega, D.; Hall, M.J.R.; Simonsen, T.J. Resolving confusion in the use of concepts and terminology in intrapuparial development studies of Cyclorrhaphous Diptera: Letter to the editor. J. Med. Entomol. 2016, 53, 1249–1251. [Google Scholar] [CrossRef] [PubMed]
- Denlinger, D.L.; Zdarek, J. Metamorphosis behavior of flies. Annu. Rev. Entomol. 1994, 39, 243–266. [Google Scholar] [CrossRef] [PubMed]
- Buszczak, M.; Segraves, W.A. Insect metamorphosis: Out with the old, in with the new. Curr. Biol. 2000, 10, R830–R833. [Google Scholar] [CrossRef]
- Zajac, B.K.; Amendt, J. Bestimmung des Alters forensisch relevanter Fliegenpuppen: Morphologische und histologische Methoden. Rechtsmedizin 2012, 22, 456–465. [Google Scholar] [CrossRef]
- Richards, C.S.; Simonsen, T.J.; Abel, R.L.; Hall, M.J.R.; Schwyn, D.A.; Wicklein, M.; Hall, M.J.R. Virtual forensic entomology: Improving estimates of minimum post-mortem interval with 3D micro-computed tomography. Forensic Sci. Int. 2012, 220, 251–264. [Google Scholar] [CrossRef] [PubMed]
- Brown, K.; Thorne, A.; Harvey, M. Calliphora vicina (Diptera: Calliphoridae) pupae: A timeline of external morphological development and a new age and PMI estimation tool. Int. J. Legal Med. 2015, 129, 835–850. [Google Scholar] [CrossRef] [PubMed]
- Martin-Vega, D.; Simonsen, T.J.; Hall, M.J.R. Looking into the puparium: Micro-CT visualization of the internal morphological changes during metamorphosis of the blow fly, Calliphora vicina, with the first quantitative analysis of organ development in cyclorrhaphous dipterans. J. Morphol. 2017, 278, 629–651. [Google Scholar] [CrossRef] [PubMed]
- Boehme, P.; Spahn, P.; Amendt, J.; Zehner, R. Differential gene expression during metamorphosis: A promising approach for age estimation of forensically important Calliphora vicina pupae (Diptera: Calliphoridae). Int. J. Legal Med. 2013, 127, 243–249. [Google Scholar] [CrossRef] [PubMed]
- Boehme, P.; Spahn, P.; Amendt, J.; Zehner, R. The analysis of temporal gene expression to estimate the age of forensically important blow fly pupae: Results from three blind studies. Int. J. Legal Med. 2014, 128, 565–573. [Google Scholar] [CrossRef] [PubMed]
- Zehner, R.; Amendt, J.; Boehme, P. Gene expression analysis as a tool for age estimation of blowfly pupae. Forensic Sci. Int. Gen. Suppl. Series 2009, 2, 292–293. [Google Scholar] [CrossRef]
- Tarone, A.M.; Foran, D.R. Gene expression during blow fly development: Improving the precision of age estimates in forensic entomology. J. Forensic Sci. 2011, 56, S112–S122. [Google Scholar] [CrossRef] [PubMed]
- Abdel-Ghaffer, H.; Mennatallah, A.-E.; Amira, Z. Age-dependent gene expression of blow fly Lucilia cuprina (Diptera: Calliphoridae) during egg development improving age estimation in forensic entomology. J. Forensic 2014, 5, 11000238. [Google Scholar] [CrossRef]
- Tarone, A.M.; Jennings, K.C.; Foran, D.R. Aging blow fly eggs using gene expression: A feasibility study. J. Forensic Sci. 2007, 52, 1350–1354. [Google Scholar] [CrossRef] [PubMed]
- Tarone, A.M.; Singh, B.; Picard, C.J. Molecular Biology in Forensic Entomology. In Forensic Entomology: International Dimensions and Frontiers; Tomberlin, J.K., Benbow, M.E., Eds.; CRC Press Taylor & Francis Group: Boca Raton, FL, USA, 2015; Chapter 24; pp. 297–316. [Google Scholar]
- Zajac, B.K.; Amendt, J.; Horres, R.; Verhoff, M.A.; Zehner, R. De novo transcriptome analysis and highly sensitive digital gene expression profiling of Calliphora vicina (Diptera: Calliphoridae) pupae using MACE (Massive Analysis of cDNA Ends). Forensic Sci. Int. Gen. 2015, 15, 137–146. [Google Scholar] [CrossRef] [PubMed]
- Farncombe, K.M.; Beresford, D.; Kyle, C.J. Characterization of microsatellite loci in Phormia regina towards expanding molecular applications in forensic entomology. Forensic Sci. Int. 2014, 240, 122–125. [Google Scholar] [CrossRef] [PubMed]
- Vera, J.C.; Wheat, C.W.; Fescemyer, H.W.; Frilander, M.J.; Crawford, D.L.; Hanski, I.; Marden, J.H. Rapid transcriptome characterization for a nonmodel organism using 454 pyrosequencing. Mol. Ecol. 2008, 17, 1636–1647. [Google Scholar] [CrossRef] [PubMed]
- Hahn, D.A.; Ragland, G.J.; Shoemaker, D.D.; Denlinger, D.L. Gene discovery using massively parallel pyrosequencing to develop ESTs for the flesh fly Sarcophaga crassipalpis. BMC Genom. 2009, 10, 234. [Google Scholar] [CrossRef] [PubMed]
- Marchenko, M.I. Medico-legal relevance of cadaver entomofauna for the determination of the time since death. Acta Med. Leg. Soc. 2001, 120, 89–109. [Google Scholar]
- Untergasser, A.; Cutcutache, I.; Koressaar, T.; Ye, J.; Faircloth, B.C.; Remm, M.; Rozen, S.G. Primer3—New capabilities and interfaces. Nucleic Acids Res. 2012, 40, e115. [Google Scholar] [CrossRef] [PubMed]
- Schmittgen, T.D.; Livak, K.J. Analyzing real-time PCR data by the comparative CT method. Nat. Protoc. 2008, 3, 1101–1108. [Google Scholar] [CrossRef] [PubMed]
- Gaudry, E.; Blais, C.; Maria, A.; Dauphin-Villemant, C. Study of steroidogenesis in pupae of the forensically important blow fly Protophormia terraenovae (Robineau–Desvoidy) (Diptera: Calliphoridae). Forensic Sci. Int. 2006, 160, 27–34. [Google Scholar] [CrossRef] [PubMed]
- Graveley, B.R.; Brooks, A.N.; Carlson, J.W.; Duff, M.O.; Landolin, J.M.; Yang, L.; Artieri, C.G.; van Baren, M.J.; Boley, N.; Booth, B.W.; et al. The developmental transcriptome of Drosophila melanogaster. Nature 2011, 471, 473–479. [Google Scholar] [CrossRef] [PubMed]
- Geib, S.M.; Calla, B.; Hall, B.; Hou, S.; Manoukis, N.C. Characterizing the developmental transcriptome of the oriental fruit fly, Bactrocera dorsalis (Diptera: Tephritidae) through comparative genomic analysis with Drosophila melanogaster utilizing modENCODE datasets. BMC Genom. 2014, 15, 942. [Google Scholar] [CrossRef] [PubMed]
- Anderson, G.S. Minimum and maximum development rates of some forensically important Calliphoridae (Diptera). J. Forensic Sci. 2000, 45, 824–832. [Google Scholar] [CrossRef] [PubMed]
- Ames, C.E.; Turner, B. Low temperature episodes in development of blowflies: Implications for post mortem interval estimation. Med. Vet. Entomol. 2003, 17, 178–186. [Google Scholar] [CrossRef] [PubMed]
- Zehner, R.; et al. Storage solutions for larva and pupae of Calliphora vicina suitable for subsequent RT PCR. Institute of Legal Medicine, Goethe University, Frankfurt, Germany. 2017. [Google Scholar]


| Oviposition to Pupariation (White Prepupae) | Pupariation to Adult Emergence | Oviposition to Adult Emergence | ||||
|---|---|---|---|---|---|---|
| Temp. | min | max | min | max | min | max |
| 17 °C | 132.7 (8.8) | 150.9 (10.1) | 207.2 (13.8) | 242.6 (16.2) | 358.1 (23.9) | 375.3 (25.0) |
| 20 °C | 157.1 (8.7) | 180.4 (10.0) | 181.1 (10.1) | 238.9 (13.3) | 361.5 (20.1) | 396.0 (22.0) |
| 25 °C | 178.3 (7.8) | 189.8 (8.3) | 194.0 (8.4) | 216.1 (9.4) | 383.8 (16.7) | 394.4 (17.1) |
| 17 °C | 20 °C | 25 °C | ||||||
|---|---|---|---|---|---|---|---|---|
| Sampling Day | ADD | Marker | Sampling Day | ADD | Marker | Sampling Day | ADD | Marker |
| 1 | 140 | A | 1 | 172 | A/B | 1 | 184 | A/B |
| 2 | 155 | B | 2 | 190 | B/C | |||
| 3 | 170 | C | 2 | 207 | B/C/D | |||
| 4 | 185 | D | 3 | 208 | C/D | |||
| 5 | 200 | E | 4 | 226 | D/E | 3 | 230 | D/E |
| 6 | 215 | F | 5 | 244 | E/F/G | 4 | 253 | E/F/G |
| 7 | 230 | G | 6 | 262 | G/H | |||
| 8 | 245 | H | 7 | 280 | H/I | 5 | 276 | G/H |
| 9 | 260 | I | 6 | 299 | I/J | |||
| 10 | 275 | J | 8 | 298 | I/J | |||
| 11 | 290 | K | 9 | 316 | J/K/L | 7 | 322 | J/K/L |
| 12 | 305 | L | 10 | 334 | L/M | 8 | 345 | L/M |
| 13 | 320 | M | 11 | 352 | M/N | |||
| 14 | 335 | N | 9 | 368 | N/O | |||
| 15 | 350 | O | 12 | 370 | O | |||
| Marker | Forward Primer | Reverse Primer | Product Length (bp) | Normalized Transcript Counts (Landmark A) | Mean Normalized Transcript Counts of Other Landmarks | Contig | Annotation |
|---|---|---|---|---|---|---|---|
| B-1 | ACATCTCCGCTCGCATTCTCC | CGTGTAACCAAGCTCCGCATT | 164 | 3837.134 (68.34) | 10.869 | Contig5316 | tr|B4LCU1|B4LCU1_DROVI GJ12906 OS = Drosophila virilis GN = Dvir\GJ12906 PE = 4 SV = 1 |
| B-2 | TCTTGGGTGCAGGACGACATT | GGGTAGACTCTCGTCGTTGTG | 72 | 4168.19 (77.346) | 13.423 | Contig5717 | tr|Q9W4B7|Q9W4B7_DROME CG4151 OS = Drosophila melanogaster GN = CG4151 PE = 2 SV = 1 |
| C-1 | CCAGCTGCCGTTACTCCTTATC | CCGTAGACTTCATCGGGTTGTT | 104 | 457.333 (0.795) | 2.692 | Contig3033 | tr|T1PL89|T1PL89_MUSDO Uncharacterized protein OS = Musca domestica PE = 2 SV = 1 |
| C-2 | GATGAAGTCTACGGCCCACC | CTGCGAGCAGATGAAGTACGG | 191 | 353.407 (0.662) | 2.450 | Contig3033 | tr|T1PL89|T1PL89_MUSDO Uncharacterized protein OS = Musca domestica PE = 2 SV = 1 |
| D-1 | ATGTCGAGGTCCACCTGTAGT | AACAAACTGGGCGAAGGGAA | 114 | 798.587 (3.973) | 72.970 | Contig3088 | sp|O76217|PE1_ANOGA Peritrophin-1 OS = Anopheles gambiae GN = Aper1 PE = 2 SV = 2 |
| D-2 | CCAGCCGAGTTCTAATGCCC | GTTTCGCCTTTGGTCGTTCC | 103 | 566.234 (6.357) | 73.474 | comp162812_c0_seq1 | uncharacterized RNA |
| E-1 | ACCGGACGTCACTGATTCCTT | AGCGTTATGCTGGTCTGGTC | 171 | 46.499 (14.039) | 3.796 | Contig5877 | sp|Q7JQ07|MOS1T_DROMA Mariner Mos1 transposase OS = Drosophila mauritiana GN = mariner\T PE = 1 SV = 1 |
| E-2 | CTCATTGCATTGGCAGAGAGACTG | AAAGCACCCACCGATGACAG | 128 | 261.985 (13.377) | 41.105 | Contig2811 | uncharacterized RNA |
| F-1 | GGCCTTAAGCTCTAATTGTCCCTC | CTTGATATTGCCGGAGCCCA | 163 | 14612.462 (53.109) | 1564.769 | Contig2939 | uncharacterized RNA |
| F-2 | AGGACAGTTGATGTCCGGTTTC | GCTAGACATGGTGTGAATTCGGG | 129 | 1789.857 (113.9) | 93.082 | Contig5446 | uncharacterized RNA |
| G-1 | ACGTTGACAAGTGTCTGGCTC | CTGGCTATGACGCTCTCGCA | 179 | 276.185 (0.795) | 6.565 | comp11460_c0_seq1 | tr|S6B1X7|S6B1X7_9MUSC Odorant-binding protein OS = Delia antiqua GN = DantOBP16 PE = 2 SV = 1 |
| G-2 | AGCCCAATACGAAGGAGCCA | CAGTCAGCCATCGTTCCATTCTTG | 159 | 931.119 (2.914) | 32.261 | Contig1423 | tr|B4M6C9|B4M6C9_DROVI GJ10414 OS = Drosophila virilis GN = Dvir\GJ10414 PE = 4 SV = 1 |
| H-1 | GGGCTATTCTACACATCATACGGG | ACCAAGACCGTGAGCCTGTT | 115 | 150.791 (0.265) | 0.348 | comp16284_c0_seq1 | uncharacterized RNA |
| H-2 | CCGCCCTGATAGCAATTATAGTCC | TCTGAGACTTAGTGCGCTGTCC | 176 | 383.904 (1.06) | 3.586 | comp19725_c0_seq1 | uncharacterized RNA |
| I-1 | AAGAAACGCTCTGGACGCAA | CGAGCCAAGAATGGAGGTGG | 107 | 1698.144 (3.708) | 45.997 | comp13408_c1_seq1 | uncharacterized RNA |
| I-2 | GCGGTGCCCAACTACCAAATAA | TACTGACACCACTTAGACCCGA | 192 | 543.64 (0.662) | 14.865 | comp10716_c0_seq1 | tr|B4IZK1|B4IZK1_DROGR GH17053 OS = Drosophila grimshawi GN = Dgri\GH17053 PE = 4 SV = 1 |
| J-1 | CCAGGAGGGCAAATGTAGACCA | TCCATACCCACTGCCGTTTC | 177 | 1542.921 (5.165) | 154.044 | Contig1789 | tr|B4MN60|B4MN60_DROWI GK17641 OS = Drosophila willistoni GN = Dwil\GK17641 PE = 4 SV = 1 |
| J-2 | TCACCATCTCTGGTCTCCCAA | GCTCATGAGGATTATGAGGGTGG | 134 | 1164.349 (3.311) | 112.076 | Contig4584 | sp|P45583|CU19_LOCMI Cuticle protein 19 OS = Locusta migratoria PE = 1 SV = 1 |
| K-1 | GGAGAAGACAGGACAGACTTGG | CAAGCCGCCAAACAATACGG | 150 | 2137.504 (10.066) | 267.367 | Contig5672 | gi|296335865|gb|EZ599050.1| TSA: Sarcophaga crassipalpis HAHN.FLY.1245.C4 mRNA sequence///tr|B4MMM7|B4MMM7_DROWI |
| K-2 | CGAGTGGGTGGCAACAAGAA | CCATACGCGAAGTTCCGACA | 166 | 239.901 (4.371) | 12.681 | Contig3509 | sp|P05804|BGLR_ECOLI Beta-glucuronidase OS = Escherichia coli (strain K12) GN = uidA PE = 1 SV = 2 |
| L-1 | TGTTGACACTGGCGAAGTGGA | CTACGCTCGCCTTCTACATCATC | 144 | 545.983 (2.119) | 51.450 | Contig4745 | uncharacterized RNA |
| L-2 | CCGCTAGGAGCAGAAGGTAGT | CCTCCATCAGGTGTAGGAAGTGA | 197 | 480.257 (3.576) | 59.589 | Contig421 | tr|B3MYH7|B3MYH7_DROAN GF22144 OS = Drosophila ananassae GN = Dana\GF22144 PE = 4 SV = 1 |
| M-1 | ATTCACAAACCGGCAAGGGT | GCCAGCAGTGTAGGAGCAAA | 173 | 289.837 (0.795) | 33.279 | comp21483_c0_seq1 | sp|Q8MUG0|GPL_GLOFF Lectizyme OS = Glossina fuscipes fuscipes GN = Gpl PE = 2 SV = 1 |
| M-2 | GCAACAATGGGAGCAGCAAC | TTGACCGGTGACAGCAAGAG | 179 | 708.812 (3.046) | 106.042 | Contig4395 | sp|P81225|CU21_LOCMI Cuticle protein 21 OS = Locusta migratoria GN = ACP21 PE = 1 SV = 1 |
| N-1 | GAGCAGCACAAGCCAATCTCT | ACATAATAAGGACGCCACGCTC | 157 | 128.003 (1.192) | 5.173 | comp5434_c0_seq1 | tr|B3MIB5|B3MIB5_DROAN GF12734 OS = Drosophila ananassae GN = Dana\GF12734 PE = 4 SV = 1 |
| N-2 | AAACGAGCGGGTACAGCCA | GGGTTCCTACTCCGTTGTAGATG | 174 | 1203.364 (3.046) | 67.999 | Contig4395 | sp|P81225|CU21_LOCMI Cuticle protein 21 OS = Locusta migratoria GN = ACP21 PE = 1 SV = 1 |
| O-1 | GCTTTGTGCTTGTTGGCTGTTG | AGGCTGTGGTGTAGGGTGAAG | 82 | 512.401 (1.722) | 3.453 | Contig3447 | uncharacterized RNA |
| O-2 | TGTAGGCAGCAGTGTAGGGA | CGCTATTGTTGCCTTGGCTG | 98 | 1005.226 (2.914) | 34.484 | comp21535_c2_seq20 | gi|296343591|gb|EZ606776.1| TSA: Sarcophaga crassipalpis HAHN.FLY.7765.C7 mRNA sequence |
| R1* | AAGGTGGTGGCGGTTGATTT | TCGACCACAGGTGGAGAAGA | 175 | Mean norm transcript counts (SD) 127.799 (19.657) | Contig3750 | tr|T1P7X0|T1P7X0_MUSDO Uncharacterized protein OS = Musca domestica PE = 4 SV = 1 | |
| R2* | ACAATGGCCGCCTTCCTTGA | AGGATCCTCCAGTCCGCAAG | 83 | Mean norm transcript counts (SD) 137.088 (15.225) | Contig4663 | sp|P53575|ETFB_BRAJA Electron transfer flavoprotein subunit beta OS = Bradyrhizobium japonicum (strain USDA 110) GN = etfB PE = 3 SV = 2 | |
| 17 °C | 20 °C | 25 °C | ||||||||||
|---|---|---|---|---|---|---|---|---|---|---|---|---|
| Marker | Test | χ2 or F Value | p Value | R2 | Test | χ2 or F Value | p Value | R2 | Test | χ2 or F Value | p Value | R2 |
| B-1 | ANOVA | 343.3 | <0.0001 | 0.9581 | Kruskal–Wallis | 122.4 | <0.0001 | - | Kruskal–Wallis | 73.83 | <0.0001 | - |
| B-2 | Kruskal–Wallis | 194.6 | <0.0001 | - | Kruskal–Wallis | 139.2 | <0.0001 | - | ANOVA | 86.11 | <0.0001 | 0.8548 |
| C-1 | Kruskal–Wallis | 177.2 | <0.0001 | - | Kruskal–Wallis | 151.6 | <0.0001 | - | ANOVA | 194 | <0.0001 | 0.9249 |
| C-2 | Kruskal–Wallis | 119.6 | <0.0001 | - | ANOVA | 58.9 | <0.0001 | 0.8029 | Kruskal–Wallis | 115.8 | <0.0001 | - |
| D-1 | ANOVA | 3.061 | 0.0005 | 0.2681 | - | - | - | - | - | - | - | - |
| D-2 | ANOVA | 38.82 | <0.0001 | 0.82229 | - | - | - | - | - | - | - | - |
| E-1 | - | - | - | - | - | - | - | - | - | - | - | - |
| E-2 | Kruskal–Wallis | 167.2 | <0.0001 | - | Kruskal–Wallis | 167.8 | <0.0001 | - | ANOVA | 66.75 | <0.0001 | 0.8091 |
| F-1 | Kruskal–Wallis | 205.6 | <0.0001 | - | Kruskal–Wallis | 158.2 | <0.0001 | - | Kruskal–Wallis | 119.3 | <0.0001 | - |
| F-2 | Kruskal–Wallis | 177 | <0.0001 | - | ANOVA | 469.3 | <0.0001 | 0.969 | ANOVA | 81.16 | <0.0001 | 0.8375 |
| G-1 | Kruskal–Wallis | 102.4 | <0.0001 | - | Kruskal–Wallis | 119.3 | <0.0001 | - | Kruskal–Wallis | 117.8 | <0.0001 | - |
| G-2 | Kruskal–Wallis | 104.4 | <0.0001 | - | Kruskal–Wallis | 132.1 | <0.0001 | - | ANOVA | 132.6 | <0.0001 | 0.8938 |
| H-1 | Kruskal–Wallis | 70.01 | <0.0001 | - | Kruskal–Wallis | 127.4 | <0.0001 | - | Kruskal–Wallis | 84.19 | <0.0001 | - |
| H-2 | Kruskal–Wallis | 115.9 | <0.0001 | - | Kruskal–Wallis | 144.4 | <0.0001 | - | ANOVA | 88.37 | <0.0001 | 0.8487 |
| I-1 | Kruskal–Wallis | 146.5 | <0.0001 | - | ANOVA | 299.7 | <0.0001 | 0.9532 | ANOVA | 111.5 | <0.0001 | 0.8788 |
| I-2 | Kruskal–Wallis | 118.7 | <0.0001 | - | Kruskal–Wallis | 142.6 | <0.0001 | - | Kruskal–Wallis | 115.2 | <0.0001 | - |
| J-1 | Kruskal–Wallis | 209.6 | <0.0001 | - | Kruskal–Wallis | 163.5 | <0.0001 | - | ANOVA | 139.2 | <0.0001 | 0.8983 |
| J-2 | Kruskal–Wallis | 124.5 | <0.0001 | - | Kruskal–Wallis | 131.2 | <0.0001 | - | ANOVA | 271.2 | <0.0001 | 0.9476 |
| K-1 | Kruskal–Wallis | 182.3 | <0.0001 | - | ANOVA | 392.8 | <0.0001 | 0.9639 | ANOVA | 373 | <0.0001 | 0.9623 |
| K-2 | Kruskal–Wallis | 108.5 | <0.0001 | - | Kruskal–Wallis | 106.1 | <0.0001 | - | Kruskal–Wallis | 99.4 | <0.0001 | - |
| L-1 | Kruskal–Wallis | 71.46 | <0.0001 | - | Kruskal–Wallis | 81.5 | <0.0001 | - | ANOVA | 22.24 | <0.0001 | 0.5913 |
| L-2 | Kruskal–Wallis | 187.9 | <0.0001 | - | Kruskal–Wallis | 156.4 | <0.0001 | - | Kruskal–Wallis | 100.7 | <0.0001 | - |
| M-1 | Kruskal–Wallis | 158.6 | <0.0001 | - | Kruskal–Wallis | 137.2 | <0.0001 | - | ANOVA | 118.5 | <0.0001 | 0.8826 |
| M-2 | Kruskal–Wallis | 148.2 | <0.0001 | - | ANOVA | 145.4 | <0.0001 | 0.9096 | ANOVA | 115.9 | <0.0001 | 0.8829 |
| N-1 | Kruskal–Wallis | 87.68 | <0.0001 | - | Kruskal–Wallis | 113.7 | <0.0001 | - | ANOVA | 17.89 | <0.0001 | 0.5318 |
| N-2 | Kruskal–Wallis | 117.5 | <0.0001 | - | Kruskal–Wallis | 119.3 | <0.0001 | - | Kruskal–Wallis | 73.99 | <0.0001 | - |
| O-1 | Kruskal–Wallis | 191 | <0.0001 | - | Kruskal–Wallis | 159.8 | <0.0001 | - | Kruskal–Wallis | 116.9 | <0.0001 | - |
| O-2 | Kruskal–Wallis | 145.4 | <0.0001 | - | ANOVA | 427.6 | <0.0001 | 0.9679 | Kruskal–Wallis | 120.7 | <0.0001 | - |
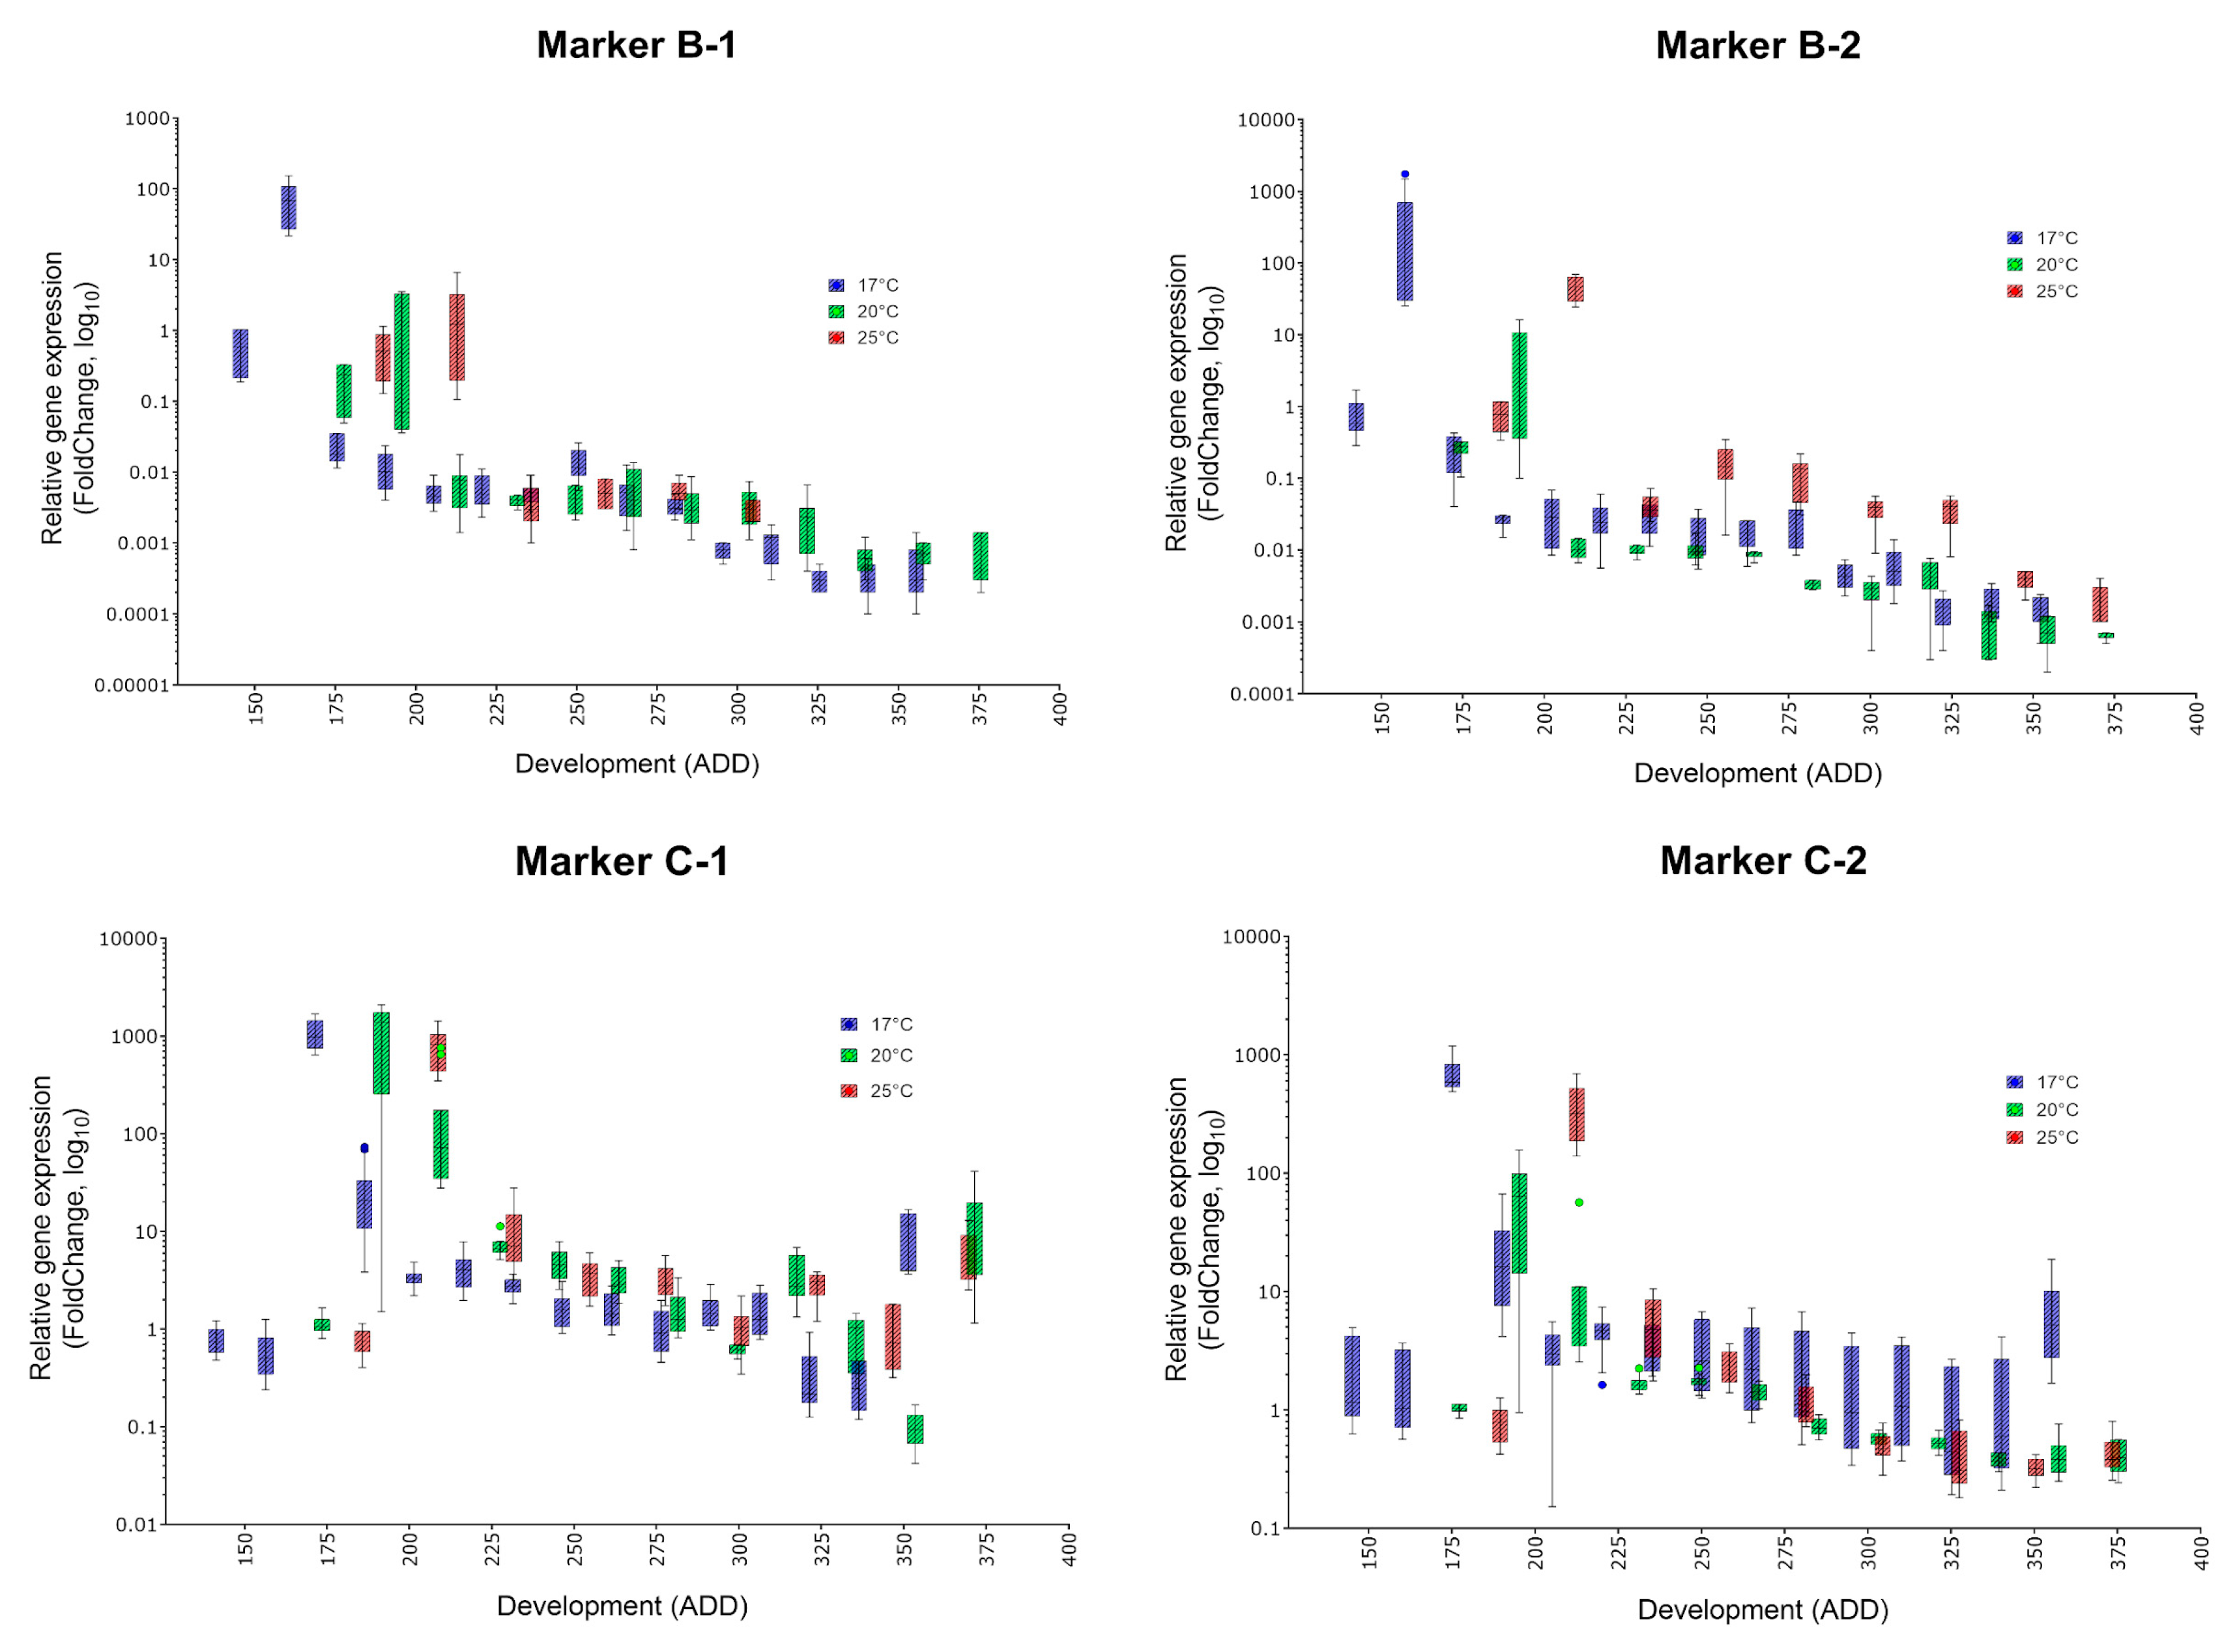
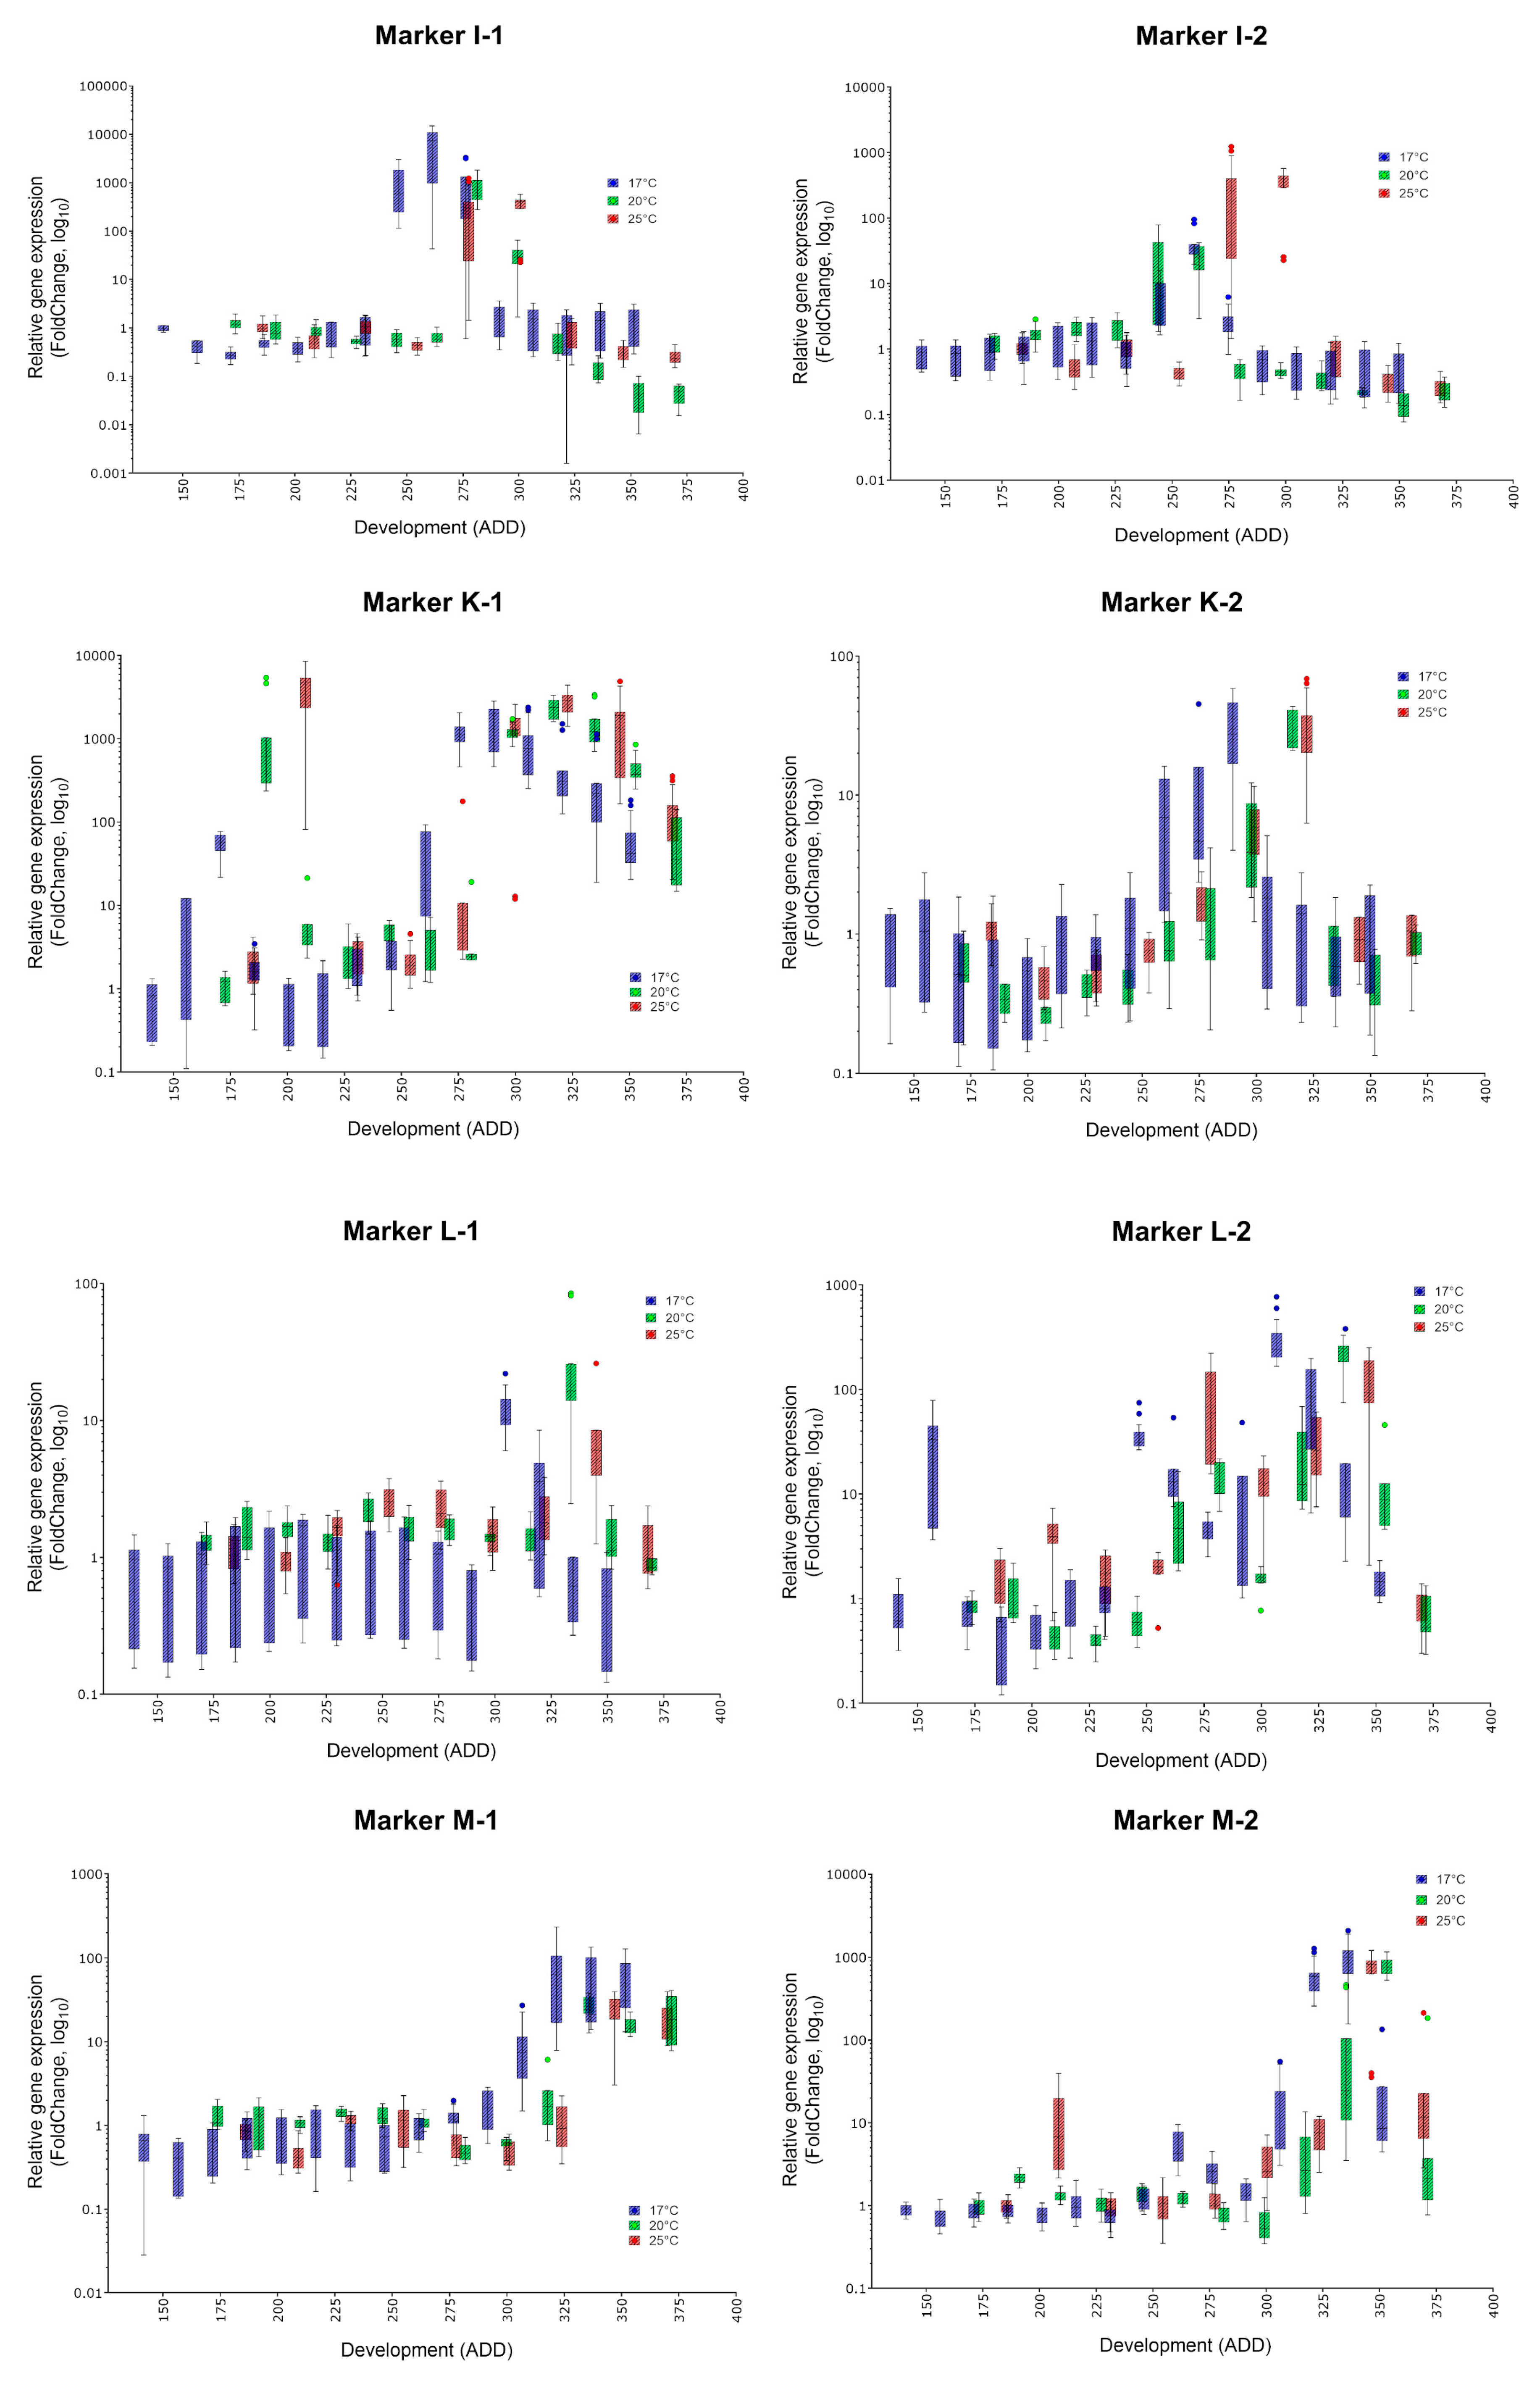
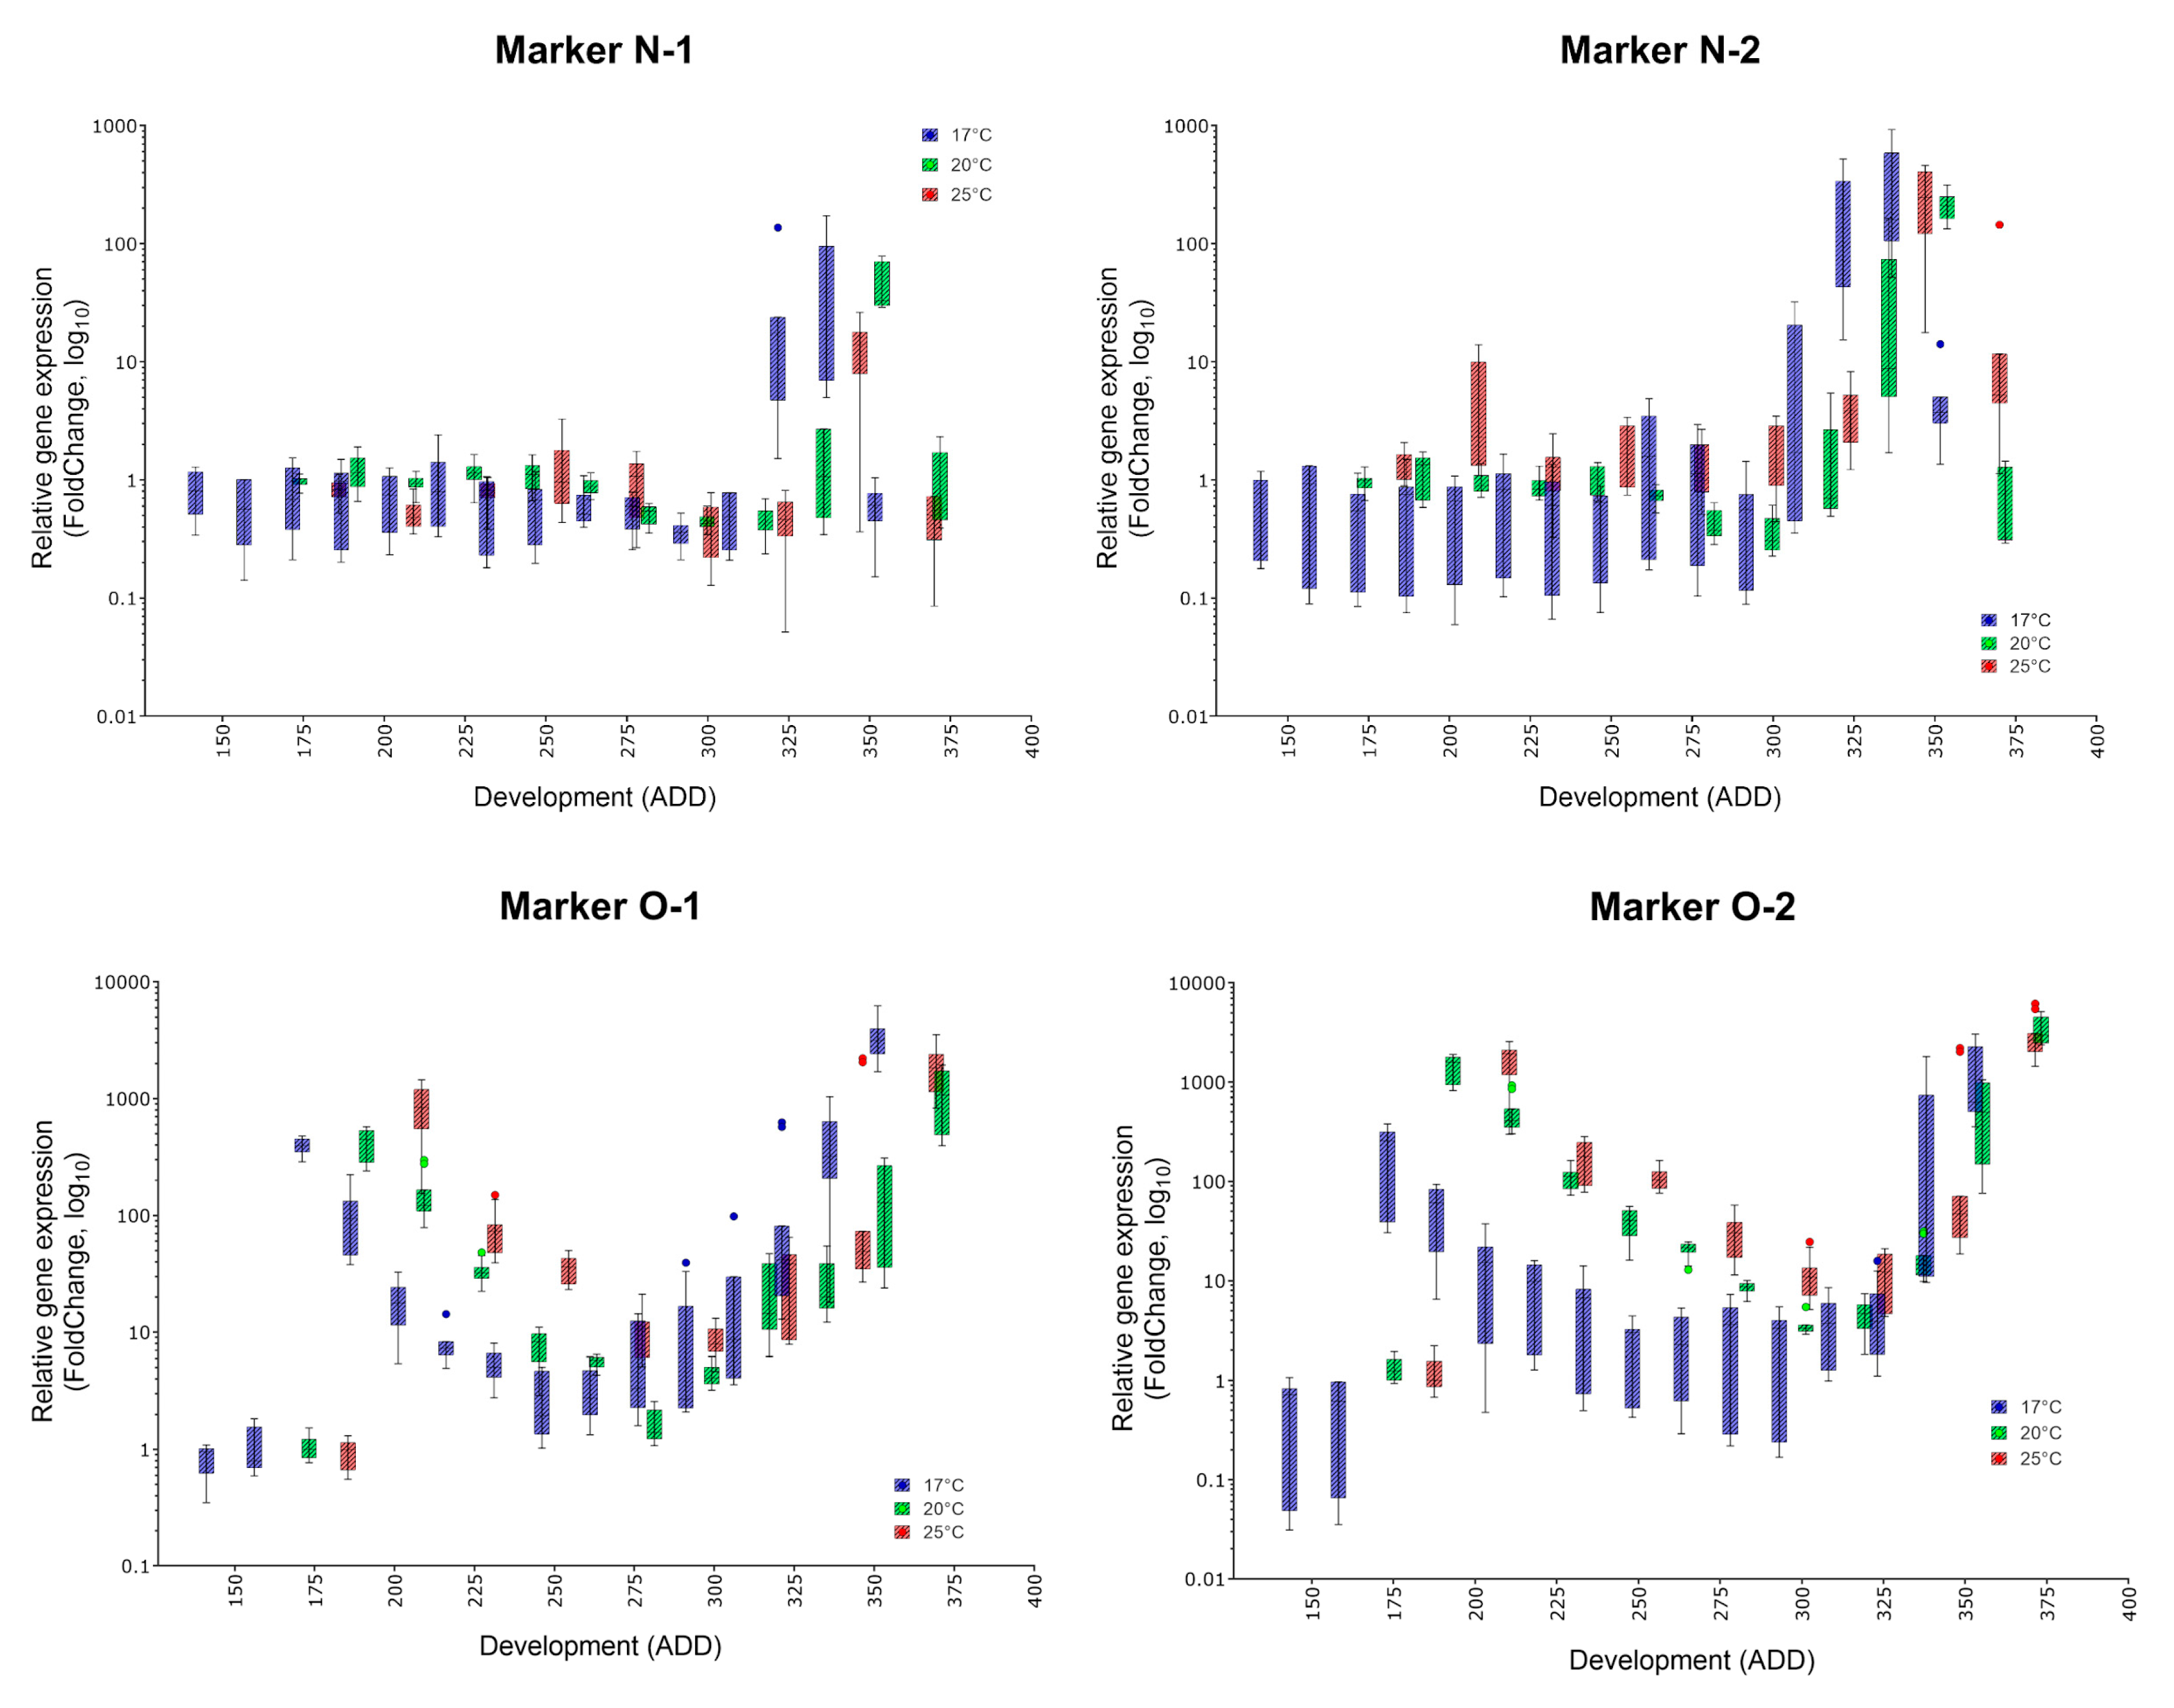
| Marker | Specific Peak | Mean FC (17, 20, 25 °C) | Secondary Peak | Mean FC (17, 20, 25 °C) | Applicability |
|---|---|---|---|---|---|
| B-1 | ✓ | 72.5, 1.315, 2.1 | no | (✓) | |
| B-2 | ✓ | 426.1, 5.246, 28.5 | no | ✓ | |
| C-1 | ✓ | 966.9, 210.6, 763.5 | no | ✓ | |
| C-2 | ✓ | 684.8, 62.95, 350.8 | no | ✓ | |
| E-2 | ✓ | 9.2, 19.0, 13.39 | no | (✓) | |
| F-1 | ✓ | 41764, 15390, 16534 | no | ✓ | |
| F-2 | ✓ | 10.9, 27.5, 12.17 | no | (✓) | |
| G-1 | ✓ | 34.3, 173.1, 34.63 | no | (✓) | |
| G-2 | ✓ | 818, 495.3, 172.4 | no | ✓ | |
| H-1 | (✓) | 7.9, 3.3, 23.5 | only in breeds at 20 and 25 °C | 9.6, 11.3 | - |
| H-2 | ✓ | 796.9, 61.9, 347.7 | no | ✓ | |
| I-1 | ✓ | 6633, 811.6, 348.7 | no | ✓ | |
| I-2 | ✓ | 44.3, 46.66, 26.05 | no | (✓) | |
| J-1 | ✓ | 2094, 796.6, 2378 | yes | 42.85, 31.61, 37.39 | (✓) |
| J-2 | ✓ | 523.1, 93.72, 763.3 | no | ✓ | |
| K-1 | ✓ | 1617, 2329, 2808 | yes | 274.5, 1511, 4008 | (✓) |
| K-2 | ✓ | 28.85, 29.67, 30.58 | no | ✓ | |
| L-1 | ✓ | 11.86, 28.86, 9.1 | no | (✓) | |
| L-2 | ✓ | 312.7, 216.6, 113 | yes | 36.7, 14.08, 86.72 | (✓) |
| M-1 | ✓ | 80.4, 25.68, 22.82 | no | (✓) | |
| M-2 | ✓ | 489.8, 787.4, 711.6 | no | ✓ | |
| N-1 | ✓ | 53.89, 47.32, 12.94 | no | (✓) | |
| N-2 | ✓ | 344, 211.6, 245.2 | no | ✓ | |
| O-1 | ✓ | 3384, 1120, 1840 | yes | 1023, 421.8, 825.2 | ✓ |
| O-2 | ✓ | 1288, 3380, 3079 | yes | 198.8, 1442, 1592 | (✓) |
© 2018 by the authors. Licensee MDPI, Basel, Switzerland. This article is an open access article distributed under the terms and conditions of the Creative Commons Attribution (CC BY) license (http://creativecommons.org/licenses/by/4.0/).
Share and Cite
Zajac, B.K.; Amendt, J.; Verhoff, M.A.; Zehner, R. Dating Pupae of the Blow Fly Calliphora vicina Robineau–Desvoidy 1830 (Diptera: Calliphoridae) for Post Mortem Interval—Estimation: Validation of Molecular Age Markers. Genes 2018, 9, 153. https://doi.org/10.3390/genes9030153
Zajac BK, Amendt J, Verhoff MA, Zehner R. Dating Pupae of the Blow Fly Calliphora vicina Robineau–Desvoidy 1830 (Diptera: Calliphoridae) for Post Mortem Interval—Estimation: Validation of Molecular Age Markers. Genes. 2018; 9(3):153. https://doi.org/10.3390/genes9030153
Chicago/Turabian StyleZajac, Barbara K., Jens Amendt, Marcel A. Verhoff, and Richard Zehner. 2018. "Dating Pupae of the Blow Fly Calliphora vicina Robineau–Desvoidy 1830 (Diptera: Calliphoridae) for Post Mortem Interval—Estimation: Validation of Molecular Age Markers" Genes 9, no. 3: 153. https://doi.org/10.3390/genes9030153
APA StyleZajac, B. K., Amendt, J., Verhoff, M. A., & Zehner, R. (2018). Dating Pupae of the Blow Fly Calliphora vicina Robineau–Desvoidy 1830 (Diptera: Calliphoridae) for Post Mortem Interval—Estimation: Validation of Molecular Age Markers. Genes, 9(3), 153. https://doi.org/10.3390/genes9030153