Abstract
The peripheral tissue pacemaker is responsive to light and other zeitgebers, especially food availability. Generally, the pacemaker can be reset and entrained independently of the central circadian structures. Studies involving clock-gene expressional patterns in fish peripheral tissues have attracted considerable attention. However, the rhythmic expression of clock genes in skeletal muscle has only scarcely been investigated. The present study was designed to investigate the core clock and functional gene expression rhythms in crucian carp. Meanwhile, the synchronized effect of food restrictions (short-term fasting) on these rhythms in skeletal muscle was carefully examined. In fed crucian carp, three core clock genes (Clock, Bmal1a, and Per1) and five functional genes (Epo, Fas, IGF1R2, Jnk1, and MyoG) showed circadian rhythms. By comparison, four core clock genes (Clock, Bmal1a, Cry3, and Per2) and six functional genes (Epo, GH, IGF2, Mstn, Pnp5a, and Ucp1) showed circadian rhythms in crucian carp muscle after 7-day fasting. In addition, three core clock genes (Clock, Per1, and Per3) and six functional genes (Ampk1a, Lpl, MyoG, Pnp5a, PPARα, and Ucp1) showed circadian rhythms in crucian carp muscle after 15-day fasting. However, all gene rhythmic expression patterns differed from each other. Furthermore, it was found that the circadian genes could be altered by feed deprivation in crucian carp muscle through the rhythms correlation analysis of the circadian genes and functional genes. Hence, food-anticipatory activity of fish could be adjusted through the food delivery restriction under a light–dark cycle. These results provide a potential application in promoting fish growth by adjusting feeding conditions and nutritional state.
1. Introduction
Some aspects of physiology, behavior, and gene expression in fish are regulated by circadian clocks [1,2,3]. The central circadian clock genes have different locations among species. These include pineal gland, retina, and suprachiasmatic nucleus (SCN)-like structure within the hypothalamus in fish [4]. In addition to the central clock components, peripheral tissues of the liver, kidney, heart, and skeletal muscle possess local circadian clocks as well [4,5,6]. Generally, the circadian rhythm of biological activities can be influenced by external stimuli such as feeding and light. For example, in the liver of Nile tilapia, the molecular clock of peripheral oscillators can be controlled by a restricted feeding mode [7,8]. Nevertheless, the studies on the effect of fasting on the molecular clock of skeletal muscle in fish are still scarce.
There is widespread agreement that the core components of the molecular clock gene system are formed by two main arms which are positive and negative transcriptional–translational feedback loops [9]. In the positive group, the activators Clock and Bmal1 are known to heterodimerize, thus enhancing promoters transcription of the negative arms encoded by Period (Per1, Per2, and Per3) and Cryptochrome (Cry1, Cry2, and Cry3) genes [10]. When enough PER and CRY complexes are formed and translocated to the nucleus, these complexes inhibit their own transcription and block the function of the CLOCK:BMAL1 heterodimer. Compared with the core clock genes in mammals, those in fish are more homologous. This theory is confirmed in zebrafish, medaka, goldfish, European seabass, gilthead seabream, Senegalese sole, Atlantic cod, and Chinese perch [11,12,13,14,15,16,17,18].
The aims of this study were twofold: Firstly, to test the daily rhythms of the two positive and six negative loops of the molecular clock genes in crucian carp peripheral (muscle) tissue and, secondly, to explore the effect of short term (7 days and 15 days) starvation on muscle rhythm in crucian carp.
2. Materials and Methods
2.1. Animals and Tissue Collection
The protocol was approved by the Institutional Animal Care and Use Committee (IACUC) of Changsha University (permit #20128945-1, 2015). All surgeries were performed under sodium pentobarbital or tricaine methanesulfonate (MS-222) anesthesia, and every effort was made to minimize animal suffering. All fish handling procedures conducted during the study were approved by the IACUC Committee.
Before the start of the experiment, crucian carp, with body weight of about 50 ± 5 g, were randomly assigned into three tanks (60 fish per tank); each tank had six divided grid cages (10 fish were randomly placed in each cage). All fish were fed once a day at the same time on a commercial pellet diet (1% body weight, Tongwei Group Co., Ltd., Si Chuan, China) for acclimating ~4 weeks. Fishes were all adapted to a 12L:12D photoperiod, with lights on at zeitgeber time 0 (ZT0). After 1 month, the first cage was used as control for normal feeding during the experiment. The dorsal epaxial muscle samples were collected from six individuals at 6:00, 9:00, 12:00, 15:00, 18:00, 21:00, 24:00, and 3:00 and 6:00 of the following day, which corresponds to ZT0, ZT3, ZT6, ZT9, ZT12, ZT15, ZT18, and ZT21 and ZT24 of the following day. At these points, average fish weight was approximately 50 ± 5 g. The samples were immediately frozen in liquid nitrogen and stored at −80 °C. The remaining two tanks of fish, which experienced unchanged light conditions, were starved for 7 days and 15 days and the same part skeletal muscles were collected as described above, respectively.
2.2. RNA Extraction and complementary DNA Synthesis
Total RNA from the muscle tissues was extracted using a Trizol reagent kit (Takara Biotechnology, Dalian, China) following the manufacturer’s standard protocol. Then RNA concentration and purity were investigated by measuring absorbance at 260/280 nm with a Nanodrop 2000 spectrophotometer (Nanodrop Technologies, Wilmington, DE, USA). Meanwhile, 1.5% agarose gel electrophoresis was used to check the integrity and relative quantity of RNA. The Prime ScriptTM reagent Kit with gDNA Eraser kit (Takara Biotechnology, Dalian, China) was used to synthesize the single strand cDNA.
2.3. Quantitative Real-Time PCR (qPCR)
The SYBR® Premix Ex Taq II (Tli RNaseH Plus) (Takara Biotechnology, Dalian, China) was used for quantitative real-time PCR (qPCR) and its amplification reaction was carried out with a Bio-Rad CFX96 system (USA). Primer pairs purchased from Biosune (Shanghai, China) are shown in Table 1. β-actin (AB039726.2) was used as an internal control. The total volume of 25 μL reaction mix contained 2 μL cDNA templates, 12.5 μL SYBR Premix Ex Taq, 8.5 μL ddH2O, and 1 μL each of forward and reverse primers (Table 1). The following protocols were used. (1) Predenaturation at 95°C for 30 s; (2) amplification and quantification step, 40 cycles of 95 °C for 5 s, and 58 °C for 25 s; (3) melting curve formation: 65 °C to 95 °C, every rise by 0.5°C to collect fluorescence value at a time. The qPCR analysis of each sample was repeated three times.

Table 1.
Primer sequences used in the study.
2.4. Statistical Analysis
The relative expression ratio of target genes was calculated by R = 2−∆∆Ct, where Ct is the number of cycles when the fluorescence signal reaches a set threshold. All data were analyzed for the tests of normality and equal variance. Normally distributed data were analyzed using ANOVA followed by Ducan post hoc tests using SPSS 16.0 (International Business Machines Corporation, Armonk, NY, USA). Since the distribution of experimental values was bell-shaped, a cyclic Gaussian curve was used as the mathematical model to describe genes rhythms [19,20]. The cosinor analysis was used to evaluate daily rhythmicity in the expression of all the detected genes, cosinor analysis was performed by fitting a periodic sinusoidal function (f(t) = M + Acos(tπ/12 − ϕ) to the expression values of genes across the nine time points, where f(t) is the gene expression level in a given time, mesor (M) is the mean value, A is the sinusoidal amplitude of oscillation, t is time in hours, and ϕ is the acrophase (peak time of the approximating sinusoidal function). Periodic sinusoidal function was performed by MATLAB (Math Works, Natick, MA, USA). The statistical significance p-value of cosinor analysis was defined by the noise/signal of amplitude calculated from the ratio SE(A)/A. Expression of these genes was considered to display rhythmicity if it had both p < 0.05 by ANOVA and p-value < 0.3 by Matlab [16,21]. Correlation of messenger RNA (mRNA) expression levels between the clock genes and functional genes was analyzed using the Pearson’s correlation test (r).
3. Results
3.1. Rhythmic Expression of Core Clock and Functional Genes during a Daily Cycle in the Muscle of Normally Fed Crucian Carp
The daily expression profiles of the circadian clock genes shows that the positive arms (Clock and Bmal1a) and negative arms (Per1) displayed a significant daily rhythm in skeletal muscle during the fed state (Figure 1 and Table 2). In addition, the peak expression of Clock, Bmal1a, and Per1 occurred at night. Among the functional genes, Epo, Fas, Igf1r2, Jnk1, and MyoG displayed daily rhythmic expression. Only Fas and MyoG had an acrophase during the light phase (Figure 2 and Table 2).
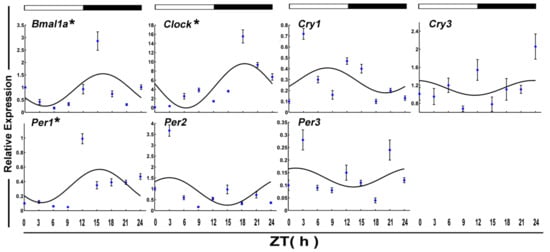
Figure 1.
Cosinor analyses of the core clock genes expression levels in the muscle of normally fed crucian carp during the daily light–dark cycle. The values are mean ± SEM (n = 6) of the normalized transcript levels of clock genes. White and black, represent the light, dark, and light–dark transition phases, respectively. Expression of these genes was considered to display rhythmicity if it had both p < 0.05 by ANOVA and p-value < 0.3. An asterisk (*) beside the gene name indicates that the expression is daily rhythmic. ZT: Zeitgeber time.
Table 2.
Parameters defining the gene expression rhythms in skeletal muscle of crucian carp (Carassius auratus).
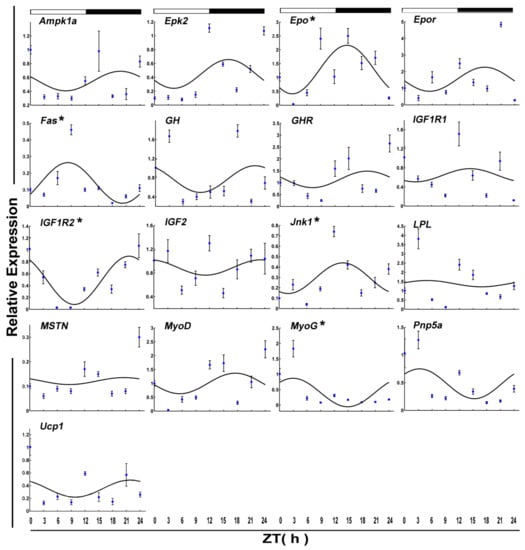
Figure 2.
Cosinor analyses of functional genes expression levels in the muscle of the crucian carp fasted for during the daily light–dark cycle. The values are mean ± SEM (n = 6) of the normalized transcript levels of each functional genes. White and black, represent the light, dark, and light–dark transition phases, respectively. Expression of these genes was considered to display rhythmicity if it had both p < 0.05 by ANOVA and p-value < 0.3. An asterisk (*) beside the gene name indicates that the expression is daily rhythmic.
3.2. Rhythmic Expression of Core Clock and Functional Genes during a Daily Cycle in the Muscle of Crucian Carp after 7-Day Fasting
After 7-day fasting, Bmal1a and Clcok in crucian carp skeletal muscle still displayed significant daily cyclic oscillations (Figure 3 and Table 2). However, its acrophase occurred at the daytime transition. Meanwhile, fasting disrupted circadian periodicity for Per1 (p-value = 0.37). And the expression of Cry3 and Per2 began to show a rhythm. Both of their acrophase reached peak phase at night.
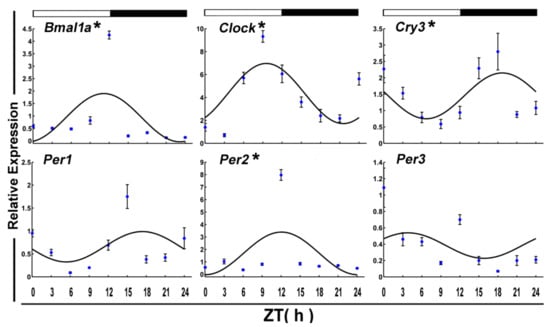
Figure 3.
Cosinor analyses of the core clock genes expression levels in the muscle of the crucian carp fasted for one week during the daily light–dark cycle. The values are mean ± SEM (n = 9) of the normalized transcript levels of each clock genes. White and black, represent the light, dark, and light–dark transition phases, respectively. Expression of these genes was considered to display rhythmicity if it had both p < 0.05 by ANOVA and p-value < 0.3. An asterisk (*) beside the gene name indicates that the expression is daily rhythmic.
The mRNA level of six functional genes in crucian carp skeletal muscle displayed circadian rhythms (Figure 4 and Table 2). Daily rhythmic expression was demonstrated by Epo (p-value = 0.10), Gh (p-value = 0.25), Igf2 (p-value = 0.17), Mstn (p-value = 0.01), Pnp5a (p-value = 0.20), and Ucp1 (p value = 0.23). But all the rhythmic functional genes (ZT = 8.15) showed an acrophase during the darktime.
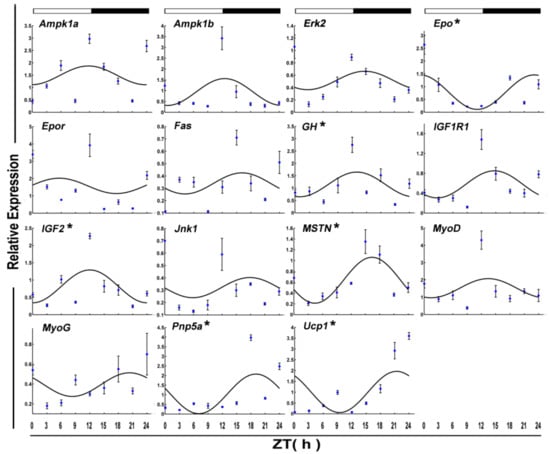
Figure 4.
Cosinor analyses of functional genes expression levels in the muscle of the crucian carp fasted for one week during the daily light–dark cycle. The values are mean ± SEM (n = 9) of the normalized transcript levels of each functional genes. White and black, represent the light, dark, and light–dark transition phases, respectively. Expression of these genes was considered to display rhythmicity if it had both p < 0.05 by ANOVA and p-value < 0.3. An asterisk (*) beside the gene name indicates that the expression is daily rhythmic.
3.3. Rhythmic Expression of Core Clock and Functional Genes during a Daily Cycle in the Muscle of Crucian Carp after 15-Day Fasting
The daily rhythms of eight clock genes transcript levels were examined by qPCR in the skeletal muscle of crucian carp fasted for 15 days during a 12:12 h light/dark cycle (Figure 5). Statistical analysis showed that mRNAs of Clock, Per1, and Per3 displayed daily rhythms and all had acrophases in the light phase (ZT = 21.80 h).
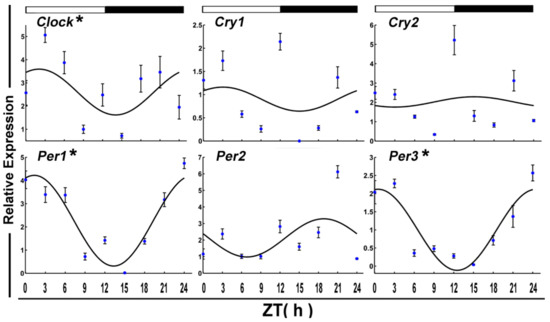
Figure 5.
Cosinor analyses of the core clock genes expression levels in the muscle of the crucian carp fasted for 15 days during the daily light–dark cycle. The values are mean ± SEM (n = 9) of the normalized transcript levels of each clock genes. White and black, represent the light, dark, and light–dark transition phases, respectively. Expression of these genes was considered to display rhythmicity if it had both p < 0.05 by ANOVA and p-value < 0.3. An asterisk (*) beside the gene name indicates that the expression is daily rhythmic.
After 15 days of starvation, Ampk1a, Lpl MyoG, Pnp5a, PPARα, and Ucp1 expressed in a circadian manner. Among these, two genes, including Lpl and MyoG, showed a daily rhythm with an acrophase during the dark phase.
3.4. Gene Correlation Analysis
The circadian rhythm expression of all genes in fed and fasted crucian carp were analyzed using the correlation test (Table 3). The transcript levels of clock and functional genes displayed intergroup and intragroup positive or negative correlations in these conditions. In the normally fed fish muscle, the components of the transcriptional activator Clock and myogenic regulatory factor MyoG showed moderate negative correlation (−0.8 < r < −0.5). In addition, significant positive correlation was found between Per1 and transcription level of Jnk1 (r = 0.89).
Table 3.
The correlation of rhythmic clock and functional genes in skeletal muscle of crucian carp (Carassius auratus).
In the seven-day fasted fish muscle, there were moderate or strong intergroup or intragroup positive and negative correlations in clock genes and functional gene pairs: Clock:Cry3 (r = −0.63), Clock:Epo (r = −0.58), Bmal1a:Per2 (r = 0.98), Bmal1a::GH2 (r = 0.86), Bmal1a:IGF2 (r = 0.88), Cry3:Epo (r = 0.62), Cry3:Mstn (r = 0.77), Per2:Gh2 (r = 0.87), and Per2: IGF2 (r = 0.88).
In the fifteen-day fasted muscle, the daily expression of 12 clock and functional genes showed either positive or negative correlations with each other. Among clock genes, only Per1 had a strong correlation with Per3 (r > 0.8) (Figure 6). Between the transcripts of rhythmicity clock genes and functional genes, there was also moderate or strong intergroup or intragroup positive and negative correlation. Per1 displayed moderate positive correlations with MyoG and Pnp5a (0.5 < r < 0.8). Also, Per3 showed moderate or positive correlations with MyoG, Pnp5a, and PPARα. Interestingly, Clock, which had a rhythm again after 15 days of starvation, showed a moderate negative correlation with Pnp5a and Ucp1.
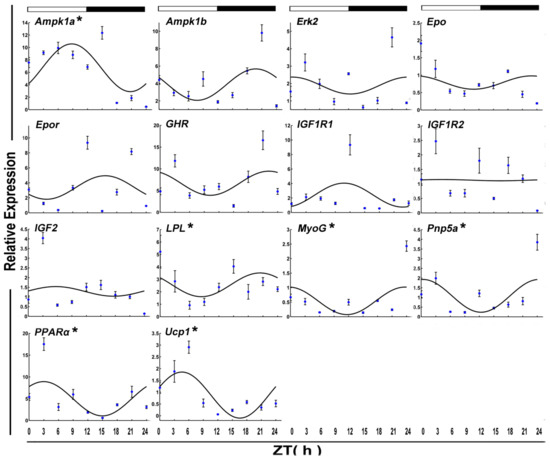
Figure 6.
Cosinor analyses of functional genes expression levels in the muscle of the crucian carp fasted for 15 days during the daily light–dark cycle. The values are mean ± SEM (n = 9) of the normalized transcript levels of each functional genes. White and black, represent the light, dark, and light–dark transition phases, respectively. Expression of these genes was considered to display rhythmicity if it had both p < 0.05 by ANOVA and p-value < 0.3. An asterisk (*) beside the gene name indicates that the expression is daily rhythmic.
3.5. Effects of Starvation on Circadian Clock and Functional Genes in Crucian Carp
The transcript of circadian clock and functional genes in muscles was comparatively analyzed upon normal feeding and fasting treatment. Apparently, two clock genes, Clock and Bmal1a, and one functional gene, Epo, were rhythmically expressed in both normally fed and 7-day fasting crucian carp skeletal muscle (Figure 7A,B). However, the acrophase of Clock and Bmal1a exhibited a left shift after 7-day fasting compared with the circadian genes in the normally fed crucian carp. In addition, one clock and four functional genes disappeared and two new clock and five functional genes appeared in the crucian carp muscle during the 7-day fasting treatment.
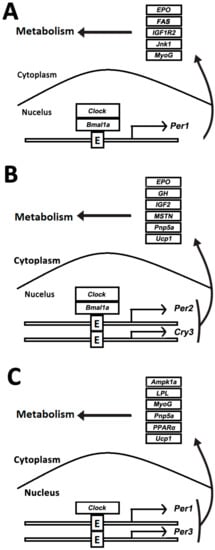
Figure 7.
Comparative analysis of rhythmic genes data. (A) Rhythmic genes in the muscle of normally fed crucian carp; (B) rhythmic genes in the muscle of crucian carp fasted for 7 days; (C) rhythmic genes in the muscle of crucian carp fasted for 15 days.
There was a significant change in gene expression in the normal feeding and starving fish after a longer period of hunger. Two clock genes Clock and Per1, both showed rhythmic expression pattern in the normally fed and 15-day fasted crucian carp (Figure 7B,C). Compared with the circadian-genes in the normal feeding crucian carp, one clock and four functional genes disappeared and one clock and five functional genes appeared in the crucian carp muscle after 15-day starvation. Obviously, the circadian profile in crucian carp muscle was altered upon food deprivation, namely, starvation.
Two functional genes (Pnp5a and Ucp1) were circadian after 7-day and 15-day fasting treatments (Figure 7A,C). However, three clock and four functional genes disappeared and two new clock and four functional genes appeared after 15-day fasting. It is interesting that only the Clock gene remained rhythmic during starvation. Meanwhile, the results showed that the expression of five genes (GH, GHR, IGF1R1, IGF1R2, and IGF2), which serve as growth hormone regulation (GH) /insulin-like growth factor (IGF) axis, increased to constant levels in the fasted fish (Figure 8).
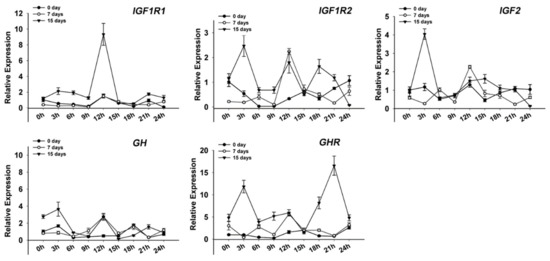
Figure 8.
Expression of five growth hormone/insulin-like growth factor (GH/IGF) axis genes (GH, GHR, IGF1R1, IGF1R2, and IGF2) in the crucian carp muscle during fed and starvation. The values are expressed as the mean ± SEM (n = 9) of the normalized transcript levels of each GH/IGF axis genes.
4. Discussion
This is the first report on the rhythmic expression of the circadian clock and functional genes in crucian carp skeletal muscle. We detected the rhythm of the eight core clock genes, namely two members of the transcriptional activator (Clock and Bmal1a) and six genes of the transcriptional repressor (Cry1, Cry2, Cry3, Per1, Per2, and Per3). We also tested the rhythm of 22 functional genes involved in sugar and lipid metabolism in normal feeding and fasting state.
In earlier reports on the Chinese perch, we identified a series of circadian clock and myogenic genes that may participate in controlling muscle biological clock system [17]. Few reports are available on changes in rhythmic expression of fish clock genes after starvation. In this study, we analyzed the positive factor Clock expression in crucian carp and showed that it maintained rhythm briefly after short-term of starvation. When the fish was starved longer its rhythm was recovered and a shift of acrophase was observed in the fasted group. This discovery is consistent with the report that the rhythmic expression of Clock in tilapia liver: expression changed with different feeding conditions [8]. In this study, Clock expression was also strongly associated with negative regulatory factor Per1 in the normally fed state. The above phenomena were also found in zebrafish and mammals [7,11]. Another positive element, Bmal1a, expressed a peak at the dark phase, which has been also observed in Atlantic cod skeletal muscle [16]. This is opposite to previous reports that Bmal1a expression showed an acrophase at the end of the light phase and the beginning of the dark phase at the normally fed condition in zebrafish, medaka, gilthead seabream, tilapia, and rainbow trout brain [8,22,23,24,25]. In addition, Bmal1 could not only participate in maintaining the circadian oscillators, but also contribute to lipid metabolism control in mammals [26,27]. In Atlantic cod liver, PPARα can combine with the Bmal1 promoter and form stable cyclic oscillations with the rhythmic expression of Bmal1 [28]. While in crucian carp skeletal muscle, this phenomenon has also been found. Only after 15 days of starvation PPARα began to be rhythmical. These suggest that the biological clock system of muscle is functioning very different from the central molecular oscillators, especially after fasting.
Previous studies of the peripheral of the vertebrate’s circadian oscillators revealed the presence of the transcription activator Clock-Bmal1, which drives the rhythmic expression of the repressor Per and Cry. Similarly, Per and Cry play an important role in photo transduction and circadian photosensitivity. This is confirmed in Drosophila, zebrafish, and mice [6,22,29]. Because of the existence of multiple copies of Per and Cry genes, the negative regulatory gene system of fish is more complex. With the change of nutrient conditions, the rhythm of the negative regulatory genes became more unstable and changeable, e.g., Per1 showed rhythmicity in normally fed and 15-day fasting conditions with different amplitude. It is noteworthy that Per1 was the only gene that had rhythms during the normally fed condition in crucian carp skeletal muscle. These patterns are similar to those reported for other Per1 genes in the zebrafish, goldfish, Chinese perch, and European sea bass [11,17,21,30]. After 7-day fasting, the daily rhythmic expression of Per2 took the place of Per1 and had a strong correlation with Bmal1a. But after longer starvation, Per1 showed a positive correlation with Per3. These results suggested that Per may interact with Cry to control the transcriptional activation and function in the circadian feedback loop. Thus, we speculated that the correlation between the negative regulatory factors Per and Cry was unstable. However, there was a positive regulatory relationship between the negative (Per and Cry) and positive regulators (Clock-Bmal1).
Most of the functional genes studied displayed temporal changes in transcript levels during the daily cycle and fasting treatment in mice muscle. As an important factor in promoting muscle growth, Igfs and Ghs have been studied and reported earlier [31,32]. In zebrafish, igf1ra, igf1rb, igfbp1a, and igfbp1b were upregulated during fasting and two Igf-binding proteins genes (Igfbp3 and Igfbp5b) were rhythmic and were conformed involvement of the clock pathway [11]. In the present study, the expression of three Igfs and two Ghs increased during the process of starvation. Even in the feeding cycle, rhythmic Igf1r2 was consistent with the expression pattern of Igfbp3 and Igfbp5b of zebrafish which had an acrophase during the dark time. In the 7 days of starvation, Bmal1a had a strong correlation with rhythmic Gh2 and Igf2. This confirmed that they were involved in the regulation of the biological clock. After 15 days of starvation, there were no Igfs and Ghs displayed significant cyclic oscillations. A plausible hypothesis is that a long-time starvation causes the fish no longer growing, and (Gh)/(Igfs) axis only maintains basic metabolism and no longer participates in the regulation of the biological clock.
The interaction between the ligands and Igf1-receptors ultimately leads to muscle growth; this also affects the expression of some genes related to myogenesis. As the member of the myogenic regulatory factors (Mrfs), MyoD and MyoG are classes of helix-loop-helix transcription factors that play a vital role in myogenesis [33]. In mice, the two polymers formed by Clock and Bmal directly act on the distal regulatory region (DRR) of the MyoD promoter. Thus, MyoD acts as a molecular link between the circadian clock system and skeletal muscle physiological activity [34]. Simultaneously, evidence has been found for circadian expression of MyoD in Chinese perch and Atlantic cod [16,17]. In contrast, we found that MyoD did not show rhythm in crucian carp skeletal muscle no matter in normal feeding or starvation. This discovery was consistent with the report in zebrafish [11]. But the expression of MyoG exhibited a circadian expression pattern peaking in phase with Clock in daily cycle during the light time and in phase with Bmal1a after 15 days of fasting during the dark period (Table 3). It could be suggested that the rhythmic expression of MyoG in crucian carp muscle parallels that described for MyoD in mouse, Chinese perch, and Atlantic cod muscle, with potential effects on the maintenance of myofibrillar structure.
This study addresses, for the first time, the activities of key functional genes related to glycolipid metabolism and their possible cross-regulation of expression of genes related to myogenesis during normal feeding and starvation in skeletal muscle. These data advance our understanding of the complex muscle regulation of circadian clock and metabolism response to feeding. This information, as an additional biological clock control system beyond the central oscillator, has potential to regulate the severity of circadian rhythm disruption and metabolic disorders.
5. Conclusions
This study investigated the impact of restricting feeding on the expression of the core circadian clock and functional genes in crucian carp skeletal muscle. The results confirmed that among the eight core clock and 22 functional genes analyzed, three core clock genes and six functional genes had daily rhythms in the muscle of normal fed crucian carp. Three core clock genes and eight functional genes showed circadian rhythms after 7-day and 15-day fasting, but the gene and rhythmic expression patterns were different. Rhythms and correlation analysis of the circadian genes and functional genes indicates that feed deprivation could alter the circadian gene components in crucian carp muscle. Therefore, this study provides a potential application on fish growth by managing feeding conditions and nutritional state.
Author Contributions
J.Z. and W.C. conceived and designed the experiments. P.W., L.B., Z.H., and Y.L. performed the experiments. P.W., L.B., R.Z., and L.L. analyzed the data. W.C., Y.W., and P.W. wrote the paper. All authors contributed to the revision of the manuscript and approved the submission.
Funding
This study was supported by the National Natural Science Foundation of China (No. 31572592 and No. 31472256), the Key Laboratory Innovation Platform Fund of Bureau of Hunan Province (15K011), and the Science and Technology Project of Changsha (K1705044 and ZD1601003).
Acknowledgments
We would like to thank the reviewers for their critical and constructive suggestions.
Ethical Approval
All experiments and animal handling were approved by the Animal Welfare and Ethics Committee, Changsha University, and conformed to the animal protection guidelines of the People’s Republic of China.
Conflicts of Interest
The authors declare no conflict of interest.
References
- Hardin, P.E.; Panda, S. Circadian timekeeping and output mechanisms in animals. Curr. Opin. Neurobiol. 2013, 23, 724–731. [Google Scholar] [CrossRef] [PubMed]
- Ferrell, J.M.; Chiang, J.Y.L. Circadian rhythms in liver metabolism and disease. Acta Pharm. Sin. B 2015, 5, 113–122. [Google Scholar] [CrossRef] [PubMed]
- Bao, L.; Wang, J.; Bin, S.; Li, Y.; Chu, W.; Zhang, J. Effects of short-term fasting on the rhythmic expression of core circadian clock and functional genes in skeletal muscle of goldfish (Carassius auratus). Comp. Biochem. Phys. B 2018, 226, 91–98. [Google Scholar] [CrossRef] [PubMed]
- Falcón, J.; Besseau, L.; Sauzet, S.; Boeuf, G. Melatonin effects on the hypothalamo-pituitary axis in fish. Trends Endocrinol. Metab. 2007, 18, 81–88. [Google Scholar] [CrossRef] [PubMed]
- Herbert, U.; Steele, C.T.; Bora, Z. Circadian organization and the role of the pineal in birds. Microsc. Res. Tech. 2001, 53, 48–62. [Google Scholar]
- Stanewsky, R. Clock mechanisms in Drosophila. Cell Tissue Res. 2002, 309, 11–26. [Google Scholar] [CrossRef] [PubMed]
- Shavlakadze, T.; Anwari, T.; Soffe, Z.; Cozens, G.; Mark, P.J.; Gondro, C.; Grounds, M.D. Impact of fasting on the rhythmic expression of myogenic and metabolic factors in skeletal muscle of adult mice. Am. J. Physiol. Cell Physiol. 2013, 305, C26–C35. [Google Scholar] [CrossRef] [PubMed]
- Costa, L.S.; Serrano, I.; Sánchez-Vázquez, F.J.; López-Olmeda, J.F. Circadian rhythms of clock gene expression in Nile tilapia (Oreochromis niloticus) central and peripheral tissues: influence of different lighting and feeding conditions. J. Comp. Physiol. B 2016, 186, 775–785. [Google Scholar] [CrossRef] [PubMed]
- Lowrey, P.L.; Takahashi, J.S. Mammalian circadian biology: Elucidating genome-wide levels of temporal organization. Ann. Rev. Genomics Hum. Genet. 2004, 5, 407–441. [Google Scholar] [CrossRef] [PubMed]
- Ripperger, J.A.; Jud, C.; Albrecht, U. The daily rhythm of mice. FEBS Lett. 2011, 585, 1384–1392. [Google Scholar] [CrossRef] [PubMed]
- Amaral, I.P.; Johnston, I.A. Circadian expression of clock and putative clock-controlled genes in skeletal muscle of the zebrafish. Am. J. Physiol. Regul. Integr. Comp. Physiol. 2012, 302, R193–R206. [Google Scholar] [CrossRef] [PubMed]
- Wang, H. Comparative analysis of teleost fish genomes reveals preservation of different ancient clock duplicates in different fishes. Mar. Genomics 2008, 1, 69–78. [Google Scholar] [CrossRef] [PubMed]
- Feliciano, A.; Vivas, Y.; Pedro, N.D.; Delgado, M.J.; Velarde, E.; Isorna, E. Feeding time synchronizes clock gene rhythmic expression in brain and liver of goldfish (Carassius auratus). J. Biol. Rhythms 2011, 26, 24–33. [Google Scholar] [CrossRef] [PubMed]
- Montoya, A.; López-Olmeda, J.F.; Garayzar, A.B.S.; Sánchez-Vázquez, F.J. Synchronization of daily rhythms of locomotor activity and plasma glucose, cortisol and thyroid hormones to feeding in Gilthead seabream (Sparus aurata) under a light–dark cycle. Physiol. Behav. 2010, 101, 101–107. [Google Scholar] [CrossRef] [PubMed]
- Martín-Robles, Á.J.; Whitmore, D.; Sánchez-Vázquez, F.J.; Pendón, C.; Muñoz-Cueto, J.A. Cloning, tissue expression pattern and daily rhythms of Period1, Period2, and Clock transcripts in the flatfish Senegalese sole, Solea senegalensis. J. Comp. Physiol. B 2012, 182, 673–685. [Google Scholar] [CrossRef] [PubMed]
- Lazado, C.C.; Kumaratunga, H.P.; Nagasawa, K.; Babiak, I.; Giannetto, A.; Fernandes, J.M. Daily rhythmicity of clock gene transcripts in atlantic cod fast skeletal muscle. PloS ONE 2014, 9, e99172. [Google Scholar] [CrossRef] [PubMed]
- Wu, P.; Li, Y.L.; Cheng, J.; Chen, L.; Zhu, X.; Feng, Z.G.; Zhang, J.S.; Chu, W.Y. Daily rhythmicity of clock gene transcript levels in fast and slow muscle fibers from Chinese perch (Siniperca chuatsi). BMC Genomics 2016, 17, 1008. [Google Scholar] [CrossRef] [PubMed]
- Pozo, A.D.; Vera, L.M.; Sánchez, J.A. Molecular cloning, tissue distribution and daily expression of cry1 and cry2 clock genes in European seabass (Dicentrarchus labrax). Comp. Biochem. Physiol. A Mol. Integr. Physiol. 2012, 163, 364–371. [Google Scholar] [CrossRef] [PubMed]
- Delgado, M.J.; Alonso-Gómez, A.L.; Gancedo, B.; De, P.N.; Valenciano, A.I.; Alonso-Bedate, M. Serotonin n-acetyltransferase (nat) activity and melatonin levels in the frog retina are not correlated during the seasonal cycle. Gen. Comp. Endocrinol. 1993, 92, 143–150. [Google Scholar] [CrossRef] [PubMed]
- Vivienroels, B.; Arendt, J.; Bradtke, J. Circadian and circannual fluctuations of pineal indoleamines (serotonin and melatonin) in Testudo hermanni gmelin (Reptilia, Chelonia): I. Under natural conditions of photoperiod and temperature. Gen. Comp. Endocrinol. 1979, 37, 197–210. [Google Scholar] [CrossRef]
- Velarde, E.; Haque, R.; Iuvone, P.M.; Azpeleta, C.; Alonso-Gómez, A.L.; Delgado, M.J. Circadian clock genes of goldfish, Carassius auratus: cDNA cloning and rhythmic expression of Period and Cryptochrome transcripts in retina, liver, and gut. J. Biol. Rhythms 2009, 24, 104–113. [Google Scholar] [CrossRef] [PubMed]
- Cahill, G.M. Clock mechanisms in zebrafish. Cell Tissue Res. 2002, 309, 27–34. [Google Scholar] [CrossRef] [PubMed]
- Patiño, M.A.L.; Rodríguez-Illamola, A.; Conde-Sieira, M.; Soengas, J.L.; Míguez, J.M. Daily Rhythmic Expression Patterns of Clock1a, Bmal1, and Per1 Genes in Retina and Hypothalamus of the Rainbow Trout, Oncorhynchus mykiss. Chronobiol. Int. 2011, 28, 381–389. [Google Scholar] [CrossRef] [PubMed]
- Vera, L.M.; Negrini, P.; Zagatti, C.; Frigato, E.; Sánchez-Vázquez, F.J.; Bertolucci, C. Light and feeding entrainment of the molecular circadian clock in a marine teleost (Sparus aurata). Chronobiol. Int. 2013, 30, 649–661. [Google Scholar] [CrossRef] [PubMed]
- Cuesta, I.H.; Lahiri, K.; López-Olmeda, J.F.; Loosli, F.; Foulkes, N.S.; Vallone, D. Differential maturation of rhythmic clock gene expression during early development in medaka (Oryzias latipes). Chronobiol. Int. 2014, 31, 468–478. [Google Scholar] [CrossRef] [PubMed]
- Schmutz, I.; Albrecht, U.; Ripperger, J.A. The role of clock genes and rhythmicity in the liver. Mol. Cell. Endocrinol. 2012, 349, 38–44. [Google Scholar] [CrossRef] [PubMed]
- Rey, G.; Cesbron, F.; Rougemont, J.; Reinke, H.; Brunner, M.; Naef, F. Genome-Wide and Phase-Specific DNA-Binding Rhythms of BMAL1 Control Circadian Output Functions in Mouse Liver. PLoS Biol. 2011, 9, e1000595. [Google Scholar] [CrossRef] [PubMed]
- Canaple, L.; Rambaud, J.; Dkhissibenyahya, O.; Rayet, B.; Tan, N.S.; Michalik, L.; Delaunay, F.; Wahli, W.; Laudet, V. Reciprocal regulation of brain and muscle Arnt-like protein 1 and peroxisome proliferator-activated receptor αdefines a novel positive feedback loop in the rodent liver circadian clock. Mol. Endocrinol. 2006, 20, 1715–1727. [Google Scholar] [CrossRef] [PubMed]
- Hirota, T.; Fukada, Y. Resetting Mechanism of Central and Peripheral Circadian Clocks in Mammals. Zoolog. Sci. 2004, 21, 359–368. [Google Scholar] [CrossRef] [PubMed]
- Sánchez, J.A.; Madrid, J.A.; Sánchez-Vázquez, F.J. Molecular cloning, tissue distribution, and daily rhythms of expression of per1 gene in European sea bass (Dicentrarchus labrax). Chronobiol. Int. 2010, 27, 19–33. [Google Scholar] [CrossRef] [PubMed]
- Castillo, J.; Le, B.P.; Paboeuf, G.; Navarro, I.; Weil, C.; Fauconneau, B.; Gutiérrez, J. IGF-I binding in primary culture of muscle cells of rainbow trout: changes during in vitro development. Am. J. Physiol. Regul. Integr. Comp. Physiol. 2002, 283, R647–R652. [Google Scholar] [CrossRef] [PubMed]
- Zhong, H.; Li, J.; Zhou, Y.; Li, H.; Tang, Y.; Yu, J.; Yu, F. A transcriptome resource for common carp after growth hormone stimulation. Mar. Genomics 2016, 25, 25–27. [Google Scholar] [CrossRef] [PubMed]
- Zhu, X.; Li, Y.L.; Liu, L.; Wang, J.H.; Li, H.H.; Wu, P.; Chu, W.Y.; Zhang, J.S. Molecular characterization of Myf5 and comparative expression patterns of myogenic regulatory factors in Siniperca chuatsi. Gene Expr. Patterns 2016, 20, 1–10. [Google Scholar] [CrossRef] [PubMed]
- Andrews, J.L.; Zhang, X.; Mccarthy, J.J.; Mcdearmon, E.L.; Hornberger, T.A.; Russell, B.; Campbell, K.S.; Arbogast, S.; Reid, M.B.; Walker, J.R. CLOCK and BMAL1 regulate MyoD and are necessary for maintenance of skeletal muscle phenotype and function. Proc. Natl. Acad. Sci. USA 2010, 107, 19090–19095. [Google Scholar] [CrossRef] [PubMed]
© 2018 by the authors. Licensee MDPI, Basel, Switzerland. This article is an open access article distributed under the terms and conditions of the Creative Commons Attribution (CC BY) license (http://creativecommons.org/licenses/by/4.0/).