Case Study of Sequence Capture Enrichment Technology: Identification of Variation Underpinning Developmental Syndromes in an Amniote Model


Abstract
:
1. Introduction
- 1a.
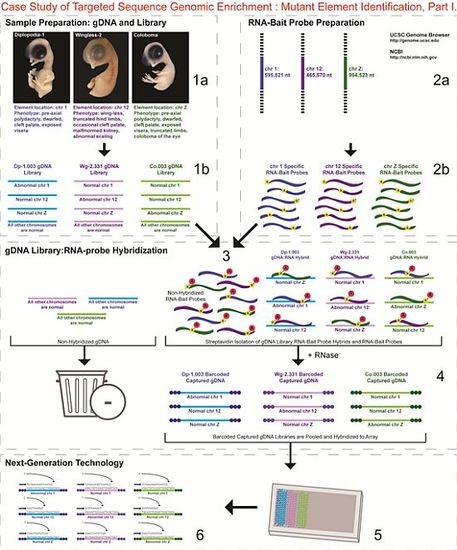
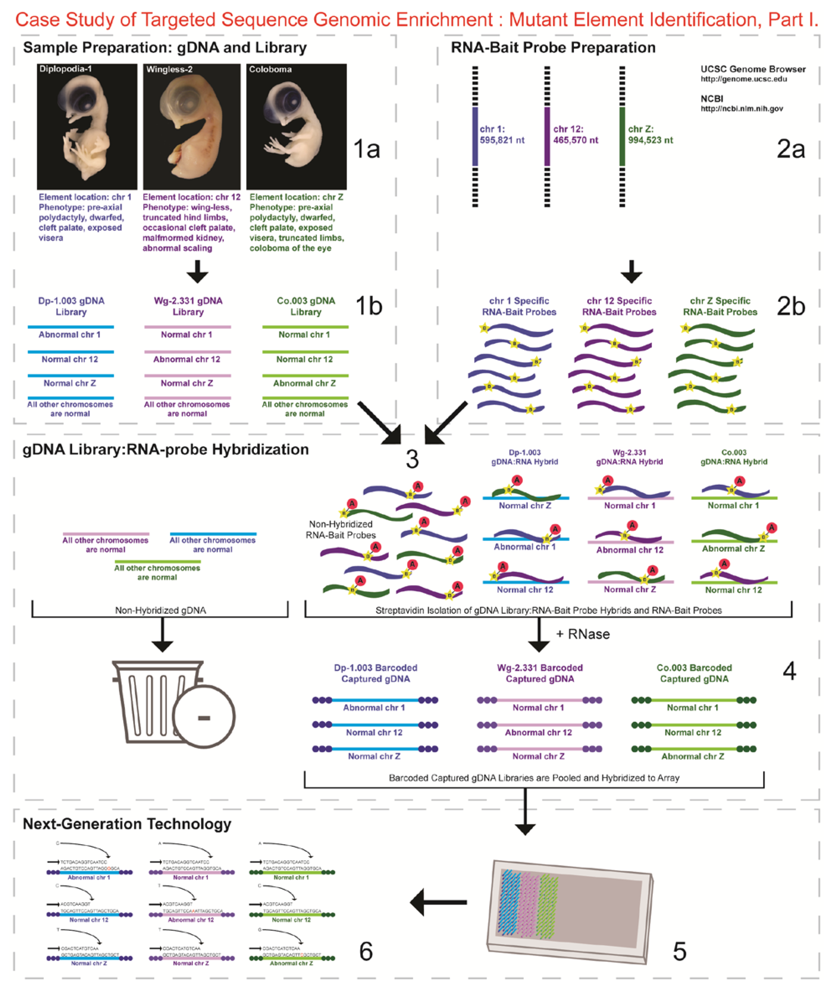
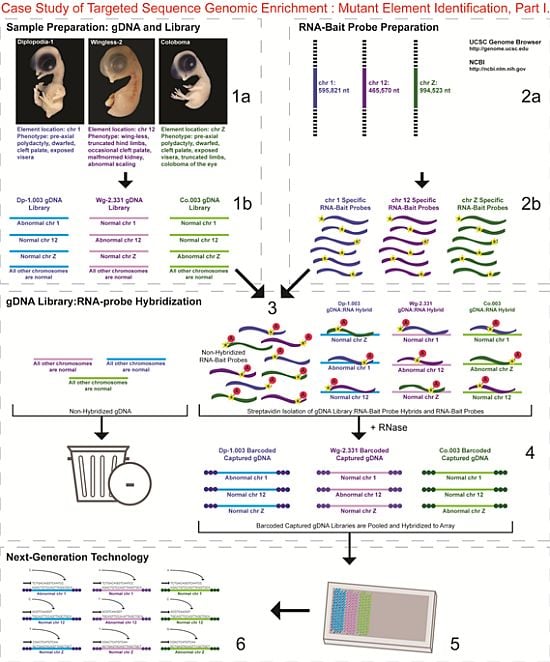
- Identified regions for targeted sequence capture enrichment. The linked/causative regions were previously identified using SNP arrays [1]. High quality, high molecular weight genomic (g) DNA was isolated from specific samples of interest (Agilent SureSelect kit suggestions: 10–20 μg of purified, non-amplified gDNA per sample with concentrations between 100–1,000 ng/μL, A260/A280 ratio >1.8). The samples were assessed for quality (e.g., spectrophotometric analysis, agarose gel quality control). The quality of the gDNA and library (e.g., library size distribution and concentration) generated will have an impact on the quality of the sequence results.
- 1b.
- Prepared genomic libraries. Three individual libraries were generated from gDNA isolated from three developmental mutant congenic lines using Agilent’s SureSelect Target Enrichment System. The following steps were taken in the preparation of each individual mutant library: (i) shear DNA to obtain fragments with a base pair peak of 150 to 200; (ii) blunt-end fragments with 5′-phosphorylated ends; (iii) attach a dATP to the 3′ end of the DNA fragments. After dATP nucleotides are added to the 3′ end of the DNA fragments; (iv) adaptors (specific to the sequencing platform) are ligated to the 3′ dATP overhang; (v) a library pre-enrichment amplification followed by (vi) a library quality control and quantitation assessment with a Bioanalyzer and PicoGreen assay. Please note that a purification procedure occurs in between each of the library preparation steps (i–vi). If the initial or enriched template library contains low amounts of nucleic acid, one can amplify the library before sequencing using PCR and a polymerase that is not biased as to template size. One can outsource any of the subsequent steps or perform them in the research laboratory.
- 2a.
- Designed overlapping RNA-bait probes (120 nt in length) for sequencing for the region of interest. Sequence information for chromosomes 1 and 12 was obtained from NCBI (WASHUC2, May 2006 [2]) while red jungle fowl, UCD-001 (reference genome genetic line), sequence data for chromosome Z was obtained from Dr. D. Winston Bellott and Dr. David Page prior to NCBI submission [9]. We provided SeqWright Inc., with coordinate information or sequence content to design and create the RNA-bait probes that complemented the three targeted chromosomal regions of interest.
- 2b.
- Generated overlapping biotinylated RNA-bait probes specific to each region of interest. RNA library “baits” were generated for bead capture purposes (step 3).
- 3.
- Hybridized denatured gDNA library fragments (150–200 nt) to RNA-bait probes (120 nt). RNA-baits were hybridized to gDNA in order to enrich for complimentary DNA sequence information specific to the three regions of interest. Streptavidin coated magnetic beads were utilized to capture RNA-bait:gDNA-library fragment hybrids as a means to separate those DNA fragments not complementary to the targeted regions. Beads were washed and digested (RNased) to isolate only gDNA library fragments that hybridized to RNA-bait probes.
- 4.
- Barcoded samples (pooled or individual). In order to identify each individual or group, samples were barcoded (a.k.a. index-tagged). In the case of this project, Co.003 gDNA (2 pooled female mutants), Dp-1.003 (2 pooled female mutants), and Wg-2.331 (2 pooled female mutants), each had an individual barcode unique to the genetic line. [Prior to sequence read alignment and bioinformatic analysis, the barcoded sequencing reads were first sorted and the barcode was then removed.]
- 5.
- Pooled barcoded samples, hybridized sequences to array, and amplified DNA prior to sequencing. All three genetic lines were pooled into one sample with each barcoded sample present in equimolar amounts. Pooled, barcoded libraries (single-stranded) were hybridized to an array (in the case of this project, we used one-fourth of a slide) utilizing the adaptors (see step iv in 1b) previously incorporated at the end of the DNA sequence. Unlabeled nucleotides and enzyme were added to initiate solid-phase bridge amplification (this generates double-stranded bridge molecules), DNA was then denatured, and amplification to generate sequence clusters proceeded.
- 6.
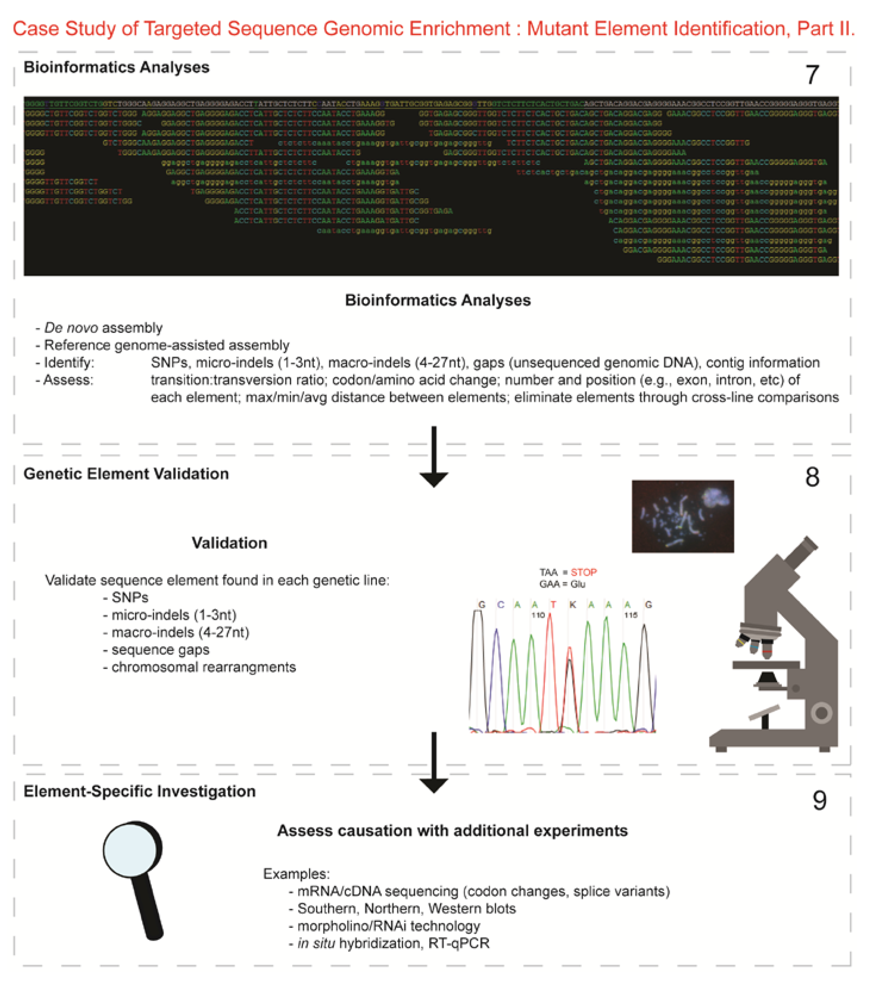
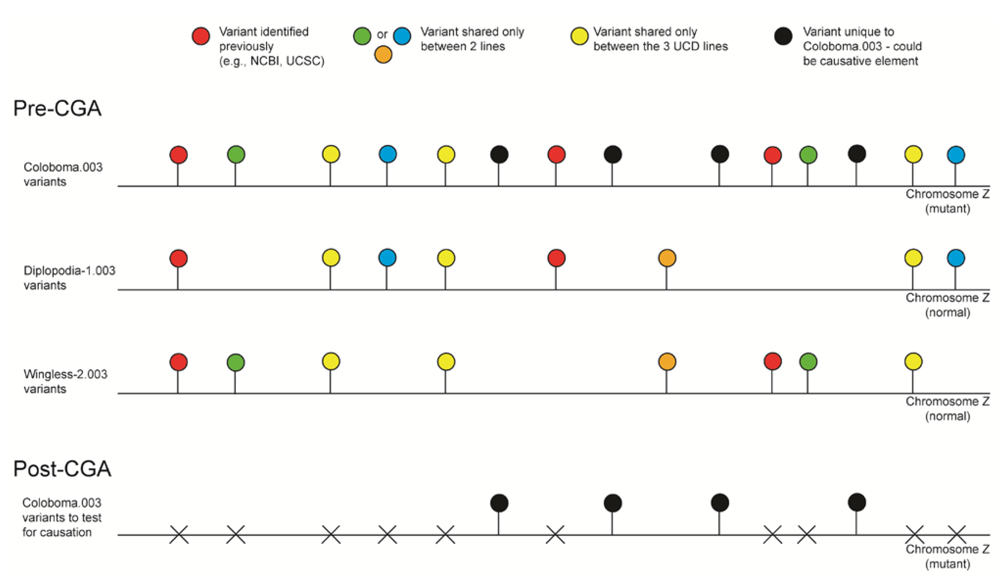
- Next-generation sequencing. Labeled dNTP reversible terminators (one base at a time), primers and DNA polymerase were added to the slide and sequenced using laser excitation. This step was repeated until each barcoded DNA fragment was sequenced. For this project, SOLiD™ version 3-Plus using 50 ligation cycles (50 base pair sequencing) was employed. A total of 3.64 Gbp of sequence data was generated.Figure 2. Targeted Sequence Genomic Enrichment Methodology, Part II. Analysis of the targeted genomic capture enrichment and next-generation sequencing data allowed for the identification of variants and chromosomal rearrangements which were further validated using new mutant samples in order to identify the causative element for each of the developmental mutations. Approximate timeline from obtaining the raw SOLiD™ (colorspace) sequence reads to validating the sequence variants identified (steps 7–8) was 6 months.Figure 2. Targeted Sequence Genomic Enrichment Methodology, Part II. Analysis of the targeted genomic capture enrichment and next-generation sequencing data allowed for the identification of variants and chromosomal rearrangements which were further validated using new mutant samples in order to identify the causative element for each of the developmental mutations. Approximate timeline from obtaining the raw SOLiD™ (colorspace) sequence reads to validating the sequence variants identified (steps 7–8) was 6 months.
![]()
- 7.
- Bioinformatics. We received colorspace reads and quality value files (both in FASTA-like formats) from SeqWright, Inc. SNPs, micro-indels (1–3 nt), macro-indels (4–27 nt) and gaps were identified for each of the three genetic lines. Several reference-assisted de novo assemblies were generated using Mauve 2.3.1c software [10] in order to identify chromosomal rearrangements. Additional variant analyses included, but were not limited to, identification of: transition:transversion ratios, codon and amino acid modifications due to presence of the element under study, number of each element and maximum/minimum/average distance between variants, as well as position within the genome (e.g., exon, intron, splice site, etc.).
- 8.
- Validated genetic elements. Variations were assessed for linkage to the mutant and to evaluate the contribution of the polymorphisms to the mutant phenotype and/or genetic line using a new cohort of individuals (n ≥ 20) [11].
- 9.
- Element-specific investigation. Each genetic element must be further assessed to discover causation towards the phenotype. Examples of additional assays include: mRNA/cDNA sequencing (codon/amino acid modifications, splice variants), Southern, northern, western blots, morpholino/RNAi, in situ hybridization, RT-qPCR, and/or chromatin studies.
2. Results and Discussion

| Genetic Lines | Total Sequenced Region | |||||
|---|---|---|---|---|---|---|
| Chr | Size (nt) | No. Genes | No. Gaps A | NCBI Mean Quality Score | GC richness | |
| Diplopodia-1.003 | 1 | 595,821 | 19 | 5 | 87.3% | 39.6% |
| Wingless-2.331 | 12 | 465,570 | 13 | 15 | 94.5% | 41.7% |
| Coloboma.003 | Z | 994,523 | 6 | 0 | 94.5% | 39.4% |
| Total | - | 2,055,914 | 38 | 20 | - | - |
| Average | - | 685,305 | 12.7 | 7 | 92.1% | 40.2% |
2.1. Three Region (2.06 Mb) Sequencing and Mapping
2.2. Analysis of Three Congenic Developmental Mutant Genomes
| Genetic Lines | Sequencing Read Statistics | Region Reduction (Post-Analysis) | ||||||
|---|---|---|---|---|---|---|---|---|
| Total Reads Generated A | Total Mapped Reads B | Average Coverage C | Region Sequenced D | No. Coverage Gaps E | Remaining Size (nt) | Fold Reduction | No. Genes Remaining | |
| Diplopodia-1.003 | 21.0M | 15.5M | 107.2× | 96.9% | 232 | 261,947 | 2.3× | 12 |
| Wingless-2.331 | 36.0M | 28.3M | 217.1× | 85.3% | 274 | 259,545 | 1.8× | 13 |
| Coloboma.003 | 15.7M | 11.9M | 72.1× | 98.4% | 525 | 306,847 | 1.3× | 5 |
| Total | 72.7M | 55.7M | - | - | 1,031 | 828,339 | - | 30 |
| Average | 24.2M | 18.6M | 132.1× | 93.5% | 344 | 276,113 | 1.8× | 10 |
| Chr | # of SNPs in Sequenced Region | # of Short Indels (1–23 nt) in Sequenced (2.06 Mb) Region | |||||||
|---|---|---|---|---|---|---|---|---|---|
| Dp-1.003 | Wg-2.331 | Co.003 | Dp-1.003 | Wg-2.331 | Co.003 | ||||
| Insertions | Deletions | Insertions | Deletions | Insertions | Deletions | ||||
| 1 | 2,593 | 2,434 | 2,478 | 150 | 133 | 116 | 130 | 109 | 110 |
| 12 | 1,245 | 1,724 | 1,225 | 79 | 101 | 108 | 138 | 71 | 93 |
| Z | 2,903 | 1,787 | 2,500 | 128 | 171 | 150 | 185 | 125 | 155 |

2.3. Reference-Assisted De Novo Assembly
3. Experimental Section
3.1. Genetic Lines
3.2. Sample Collection, Capture Array Sample Preparation, and SOLiD ™ Sequencing
3.3. Sequence Assembly
3.4. Reference-Assisted De Novo Assembly
3.5. SNP, Micro- and Macro-Indel, and Sequence Gap Discovery
3.6. Capture Enrichment Data Analyses
4. Conclusions
Acknowledgments
References
- Robb, E.A.; Gitter, C.L.; Cheng, H.H.; Delany, M.E. Chromosomal mapping and candidate gene discovery of chicken developmental mutants and genome-wide variation analysis of MHC concgenics. J. Hered. 2011, 102, 141–156. [Google Scholar]
- International Chicken Genome Sequencing Consortium (ICGSC). Sequence and comparative analysis of the chicken genome provide unique perspectives on vertebrate evolution. Nature 2004, 432, 695–716. [CrossRef]
- Dodgson, J.B.; Cheng, H.H.; Warren, W.C.; Zimin, A.V. Proposal to Enhance the Sequence of the Chicken Genome—2010 Whitepaper. Available online: http://poultry.mph.msu.edu/about/Chicken_Genome%20supplemental%20sequencing.pdf (accessed on 5 October 2011).
- UCSC Genome Bioinformatics Homepage. Available online: http://genome.ucsc.edu (accessed on 13 March 2012).
- Pisenti, J.M.; Delany, M.E.; Taylor, R.L.; Abbott, U.K.; Abplanalp, H.; Arthur, J.A.; Bakst, M.R.; Baxter-Jones, C.; Bitgood, F.A.; Bradley, K.M.; et al. Avian Genetic Resources at RISK. An Assessment and Proposal for Conservation of Genetic Stocks in the USA and Canada; Report No. 20; University of California Division of Agriculture and Natural Resources, Genetic Resources Conservation Program: Davis, CA, USA, 1999. Available online: http://grcp.ucdavis.edu/publications/index.htm (accessed on 6 March 2012).
- Delany, M.E. Genetic variants for chick biology research: From breeds to mutants. Mech. Dev. 2004, 121, 1169–1177. [Google Scholar]
- Robb, E.A.; Delany, M.E. The expression of pre-axial polydactyly is influenced by modifying genetic elements and is not maintained by chromosomal inversion in an avian biomedical model. Cytogenet. Genome Res. 2012, 136, 50–68. [Google Scholar]
- Gitter, C.L. Genetic Mapping of Seven Developmental Mutations Found in the Domestic Chicken (Gallus gallus) by Analysis of Single Nucleotide Polymorphisms.
- Bellott, D.W.; Skaletsky, H.; Pyntikova, T.; Mardis, E.R.; Graves, T.; Kremitzki, C.; Brown, L.G.; Rozen, S.; Warren, W.C.; Wilson, R.K.; et al. Convergent evolution of chicken Z and human X chromosomes by expansion and gene acquisition. Nature 2010, 466, 612–616. [Google Scholar]
- Darling, A.C.E.; Mau, B.; Blattner, F.R.; Perna, N.T. Mauve: Multiple alignment of conserved genomic sequence with rearrangements. Genome Res. 2004, 14, 1394–1403. [Google Scholar]
- Robb, E.A.; Delany, M.E. Developmental Syndromes in the Chicken Biomedical Model: The Hunt for Causative Elements using Next-Generation Sequencing; Fine-Mapping; and Gene Expression Techniques. In Proceedings of the 61st Annual American Society of Human Genetics (ASHG) and 12th International Congress of Human Genetics (ICHG) Joint Meeting, Montreal, Canada, 11–15 October 2011.
- Mardis, E.R. Next-generation DNA sequencing methods. Annu. Rev. Genomics Hum. Genet. 2008, 9, 387–402. [Google Scholar]
- Schuster, S.C. Next-generation sequencing transforms today’s biology. Nat. Methods 2008, 5, 16–18. [Google Scholar]
- Wheeler, D.A.; Srinivasan, M.; Egholm, M.; Shen, Y.; Chen, L.; McGuire, A.; He, W.; Chen, Y.J.; Makhijani, V.; Roth, G.T.; et al. The complete genome of an individual by massively parallel DNA sequencing. Nature 2008, 452, 872–876. [Google Scholar]
- D’Ascenzo, M.; Meacham, C.; Kitzman, J.; Middle, C.; Knight, J.; Winer, R.; Kukricar, M.; Richmond, T.; Albert, T.J.; Czechanski, A.; et al. Mutation discovery in the mouse using genetically guided array capture and re-sequencing. Mamm. Genome 2009, 20, 424–436. [Google Scholar] [CrossRef]
- Ng, S.B.; Turner, E.H.; Robertson, P.D.; Flygare, S.D.; Bigham, A.W.; Lee, C.; Shaffer, T.; Wong, M.; Bhattacharjee, A.; Eichler, E.E.; Bamshad, M.; Nickerson, D.A.; Shendure, J. Targeted capture and massively parallel sequencing of 12 human exomes. Nature 2009, 461, 272–276. [Google Scholar]
- Durbin, R.M.; Abecasis, G.R.; Altshuler, D.L.; Auton, A.; Brooks, L.D.; Gibbs, R.A.; Hurles, M.E.; McVean, G.A. A map of human genome variation from population-scale sequencing. Nature 2010, 467, 1061–1073. [Google Scholar]
- Metzker, M.L. Sequencing technologies—The next generation. Nat. Rev. Genet. 2010, 11, 31–46. [Google Scholar]
- Cosart, T.; Beja-Pereira, A.; Chen, S.; Ng, S.B.; Shendure, J.; Luikart, G. Exome-wide DNA capture and next generation sequencing in domestic and wild species. BMC Genomics 2011, 12. [Google Scholar]
- Kuchtey, J.; Olson, L.M.; Rinkoski, T.; MacKay, E.O.; Iverson, T.M.; Gelatt, K.N.; Haines, J.L.; Kuchtey, R.W. Mapping of the disease locus and identification of ADAMTS10 as a candidate gene in a canine model of primary open angle glaucoma. PLoS Genet. 2011, 7. [Google Scholar]
- BGI Americas Homepage. Available online: http://bgiamericas.com/ (accessed on 13 March 2012).
- Chakravarti, A. Genomic contributions to Mendelian disease. Genome Res. 2011, 21, 643–644. [Google Scholar]
- Abplanalp, H. Inbred lines as genetic resources of chickens. Poult. Sci. Rev. 1992, 4, 29–39. [Google Scholar]
- National Center for Biotechnology Information (NCBI) Homepage. Available online: http://www.ncbi.nlm.nih.gov/ (accessed on 13 March 2012).
- National Center for Biotechnology Information (NCBI) Gallus gallus ftp (genome sequence) download site. Available online: ftp://ftp.ncbi.nih.gov/genomes/Gallus_gallus/ (accessed on 13 March 2012).
- Langmead, B.; Trapnell, C.; Pop, M.; Salzberg, S.L. Ultrafast and memory efficient alignment of short DNA sequences to the human genome. Genome Biol. 2009, 10. [Google Scholar]
- Li, H.; Handsaker, B.; Wysoker, A.; Fennell, T.; Ruan, J.; Homer, N.; Marth, G.; Abecasis, G.; Durbin, R. 1000 Genome Project Data Processing Subgroup. The sequence alignment/map format and SAMtools. Bioinformatics 2009, 25, 2078–2079. [Google Scholar] [CrossRef]
- University of California Davis (UCD) Bioinformatics Core Homepage. Available online: http://bioinformatics.ucdavis.edu/ (accessed on 13 March 2012).
- Li, H.; Durbin, R. Fast and accurate short read alignment with Burrows–Wheeler transform. Bioinformatics 2009, 25, 1754–1760. [Google Scholar]
- Burrows-Wheeler Aligner (BWA) Homepage. Available online: http://bio-bwa.sourceforge.net/ (accessed on 13 March 2012).
- SAMtools Homepage. Available online: http://samtools.sourceforge.net/ (accessed on 13 March 2012).
- Quinlan, A.R.; Hall, I.M. BEDTools: A flexible suite of utilities for comparing genomic features. Bioinformatics 2010, 26, 841–842. [Google Scholar]
- BEDtools Homepage. Available online: http://code.google.com/p/bedtools/ (accessed on 13 March 2012).
- Wang, J.; He, X.; Ruan, J.; Dai, M.; Chen, J.; Zhang, Y.; Hu, Y.; Ye, C.; Li, S.; Cong, L.; Fang, L.; Liu, B.; Li, S.; Wang, J.; Burt, D.W.; Wong, G.K.; Yu, J.; Yang, H.; Wang, J. ChickVD: A sequence variation database for the chicken genome. Nucleic Acids Res. 2005, 33, 438–441. [Google Scholar]
Supplementary Files
© 2012 by the authors; licensee MDPI, Basel, Switzerland. This article is an open access article distributed under the terms and conditions of the Creative Commons Attribution license (http://creativecommons.org/licenses/by/3.0/).
Share and Cite
Robb, E.A.; Delany, M.E. Case Study of Sequence Capture Enrichment Technology: Identification of Variation Underpinning Developmental Syndromes in an Amniote Model. Genes 2012, 3, 233-247. https://doi.org/10.3390/genes3020233
Robb EA, Delany ME. Case Study of Sequence Capture Enrichment Technology: Identification of Variation Underpinning Developmental Syndromes in an Amniote Model. Genes. 2012; 3(2):233-247. https://doi.org/10.3390/genes3020233
Chicago/Turabian StyleRobb, Elizabeth A., and Mary E. Delany. 2012. "Case Study of Sequence Capture Enrichment Technology: Identification of Variation Underpinning Developmental Syndromes in an Amniote Model" Genes 3, no. 2: 233-247. https://doi.org/10.3390/genes3020233
APA StyleRobb, E. A., & Delany, M. E. (2012). Case Study of Sequence Capture Enrichment Technology: Identification of Variation Underpinning Developmental Syndromes in an Amniote Model. Genes, 3(2), 233-247. https://doi.org/10.3390/genes3020233