Abstract
Background/Objectives: Detecting high-order epistatic interactions in genome-wide association studies (GWAS) is essential for understanding complex diseases, yet most existing approaches are limited to pairwise interactions. We propose GPBSO (Gene Pool-Based Brain Storm Optimization for Epistasis Detection), a novel stochastic framework that integrates Brain Storm Optimization with a dynamic gene pool to efficiently explore high-order SNP combinations. Methods: Epistasis is evaluated using the k2 Bayesian network scoring criterion and the G-test, with iterative updates to the gene matrix enhancing search diversity. Results: Comparative experiments on simulated datasets generated from five epistatic models demonstrated that GPBSO consistently outperformed a set of well-established methods—DECMDR, SNPHarvester, AntEpiSeeker, HS-MMGKG, and SEE—in terms of F-measure and statistical power, particularly for third-order interactions. Conclusions: GPBSO provides an effective and scalable approach for detecting high-order epistatic interactions, offering methodological advancements for genetic epidemiology and complex disease analysis.
1. Introduction
With the rapid advancement of extremely high-capacity sequencing technologies, researchers can now readily examine vast numbers of SNP markers—often reaching into the hundreds of thousands—within datasets containing thousands of participants [1,2]. Against this backdrop, genome-wide association studies (GWAS) [3,4,5,6,7,8] have emerged as the principal paradigm for dissecting the genetic architecture of common, polygenic disorders. These investigations seek to uncover statistical dependencies between allelic variation and disease status by systematically interrogating dense SNP panels in large case–control cohorts. Contemporary GWAS datasets typically encompass thousands of phenotypically ascertained subjects and upwards of 1 × 10⁵–1 × 10⁶ genotyped variants, and have already yielded an extensive catalogue of phenotype-associated loci [9,10,11,12,13,14].
Nevertheless, the etiological interpretation of complex traits necessitates an explicit consideration of non-additive, genome-wide epistatic interactions. Epistasis-defined as the context-dependent effect of one locus contingent upon the allelic state of another [15,16,17,18,19,20]—is increasingly recognized as a pivotal component of genetic architecture. Under this model, individual susceptibility alleles exert negligible marginal effects, yet collectively generate pronounced phenotypic perturbations via synergistic or antagonistic interactions. Consequently, exhaustive detection of such combinatorial effects is indispensable, but introduces formidable computational complexity due to the exponential expansion of the multi-locus search space.
Over the past decade, a diverse portfolio of computational strategies has been introduced to systematically uncover epistatic interactions [21,22,23,24,25,26,27,28,29,30]. Among these, Multifactor Dimensionality Reduction (MDR) [21] pioneered a non-parametric combinatorial framework that collapses high-dimensional genotype profiles into discrete risk classes, thereby facilitating the detection of multilocus associations. Its original formulation, however, exhibits quadratic complexity in the number of single-nucleotide polymorphisms (SNPs), restricting its applicability to datasets comprising only tens of variants.
To mitigate this scalability bottleneck, DECMDR [22] hybridises Classification-based MDR (CMDR) with Differential Evolution (DE), employing CMDR-derived classification accuracy as the fitness landscape upon which DE navigates large-scale GWAS data. Stochastic search has been further advanced by SNPHarvester [24], which leverages probabilistic pruning to discard loci unlikely to participate in epistatic effects, thereby dramatically compressing the search space.
Multi-objective optimisation paradigms have also gained prominence. MACOED [25] integrates mutually complementary objective functions derived from logistic regression and Bayesian network scoring within a memory-enhanced Ant Colony Optimisation (ACO) [28] architecture, enabling simultaneous maximisation of predictive power and model parsimony. AntEpiSeeker [26] adopts a dual-stage ACO procedure: an initial coarse-grained exploration of moderately sized SNP subsets followed by an exhaustive examination of the most pheromone-enriched loci. Harmony-search-based HS-MMGKG [29] expands the objective space to five criteria, while SEE [30] implements an eight-objective evolutionary algorithm—four conventional association metrics augmented by four measures quantifying the marginal contribution of each SNP within a candidate combination.
Despite these algorithmic advances, prevailing approaches exhibit several persistent limitations. Most methods mandate an a priori specification of interaction order, struggle to maintain an optimal balance between stochastic exploration and population diversity, and lack unified, high-resolution evaluation criteria capable of rigorously quantifying the biological significance of detected epistatic effects.
Herein, we present GPBSO—Gene Pool-Based Brain Storm Optimization—a new swarm-intelligence algorithm devised for the systematic discovery of epistatic interactions. Distinct from prevailing approaches, GPBSO integrates automatic estimation of the maximum interaction order, the exploratory power of a dynamically maintained gene pool, and the balance between global and local search achieved by the Brain Storm Optimization framework. In addition, GPBSO combines Bayesian network scoring with statistical validation to ensure robust detection of epistatic interactions across multiple orders. These innovations collectively make GPBSO a scalable and reliable tool for dissecting the polygenic architecture of complex traits.
To thoroughly evaluate the effectiveness of GPBSO, we employed both synthetic and real-world GWAS datasets. The synthetic datasets were generated using EpiGEN [31], a simulation tool that produces genotype data with realistic genetic characteristics, including deviations from Hardy–Weinberg equilibrium, linkage disequilibrium patterns, and user-specified minor allele frequencies. Five distinct epistatic interaction models—joint-recessive, joint-dominant, modular, diagonal, and XOR. These datasets enabled a systematic evaluation of GPBSO’s performance, which was benchmarked against five existing epistasis detection methods [22,24,26,29,30].
Subsequently, GPBSO was deployed on the Wellcome Trust Case Control Consortium (WTCCC) GWAS dataset [32]. The algorithm recovered epistatic networks encompassing a broad spectrum of interaction orders. A subset of implicated genes—TSBP1, TSBP1-AS1, DAB1, OMA1, STK32A-AS1, LRIG1, LOC105376945, BTNL2, SPATA5, and LOC105370777—exhibited corroborative evidence in the Comparative Toxicogenomics Database (CTD) [33]. Visualization of SNP-level and gene-level interaction networks revealed previously uncharacterized loci that may contribute to the etiology of the seven complex diseases investigated by the WTCCC. Collectively, these findings establish GPBSO as a robust and scalable approach for dissecting the polygenic architecture of common human diseases.
2. Materials and Methods
When faced with a difficult problem that no single individual can solve, bringing together a group of people—especially those with diverse backgrounds—for brainstorming often leads to a high probability of finding a solution. Human interaction and collaboration can generate remarkable and unexpected intelligence. One effective way to facilitate such interaction and cooperation for generating innovative ideas is to organize a brainstorming session. This concept led to the invention of Brain Storm Optimization (BSO) [34]. Since its inception, the BSO algorithm has garnered significant attention in the field of swarm intelligence research.
The Gene Pool-based Brain Storm Optimization (GPBSO) algorithm is an improved method based on BSO, designed to detect complex epistatic interactions in Genome-Wide Association Studies (GWAS) data. GPBSO enhances the search process by emulating the collaborative and ideation dynamics characteristic of human brainstorming, while simultaneously employing a dynamic gene pool management strategy. Initially, the gene pool is defined as the complete set of SNPs not yet incorporated into the existing population. As the algorithm progresses, this pool is adaptively modified: when a newly generated individual is admitted into the population, its constituent SNPs are excluded from the gene pool; conversely, when an individual is eliminated due to suboptimal fitness, its SNPs are returned to the pool. This continuous update mechanism ensures that the gene pool remains representative of the SNPs available for future selection, thereby sustaining population diversity and maintaining an effective balance between exploration and exploitation. The structural overview and procedural workflow of GPBSO are illustrated in Figure 1, with detailed explanations of each component presented in the subsequent sections.
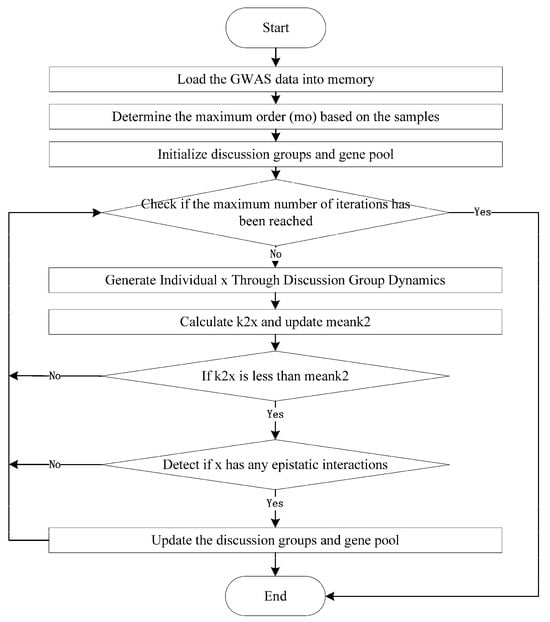
Figure 1.
The Pseudo Code of GPBSO Algorithm.
2.1. Load the Gwas Data into Memory
To enhance computational efficiency and minimize memory overhead, the algorithm utilizes a binary-based data storage and processing strategy, analogous to the method implemented in BOOST. Given a dataset comprising N genetic loci, along with C0 control samples and C1 case samples, the genotype information is organized into two distinct data structures: healthy_data and disease_data, corresponding to the control and case groups, respectively. The healthy_data structure is defined as an array of length N, where each entry healthy_data[loc] (with loc in the range [0, N)) is a vector consisting of three components representing the encoded genotype counts or distributions for the respective locus. Each component is a binary array of length C0, representing the genotype distribution of the loc-th gene locus in the healthy group. Specifically, healthy_data[loc][type][sample] (sample ∈ [0, C0)) takes a value of 1 or 0, indicating whether the genotype of the sample-th healthy sample at the loc-th locus matches the type-th possible genotype. The disease_data array follows the same structure as healthy_data. By using only 3 bits per gene locus and sample to store genotype information, the algorithm significantly reduces memory usage. For example, if each gene locus has two possible genotypes (0 or 1) and the dataset contains 8 disease samples and 8 healthy samples, a statistical table for gene locus combinations is constructed through binary operations, which is then used to calculate relevant statistical metrics. The binary operations on genotype data significantly reduce computational complexity, with a time complexity of O(S × L × 3L), where L is the number of gene loci in the combination and S is the total number of samples. Despite the seemingly high complexity, binary logic-based operations ensure efficient execution. Previous studies, such as HS-MMGKG [29], SEE [30], and BOOST [35], have demonstrated that this storage structure and binary operations can significantly improve computational performance.
2.2. Determine the Maximum Order (mo) Based on the Samples
GPBSO does not require a preset interaction order. Instead, it determines the maximum order (mo) based on the GWAS sample size. The maximum interaction order mo is estimated based on the smaller of the case or control sample sizes. This estimation involves computing the natural logarithm of the smaller sample size, subtracting 0.5, and then rounding the result down to the nearest integer. While a larger mo enables the algorithm to investigate more complex epistatic interactions, setting mo too high may result in excessively sparse contingency tables, thereby compromising the reliability of the k2 statistic. To ensure analytical stability, the algorithm is designed such that each cell in the contingency table contains approximately three samples, with the final mo value adjusted accordingly through rounding.
2.3. Initialize Discussion Groups and Gene Pool
The initialization of discussion groups and the gene pool constitutes a critical component of the GPBSO algorithm, directly influencing its operational efficiency and optimization capability. At the initial stage, the algorithm employs the k-means++ clustering method to partition the population into multiple discussion groups. Each group represents a localized region within the solution space and comprises individuals with similar genetic characteristics. This grouping mechanism emulates the collaborative nature of brainstorming sessions, fostering inter-group diversity and intra-group cohesion. Such a structure not only facilitates organized generation of new individuals in subsequent phases but also reinforces the algorithm’s capacity to navigate and exploit the solution space effectively.
Simultaneously, the gene pool module is systematically constructed to complement this framework. It is initialized as the set of all candidate SNPs that are not currently present in any individual within the population. Thus, the gene pool serves as a dynamic repository of unused genetic elements, ensuring access to a wide range of variation during the search process. As the algorithm progresses, the gene pool is continuously updated in real time. When a newly generated individual is successfully incorporated into the population, its constituent SNPs are removed from the gene pool to prevent repeated usage of the same genetic components, thereby enhancing population diversity and encouraging exploration of unexplored regions in the search space. Conversely, if an individual is removed due to inferior fitness, its SNPs are restored to the gene pool, ensuring that potentially useful genetic material remains accessible.
The coordinated implementation of discussion group formation and dynamic gene pool management enables GPBSO to maintain a robust balance between exploration and exploitation. This balance is essential for mitigating the risk of premature convergence and promoting an efficient, non-redundant search process. Collectively, the design and integration of these two modules represent key innovations in the algorithm, substantially contributing to its overall performance and effectiveness in identifying epistatic interactions. The operational structure of the gene pool module is depicted in Figure 2.
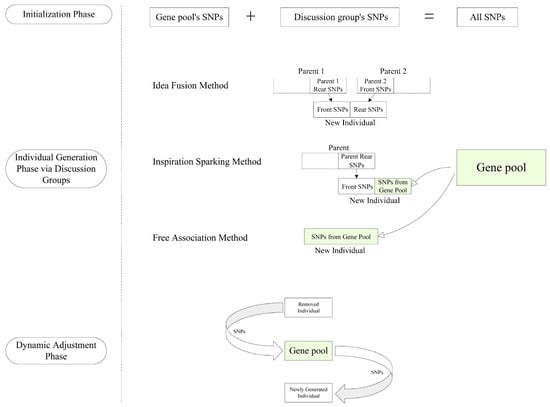
Figure 2.
Dynamic Flow Diagram of the Gene Pool.
2.4. Generate Individual X Through Discussion Group Dynamics
The individual generation algorithm in the GPBSO algorithm embodies the core principles of the framework, which dynamically balances the exploitation of promising ideas and the exploration of new ones by simulating brainstorming sessions. Utilizing three distinct methods, the algorithm mimics the collaborative and innovative nature of brainstorming, leveraging the collective intelligence of “discussion groups” and the untapped potential within the gene pool.
In the Idea Fusion Method, a top-performing discussion group is selected to refine existing ideas. Two high-ranking individuals (ideas) from this group are chosen, and their genetic material is combined—taking the first half of the SNPs from one and the second half from the other. This reflects the brainstorming process where participants merge the best aspects of existing ideas to create a stronger, more refined solution. This strategy enables the algorithm to intensify its search within promising regions of the solution space, leveraging the advantages of previously validated solutions.
Within the Inspiration Sparking Method, the process of partially reimagining an idea based on external stimuli is emulated. Specifically, a high-fitness individual selected from a designated discussion group undergoes targeted modification, wherein the second half of its SNP sequence is substituted with novel SNPs sampled from the gene pool. This mechanism introduces controlled variability while preserving the core attributes of the original solution, thereby achieving a balance between exploiting established knowledge and exploring new combinatorial possibilities.
The Free Association Method reflects the brainstorming principle of unconstrained ideation by generating entirely novel individuals. In this approach, a new candidate is constructed solely from the gene pool by randomly selecting a fixed number of SNPs. This encourages the incorporation of original and independent genetic combinations into the population, thereby enhancing solution diversity and reducing the risk of premature convergence to local optima.
Collectively, these three generation strategies embody the fundamental tenets of brainstorming—structured synthesis, adaptive transformation, and radical innovation. The Idea Fusion Method facilitates refinement through recombination of existing individuals, the Inspiration Sparking Method promotes guided creativity via selective alteration, and the Free Association Method ensures exploratory breadth through the introduction of wholly new genetic material. The interplay of these mechanisms enables the algorithm to thoroughly and adaptively traverse the search space, enhancing its ability to identify intricate patterns of SNP epistasis. The coordinated function of discussion groups and the dynamically managed gene pool further contributes to the algorithm’s capacity to balance intensification and diversification during the search process.
2.5. Identifying Epistasis Within SNP Combinations Through the k2 Metric
The k2 score, which is commonly used in Bayesian network modeling, serves as a quantitative indicator for detecting epistatic associations. Its formal definition is shown in Equation (1).
In Equation (2), the k2 statistic quantifies the degree of association between phenotype traits and a group of SNP interactions. S refers to a specific combination of SNPs, and Y represents the phenotype under investigation. The set C contains all possible genotype configurations for S—for instance, if there is one SNP, then C includes three such patterns. For each genotype c in C, the term mc,* captures the total number of samples exhibiting that genotype. More specifically, mc,0 and mc,1 refer to the number of control and case samples, respectively, for genotype c.
The k2(Y, S) score quantifies the goodness-of-fit of a Bayesian network with phenotype Y and SNP set S. Lower scores denote sparser, more accurate models and thus stronger associations. Iteratively withholding each SNP x ∈ S and re-evaluating k2(Y, S{x}) reveals the variable’s contribution: removal of an uninformative SNP tightens the model and lowers the score, whereas excising a relevant or epistatic SNP inflates it. GPBSO exploits this sensitivity by systematically pruning SNPs until no deletion further reduces k2(Y, S). If the final retained subset exceeds two members, it is declared an epistatic interaction (Algorithm 1).
| Algorithm 1 Identify Epistatic Interactions Using k2 Metric | |
| Require: Maximum order mo; SNP combination x with mo SNPs generated by GPBSO; k2x as the k2 score of x | |
| Ensure: Epistatic interaction of order within [2, mo) or no result | |
| 1: | Set l = mo |
| 2: | while l > 1 do |
| 3: | foundImprovement = false |
| 4: | for each SNP index i in [0, l) do |
| 5: | Create a new SNP combination xx of length l - 1 by excluding x[i] |
| 6: | Compute k2xx as the k2 score for xx |
| 7: | if k2xx < k2x then |
| 8: | Update x to xx |
| 9: | Update k2x to k2xx |
| 10: | Decrement l by 1 |
| 11: | Set foundImprovement = true |
| 12: | Exit the loop |
| 13: | end if |
| 14: | end for |
| 15: | if not foundImprovement then |
| 16: | Exit the loop |
| 17: | end if |
| 18: | end while |
| 19: | if l > 1 then |
| 20: | return x as the detected epistatic interaction |
| 21: | end if |
2.6. Evaluating the Significance of Interaction Effects with the G-Test
Within the GPBSO framework, epistatic relationships are evaluated and categorized as either statistically relevant or not. As illustrated in Algorithm 1 the algorithm can uncover a large number of such interactions. This section outlines how GPBSO determines statistical significance, using the G-test as its core evaluation method. The G-test [36], grounded in likelihood ratios and maximum likelihood estimation, is widely used for hypothesis testing. Under the assumption of no association with the phenotype, the G-statistic approximately follows a chi-squared distribution, which supports its suitability for detecting true epistatic signals. In our analysis, the G-test p-value (denoted as g) [30] is used to evaluate significance. The equation used to compute g is presented in Equation (2) on the following page. An interaction is marked as significant when g falls below a user-defined threshold, in which case it is included in the final output file.
In Equation (2), the statistical significance of the relationship between a given phenotype and a specific set of SNPs is measured using the G-test. This evaluation is carried out under the likelihood-ratio framework, and its test statistic approximately follows a chi-squared distribution. All possible genotype configurations for the chosen SNP set are considered. For example, if the set contains l SNPs, there will be 3l potential genotype patterns.
Here, m refers to the total number of samples. For a particular genotype c in C, mc,0 and mc,1 indicate the number of control and case samples, respectively. The total number of individuals with genotype c is given by mc,* Across all genotype combinations, m*,0 and m*,1 represent the total number of control and case samples in the entire dataset. Finally, min g(Y; E) corresponds to the smallest p-value among the SNPs in S.
2.7. Parameter Settings and Practical Guidance
The performance of GPBSO depends on three key parameters: the population size (PopSize), the maximum number of generations (maxGen), and the maximum interaction order (mo). In all experiments, mo was estimated automatically from the sample size as described in Section 2. By contrast, PopSize and maxGen are user-specified and should be chosen according to dataset size, targeted interaction order, and available compute. Across our simulated scenarios, PopSize ranged from 50–200, while maxGen had no prescribed minimum and was set by the user; in practice, values between 106 and 8 × 10⁷ worked well for the scales studied. For the WTCCC analyses, we adopted automatic order inference (o = −1), maxGen = 8 × 10⁷, and a fixed random seed (0). These settings provided a practical balance between runtime and detection power.
For practical applications, we recommend setting PopSize = 50–200. Smaller datasets (<500 SNPs) can be analyzed with PopSize = 50–100 and a modest maxGen (often around 106–107, but smaller values are permissible if convergence is adequate), whereas larger panels (>10,000 SNPs) benefit from PopSize = 150–200 and larger maxGen (up to 8 × 10⁷ in our experiments). When compute is limited, first cap mo at 2–3 and/or reduce PopSize, then increase maxGen gradually until performance metrics (e.g., F-measure/power) stabilize across independent runs. To enhance usability and reproducibility for other researchers, we provide the parameter settings of the algorithms in Supplementary Table S2.
3. Results
3.1. Performance Assessment Using Simulated Genotype Data
There are a number of challenges related to generating simulated epistasis datasets. From a biological perspective, in real genetic environments, alleles tend to only partially conform to Hardy–Weinberg Equilibrium, which is influenced by the Minor Allele Frequency (MAF), and are locally constrained by linkage disequilibrium structures. Ultimately, any interaction that contributes to the causation of a phenotype may explain only part of the trait’s heritability, leaving a substantial portion unaccounted for. Additional practical challenges involve runtime, computational efficiency, and scalability. To systematically evaluate the performance of GPBSO and competing algorithms on these simulated datasets, we employed two commonly used metrics: F-measure, defined as the harmonic mean of precision and recall, and Power, defined as the probability of correctly identifying true epistatic interactions.
To address these complexities, we employed EpiGEN to generate simulation datasets that reflect realistic genetic properties. EpiGEN was used to generate a corpus of synthetic genetic data based on 2000 samples modeled on Chromosome 22. Several models were constructed based on potential epistatic interactions described by Evans et al. [37], including joint-recessive, joint-dominant, modular, diagonal, and XOR interaction types (Table 1). These models were achieved by adjusting the case–control ratios of the involved genotypes to modify penetrance. The penetrance table for third-order interactions is provided in Supplementary Table S1. Exploratory data analysis was used to identify a range of ratios that distinguished the performance of the evaluated tools. To increase feature complexity, up to 500 noise loci were added, and the Minor Allele Frequencies (MAFs) were constrained between 0.05 and 0.5. Each dataset was targeted to include 1000 cases and 1000 controls, although the actual counts varied slightly to accommodate modeling requirements.

Table 1.
EpiGEN Penetrance models with capital genotypes as the major allele.
We constructed three types of simulation scenarios: (1) second-order interactions among 100 SNPs, (2) second-order interactions among 1000 SNPs, and (3) third-order interactions among 100 SNPs. In the third-order interaction scenario, the 100 loci included 3 interacting loci and 97 noise loci. For each scenario, ten independent datasets were generated for each of the five epistatic interaction models, resulting in a total of 150 simulated datasets.
Using these datasets, we systematically evaluated the performance of GPBSO and benchmarked it against five existing methods [22,24,26,29,30], under all three simulation scenarios. All six software tools and their parameter configurations are summarized in Supplementary Table S2. Among them, DECMDR, HS-MMGKG, and SEE are capable of detecting epistatic interactions of any order, whereas SNPHarvester and AntEpiSeeker are limited to second-order interactions. Notably, AntEpiSeeker failed to process third-order interactions due to a segment fault.
To visually illustrate the detection performance of each method, Figure 3 presents six labeled panels (a–f), showing the distributions of F-measure and power for three simulation scenarios: 2nd-order epistasis with 100 SNPs (a,b), 2nd-order epistasis with 1000 SNPs (c,d), and 3rd-order epistasis with 100 SNPs (e,f). Panels (a–d) compare GPBSO with five existing algorithms, resulting in six boxplots per panel, while panels (e,f) compare GPBSO with three algorithms, resulting in four boxplots per panel. Each panel summarizes results aggregated across five distinct epistatic interaction models, each based on ten independently generated datasets. Detailed per-model results are provided in Supplementary Tables S3–S5. Overall, GPBSO achieves superior performance compared with competing methods across different simulation settings.
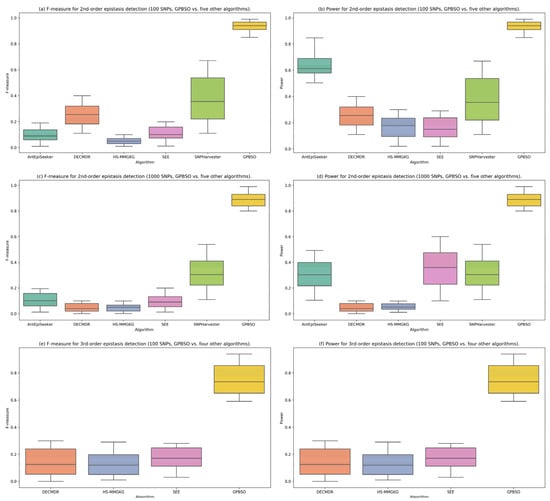
Figure 3.
Comparative performance of GPBSO and existing methods on simulated datasets. Panels (a–d) show the distributions of F-measure and power for 2nd-order epistasis with 100 and 1000 SNPs (GPBSO vs. five other algorithms, six boxplots per panel). Panels (e,f) present the results for 3rd-order epistasis with 100 SNPs (GPBSO vs. three other algorithms, four boxplots per panel). Each panel summarizes results aggregated across five distinct epistatic interaction models, each based on ten independently generated datasets. These results demonstrate that GPBSO consistently outperforms competing methods in both F-measure and power.
3.2. Computational Cost Analysis
To further evaluate the efficiency of GPBSO, we compared its computational cost with that of competing algorithms under the same experimental environment. Table 2 summarizes the average runtime (in minutes) across datasets of varying SNP sizes. The results indicate that GPBSO requires more time than filtering-based approaches such as SNPHarvester, but achieves comparable or lower runtime than other swarm intelligence and evolutionary algorithms, while maintaining superior detection power. These findings demonstrate that GPBSO strikes a balance between efficiency and accuracy, and that its runtime remains practical for both simulated and real GWAS datasets.
Table 2.
Average runtime (in minutes) of GPBSO and competing algorithms under different simulated dataset sizes.
3.3. Validation on Authentic GWAS Datasets
Real-data validation used the Wellcome Trust Case Control Consortium (WTCCC) resource: 14,000 patients across seven complex diseases and 3000 shared controls. The disorders are bipolar disorder, coronary artery disease, Crohn’s disease, hypertension, rheumatoid arthritis, type 1 diabetes, and type 2 diabetes, each represented by about 2000 cases. All samples were genotyped for approximately 500,000 SNPs. Following WTCCC quality-control guidelines, we removed low-quality SNPs and samples and excluded monomorphic loci, yielding seven independent case–control GWAS datasets; details are in Supplementary Table S6.
Building on the favorable outcomes observed in the simulation phase, we extended GPBSO to the seven WTCCC GWAS datasets. Runs were configured with automatic order inference (o = −1), a generation cap of 8 × 10⁷, a fixed random seed (0), and all remaining parameters at their defaults. Representative epistatic interactions are reported in Table 3; the full compilation is provided as Supplementary Table S7.
Table 3.
Representative epistatic interactions identified by GPBSO across seven WTCCC GWAS datasets (complete list in Supplementary Table S7).
Leveraging annotations from the NCBI database of genetic variation (dbSNP) [38], each associated SNP was mapped to its corresponding gene(s). Gene and gene-pair frequencies were subsequently tallied and are displayed in Table 4 and Table 5, respectively. Entities exhibiting elevated occurrence counts are highlighted as candidate drivers of disease susceptibility. To further evaluate the biological relevance of these candidates, the implicated genes were cross-referenced against the Comparative Toxicogenomics Database (CTD), which provides curated evidence linking genes to human diseases. Several of the top-ranked genes, such as DAB1, BTNL2, and LRIG1, are documented in CTD as being associated with neurological, immune, or proliferative disorders, consistent with their potential roles in the diseases analyzed here. Others, labeled as “NF” (Not Found), represent novel candidates whose biological functions remain to be clarified in future studies. This cross-validation using CTD adds external support to our findings and enhances their biological interpretability.
Table 4.
Subset of gene pairs involved in epistatic interactions identified by GPBSO across seven WTCCC GWAS datasets (complete list in Supplementary Table S8).
Table 5.
Representative genes participating in epistatic interactions detected by GPBSO across seven WTCCC GWAS datasets (complete list in Supplementary Table S9).
To visualize the resulting interaction landscapes, Cytoscape v3.6.0, an open-source platform for biological network visualization [39], was employed to construct disease-specific SNP-level and gene-level networks. Illustrative examples for Bipolar Disorder are provided in Figure 4 and Figure 5; analogous networks for the remaining six diseases are available in Supplementary Figures S1–S12.
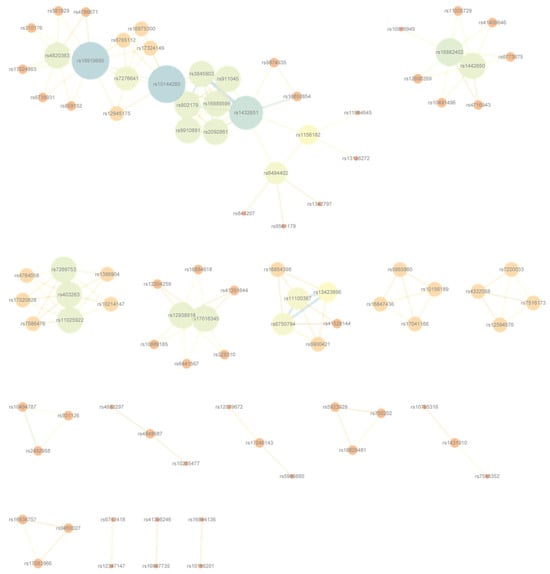
Figure 4.
SNP-level interaction network for Bipolar Disorder, constructed from high-confidence SNP pairs with the lowest G-test p-values after frequency filtering. Corresponding networks for the remaining six diseases are presented in Supplementary Figures S1–S6.
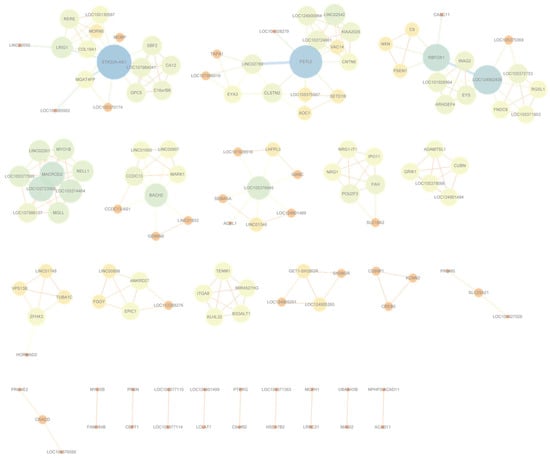
Figure 5.
Gene-level interaction network for Bipolar Disorder, constructed from high-confidence gene pairs with the highest co-occurrence frequency after frequency filtering. The corresponding networks for the remaining six diseases can be found in Supplementary Figures S7–S12.
4. Discussion
This study evaluated GPBSO for detecting epistatic interactions in GWAS data using both simulated and real datasets. In real GWAS analyses of seven complex diseases, GPBSO identified numerous significant SNP–SNP and gene–gene interactions, many consistent with known biology, supporting the method’s practical utility. Although GPBSO’s computational cost is higher than purely filtering-based methods, its superior performance in detecting higher-order interactions compensates for this limitation. Functional validation remains necessary to confirm the causal roles of detected interactions. In addition to rediscovering known disease-associated loci, GPBSO also revealed several novel candidate genes, including LRIG1, OMA1, and SPATA5. Prior studies suggest that LRIG1 is involved in cell proliferation and immune signaling [40,41], OMA1 contributes to mitochondrial homeostasis [42,43], and SPATA5 is linked to mitochondrial dynamics. These functional insights provide biological plausibility for the novel signals detected by GPBSO, thereby strengthening the interpretability of the real-data application.
Although GPBSO involves several tunable parameters, the provided guidelines can assist researchers in selecting appropriate values according to dataset size and available computational resources, thereby improving reproducibility and usability for other researchers. Future work will focus on developing adaptive strategies for automatic parameter tuning, further optimizing computational efficiency, and integrating biological prior knowledge to enhance interpretability and scalability.
Compared with existing approaches, GPBSO demonstrates several distinctive advantages. First, it eliminates the need for manual specification of interaction order by automatically estimating the maximum order (mo) from the dataset, thereby supporting a comprehensive and scalable search. Second, the Brain Storm Optimization framework enables a robust balance between exploration and exploitation, which helps maintain population diversity and reduces the risk of premature convergence. Third, the incorporation of a dynamically replenished gene pool broadens the search space, enhances heterogeneity, and reduces selection bias in SNP sampling. Finally, the integration of the Bayesian K2 score with the G-test ensures statistically rigorous evaluation of candidate interactions across all orders. Together, these features distinguish GPBSO from other epistasis detection algorithms and account for its superior performance on both simulated and real GWAS datasets.
5. Conclusions
In conclusion, our extensive experiments demonstrate that GPBSO is a powerful and practical algorithm for detecting epistatic interactions in GWAS data, with particular strength in uncovering higher-order interactions. Applied to seven real GWAS datasets of complex diseases, GPBSO successfully identified numerous biologically meaningful SNP–SNP and gene–gene interactions, and constructed interaction networks that highlight potential candidate genes for further study. These results not only validate the effectiveness of GPBSO but also provide valuable insights into the genetic architecture of complex diseases. Future work will focus on further improving computational efficiency and integrating functional validation to enhance biological interpretability.
6. Patents
This research resulted in a patent entitled “Method for Detecting SNP Epistasis Based on Brain Storm Optimization Algorithm” (China Patent No. CN202410995721.4, filed 24 July 2024, granted 17 September 2024).
Supplementary Materials
The following supporting information can be downloaded at: https://www.mdpi.com/article/10.3390/genes16091114/s1, Table S1: EpiGEN penetrance models with capital genotypes as the major allele; Table S2: Parameter settings of GPBSO and five benchmark algorithms under the three simulation scenarios; Table S3: Detailed results for the 2nd-order epistasis dataset with 100 SNPs; Table S4: Detailed results for the 2nd-order epistasis dataset with 1000 SNPs; Table S5: Detailed results for the 3rd-order epistasis dataset with 100 SNPs; Table S6: Brief description of the WTCCC GWAS datasets; Table S7: Representative epistatic interactions identified by GPBSO across seven WTCCC GWAS datasets; Table S8: Subset of gene pairs involved in epistatic interactions identified by GPBSO across seven WTCCC GWAS datasets; Table S9: Representative genes participating in epistatic interactions detected by GPBSO across seven WTCCC GWAS datasets. Figure S1. SNP-level interaction networks for six WTCCC diseases Coronary Artery Disease, constructed from high-confidence SNP pairs with the lowest G-test p-values after frequency filtering. Figure S2. SNP-level interaction networks for six WTCCC diseases Crohn’s Disease, constructed from high-confidence SNP pairs with the lowest G-test p-values after frequency filtering. Figure S3. SNP-level interaction networks for six WTCCC diseases Hypertension, constructed from high-confidence SNP pairs with the lowest G-test p-values after frequency filtering. Figure S4. SNP-level interaction networks for six WTCCC diseases Rheumatoid Arthritis, constructed from high-confidence SNP pairs with the lowest G-test p-values after frequency filtering. Figure S5. SNP-level interaction networks for six WTCCC diseases Type 1 Diabetes, constructed from high-confidence SNP pairs with the lowest G-test p-values after frequency filtering. Figure S6. SNP-level interaction networks for six WTCCC diseases Type 2 Diabetes, constructed from high-confidence SNP pairs with the lowest G-test p-values after frequency filtering. Figure S7. Gene-level interaction networks for the same six WTCCC diseases Coronary Artery Disease, constructed from high-confidence gene pairs with the highest co-occurrence frequency after frequency filtering. Figure S8. Gene-level interaction networks for the same six WTCCC diseases Crohn’s Dis-ease, constructed from high-confidence gene pairs with the highest co-occurrence frequency after frequency filtering. Figure S9. Gene-level interaction networks for the same six WTCCC diseases Hypertension, constructed from high-confidence gene pairs with the highest co-occurrence frequency after frequency filtering. Figure S10. Gene-level interaction networks for the same six WTCCC Rheumatoid Arthritis, constructed from high-confidence gene pairs with the highest co-occurrence frequency after frequency filtering. Figure S11. Gene-level interaction networks for the same six WTCCC diseases Type 1 Diabetes, constructed from high-confidence gene pairs with the highest co-occurrence frequency after frequency filtering. Figure S12. Gene-level interaction networks for the same six WTCCC diseases Type 2 Diabetes, constructed from high-confidence gene pairs with the highest co-occurrence frequency after frequency filtering.
Author Contributions
All authors contributed equally to this work: L.S. designed the experiments; Y.X. performed the experiments; S.Q. analyzed the data; L.J. and L.Z. wrote the manuscript. All authors have read and agreed to the published version of the manuscript.
Funding
This work was supported in part by the Changchun University level scientific research project—Growth Climbing Plan: No. 2021JBD05L12.
Data Availability Statement
Using the predefined penetrance tables, EpiGEN generated all three simulated datasets. The simulation datasets used in this study are available from the corresponding author upon reasonable request. For data used for the real data application in this project. Access to the WTCCC data can be requested from the owners via the following links: https://www.wtccc.org.uk/info/access_to_data_samples.html (access on 31 August 2025).
Acknowledgments
We extend our gratitude to the College of Computer Science and Technology at Changchun University for providing server support.
Conflicts of Interest
The authors declare no conflicts of interest. The funders had no role in the design of the study; in the collection, analyses, or interpretation of data; in the writing of the manuscript; or in the decision to publish the results.
References
- Collins, A.; Lonjou, C.; Morton, N.E. Genetic epidemiology of single-nucleotide polymorphisms. Proc. Natl. Acad. Sci. USA 1999, 96, 15173–15177. [Google Scholar] [CrossRef] [PubMed]
- Schork, N.J.; Fallin, D.; Lanchbury, J.S. Single nucleotide polymorphisms and the future of genetic epidemiology. Clin. Genet. 2000, 58, 250–264. [Google Scholar] [CrossRef] [PubMed]
- Chen, F.; Chen, G.K.; Stram, D.O.; Millikan, R.C.; Ambrosone, C.B.; John, E.M.; Bernstein, L.; Zheng, W.; Palmer, J.R.; Hu, J.J.; et al. A genome-wide association study of breast cancer in women of African ancestry. Hum. Genet. 2013, 132, 39–48. [Google Scholar] [CrossRef] [PubMed]
- Pulit, S.L.; Stoneman, C.; Morris, A.P.; Wood, A.R.; Glastonbury, C.A.; Tyrrell, J.; Yang, J.; Ferreira, T.; Marouli, E.; Ji, Y.; et al. Meta-analysis of genome-wide association studies for body fat distribution in 694,649 individuals of European ancestry. Hum. Mol. Genet. 2019, 28, 166–174. [Google Scholar] [CrossRef]
- Yengo, L.; Sidorenko, J.; Kemper, K.E.; Zheng, Z.; Wood, A.R.; Weedon, M.N.; Frayling, T.M.; Hirschhorn, J.; Yang, J.; Visscher, P.M. Meta-analysis of genome-wide association studies for height and body mass index in ~700,000 individuals of European ancestry. Hum. Mol. Genet. 2018, 27, 3641–3649. [Google Scholar] [CrossRef]
- Elliott, L.T.; Sharp, K.; Alfaro-Almagro, F.; Shi, S.; Miller, K.L.; Douaud, G.; Marchini, J.; Smith, S.M. Genome-wide association studies of brain imaging phenotypes in UK Biobank. Nature 2018, 562, 210–216. [Google Scholar] [CrossRef]
- Hirschhorn, J.N.; Daly, M.J. Genome-wide association studies for common diseases and complex traits. Nat. Rev. Genet. 2005, 6, 95–108. [Google Scholar] [CrossRef]
- Erdmann, J.; Kessler, T.; Venegas, L.M.; Schunkert, H. A decade of genome-wide association studies for coronary artery disease: The challenges ahead. Cardiovasc. Res. 2018, 114, 1241–1257. [Google Scholar] [CrossRef]
- Misra, R.; Arebi, N. Re: Genome-wide association study identifies African-specific susceptibility loci in African Americans with inflammatory bowel disease. Gastroenterology 2017, 152, 2082–2083. [Google Scholar] [CrossRef]
- Chang, D. A meta-analysis of genome-wide association studies identifies 17 new Parkinson’s disease risk loci. Nat. Genet. 2017, 49, 1511–1516. [Google Scholar] [CrossRef]
- Fejerman, L.; Ahmadiyeh, N.; Hu, D.; Huntsman, S.; Beckman, K.B.; Caswell, J.L.; Tsung, K.; John, E.M.; Torres-Mejia, G. Genome-wide association study of breast cancer in Latinas identifies novel protective variants on 6q25. Nat. Commun. 2014, 5, 5260. [Google Scholar] [CrossRef] [PubMed]
- Maguire, L.H.; Handelman, S.K.; Du, X.; Chen, Y.; Pers, T.H.; Speliotes, E.K. Genome-wide association analyses identify 39 new susceptibility loci for diverticular disease. Nat. Genet. 2018, 50, 1359–1365. [Google Scholar] [CrossRef] [PubMed]
- Okbay, A.; Beauchamp, J.P.; Fontana, M.A.; Lee, J.J.; Pers, T.H.; Rietveld, C.A.; Turley, P.; Chen, G.-B.; Emilsson, V.; Meddens, S.F.W.; et al. Genome-wide association study identifies 74 loci associated with educational attainment. Nature 2016, 533, 539–542. [Google Scholar] [CrossRef] [PubMed]
- Wang, Z.; McGlynn, K.A.; Meyts, E.R.-D.; Bishop, D.T.; Chung, C.C.; Dalgaard, M.D.; Greene, M.H.; Gupta, R.; Grotmol, T.; Haugen, T.B.; et al. Meta-analysis of five genome-wide association studies identifies multiple new loci associated with testicular germ cell tumor. Nat. Genet. 2017, 49, 1141–1147. [Google Scholar] [CrossRef]
- Carlborg, Ö.; Haley, C.S. Epistasis: Too often neglected in complex trait studies? Nat. Rev. Genet. 2004, 5, 618–625. [Google Scholar] [CrossRef]
- Cordell, H.J. Epistasis: What it means, what it doesn’t mean, and statistical methods to detect it in humans. Hum. Mol. Genet. 2002, 11, 2463–2468. [Google Scholar] [CrossRef]
- Cordell, H.J. Detecting gene–gene interactions that underlie human diseases. Nat. Rev. Genet. 2009, 10, 392–404. [Google Scholar] [CrossRef]
- Mackay, T.F.C.; Moore, J.H. Why epistasis is important for tackling complex human disease genetics. Genome Med. 2014, 6, 125, Erratum in Genome Med. 2015, 7, 85. [Google Scholar] [CrossRef]
- Phillips, P.C. Epistasis—The essential role of gene interactions in the structure and evolution of genetic systems. Nat. Rev. Genet. 2008, 9, 855–867. [Google Scholar] [CrossRef]
- Wei, W.-H.; Hemani, G.; Haley, C.S. Detecting epistasis in human complex traits. Nat. Rev. Genet. 2014, 15, 722–733. [Google Scholar] [CrossRef]
- Ritchie, M.D.; Hahn, L.W.; Roodi, N.; Bailey, L.R.; Dupont, W.D.; Parl, F.F.; Moore, J.H. Multifactor-dimensionality reduction reveals high-order interactions among estrogen-metabolism genes in sporadic breast cancer. Am. J. Hum. Genet. 2001, 69, 138–147. [Google Scholar] [CrossRef]
- Yang, C.-H.; Chuang, L.-Y.; Lin, Y.-D. CMDR based differential evolution identifies the epistatic interaction in genome-wide association studies. Bioinformatics 2017, 33, 2354–2362. [Google Scholar] [CrossRef]
- Zhu, Z.; Tong, X.; Zhu, Z.; Liang, M.; Cui, W.; Su, K.; Li, M.D.; Zhu, J. Development of GMDR-GPU for gene–gene interaction analysis and its application to WTCCC GWAS data for type 2 diabetes. PLoS ONE 2013, 8, e61943. [Google Scholar] [CrossRef] [PubMed]
- Yang, C.; He, Z.; Wan, X.; Yang, Q.; Xue, H.; Yu, W. SNPHarvester: A filtering-based approach for detecting epistatic interactions in genome-wide association studies. Bioinformatics 2009, 25, 504–511. [Google Scholar] [CrossRef] [PubMed]
- Jing, P.-J.; Shen, H.-B. MACOED: A multi-objective ant colony optimization algorithm for SNP epistasis detection in genome-wide association studies. Bioinformatics 2015, 31, 634–641. [Google Scholar] [CrossRef] [PubMed]
- Wang, Y. AntEpiSeeker: Detecting epistatic interactions for case–control studies using a two-stage ant colony optimization algorithm. BMC Res. Notes 2010, 3, 117. [Google Scholar] [CrossRef]
- Yuan, L.; Yuan, C.; Huang, D. FAACOSE: A fast adaptive ant colony optimization algorithm for detecting SNP epistasis. Complexity 2017, 2017, 5024867. [Google Scholar] [CrossRef]
- Sun, Y.; Shang, J.; Liu, J.-X.; Li, S.; Zheng, C.-H. epiACO—A method for identifying epistasis based on ant colony optimization algorithm. BioData Min. 2017, 10, 23. [Google Scholar] [CrossRef]
- Sun, L.; Liu, G.; Su, L.; Wang, R. HS-MMGKG: A fast multi-objective harmony search algorithm for two-locus model detection in GWAS. Curr. Bioinform. 2019, 14, 749–761. [Google Scholar] [CrossRef]
- Sun, L.; Liu, G.; Su, L.; Wang, R. SEE: A novel multi-objective evolutionary algorithm for identifying SNP epistasis in genome-wide association studies. Biotechnol. Biotechnol. Equip. 2019, 33, 529–547. [Google Scholar] [CrossRef]
- Blumenthal, D.B.; Viola, L.; List, M.; Baumbach, J.; Tieri, P.; Kacprowski, T. EpiGEN: An epistasis simulation pipeline. Bioinformatics 2020, 36, 4957–4959. [Google Scholar] [CrossRef]
- Wellcome Trust Case Control Consortium. Genome-wide association study of 14,000 cases of seven common diseases and 3000 shared controls. Nature 2007, 447, 661–678. [Google Scholar] [CrossRef] [PubMed]
- Mattingly, C.J.; Colby, G.T.; Forrest, J.N.; Boyer, J.L. The Comparative Toxicogenomics Database (CTD). Environ. Health Perspect. 2003, 111, 793–795. [Google Scholar] [CrossRef] [PubMed]
- Shi, Y. Brain Storm Optimization Algorithm. In Advances in Swarm Intelligence: Proceedings of the Second International Conference, ICSI 2011, Part I, Chongqing, China, 12–15 June 2011; Tan, Y., Shi, Y., Chai, Y., Wang, G., Eds.; Lecture Notes in Computer Science; Springer: Berlin/Heidelberg, Germany, 2011; Volume 6728, pp. 303–309. [Google Scholar] [CrossRef]
- Wan, X.; Yang, C.; Yang, Q.; Xue, H.; Fan, X.; Tang, N.L.; Yu, W. BOOST: A fast approach to detecting gene–gene interactions in genome-wide case-control studies. Am. J. Hum. Genet. 2010, 87, 325–340. [Google Scholar] [CrossRef] [PubMed]
- Stamatis, D.H. Essential Statistical Concepts for the Quality Professional; CRC Press: Boca Raton, FL, USA, 2012. [Google Scholar] [CrossRef]
- Evans, D.M.; Marchini, J.; Morris, A.P.; Cardon, L.R. Two-Stage Two-Locus Models in Genome-Wide Association. PLoS Genet. 2006, 2, e157. [Google Scholar] [CrossRef]
- Sherry, S.T.; Ward, M.H.; Kholodov, M.; Baker, J.; Phan, L.; Smigielski, E.M.; Sirotkin, K. dbSNP: The NCBI database of genetic variation. Nucleic Acids Res. 2001, 29, 308–311. [Google Scholar] [CrossRef]
- Kohl, M.; Wiese, S.; Warscheid, B. Cytoscape: Software for visualization and analysis of biological networks. In Data Mining in Proteomics: From Standards to Applications; Hamacher, M., Eisenacher, M., Stephan, C., Eds.; Methods in Molecular Biology; Humana Press: Totowa, NJ, USA, 2011; Volume 696, pp. 291–303. [Google Scholar] [CrossRef]
- Ouzikov, M.; Gómez-Carrillo, M.; Žampachová, L.; Dytrych, L.; Liu, L.; Pazourková, L.; Barta, T.; Kereïche, S.; Jin, T.; Edlund, H. LRIG1 controls proliferation of adult neural stem cells by facilitating TGFβ and BMP signalling pathways. Commun. Biol. 2024, 7, 655. [Google Scholar] [CrossRef]
- Ferguson, J.; Lam, K.; Marchionni, L.; Man, Y.K.S.; Ohta, T.; Stark, R.; Fang, J.S.; Saenz-Antoñanzas, A.; Rahman, R.; Wilson, C.M.; et al. Lrig1 regulates the balance between proliferation and quiescence in glioblastoma stem cells. Front. Cell Dev. Biol. 2022, 10, 983097. [Google Scholar] [CrossRef]
- Shammas, L.; Avendaño-Monsalve, M.C.; Vukotic, M.; Pollecker, K.; Cano Turrión, C.; Scharwey, M.; MacVicar, T.; Böckler, S.; Dennerlein, S.; Tatsuta, T.; et al. OMA1 mediates local and global stress responses against protein misfolding in CHCHD10 mitochondrial myopathy. J. Cell Biol. 2022, 221, e202110168. [Google Scholar] [CrossRef]
- Rivera-Mejías, P.; Narbona-Pérez, Á.J.; Hasberg, L.; Kroczek, L.; Bahat, A.; Lawo, S.; Folz-Donahue, K.; Schumacher, A.-L.; Ahola, S.; Mayer, F.C.; et al. The mitochondrial protease OMA1 acts as a metabolic safeguard upon nuclear DNA damage. Cell Rep. 2023, 42, 112332. [Google Scholar] [CrossRef]
Disclaimer/Publisher’s Note: The statements, opinions and data contained in all publications are solely those of the individual author(s) and contributor(s) and not of MDPI and/or the editor(s). MDPI and/or the editor(s) disclaim responsibility for any injury to people or property resulting from any ideas, methods, instructions or products referred to in the content. |
© 2025 by the authors. Licensee MDPI, Basel, Switzerland. This article is an open access article distributed under the terms and conditions of the Creative Commons Attribution (CC BY) license (https://creativecommons.org/licenses/by/4.0/).