
A Genome-Wide Association Study of Anti-Müllerian Hormone (AMH) Levels in Samoan Women

 , , , , and
Abstract
1. Introduction
2. Materials and Methods
2.1. Study Subjects
2.2. Anthropometric and Biochemical Measurements
2.3. Genotyping and Imputation
2.4. Ethical Approval
2.5. Genome-Wide Association Study
2.6. Known AMH Loci
2.7. Transcriptome-Wide Association Study
2.8. Colocalization Analysis
3. Results
4. Discussion
Strengths and Limitations
5. Conclusions
Supplementary Materials
Author Contributions
Funding
Institutional Review Board Statement
Informed Consent Statement
Data Availability Statement
Acknowledgments
Conflicts of Interest
Abbreviations
| AMH | Anti-Müllerian hormone |
| eQTL | Expression quantitative trait locus |
| GWAS | Genome-wide association study |
| LD | Linkage disequilibrium |
| MAF | Minor allele frequency |
| TWAS | Transcriptome-wide association study |
References
- Hagen, C.P.; Aksglaede, L.; Sørensen, K.; Main, K.M.; Boas, M.; Cleemann, L.; Holm, K.; Gravholt, C.H.; Andersson, A.M.; Pedersen, A.T.; et al. Serum levels of anti-Müllerian hormone as a marker of ovarian function in 926 healthy females from birth to adulthood and in 172 Turner syndrome patients. J. Clin. Endocrinol. Metab. 2010, 95, 5003–5010. [Google Scholar] [CrossRef] [PubMed]
- Kuiri-Hänninen, T.; Kallio, S.; Seuri, R.; Tyrväinen, E.; Liakka, A.; Tapanainen, J.; Sankilampi, U.; Dunkel, L. Postnatal developmental changes in the pituitary-ovarian axis in preterm and term infant girls. J. Clin. Endocrinol. Metab. 2011, 96, 3432–3439. [Google Scholar] [CrossRef] [PubMed]
- Weenen, C.; Laven, J.S.E.; von Bergh, A.R.M.; Cranfield, M.; Groome, N.P.; Visser, J.A.; Kramer, P.; Fauser, B.C.J.M.; Themmen, A.P.N. Anti-Müllerian hormone expression pattern in the human ovary: Potential implications for initial and cyclic follicle recruitment. Mol. Hum. Reprod. 2004, 10, 77–83. [Google Scholar] [CrossRef] [PubMed]
- Lie Fong, S.; Laven, J.S.E.; Duhamel, A.; Dewailly, D. Polycystic ovarian morphology and the diagnosis of polycystic ovary syndrome: Redefining threshold levels for follicle count and serum anti-Müllerian hormone using cluster analysis. Hum. Reprod. 2017, 32, 1723–1731. [Google Scholar] [CrossRef]
- Tal, R.; Seifer, D.B. Ovarian reserve testing: A user’s guide. Am. J. Obstet. Gynecol. 2017, 217, 129–140. [Google Scholar] [CrossRef]
- Fraissinet, A.; Robin, G.; Pigny, P.; Lefebvre, T.; Catteau-Jonard, S.; Dewailly, D. Use of the serum anti-Müllerian hormone assay as a surrogate for polycystic ovarian morphology: Impact on diagnosis and phenotypic classification of polycystic ovary syndrome. Hum. Reprod. 2017, 32, 1716–1722. [Google Scholar] [CrossRef]
- Abbara, A.; Eng, P.C.; Phylactou, M.; Clarke, S.A.; Hunjan, T.; Roberts, R.; Vimalesvaran, S.; Christopoulos, G.; Islam, R.; Purugganan, K.; et al. Anti-Müllerian hormone (AMH) in the diagnosis of menstrual disturbance due to polycystic ovarian syndrome. Front. Endocrinol. 2019, 10, 656. [Google Scholar] [CrossRef]
- Capuzzo, M.; La Marca, A. Use of AMH in the differential diagnosis of anovulatory disorders including PCOS. Front. Endocrinol. 2021, 11, 616766. [Google Scholar] [CrossRef]
- Sahmay, S.; Aydin, Y.; Oncul, M.; Senturk, L.M. Diagnosis of polycystic ovary syndrome: AMH in combination with clinical symptoms. J. Assist. Reprod. Genet. 2014, 31, 213–220. [Google Scholar] [CrossRef]
- Singh, A.K.; Singh, R. Can anti-Müllerian hormone replace ultrasonographic evaluation in polycystic ovary syndrome? A review of current progress. Indian. J. Endocrinol. Metab. 2015, 19, 731–743. [Google Scholar] [CrossRef]
- Maredia, H.; Lambert-Messerlian, G.M.; Palomaki, G.E.; Viali, S.; Hawley, N.L.; McGarvey, S.T. Cut-off levels for hyperandrogenemia among Samoan women: An improved methodology for deriving normative data in an obese population. Clin. Biochem. 2016, 49, 782–786. [Google Scholar] [CrossRef] [PubMed]
- Maredia, H.; Hawley, N.L.; Lambert-Messerlian, G.; Fidow, U.; Reupena, M.S.; Naseri, T.; McGarvey, S.T. Reproductive health, obesity, and cardiometabolic risk factors among Samoan women. Am. J. Hum. Biol. 2018, 30, e23106. [Google Scholar] [CrossRef] [PubMed]
- Lambert-Messerlian, G.; Roberts, M.B.; Urlacher, S.S.; Ah-Ching, J.; Viali, S.; Urbanek, M.; McGarvey, S.T. First assessment of menstrual cycle function and reproductive endocrine status in Samoan women. Hum. Reprod. 2011, 26, 2518–2524. [Google Scholar] [CrossRef] [PubMed]
- Lowe, J.K.; Maller, J.B.; Pe’er, I.; Neale, B.M.; Salit, J.; Kenny, E.E.; Shea, J.L.; Burkhardt, R.; Smith, J.G.; Ji, W.; et al. Genome-wide association studies in an isolated founder population from the Pacific Island of Kosrae. PLoS Genet. 2009, 5, e1000365. [Google Scholar] [CrossRef]
- Minster, R.L.; Hawley, N.L.; Su, C.T.; Sun, G.; Kershaw, E.E.; Cheng, H.; Buhule, O.D.; Lin, J.; Reupena, M.S.; Viali, S.; et al. A thrifty variant in CREBRF strongly influences body mass index in Samoans. Nat. Genet. 2016, 48, 1049–1054. [Google Scholar] [CrossRef]
- Harris, D.N.; Kessler, M.D.; Shetty, A.C.; Weeks, D.E.; Minster, R.L.; Browning, S.; Cochrane, E.E.; Deka, R.; Hawley, N.L.; Reupena, M.S.; et al. Evolutionary history of modern Samoans. Proc. Natl. Acad. Sci. USA 2020, 17, 9458–9465. [Google Scholar] [CrossRef]
- Dapas, M.; Lin, F.T.J.; Nadkarni, G.N.; Sisk, R.; Legro, R.S.; Urbanek, M.; Hayes, M.G.; Dunaif, A. Distinct subtypes of polycystic ovary syndrome with novel genetic associations: An unsupervised, phenotypic clustering analysis. PLoS Med. 2020, 17, e1003132. [Google Scholar] [CrossRef]
- Burns, K.; Mullin, B.H.; Moolhuijsen, L.M.E.; Laisk, T.; Tyrmi, J.S.; Cui, J.; Actkins, K.V.; Louwers, Y.V.; Davis, L.K.; Dudbridge, F.; et al. Body mass index stratified meta-analysis of genome-wide association studies of polycystic ovary syndrome in women of European ancestry. BMC Genom. 2024, 25, 208. [Google Scholar] [CrossRef]
- Perry, J.R.B.; McMahon, G.; Day, F.R.; Ring, S.M.; Nelson, S.M.; Lawlor, D.A. Genome-wide association study identifies common and low-frequency variants at the AMH gene locus that strongly predict serum AMH levels in males. Hum. Mol. Genet. 2016, 25, 382. [Google Scholar] [CrossRef]
- Ruth, K.S.; Soares, A.L.G.; Borges, M.C.; Eliassen, A.H.; Hankinson, S.E.; Jones, M.E.; Kraft, P.; Nichols, H.B.; Sandler, D.P.; Schoemaker, M.J.; et al. Genome-wide association study of anti-Müllerian hormone levels in pre-menopausal women of late reproductive age and relationship with genetic determinants of reproductive lifespan. Hum. Mol. Genet. 2019, 28, 1392–1401. [Google Scholar] [CrossRef]
- Verdiesen, R.M.G.; van der Schouw, Y.T.; van Gils, C.H.; Verschuren, W.M.M.; Broekmans, F.J.M.; Borges, M.C.; Gonçalves Soares, A.L.; Lawlor, D.A.; Eliassen, A.H.; Kraft, P.; et al. Genome-wide association study meta-analysis identifies three novel loci for circulating anti-Müllerian hormone levels in women. Hum. Reprod. 2022, 37, 1069–1082. [Google Scholar] [CrossRef]
- Moolhuijsen, L.M.E.; Louwers, Y.V.; McLuskey, A.; Broer, L.; Uitterlinden, A.G.; Verdiesen, R.M.G.; Sisk, R.K.; Dunaif, A.; Laven, J.S.E.; Visser, J.A. Association between an AMH promoter polymorphism and serum AMH levels in PCOS patients. Hum. Reprod. 2022, 37, 1544–1556. [Google Scholar] [CrossRef] [PubMed]
- Pujol-Gualdo, N.; Karjalainen, M.K.; Võsa, U.; Arffman, R.K.; Mägi, R.; Ronkainen, J.; Laisk, T.; Piltonen, T.T. Circulating anti-Müllerian hormone levels in pre-menopausal women: Novel genetic insights from a genome-wide association meta-analysis. Hum. Reprod. 2024, 39, 1564–1572. [Google Scholar] [CrossRef] [PubMed]
- Seifer, D.B.; Golub, E.T.; Lambert-Messerlian, G.; Benning, L.; Anastos, K.; Watts, D.H.; Cohen, M.H.; Karim, R.; Young, M.A.; Minkoff, H.; et al. Variations in serum Müllerian inhibiting substance between white, black, and Hispanic women. Fertil. Steril. 2009, 92, 1674–1678. [Google Scholar] [CrossRef] [PubMed]
- Gromski, P.S.; Patil, R.S.; Chougule, S.M.; Bhomkar, D.A.; Jirge, P.R.; Nelson, S.M. Ethnic discordance in serum anti-Müllerian hormone in European and Indian healthy women and Indian infertile women. Reprod. Biomed. Online 2022, 45, 979–986. [Google Scholar] [CrossRef]
- Hatzikotoulas, K.; Gilly, A.; Zeggini, E. Using population isolates in genetic association studies. Brief. Funct. Genom. 2014, 13, 371–377. [Google Scholar] [CrossRef]
- Uffelmann, E.; Huang, Q.Q.; Munung, N.S.; de Vries, J.; Okada, Y.; Martin, A.R.; Martin, H.C.; Lappalainen, T.; Posthuma, D. Genome-wide association studies. Nat. Rev. Methods Primers 2021, 1, 59. [Google Scholar] [CrossRef]
- Dai, F.; Keighley, E.D.; Sun, G.; Indugula, S.R.; Roberts, S.T.; Åberg, K.; Smelser, D.; Tuitele, J.; Jin, L.; Deka, R.; et al. Genome-wide scan for adiposity-related phenotypes in adults from American Samoa. Int. J. Obes. 2007, 31, 1832–1842. [Google Scholar] [CrossRef]
- Dai, F.; Sun, G.; Åberg, K.; Keighley, E.D.; Indugula, S.R.; Roberts, S.T.; Smelser, D.; Viali, S.; Jin, L.; Deka, R.; et al. A whole genome linkage scan identifies multiple chromosomal regions influencing adiposity-related traits among Samoans. Ann. Hum. Genet. 2008, 72, 780–792. [Google Scholar] [CrossRef]
- Hawley, N.L.; Minster, R.L.; Weeks, D.E.; Viali, S.; Reupena, M.S.; Sun, G.; Cheng, H.; Deka, R.; McGarvey, S.T. Prevalence of adiposity and associated cardiometabolic risk factors in the Samoan genome-wide association study. Am. J. Hum. Biol. 2014, 26, 491–501. [Google Scholar] [CrossRef]
- Carlson, J.C.; Krishnan, M.; Liu, S.; Anderson, K.J.; Zhang, J.Z.; Yapp, T.-A.J.; Chiyka, E.A.; Dikec, D.A.; Cheng, H.; Naseri, T.; et al. Improving imputation quality in Samoans through the integration of population-specific sequences into existing reference panels. medRxiv 2023. [Google Scholar] [CrossRef]
- Das, S.; Forer, L.; Schönherr, S.; Sidore, C.; Locke, A.E.; Kwong, A.; Vrieze, S.I.; Chew, E.Y.; Levy, S.; McGue, M.; et al. Next-generation genotype imputation service and methods. Nat. Genet. 2016, 48, 1284–1287. [Google Scholar] [CrossRef] [PubMed]
- He, L.; Kulminski, A.M. Fast algorithms for conducting large-scale gwas of age-at-onset traits using cox mixed-effects models. Genetics 2020, 215, 41–58. [Google Scholar] [CrossRef]
- Cox, D.R. Regression models and life-tables. J. R. Stat. Soc. Ser. B Stat. Methodol. 1972, 34, 187–202. [Google Scholar] [CrossRef]
- Dinse, G.E.; Jusko, T.A.; Ho, L.A.; Annam, K.; Graubard, B.I.; Hertz-Picciotto, I.; Miller, F.W.; Gillespie, B.W.; Weinberg, C.R. Accommodating Measurements Below a Limit of Detection: A Novel Application of Cox Regression. Am. J. Epidemiol. 2014, 179, 1018–1024. [Google Scholar] [CrossRef]
- Gogarten, S.M.; Sofer, T.; Chen, H.; Yu, C.; Brody, J.A.; Thornton, T.A.; Rice, K.M.; Conomos, M.P. Genetic association testing using the GENESIS R/Bioconductor package. Bioinformatics 2019, 35, 5346–5348. [Google Scholar] [CrossRef]
- Willer, C.J.; Li, Y.; Abecasis, G.R. METAL: Fast and efficient meta-analysis of genomewide association scans. Bioinformatics 2010, 26, 2190–2191. [Google Scholar] [CrossRef]
- Paria, S.S.; Rahman, S.R.; Adhikari, K. fastman: A fast algorithm for visualizing GWAS results using Manhattan and Q-Q plots. BioRxiv 2022. [Google Scholar] [CrossRef]
- Pruim, R.J.; Welch, R.P.; Sanna, S.; Teslovich, T.M.; Chines, P.S.; Gliedt, T.P.; Boehnke, M.; Abecasis, G.R.; Willer, C.J. LocusZoom: Regional visualization of genome-wide association scan results. Bioinformatics 2010, 26, 2336–2337. [Google Scholar] [CrossRef]
- Kichaev, G.; Yang, W.-Y.; Lindstrom, S.; Hormozdiari, F.; Eskin, E.; Price, A.; Kraft, P.; Pasaniuc, B. Integrating functional data to prioritize causal variants in statistical fine-mapping studies. PLoS Genet. 2014, 10, e1004722. [Google Scholar] [CrossRef]
- McLaren, W.; Gil, L.; Hunt, S.E.; Riat, H.S.; Ritchie, G.R.S.; Thormann, A.; Flicek, P.; Cunningham, F. The Ensembl Variant Effect Predictor. Genome Biol. 2016, 17, 122. [Google Scholar] [CrossRef] [PubMed]
- Boyle, A.P.; Hong, E.L.; Hariharan, M.; Cheng, Y.; Schaub, M.A.; Kasowski, M.; Karczewski, K.J.; Park, J.; Hitz, B.C.; Weng, S.; et al. Annotation of functional variation in personal genomes using RegulomeDB. Genome Res. 2012, 22, 1790–1797. [Google Scholar] [CrossRef] [PubMed]
- Watanabe, K.; Taskesen, E.; Van Bochoven, A.; Posthuma, D. Functional mapping and annotation of genetic associations with FUMA. Nat. Commun. 2017, 8, 1826. [Google Scholar] [CrossRef] [PubMed]
- Bioconducter Package Maintainer. LiftOver (Version 1.10.0): Changing Genomic Coordinate Systems with Rtracklayer::LiftOver. 2022. Available online: https://www.bioconductor.org/packages/release/workflows/vignettes/liftOver/inst/doc/liftov.html (accessed on 15 June 2025).
- de Leeuw, C.A.; Mooij, J.M.; Heskes, T.; Posthuma, D. MAGMA: Generalized gene-set analysis of GWAS data. PLoS Comput. Biol. 2015, 11, e1004219. [Google Scholar] [CrossRef]
- The GTEx consortium. The GTEx Consortium atlas of genetic regulatory effects across human tissues. Science (1979) 2020, 369, 1318–1330. [Google Scholar] [CrossRef]
- Gao, X.; Starmer, J.; Martin, E.R. A multiple testing correction method for genetic association studies using correlated single nucleotide polymorphisms. Genet. Epidemiol. 2008, 32, 361–369. [Google Scholar] [CrossRef]
- Barbeira, A.N.; Dickinson, S.P.; Bonazzola, R.; Zheng, J.; Wheeler, H.E.; Torres, J.M.; Torstenson, E.S.; Shah, K.P.; Garcia, T.; Edwards, T.L.; et al. Exploring the phenotypic consequences of tissue specific gene expression variation inferred from GWAS summary statistics. Nat. Commun. 2018, 9, 1825. [Google Scholar] [CrossRef]
- Barbeira, A.N.; Pividori, M.D.; Zheng, J.; Wheeler, H.E.; Nicolae, D.L.; Im, H.K. Integrating predicted transcriptome from multiple tissues improves association detection. PLoS Genet. 2019, 15, e1007889. [Google Scholar] [CrossRef]
- Carithers, L.J.; Ardlie, K.; Barcus, M.; Branton, P.A.; Britton, A.; Buia, S.A.; Compton, C.C.; Deluca, D.S.; Peter-Demchok, J.; Gelfand, E.T.; et al. A novel approach to high-quality postmortem tissue procurement: The GTEx project. Biopreserv Biobank 2015, 13, 311–317. [Google Scholar] [CrossRef]
- Barbeira, A.N.; Melia, O.J.; Liang, Y.; Bonazzola, R.; Wang, G.; Wheeler, H.E.; Aguet, F.; Ardlie, K.G.; Wen, X.; Im, H.K. Fine-mapping and QTL tissue-sharing information improves the reliability of causal gene identification. Genet. Epidemiol. 2020, 44, 854–867. [Google Scholar] [CrossRef]
- Hukku, A.; Sampson, M.G.; Luca, F.; Pique-Regi, R.; Wen, X. Analyzing and reconciling colocalization and transcriptome-wide association studies from the perspective of inferential reproducibility. Am. J. Hum. Genet. 2022, 109, 825. [Google Scholar] [CrossRef] [PubMed]
- Hukku, A.; Pividori, M.; Luca, F.; Pique-Regi, R.; Im, H.K.; Wen, X. Probabilistic colocalization of genetic variants from complex and molecular traits: Promise and limitations. Am. J. Hum. Genet. 2021, 108, 25. [Google Scholar] [CrossRef] [PubMed]
- Pividori, M.; Rajagopal, P.S.; Barbeira, A.; Liang, Y.; Melia, O.; Bastarache, L.; Park, Y.S.; GTEx Consortium; Wen, X.; Im, H.K. PhenomeXcan: Mapping the genome to the phenome through the transcriptome. Sci. Adv. 2020, 6, eaba2083. [Google Scholar] [CrossRef] [PubMed]
- Wen, X.; Pique-Regi, R.; Luca, F. Integrating molecular QTL data into genome-wide genetic association analysis: Probabilistic assessment of enrichment and colocalization. PLoS Genet. 2017, 13, e1006646. [Google Scholar] [CrossRef]
- Wen, X. Molecular QTL discovery incorporating genomic annotations using Bayesian false discovery rate control. Ann. Appl. Stat. 2016, 10, 1619–1638. [Google Scholar] [CrossRef]
- Kichaev, G.; Bhatia, G.; Loh, P.R.; Gazal, S.; Burch, K.; Freund, M.K.; Schoech, A.; Pasaniuc, B.; Price, A.L. Leveraging polygenic functional enrichment to improve GWAS power. Am. J. Hum. Genet. 2019, 104, 65–75. [Google Scholar] [CrossRef]
- Day, F.R.; Ruth, K.S.; Thompson, D.J.; Lunetta, K.L.; Pervjakova, N.; Chasman, D.I.; Stolk, L.; Finucane, H.K.; Sulem, P.; Bulik-Sullivan, B.; et al. Large-scale genomic analyses link reproductive aging to hypothalamic signaling, breast cancer susceptibility and BRCA1-mediated DNA repair. Nat. Genet. 2015, 47, 1294–1303. [Google Scholar] [CrossRef]
- de Kat, A.C.; Broekmans, F.J.M.; Lambalk, C.B. Role of AMH in prediction of menopause. Front. Endocrinol. 2021, 12, 1078. [Google Scholar] [CrossRef]
- de Kat, A.C.; van der Schouw, Y.T.; Eijkemans, M.J.C.; Herber-Gast, G.C.; Visser, J.A.; Verschuren, W.M.M.; Broekmans, F.J.M. Back to the basics of ovarian aging: A population-based study on longitudinal anti-Müllerian hormone decline. BMC Med. 2016, 14, 151. [Google Scholar] [CrossRef]
- Fishilevich, S.; Nudel, R.; Rappaport, N.; Hadar, R.; Plaschkes, I.; Stein, T.I.; Rosen, N.; Kohn, A.; Twik, M.; Safran, M.; et al. GeneHancer: Genome-wide integration of enhancers and target genes in GeneCards. Database 2017, 1, bax028. [Google Scholar] [CrossRef]
- Cao, Y.; Li, Z.; Jiang, W.; Ling, Y.; Kuang, H. Reproductive functions of kisspeptin/KISS1R systems in the periphery. Reprod. Biol. Endocrinol. 2019, 17, 65. [Google Scholar] [CrossRef]
- Ruohonen, S.T.; Gaytan, F.; Usseglio Gaudi, A.; Velasco, I.; Kukoricza, K.; Perdices-Lopez, C.; Franssen, D.; Guler, I.; Mehmood, A.; Elo, L.L.; et al. Selective loss of kisspeptin signaling in oocytes causes progressive premature ovulatory failure. Hum. Reprod. 2022, 37, 806–821. [Google Scholar] [CrossRef] [PubMed]
- Takayama, Y.; Kamimura, Y.; Okawa, M.; Muramatsu, S.; Sugino, A.; Araki, H. GINS, a novel multiprotein complex required for chromosomal DNA replication in budding yeast. Genes. Dev. 2003, 17, 1153. [Google Scholar] [CrossRef] [PubMed]
- Li, Z.; Xu, X. Post-translational modifications of the mini-chromosome maintenance proteins in DNA replication. Genes 2019, 10, 331. [Google Scholar] [CrossRef] [PubMed]
- Wei, H.; Liu, X.; Yuan, J.; Li, L.; Zhang, D.; Guo, X.; Liu, L.; Zhang, S. Age-specific gene expression profiles of rhesus monkey ovaries detected by microarray analysis. Biomed. Res. Int. 2015, 2015, 625192. [Google Scholar] [CrossRef]
- Hatzirodos, N.; Irving-Rodgers, H.F.; Hummitzsch, K.; Rodgers, R.J. Transcriptome profiling of the theca interna from bovine ovarian follicles during atresia. PLoS ONE 2014, 9, 99706. [Google Scholar] [CrossRef]
- Meng, Z.; Yang, Y.; Li, S.; Huang, L.; Yao, Z.; Chen, Y.; Wang, J.; Shen, Y.; Liang, P.; Zhang, H.; et al. GSE1 promotes the proliferation and migration of lung adenocarcinoma cells by downregulating KLF6 expression. Cell Biol. Int. 2024, 48, 1490–1506. [Google Scholar] [CrossRef]
- Lee, E.B.; Chakravarthi, V.P.; Mohamadi, R.; Dahiya, V.; Vo, K.; Ratri, A.; Fields, P.E.; Marsh, C.A.; Rumi, M.A.K. Loss of ERβ disrupts gene regulation in primordial and primary follicles. Int. J. Mol. Sci. 2024, 25, 3202. [Google Scholar] [CrossRef]
- Burger, L.L.; Vanacker, C.; Phumsatitpong, C.; Wagenmaker, E.R.; Wang, L.; Olson, D.P.; Moenter, S.M. Identification of genes enriched in GnRH neurons by translating ribosome affinity purification and RNAseq in mice. Endocrinology 2018, 159, 1922–1940. [Google Scholar] [CrossRef]
- Oride, A.; Kanasaki, H.; Tumurbaatar, T.; Tumurgan, Z.; Okada, H.; Kyo, S. Effect of anti-Müllerian hormone in hypothalamic Kiss-1- and GnRH-producing cell models. Gynecol. Endocrinol. 2021, 37, 841–847. [Google Scholar] [CrossRef]
- Chen, H.; Gu, L.; Orellana, E.A.; Wang, Y.; Guo, J.; Liu, Q.; Wang, L.; Shen, Z.; Wu, H.; Gregory, R.I.; et al. METTL4 is an snRNA m6Am methyltransferase that regulates RNA splicing. Cell Res. 2020, 30, 544–547. [Google Scholar] [CrossRef] [PubMed]
- Sheng, Y.; Pan, B.; Wei, F.; Wang, Y.; Gao, S. Case study of the response of N6-methyladenine DNA modification to environmental stressors in the unicellular eukaryote tetrahymena thermophila. MSphere 2021, 6, e0120820. [Google Scholar] [CrossRef] [PubMed]
- Priya, K.; Setty, M.; Babu, U.V.; Pai, K.S.R. Implications of environmental toxicants on ovarian follicles: How it can adversely affect the female fertility? Environ. Sci. Pollut. Res. 2021, 28, 67925–67939. [Google Scholar] [CrossRef]
- Xu, C.L.; Tan, Q.Y.; Yang, H.; Li, C.Y.; Wu, Z.; Ma, Y.F. Melatonin enhances spermatogonia activity through promoting KIAA1429-mediated m6A deposition to activate the PI3K/AKT signaling. Reprod. Biol. 2022, 22, 100681. [Google Scholar] [CrossRef] [PubMed]
- Szukiewicz, D.; Trojanowski, S.; Kociszewska, A.; Szewczyk, G. Modulation of the inflammatory response in polycystic ovary syndrome (PCOS)—Searching for epigenetic factors. Int. J. Mol. Sci. 2022, 23, 14663. [Google Scholar] [CrossRef]
- Ding, C.; Zou, Q.; Ding, J.; Ling, M.; Wang, W.; Li, H.; Huang, B. Increased N6-methyladenosine causes infertility is associated with FTO expression. J. Cell Physiol. 2018, 233, 7055–7066. [Google Scholar] [CrossRef]
- Mu, H.; Zhang, T.; Yang, Y.; Zhang, D.; Gao, J.; Li, J.; Yue, L.; Gao, D.; Shi, B.; Han, Y.; et al. METTL3-mediated mRNA N6-methyladenosine is required for oocyte and follicle development in mice. Cell Death Dis. 2021, 12, 989. [Google Scholar] [CrossRef]
- Kweon, S.M.; Chen, Y.; Moon, E.; Kvederaviciutė, K.; Klimasauskas, S.; Feldman, D.E. An adversarial DNA N6-methyladenine-sensor network preserves polycomb silencing. Mol. Cell 2019, 74, 1138–1147.e6. [Google Scholar] [CrossRef]
- Wei, R.R.; Sorger, P.K.; Harrison, S.C. Molecular organization of the Ndc80 complex, an essential kinetochore component. Proc. Natl. Acad. Sci. USA 2005, 102, 5363–5367. [Google Scholar] [CrossRef]
- Sanders, J.R.; Jones, K.T. Regulation of the meiotic divisions of mammalian oocytes and eggs. Biochem. Soc. Trans. 2018, 46, 797–806. [Google Scholar] [CrossRef]
- Sun, S.C.; Zhang, D.X.; Lee, S.E.; Xu, Y.N.; Kim, N.H. Ndc80 regulates meiotic spindle organization, chromosome alignment, and cell cycle progression in mouse oocytes. Microsc. Microanal. 2011, 17, 431–439. [Google Scholar] [CrossRef] [PubMed]
- Gui, L.; Homer, H. Hec1-dependent cyclin B2 stabilization Regulates the G2-M transition and early prometaphase in mouse oocytes. Dev. Cell 2013, 25, 43–54. [Google Scholar] [CrossRef] [PubMed]
- Takenoshita, Y.; Hara, M.; Fukagawa, T. Recruitment of two Ndc80 complexes via the CENP-T pathway is sufficient for kinetochore functions. Nat. Commun. 2022, 13, 851. [Google Scholar] [CrossRef] [PubMed]
- Lemonnier, T.; Dupré, A.; Jessus, C. The G2-to-M transition from a phosphatase perspective: A new vision of the meiotic division. Cell Div. 2020, 15, 9. [Google Scholar] [CrossRef]
- Ojavee, S.E.; Darrous, L.; Patxot, M.; Läll, K.; Fischer, K.; Mägi, R.; Kutalik, Z.; Robinson, M.R. Genetic insights into the age-specific biological mechanisms governing human ovarian aging. Am. J. Hum. Genet. 2023, 110, 1549–1563. [Google Scholar] [CrossRef]
- Su, H.I.; Sammel, M.D.; Homer, M.V.; Bui, K.; Haunschild, C.; Stanczyk, F.Z. Comparability of AMH levels among commercially available immunoassays. Fertil. Steril. 2014, 101, 1766. [Google Scholar] [CrossRef]
- Biedrzycki, R.J.; Sier, A.E.; Liu, D.; Dreikorn, E.N.; Weeks, D.E. Spinning convincing stories for both true and false association signals. Genet. Epidemiol. 2019, 43, 356–364. [Google Scholar] [CrossRef]

| 2002–03 Family Study | 2010 Soifua Manuia Study | |||||||||||
|---|---|---|---|---|---|---|---|---|---|---|---|---|
| Variable | n | Mean | sd | Min | Median | Max | N | Mean | sd | Min | Median | Max |
| Age | 212 | 28.3 | 6.8 | 18.0 | 28.1 | 39.8 | 973 | 39.3 | 7.6 | 25.0 | 40.7 | 50.9 |
| BMI (kg/m2) | 212 | 34.0 | 8.5 | 20.4 | 32.9 | 69.0 | 971 | 34.8 | 6.8 | 18.0 | 34.4 | 59.9 |
| AMH (ng/mL) † | 212 | 3.90 | 6.01 | 0.06 | 2.81 | 77.5 | 973 | 1.64 | 2.65 | 0.06 | 0.59 | 25.8 |
| AMH (ng/mL) †† | 211 | 3.91 | 6.02 | 0.08 | 2.82 | 77.5 | 804 | 1.97 | 2.81 | 0.06 | 0.97 | 25.8 |
| Polity American Samoa | 60% | 0% | ||||||||||
| Samoa | 40% | 100% | ||||||||||
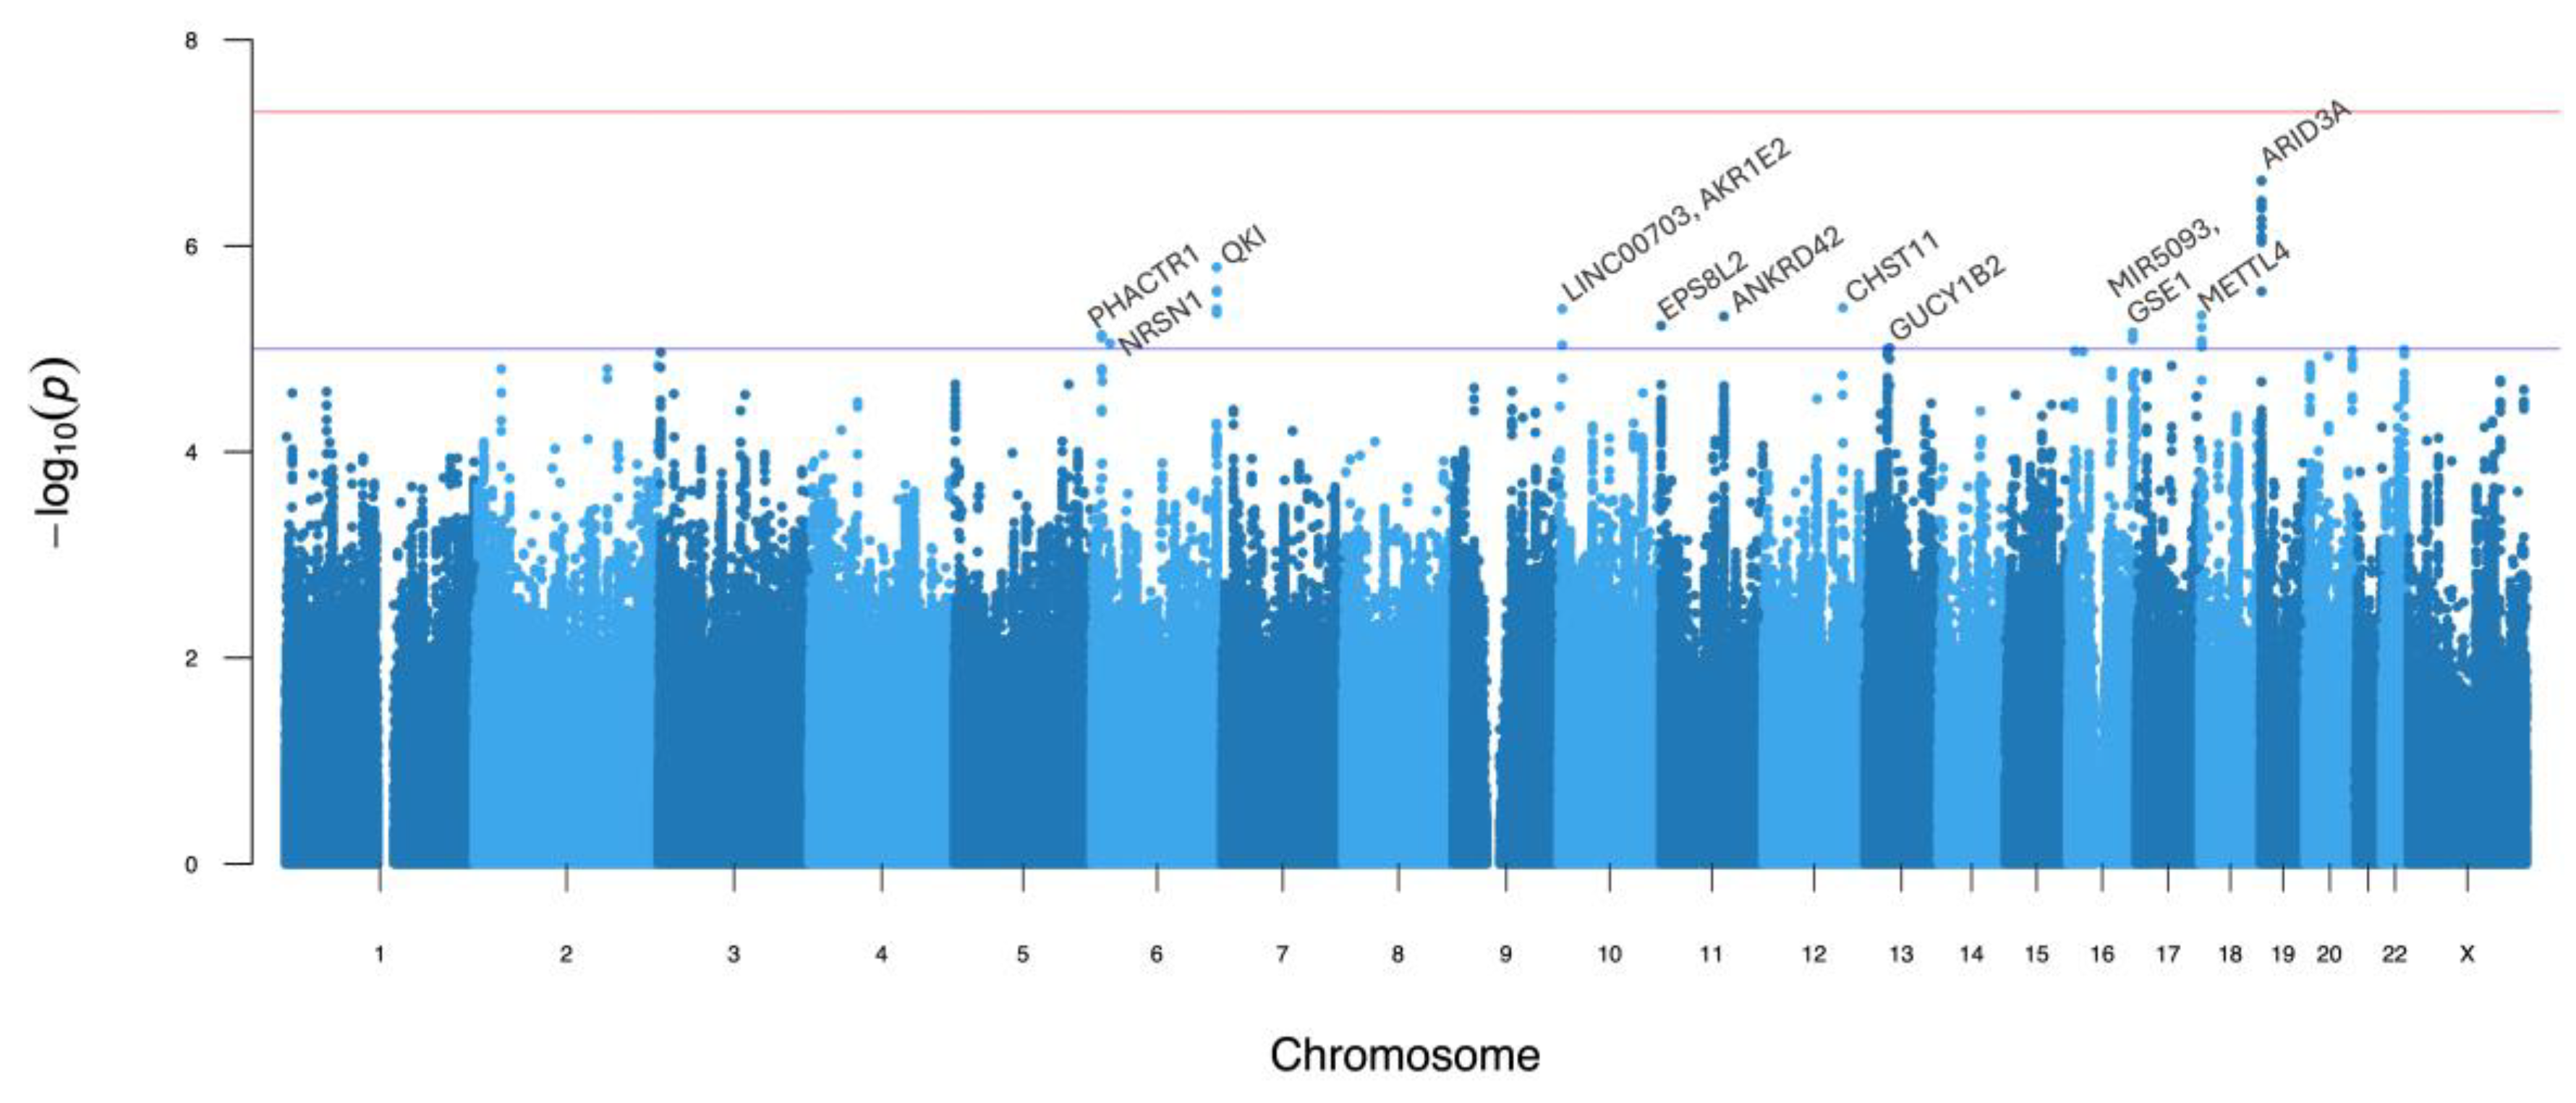
| Locus Information | 2002–03 Family Study | 2010 Soifua Manuia Study | Meta- Analysis | ||||||||
|---|---|---|---|---|---|---|---|---|---|---|---|
| Lead Variant | Nearest Gene | Type | RDB | Samoan EAF | EUR EAF | β (SE) | p | β (SE) | p | p | PP |
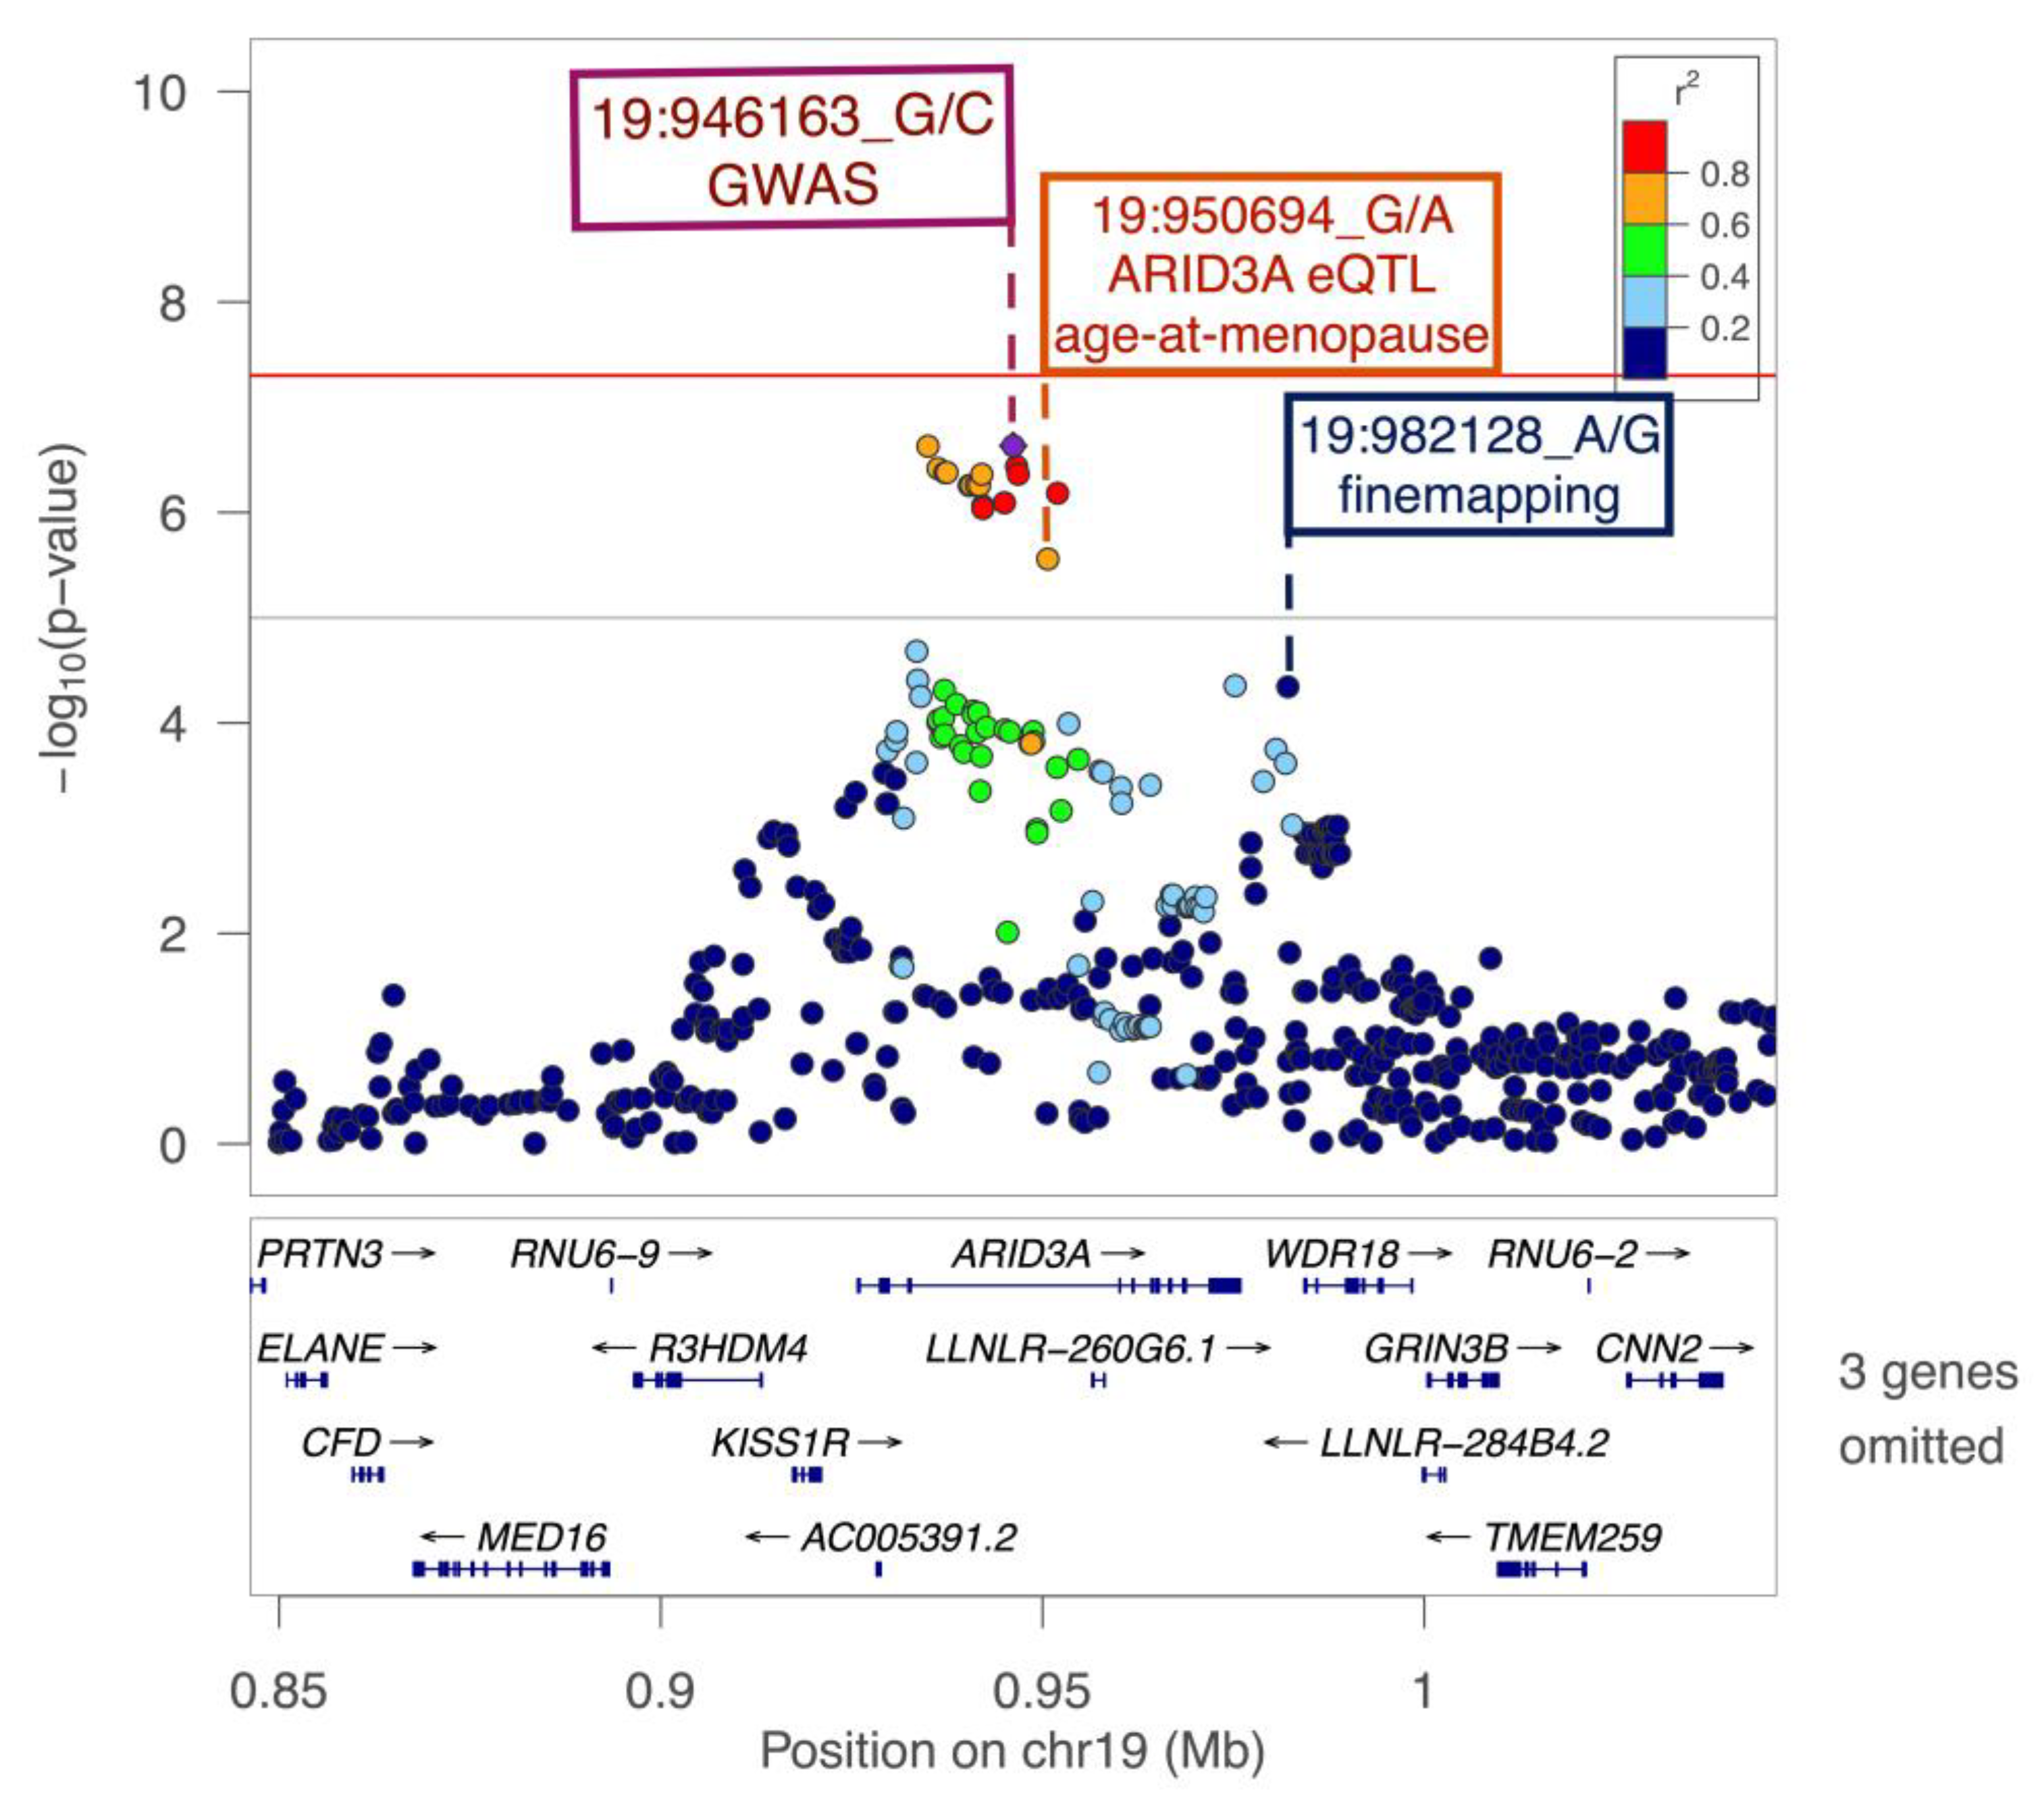
| 19-946163-G-C | ARID3A | intronic | 5 | 0.453 | 0.123 | −0.13 (0.13) | 3.10 × 10⁻¹ | −0.39 (0.08) | 1.67 × 10⁻⁷ | 2.32 × 10⁻⁷ | 0.11 |
| 6-163620593-G-A | QKI | intergenic | 5 | 0.132 | * | −0.14 (0.18) | 4.27 × 10⁻¹ | −0.57 (0.12) | 8.52 × 10⁻⁷ | 1.61 × 10⁻⁶ | 0.67 |
| 12-104584595-T-A | CHST11 | intronic | 6 | 0.845 | 0.524 | −0.32 (0.18) | 6.78 × 10⁻² | −0.44 (0.10) | 2.26 × 10⁻⁵ | 3.98 × 10⁻⁶ | 0.63 |
| 10-4474887-C-A | AKR1E2 | intergenic | 5 | 0.069 | * | 0.48 (0.24) | 4.49 × 10⁻² | 0.63 (0.15) | 3.36 × 10⁻⁵ | 4.09 × 10⁻⁶ | 0.40 |
| 18-2490805-C-T | METTL4 | intergenic | 7 | 0.787 | 0.346 | −0.20 (0.15) | 1.83 × 10⁻¹ | −0.42 (0.09) | 9.46 × 10⁻⁶ | 4.73 × 10⁻⁶ | 0.34 |
| 11-83219203-T-C | ANKRD42 | intronic | 4 | 0.285 | 0.347 | −0.38 (0.14) | 6.55 × 10⁻³ | −0.31 (0.08) | 1.59 × 10⁻⁴ | 4.83 × 10⁻⁶ | 0.06 |
| 11-722202-G-C | EPS8L2 | intronic | 3a | 0.412 | 0.194 | 0.33 (0.14) | 1.57 × 10⁻² | 0.29 (0.08) | 1.09 × 10⁻⁴ | 5.96 × 10⁻⁶ | 0.33 |
| 16-85420473-G-A | GSE1 | intergenic | 5 | 0.877 | 0.318 | −0.27 (0.20) | 1.87 × 10⁻¹ | −0.48 (0.11) | 1.39 × 10⁻⁵ | 6.91 × 10⁻⁶ | 0.59 |
| 6-12525440-G-A | PHACTR1 | intergenic | 7 | 0.097 | 0.119 | 0.09 (0.21) | 6.78 × 10⁻¹ | −0.67 (0.13) | 2.71 × 10⁻⁷ | 7.32 × 10⁻⁶ | 0.17 |
| 6-23537402-C-G | NRSN1 | intergenic | 4 | 0.052 | 0.000 | 0.31 (0.26) | 2.43 × 10⁻¹ | 0.82 (0.19) | 1.31 × 10⁻⁵ | 8.87 × 10⁻⁶ | 0.77 |
| 13-51023905-C-T | GUCY1B2 | intronic | 7 | 0.117 | 0.279 | 0.79 (0.20) | 5.73 × 10⁻⁵ | 0.35 (0.12) | 2.70 × 10⁻³ | 9.84 × 10⁻⁶ | 0.36 |
Disclaimer/Publisher’s Note: The statements, opinions and data contained in all publications are solely those of the individual author(s) and contributor(s) and not of MDPI and/or the editor(s). MDPI and/or the editor(s) disclaim responsibility for any injury to people or property resulting from any ideas, methods, instructions or products referred to in the content. |
© 2025 by the authors. Licensee MDPI, Basel, Switzerland. This article is an open access article distributed under the terms and conditions of the Creative Commons Attribution (CC BY) license (https://creativecommons.org/licenses/by/4.0/).
Share and Cite
Erdogan-Yildirim, Z.; Carlson, J.C.; Krishnan, M.; Zhang, J.Z.; Lambert-Messerlian, G.; Naseri, T.; Viali, S.; Hawley, N.L.; McGarvey, S.T.; Weeks, D.E.; et al. A Genome-Wide Association Study of Anti-Müllerian Hormone (AMH) Levels in Samoan Women. Genes 2025, 16, 793. https://doi.org/10.3390/genes16070793
Erdogan-Yildirim Z, Carlson JC, Krishnan M, Zhang JZ, Lambert-Messerlian G, Naseri T, Viali S, Hawley NL, McGarvey ST, Weeks DE, et al. A Genome-Wide Association Study of Anti-Müllerian Hormone (AMH) Levels in Samoan Women. Genes. 2025; 16(7):793. https://doi.org/10.3390/genes16070793
Chicago/Turabian StyleErdogan-Yildirim, Zeynep, Jenna C. Carlson, Mohanraj Krishnan, Jerry Z. Zhang, Geralyn Lambert-Messerlian, Take Naseri, Satupaitea Viali, Nicola L. Hawley, Stephen T. McGarvey, Daniel E. Weeks, and et al. 2025. "A Genome-Wide Association Study of Anti-Müllerian Hormone (AMH) Levels in Samoan Women" Genes 16, no. 7: 793. https://doi.org/10.3390/genes16070793
APA StyleErdogan-Yildirim, Z., Carlson, J. C., Krishnan, M., Zhang, J. Z., Lambert-Messerlian, G., Naseri, T., Viali, S., Hawley, N. L., McGarvey, S. T., Weeks, D. E., & Minster, R. L. (2025). A Genome-Wide Association Study of Anti-Müllerian Hormone (AMH) Levels in Samoan Women. Genes, 16(7), 793. https://doi.org/10.3390/genes16070793