
Bioinformatics-Driven Identification of Ferroptosis-Related Gene Signatures Distinguishing Active and Latent Tuberculosis

 , , , , ,
 Highlights
- Our study identified four ferroptosis-related hub genes (ACSL1, PARP9, TLR4, ATG3) as reliable biomarkers that distinguish active tuberculosis (TB) from latent TB infection (LTBI).
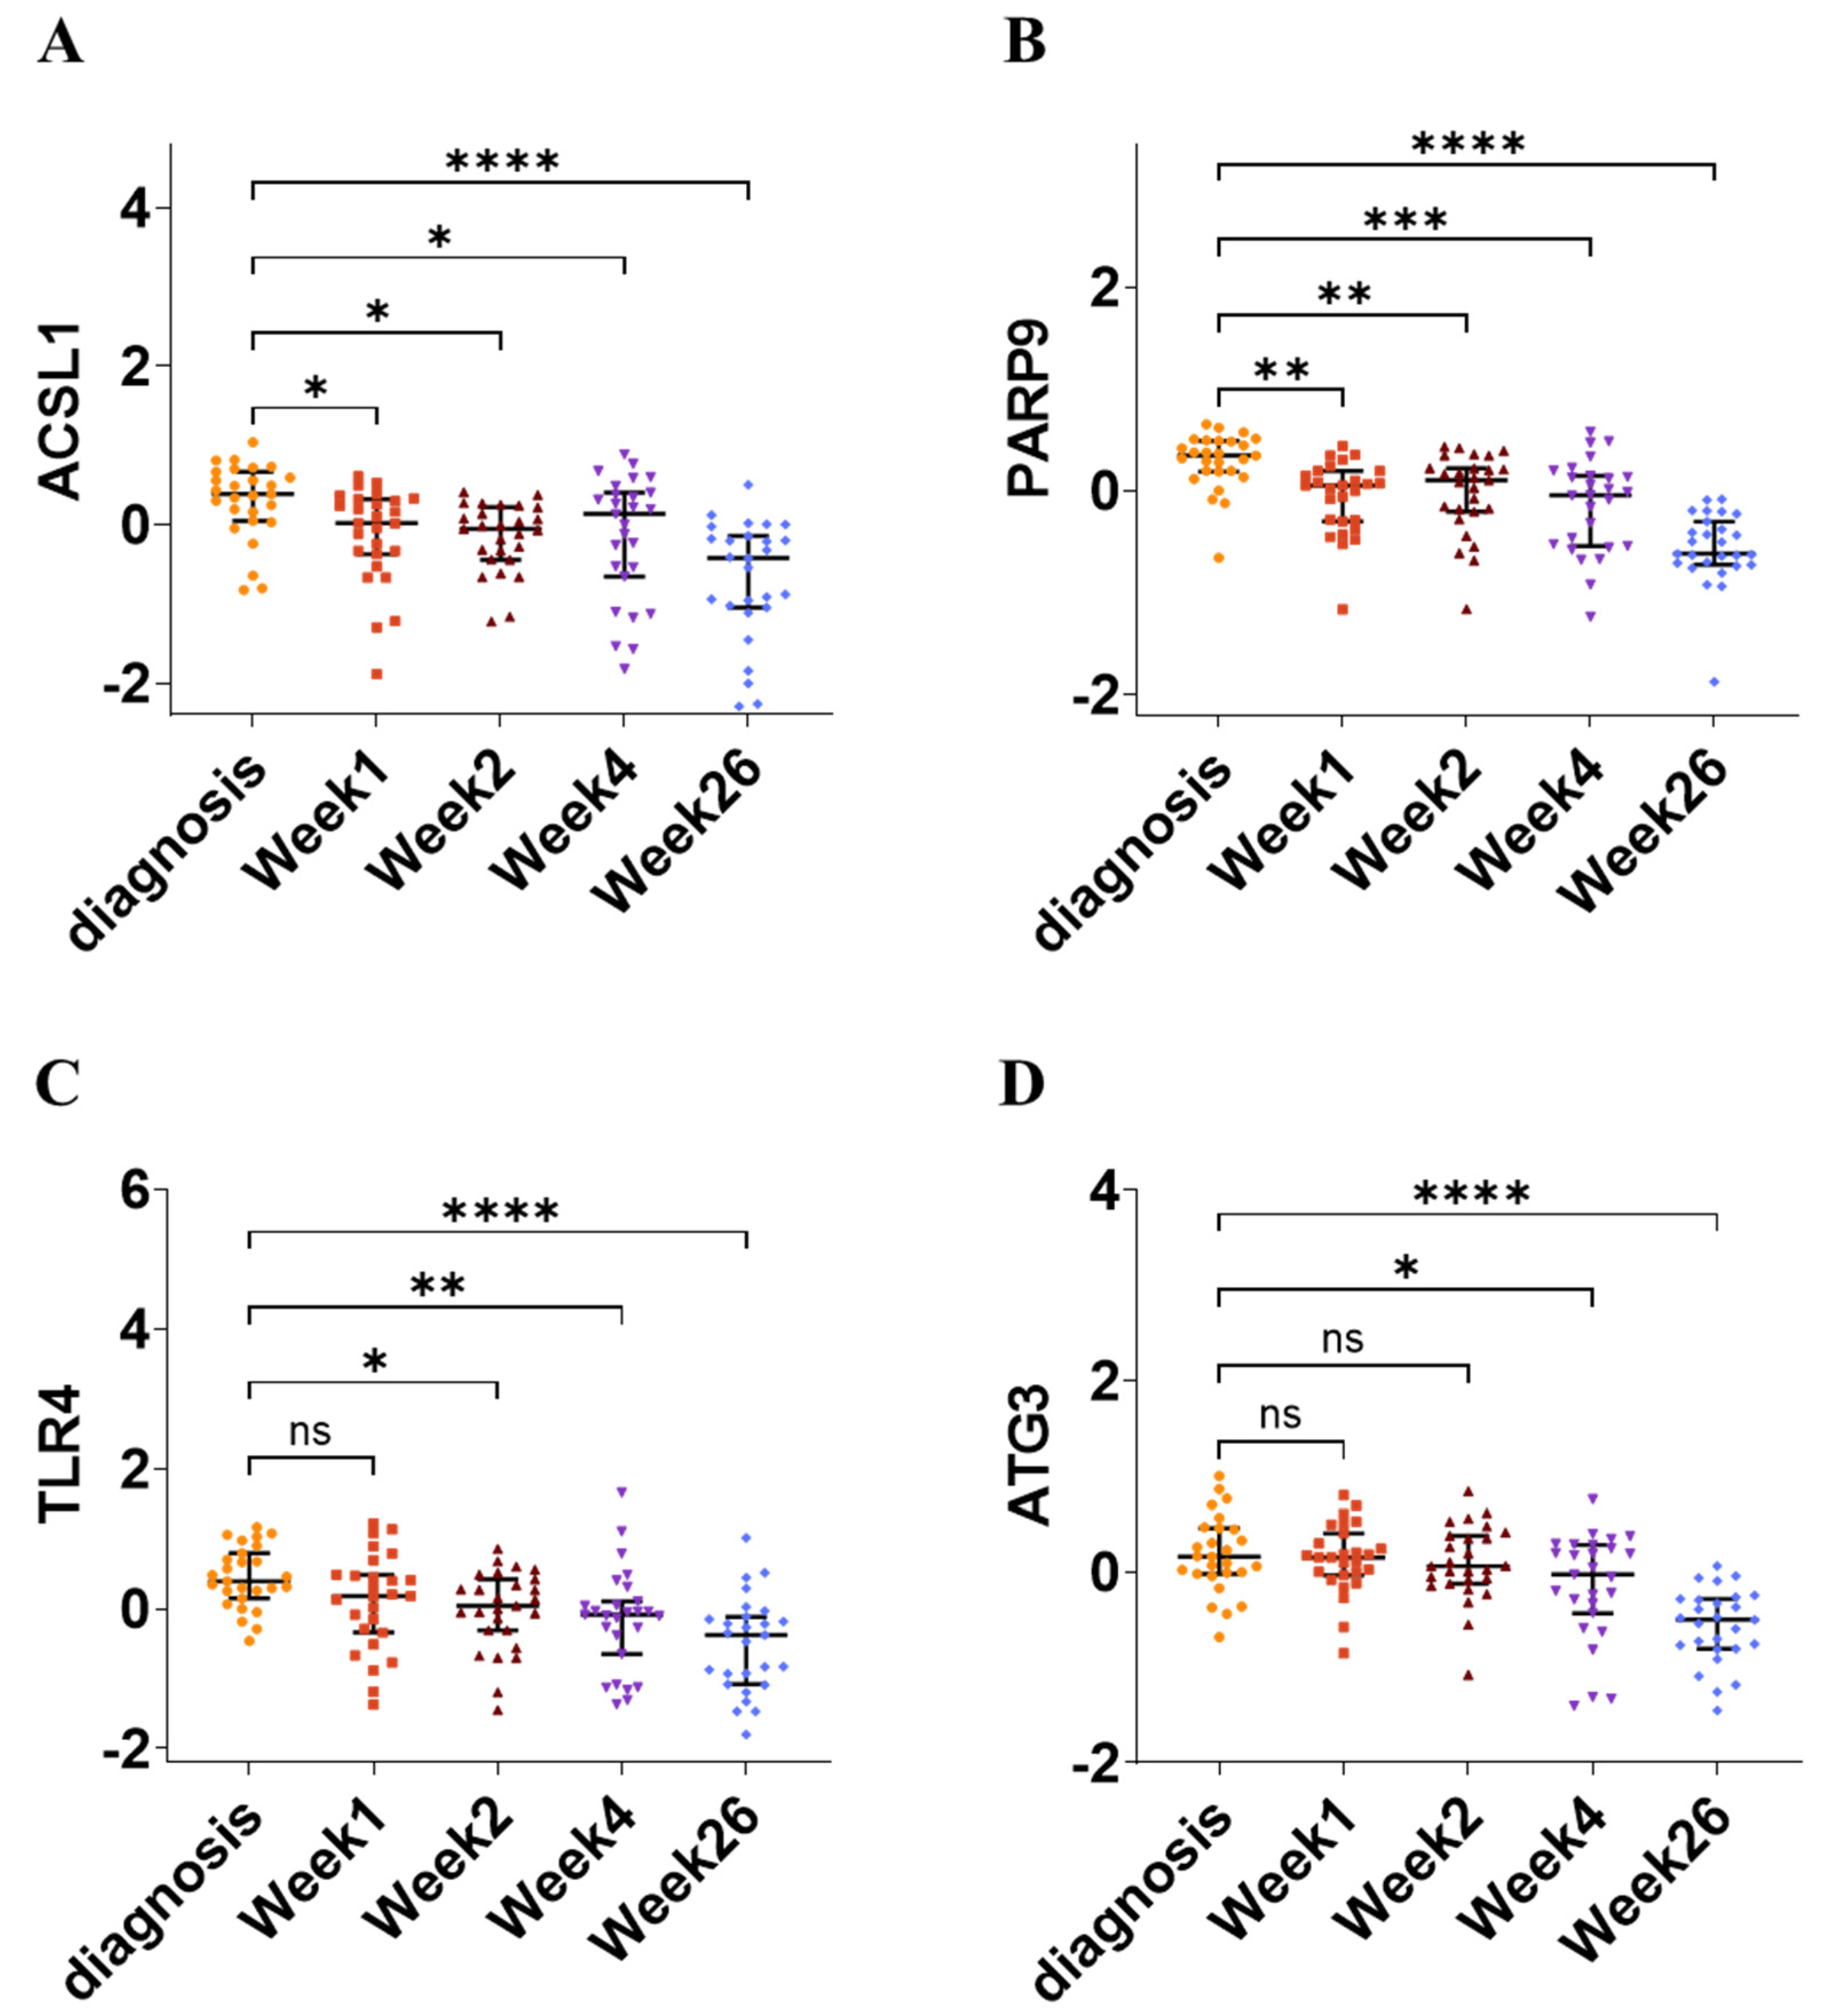
- These biomarkers were validated across multiple independent datasets and shown to correlate with treatment response, as their expression levels decreased after successful TB treatment.
- Our approach enables the efficient diagnosis and monitoring of tuberculosis directly from gene expression data, reducing dependence on slower or less precise clinical methods.
- Our study expands the application of bioinformatics-driven biomarker discovery, showing that ferroptosis-related genes can serve not only as diagnostic markers but also as indicators of therapeutic effectiveness.
Abstract
1. Introduction
2. Materials and Methods
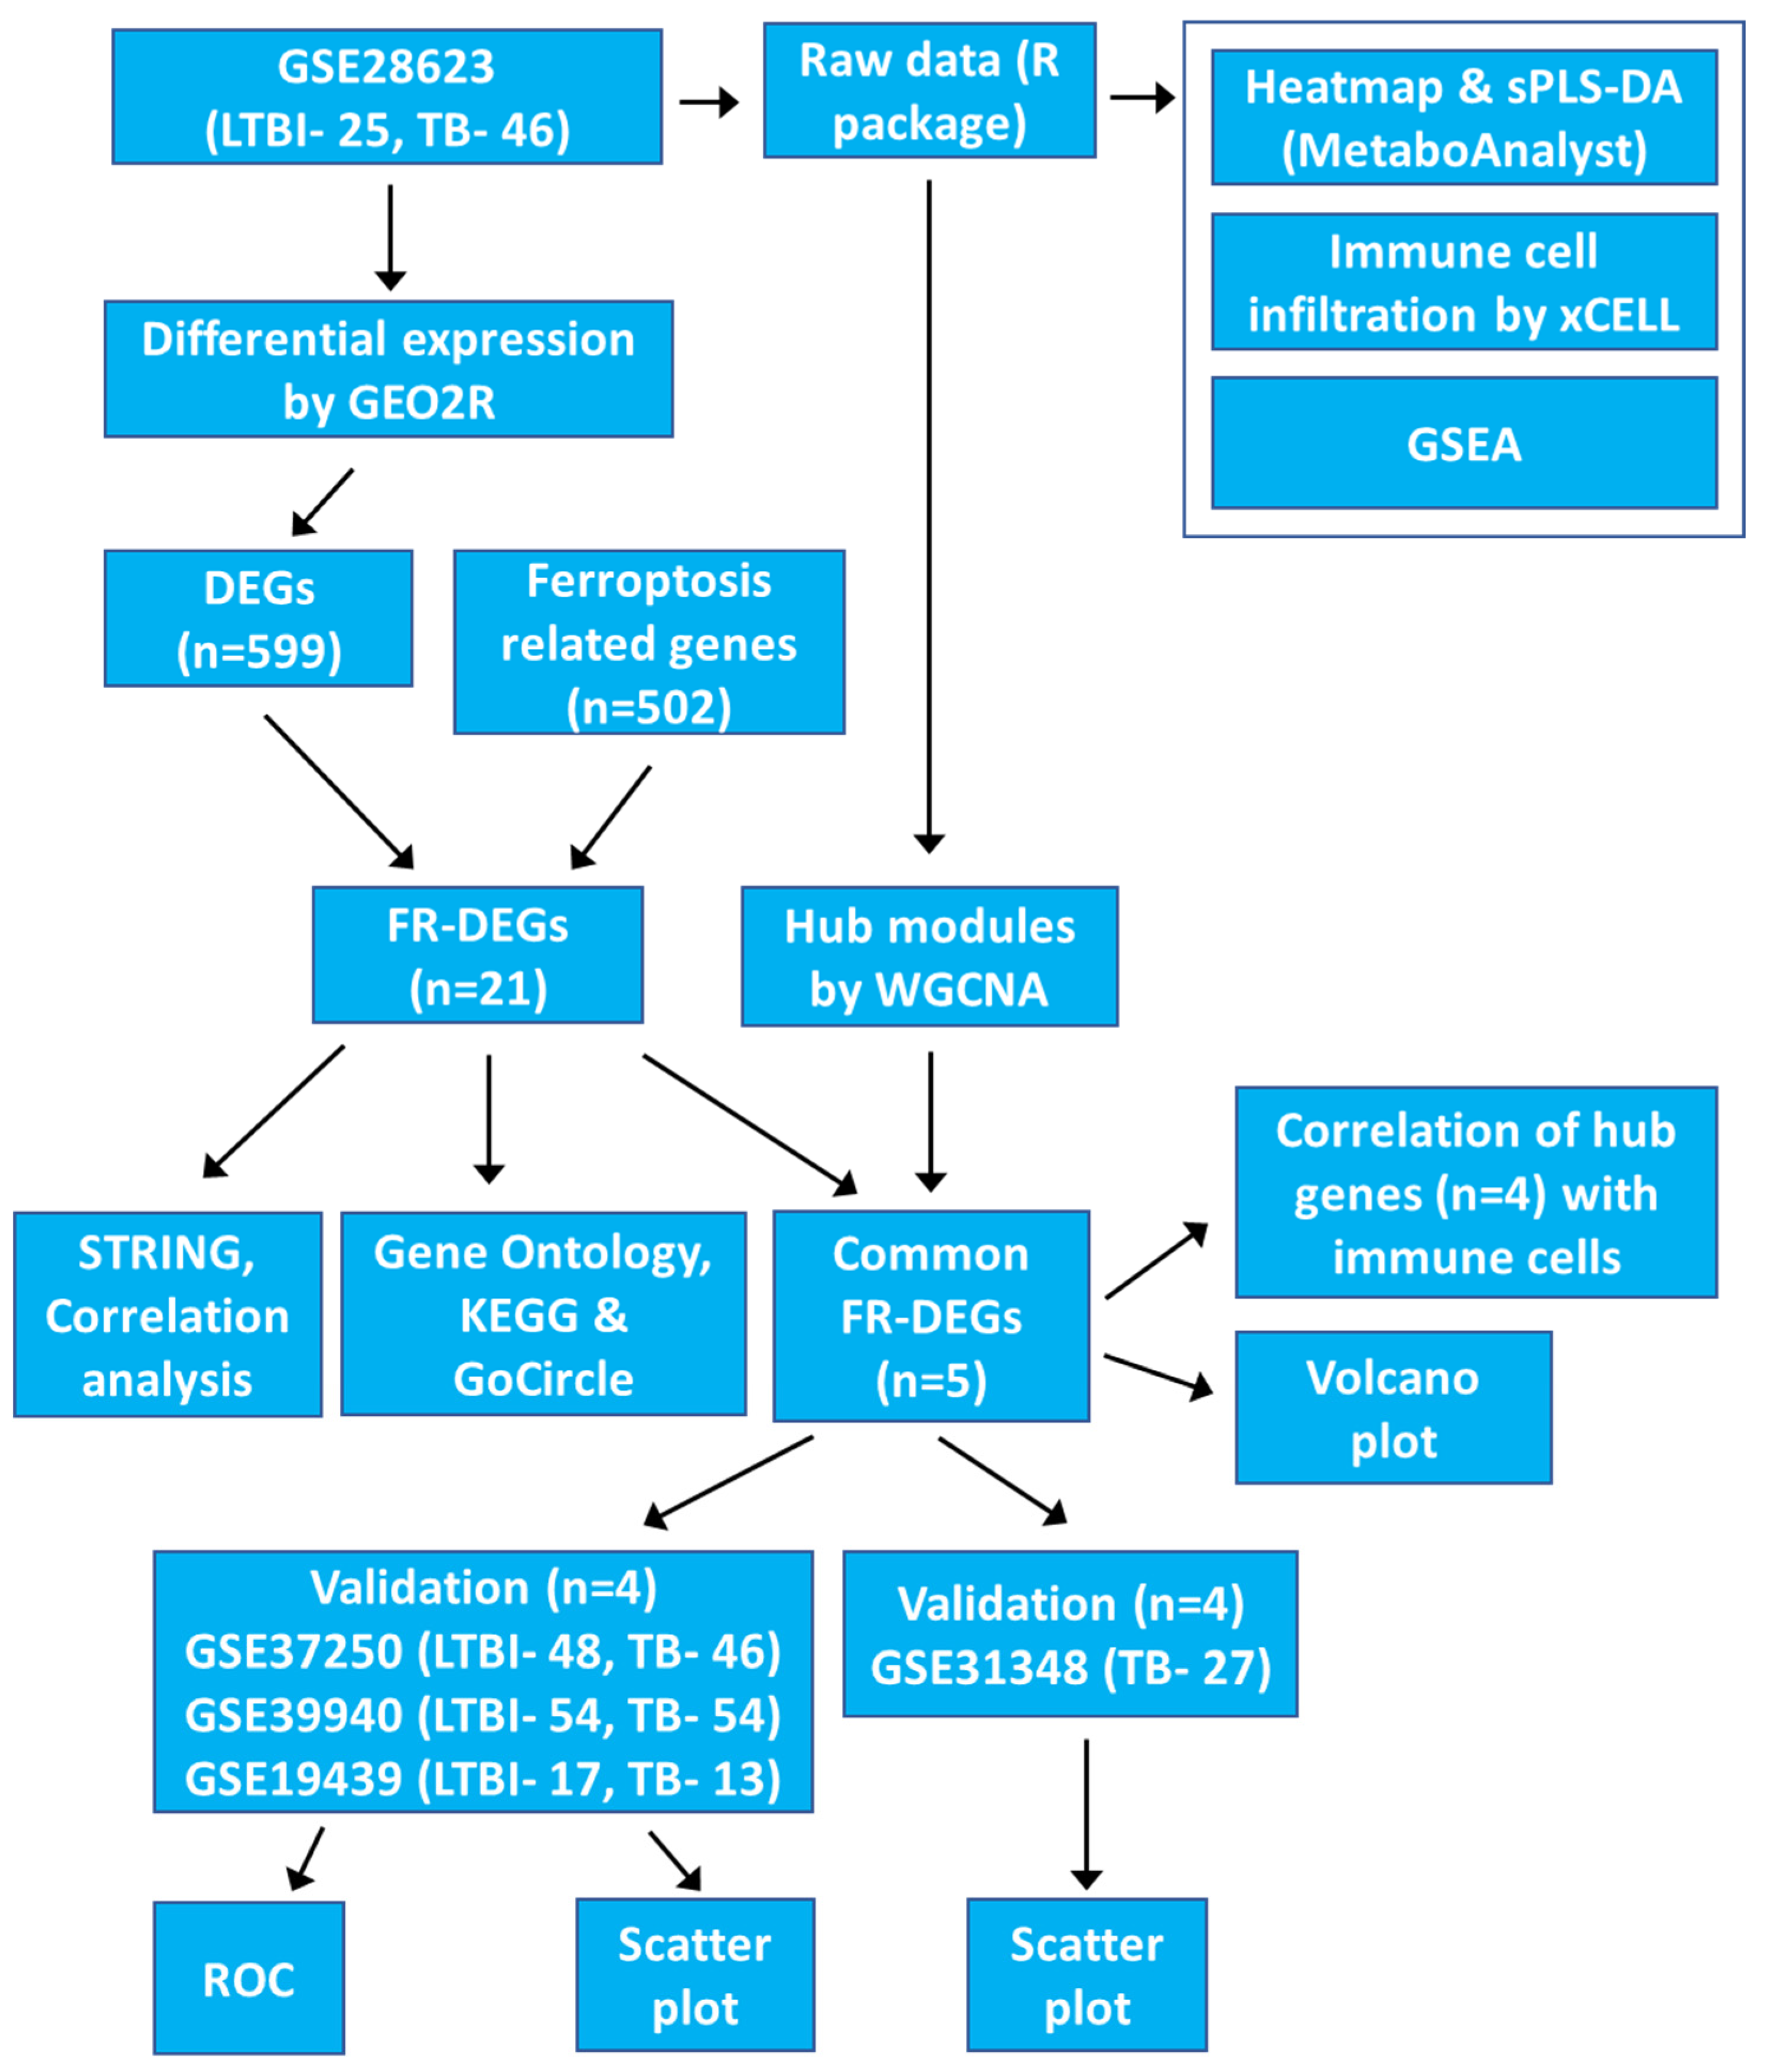
2.1. Data Collection and Processing
2.2. Data Processing and Statistical Analysis
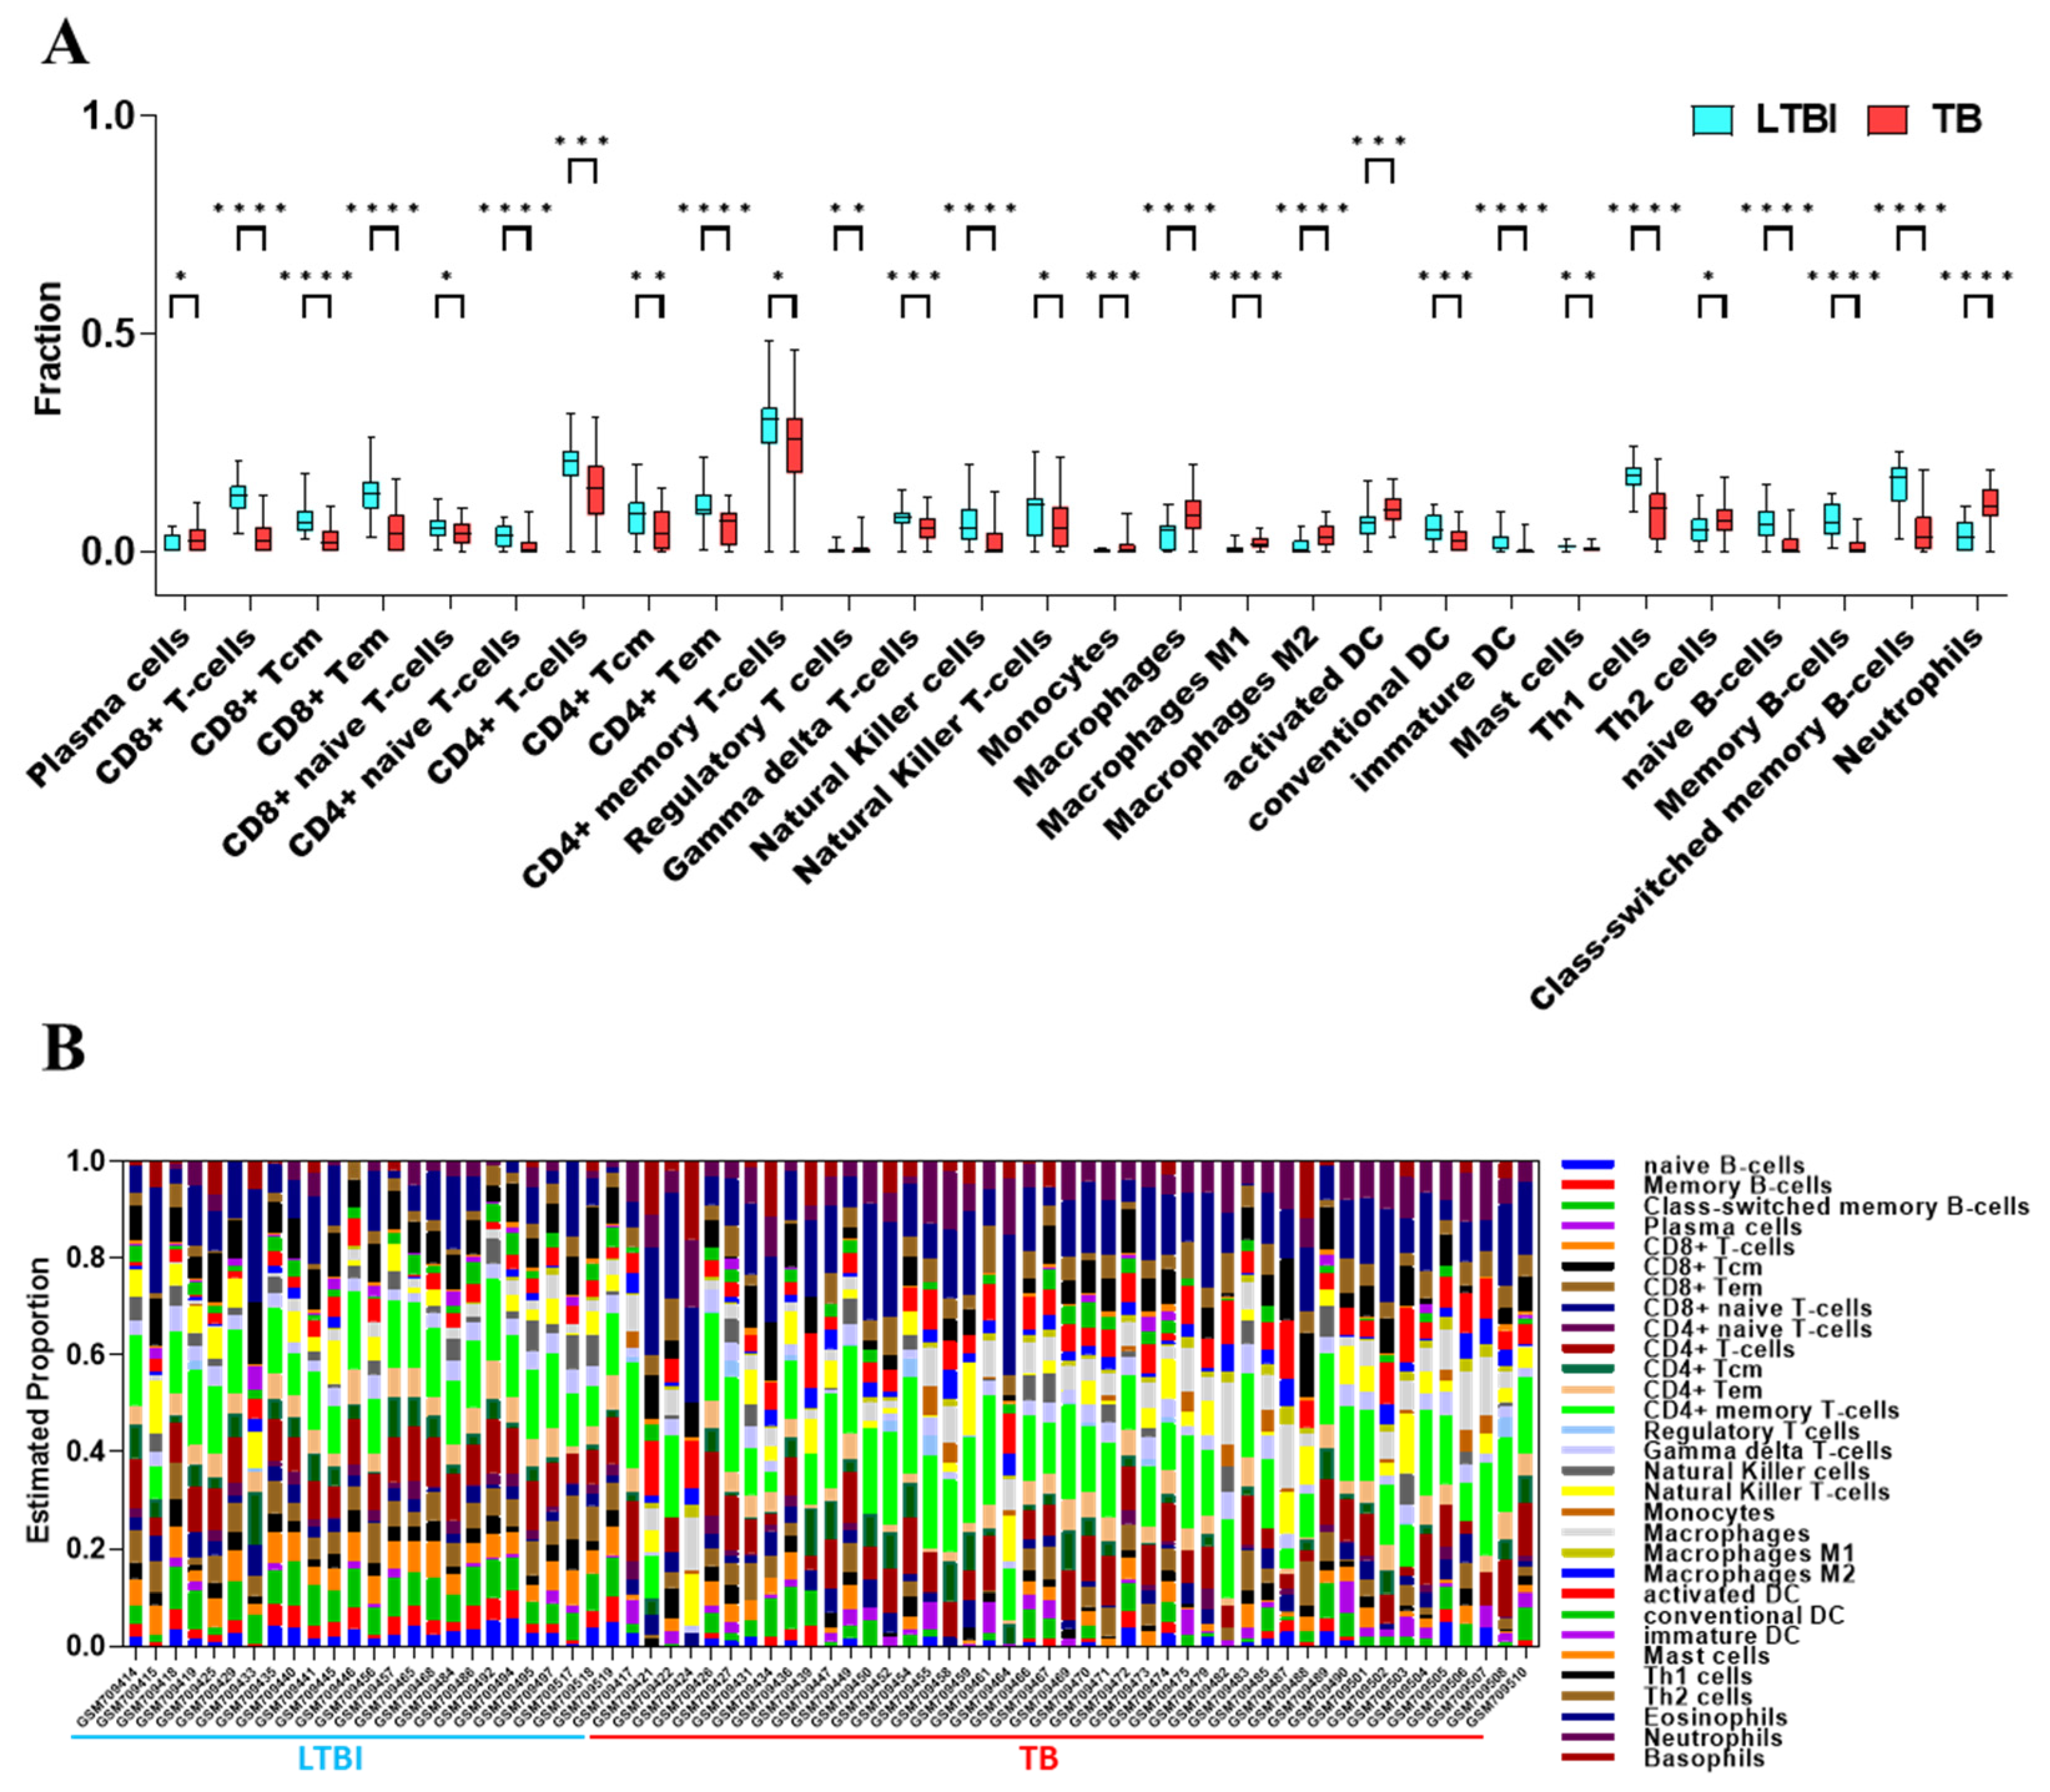
2.3. Immune Cell Infiltration Analysis Using xCell
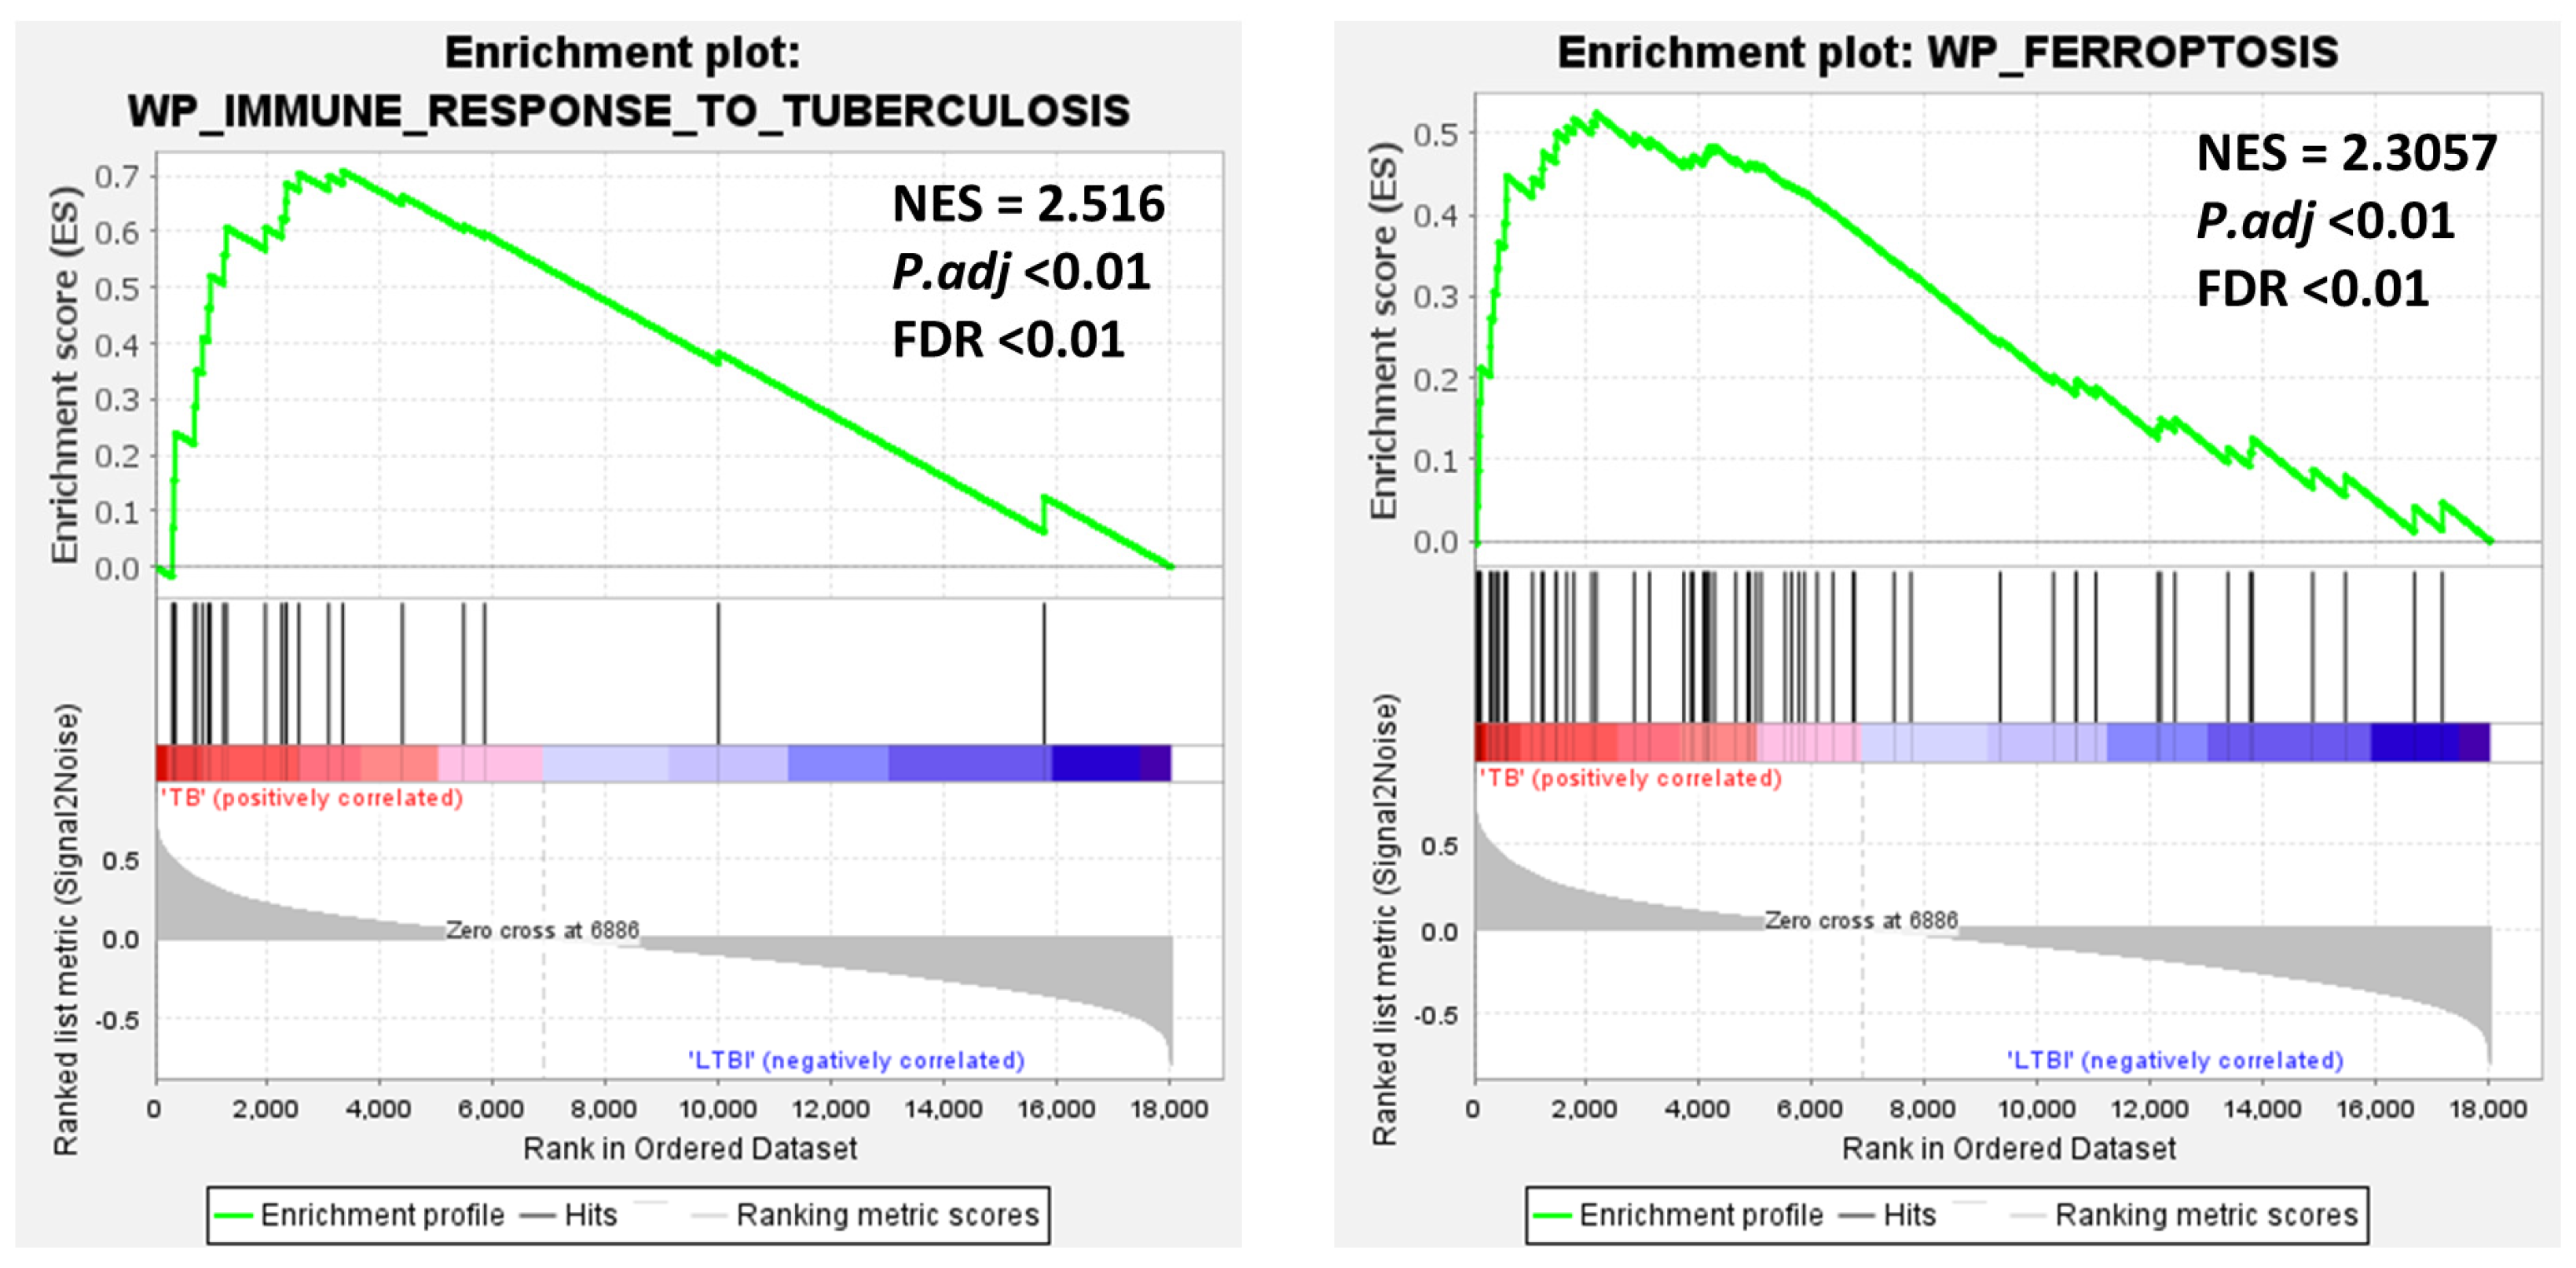
2.4. Gene Set Enrichment Analysis (GSEA)
2.5. Differential Gene Expression Analysis Using GEO2R
2.6. Ferroptosis-Related Genes, Protein Interaction, and Correlation Analysis
2.7. Pathway and Functional Annotation of FR-DEGs
2.8. Weighted Gene Co-Expression Network Analysis (WGCNA)
2.9. Venn Diagram and Volcano Plot Analysis of Hub Genes
2.10. Correlation Analysis Between Hub Genes with Immune Cell Infiltration
2.11. Validation and Diagnostic Potential of Hub Genes
3. Results
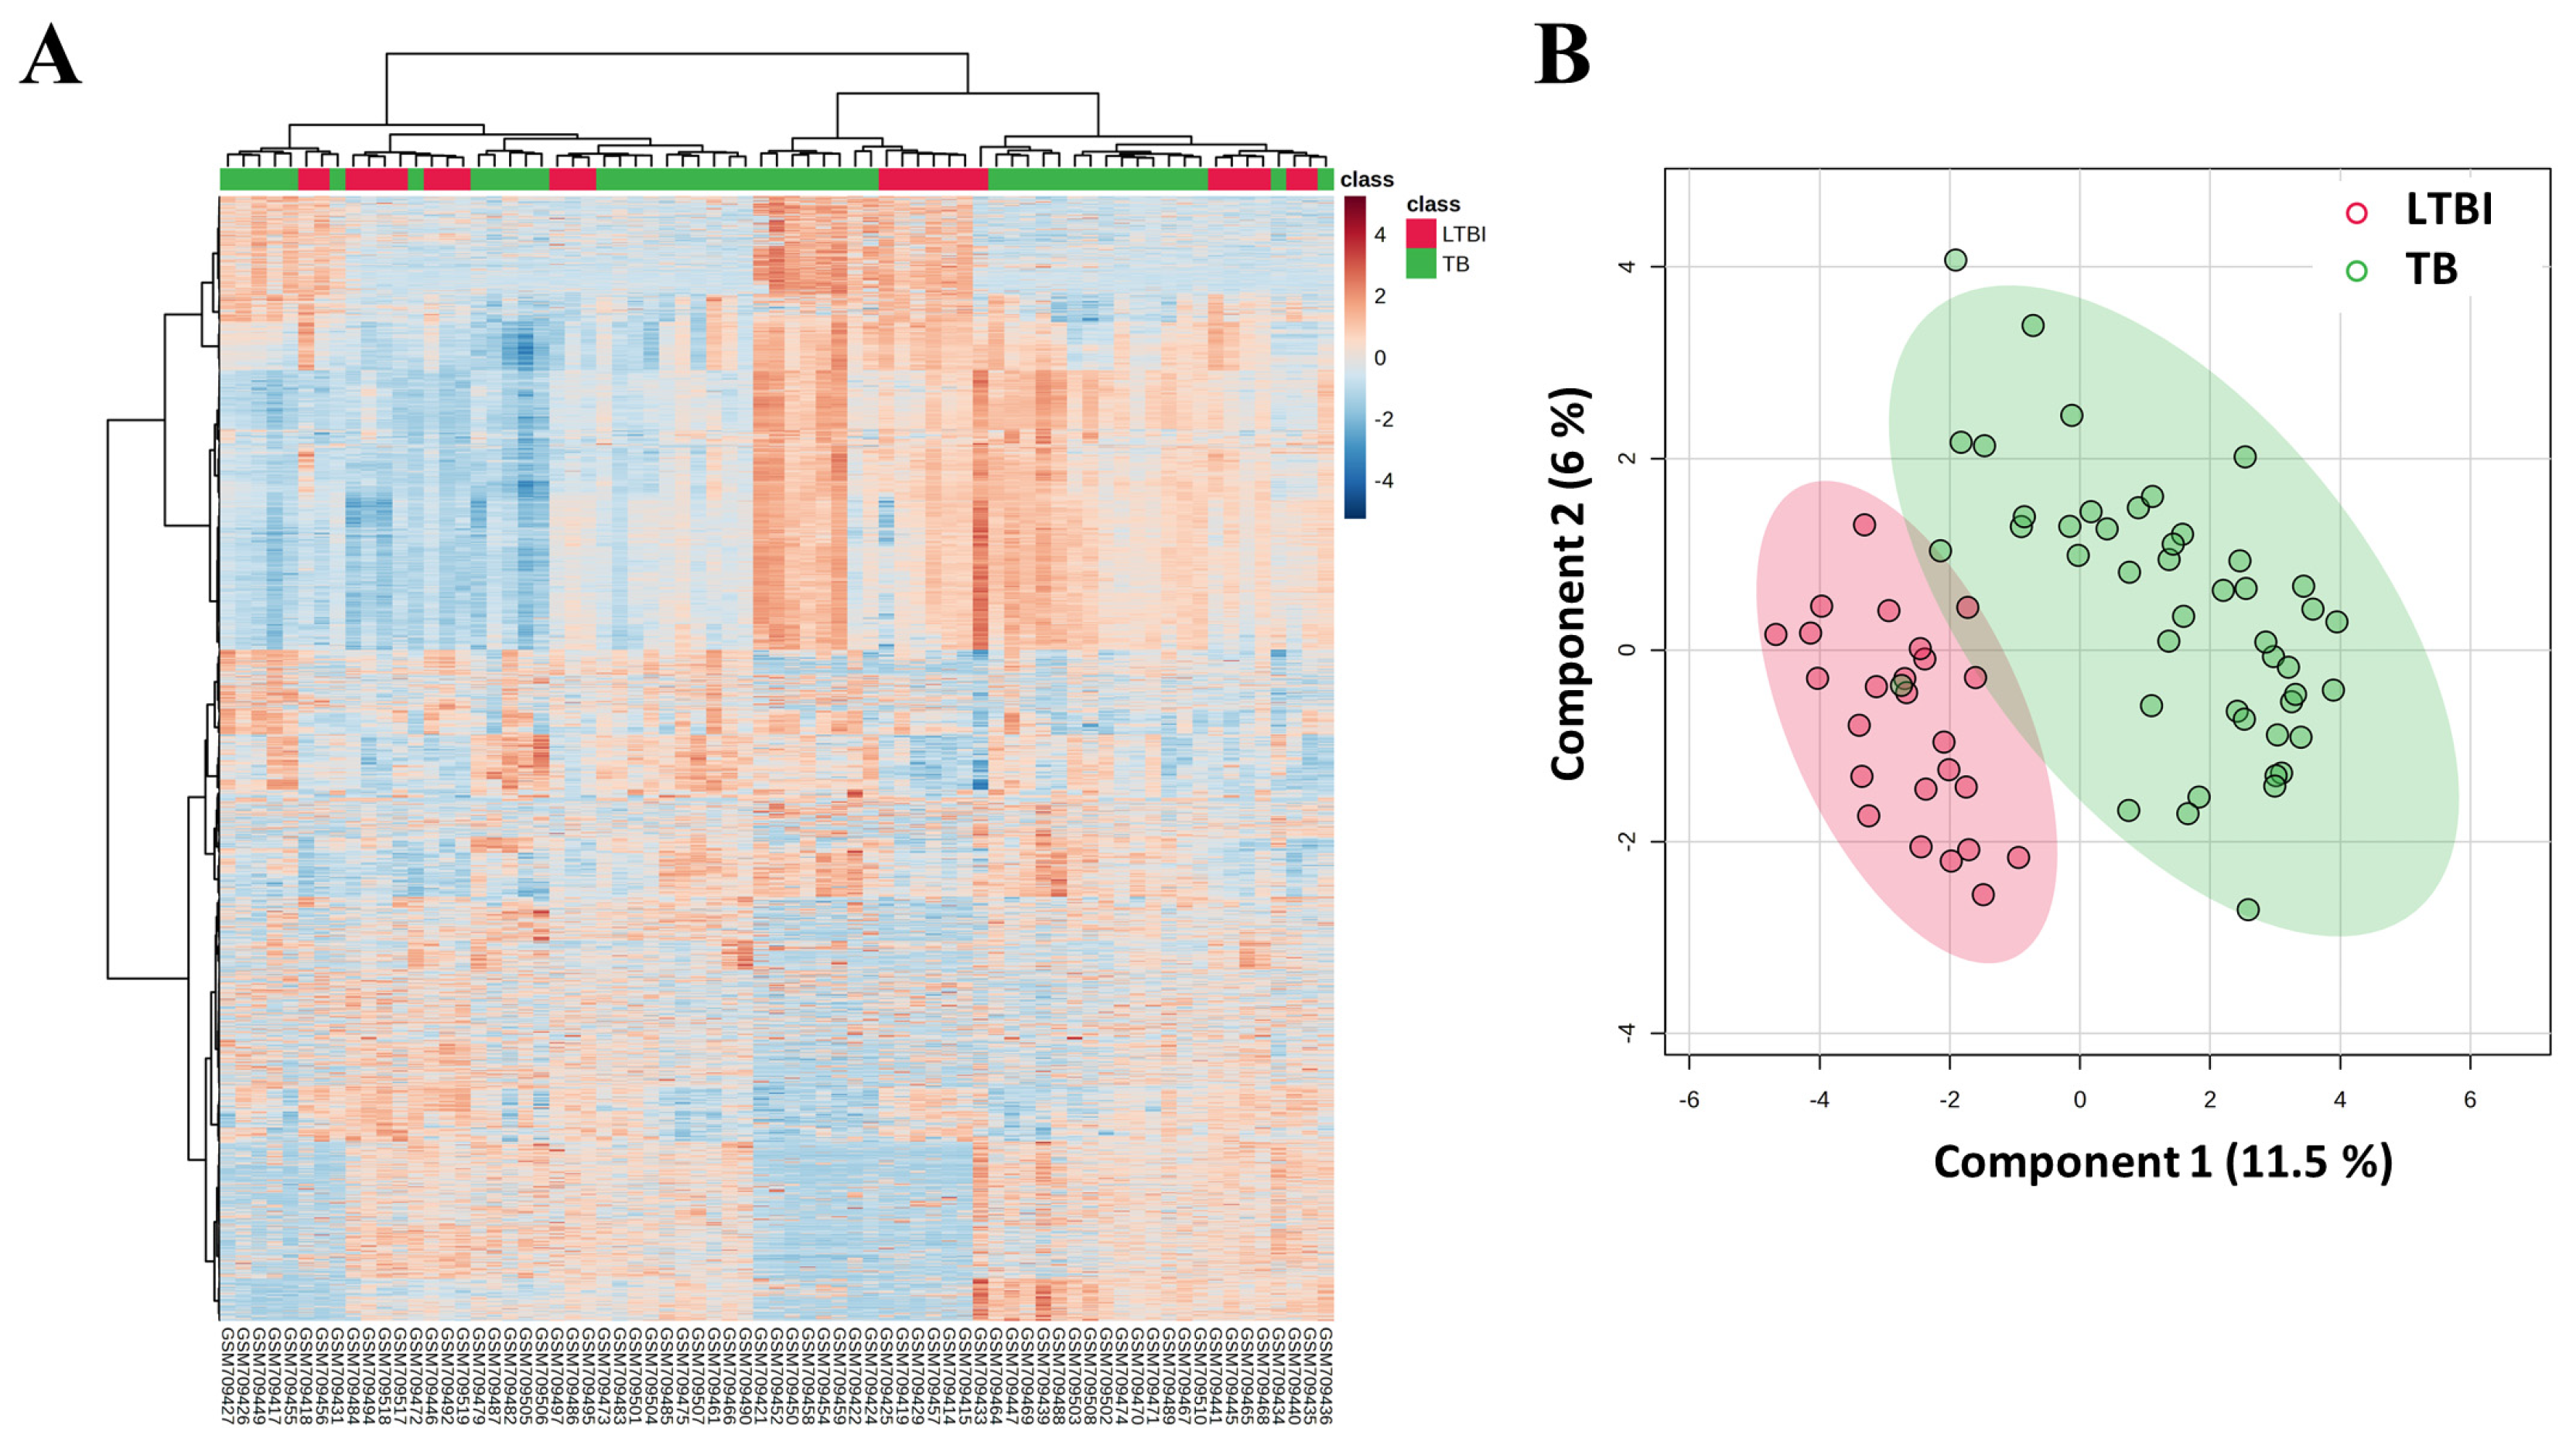
3.1. Gene Expression Analysis and Group Clustering
3.2. Changes in Immune Characteristics Between LTBI and TB Groups
3.3. Gene Set Enrichment Analysis (GSEA) and Ferroptosis Correlation with TB
3.4. Identification of DEGs Using GEO2R
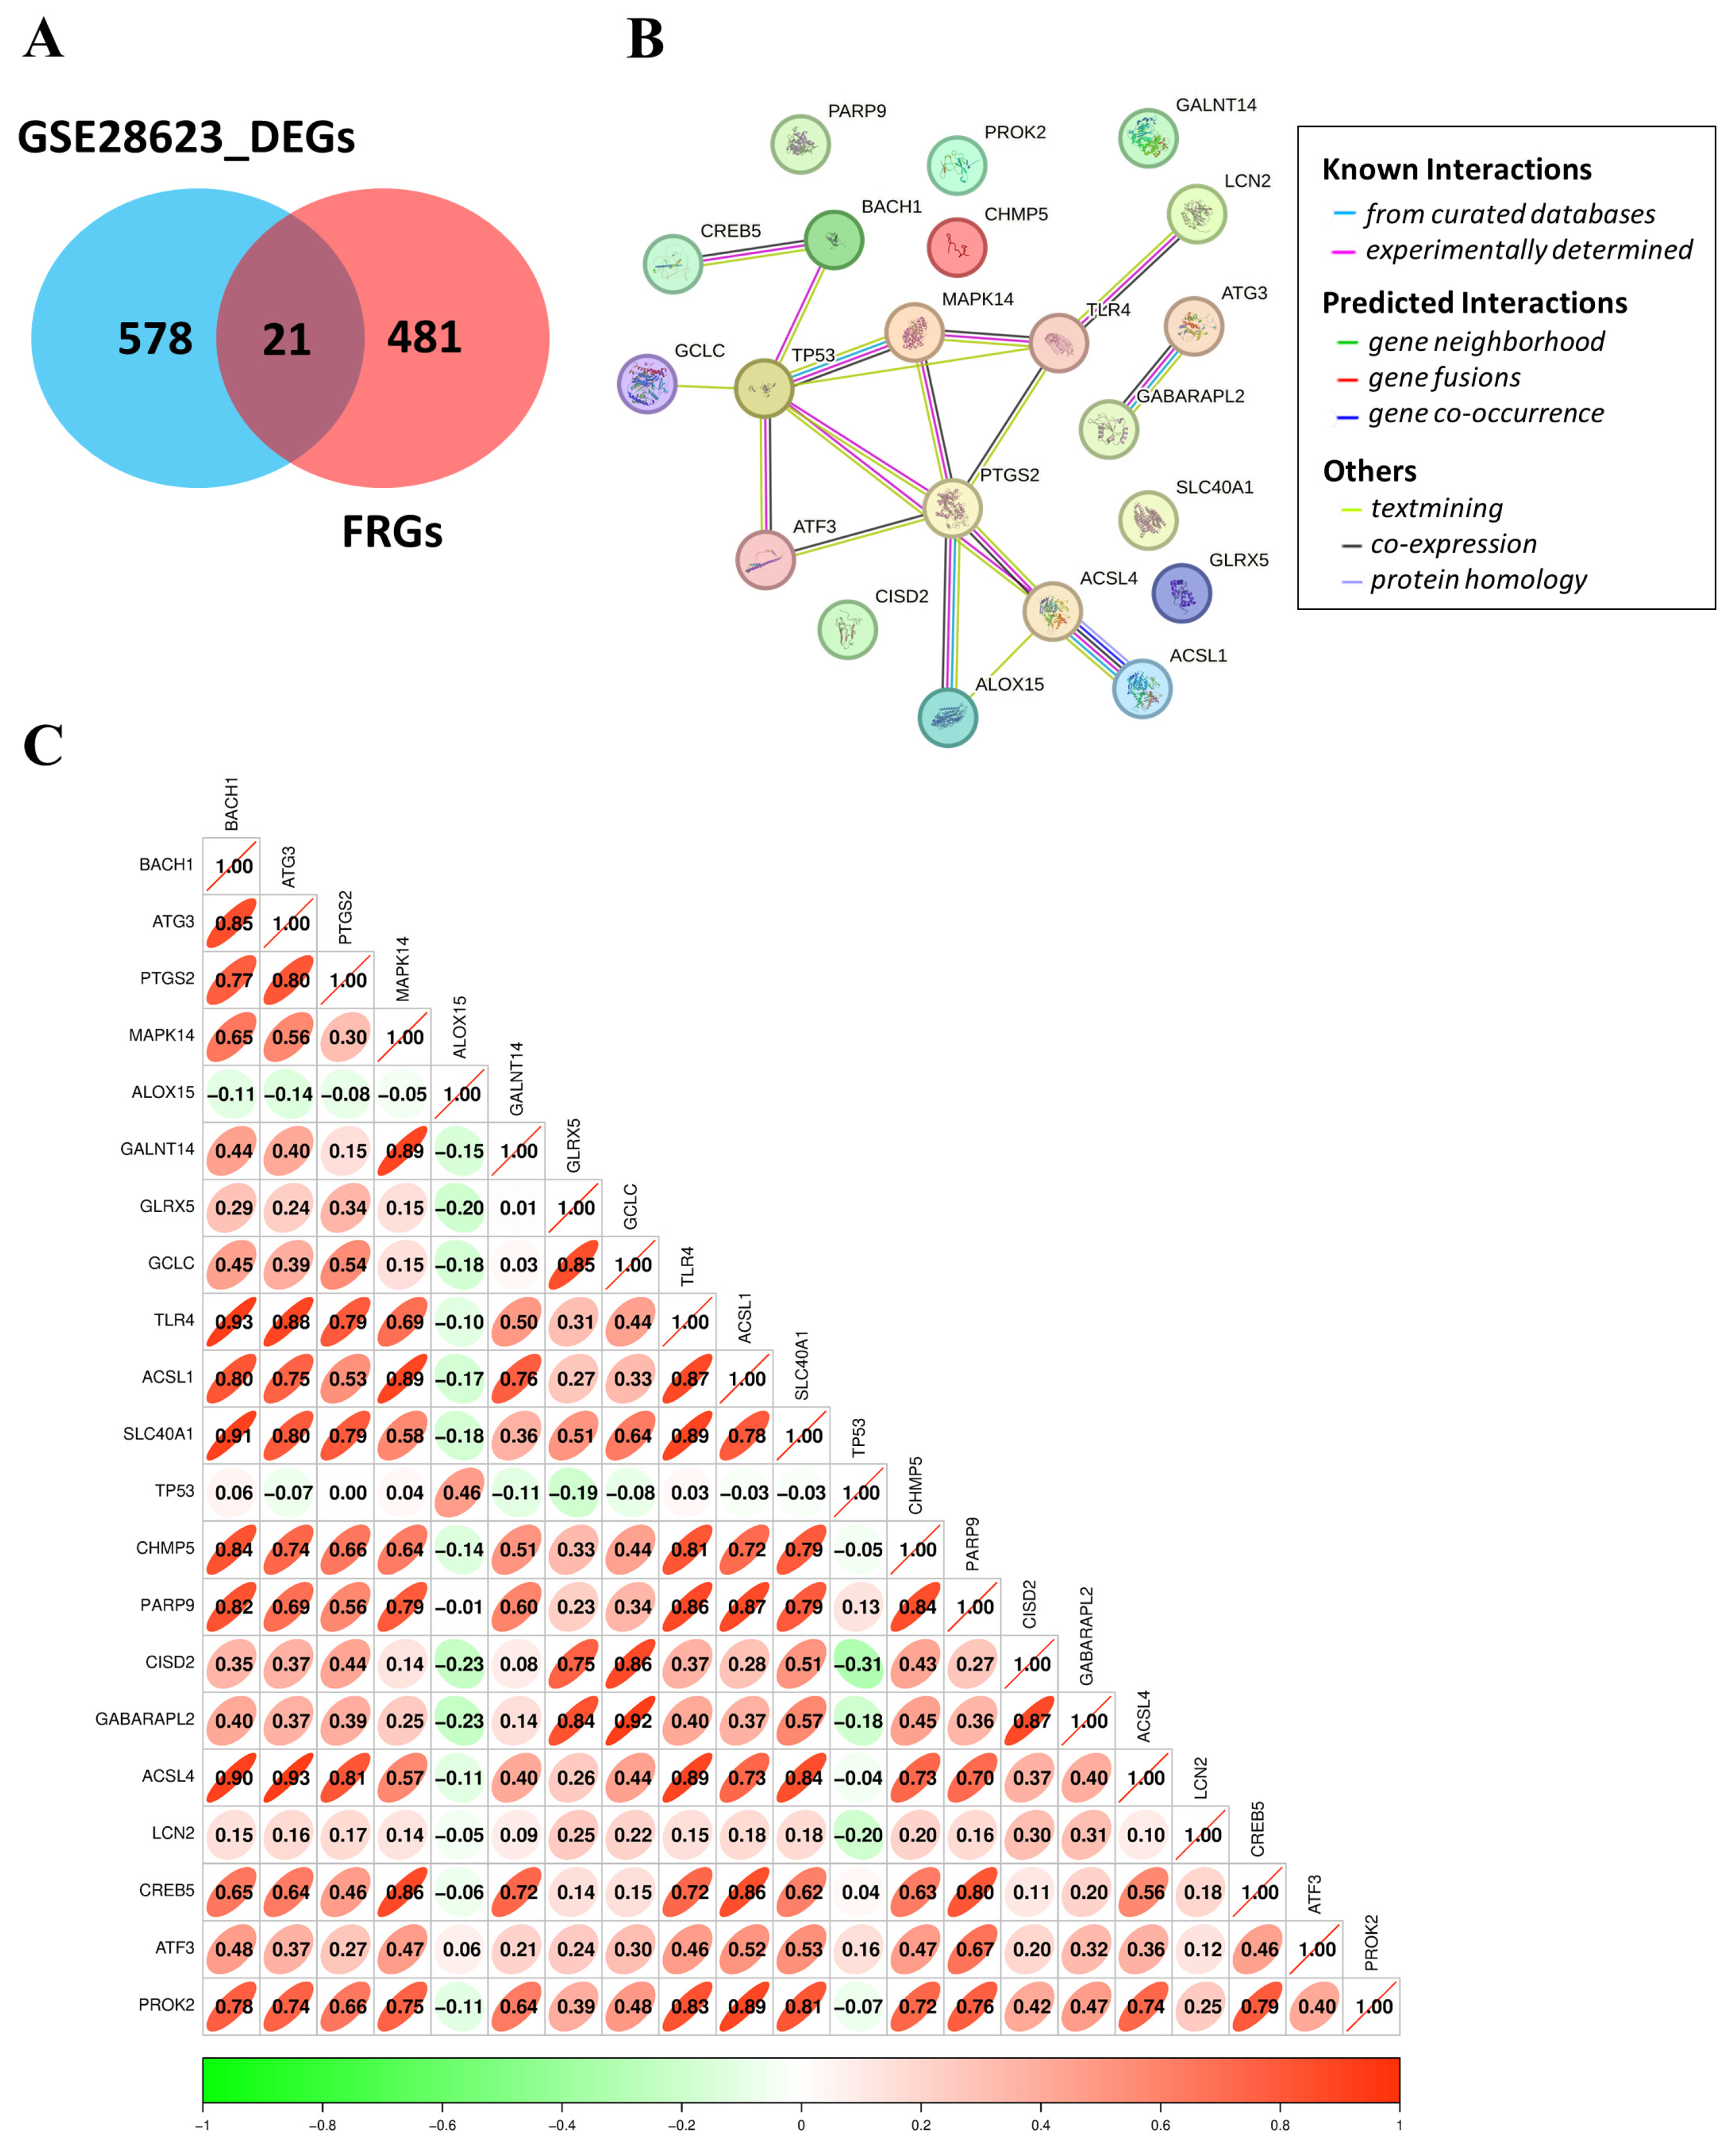
3.5. Identification, Interaction, and Correlation Analysis of FR-DEGs in TB
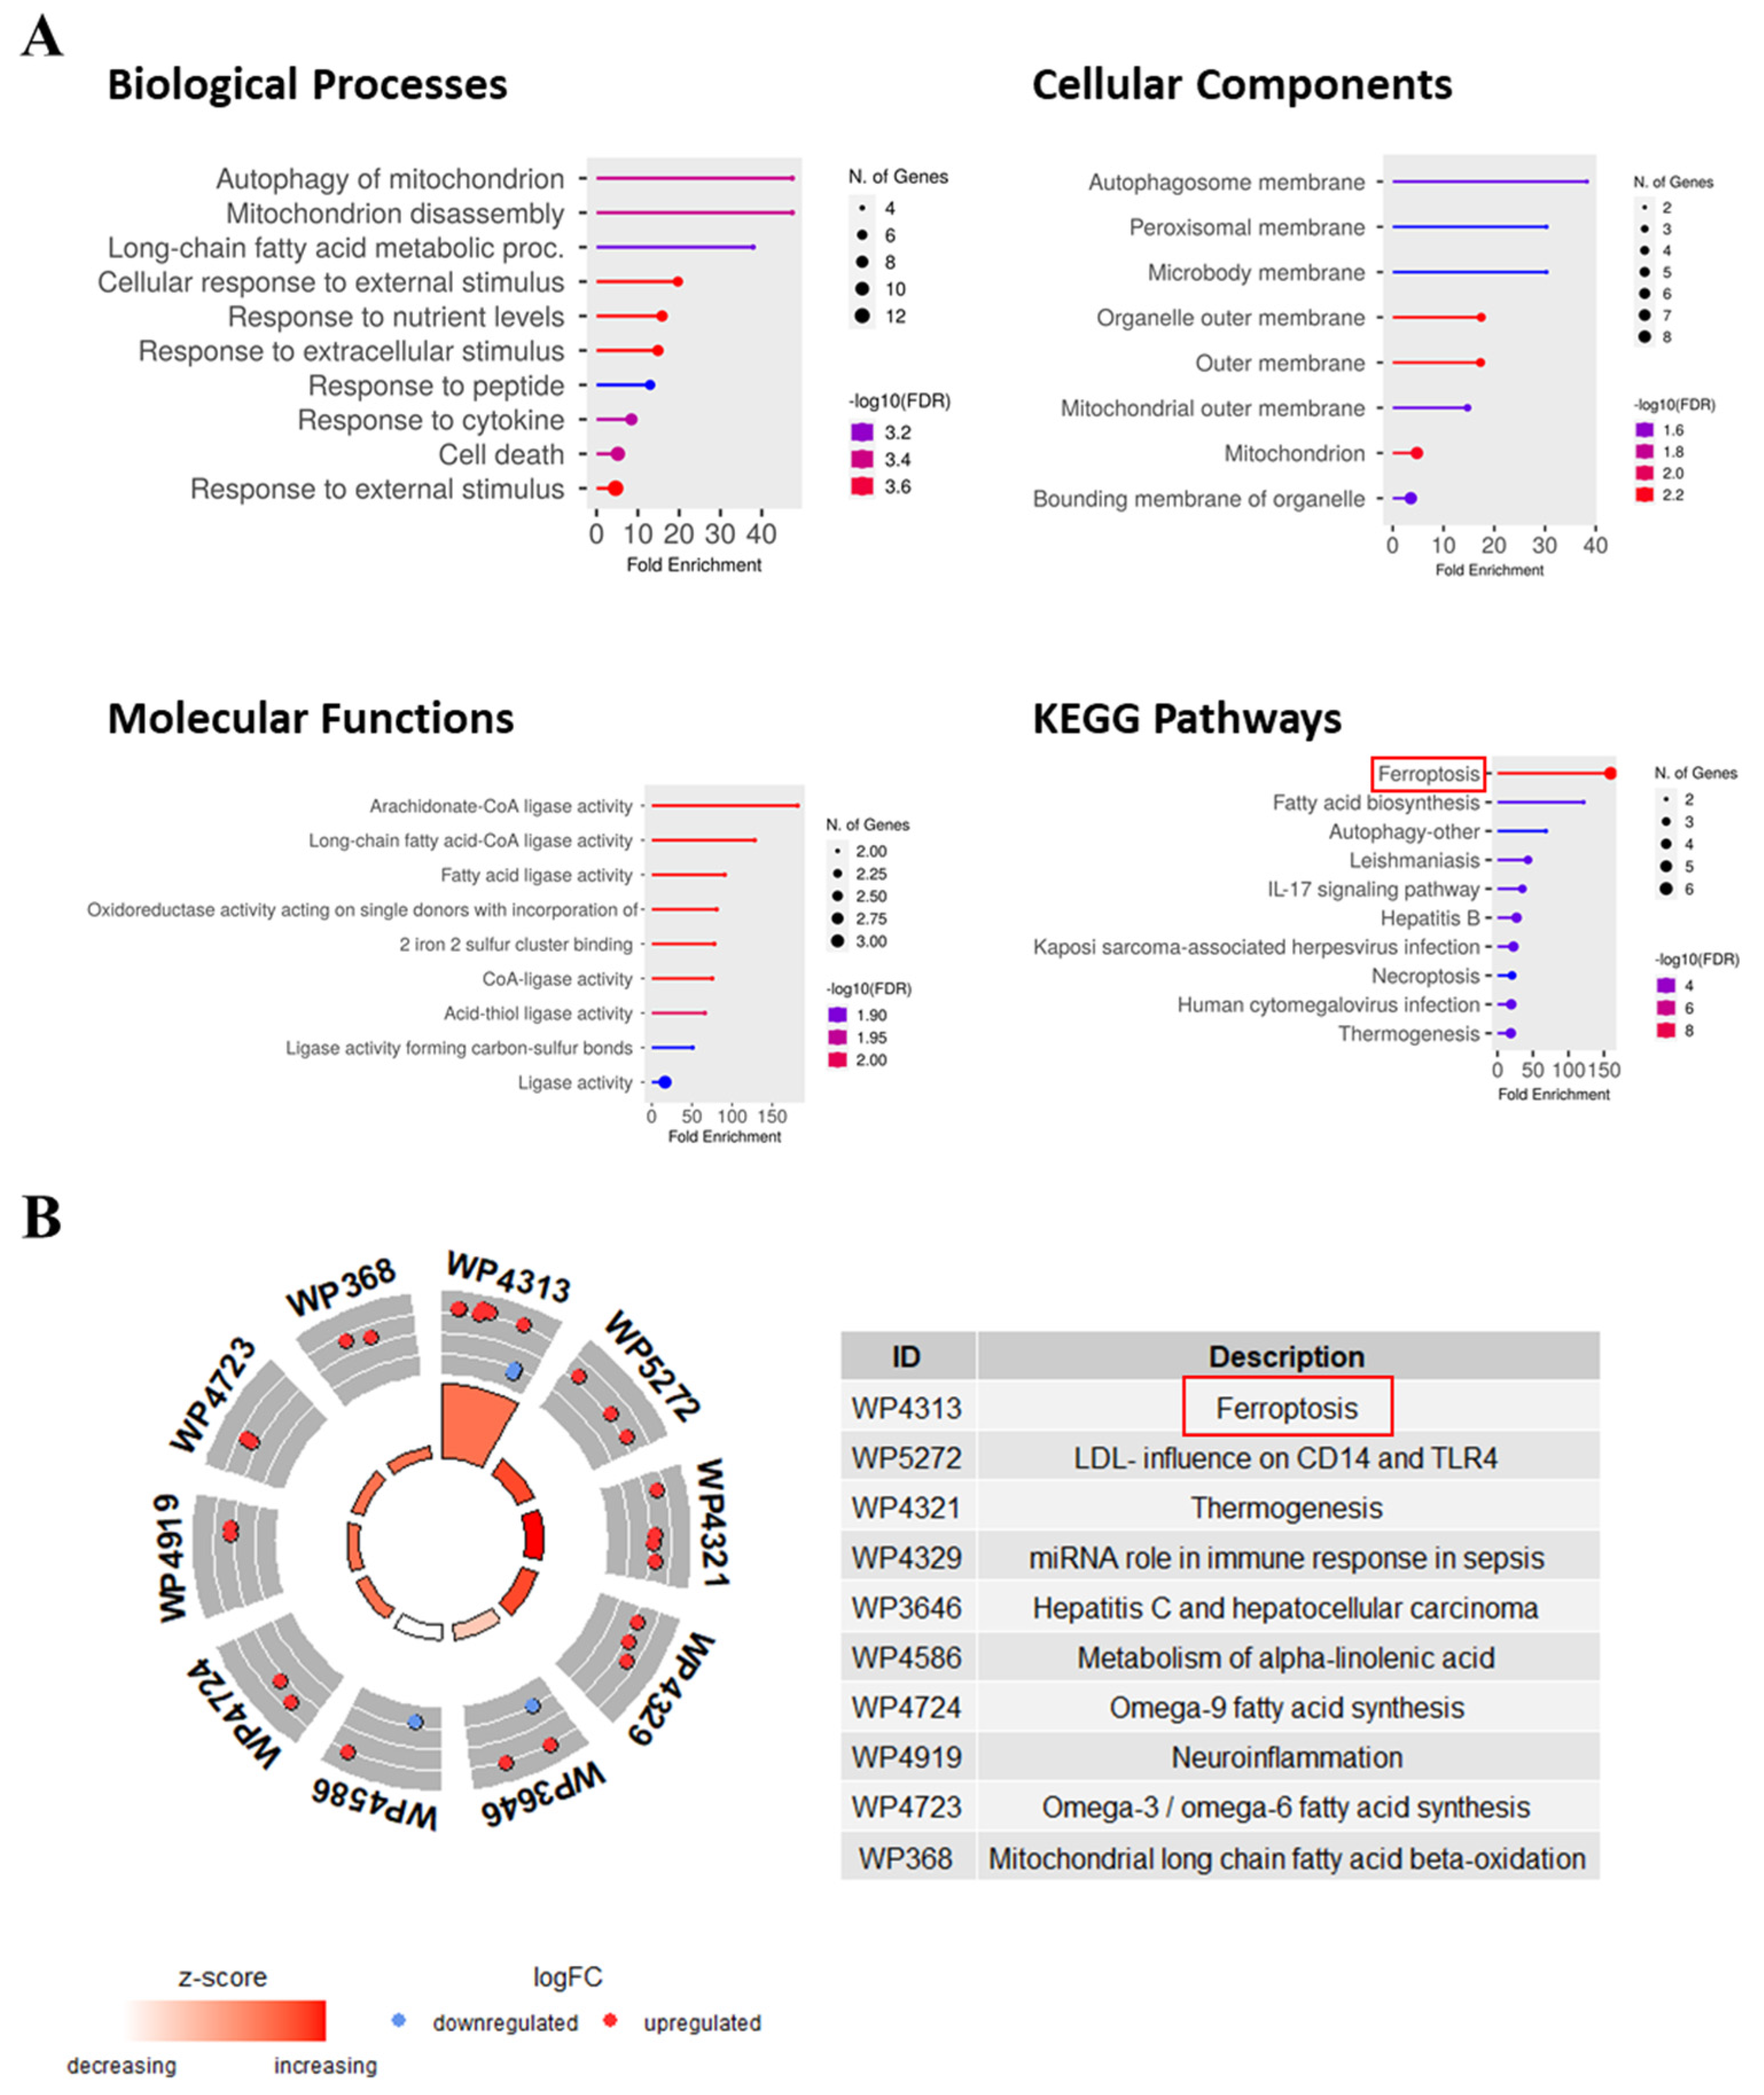
3.6. Pathway and Functional Annotations of FR-DEGs
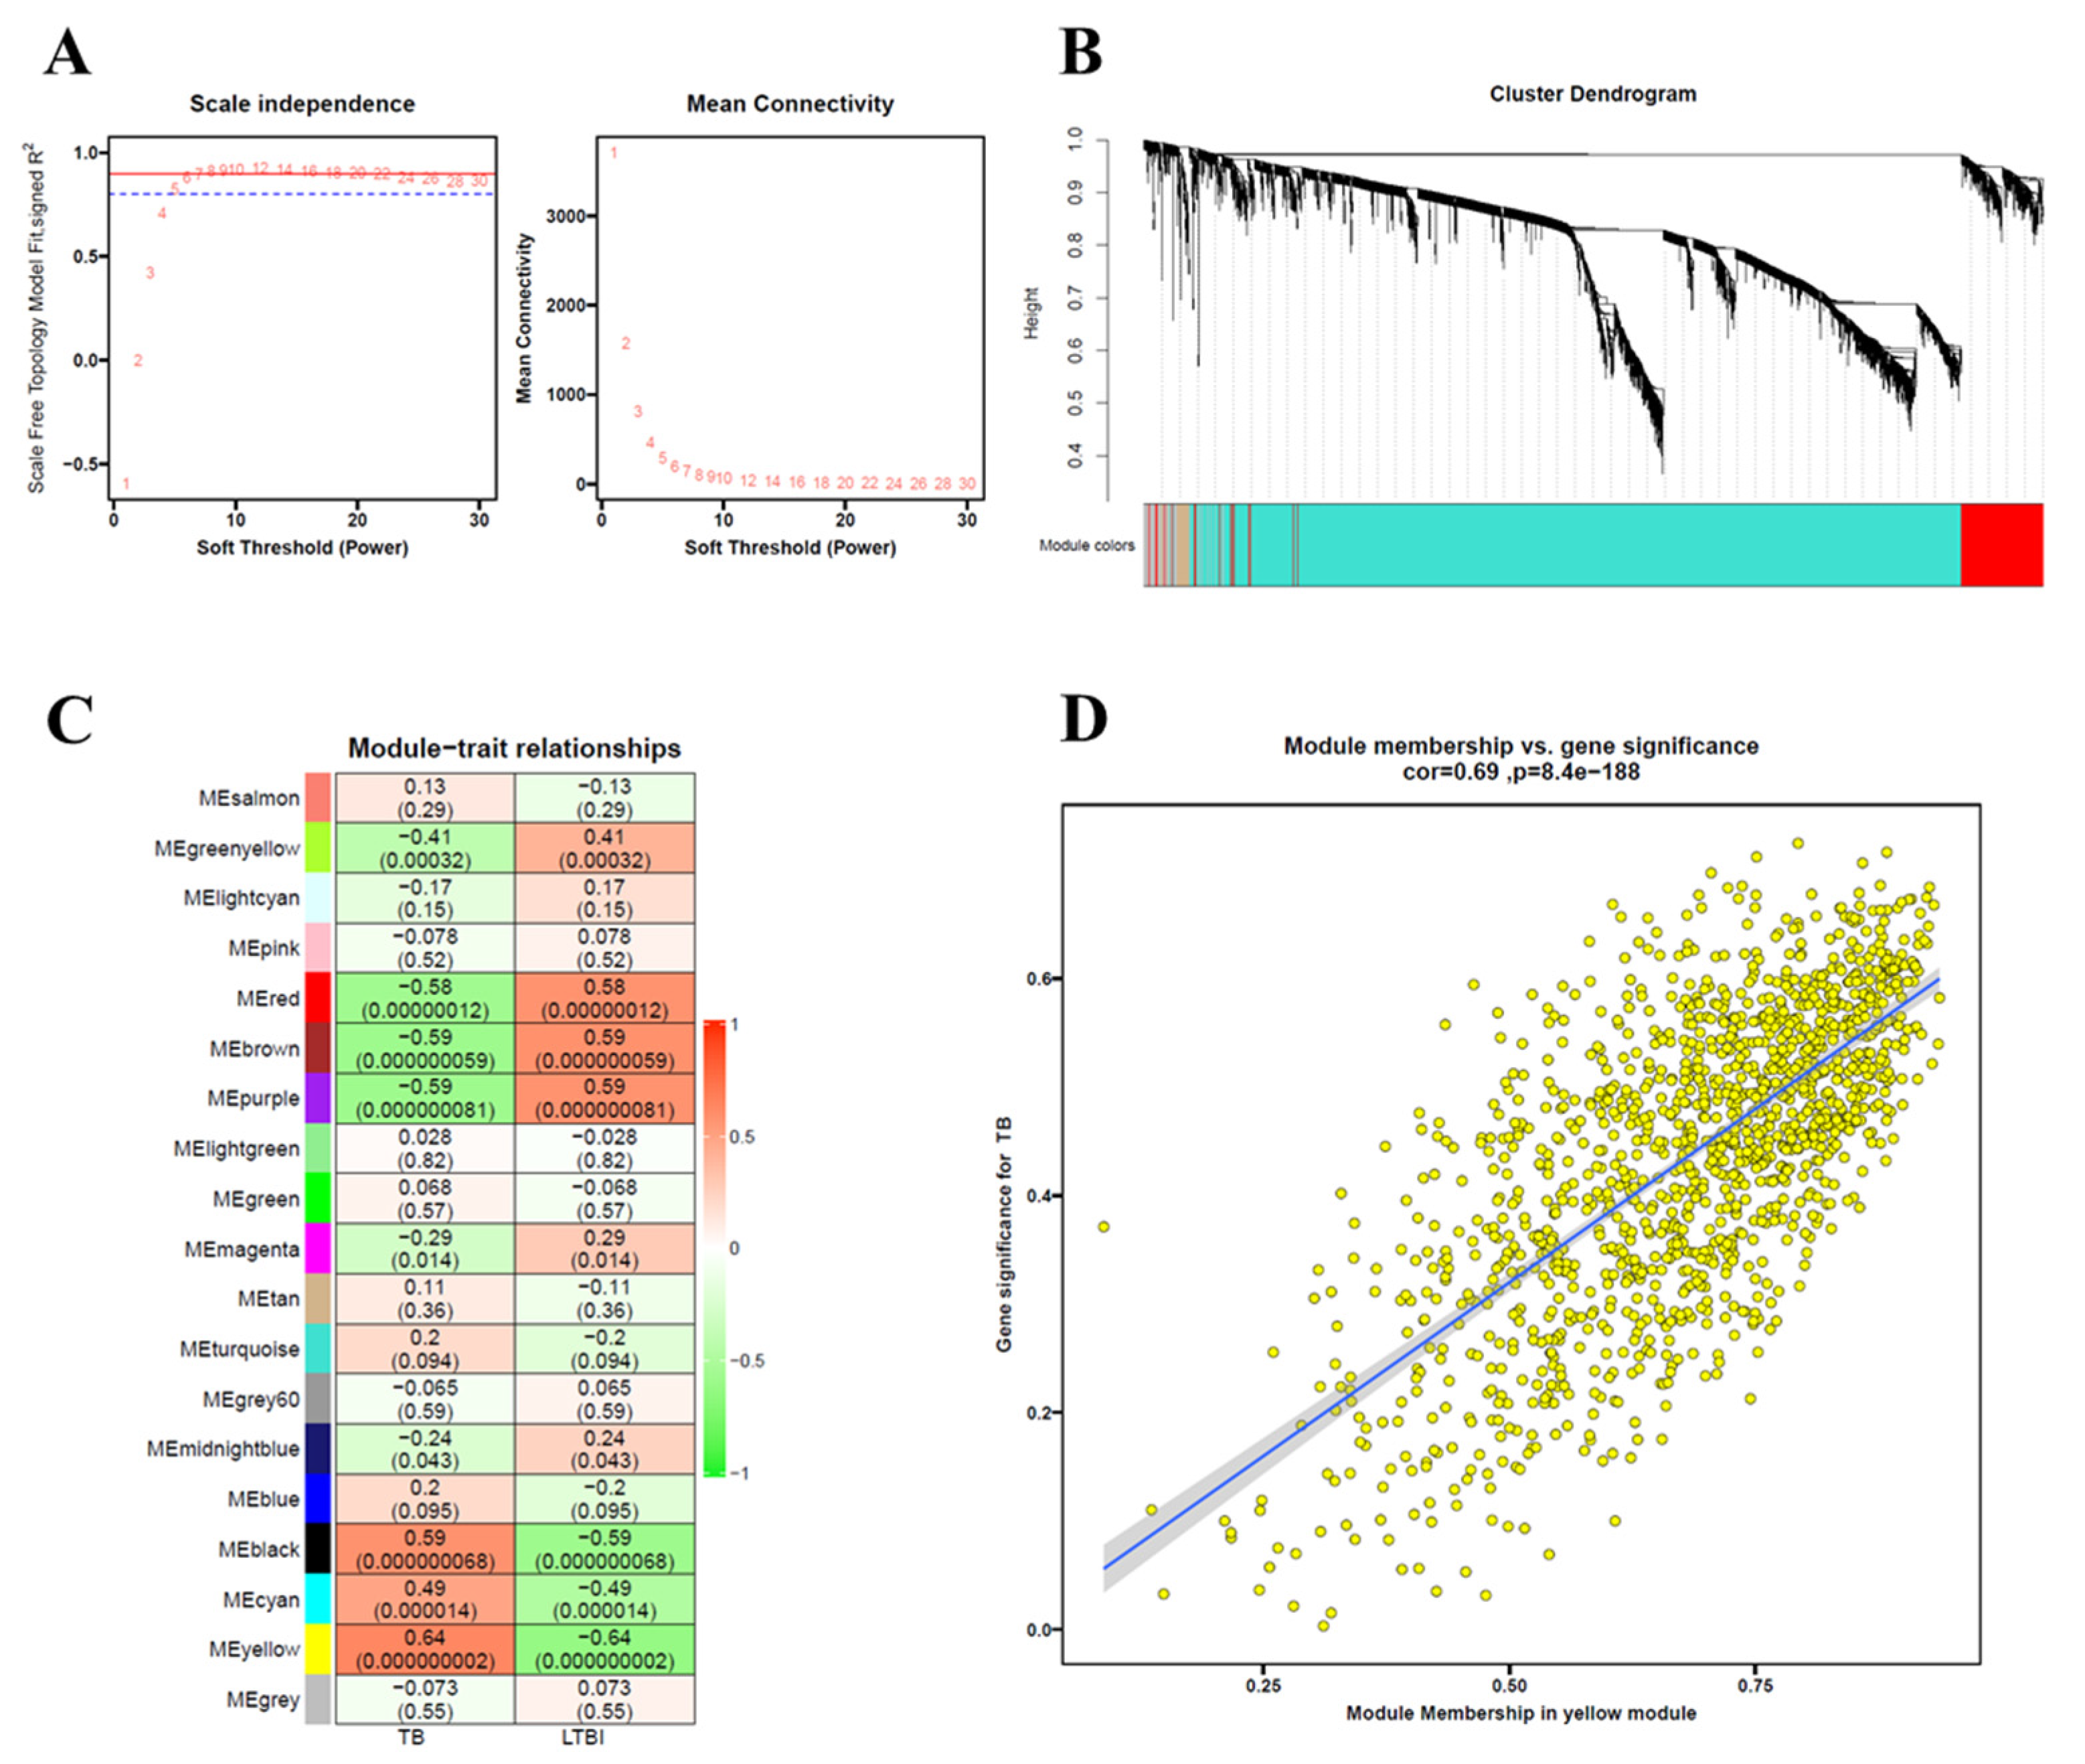
3.7. Identification of Key Modules Related to TB Using WGCNA
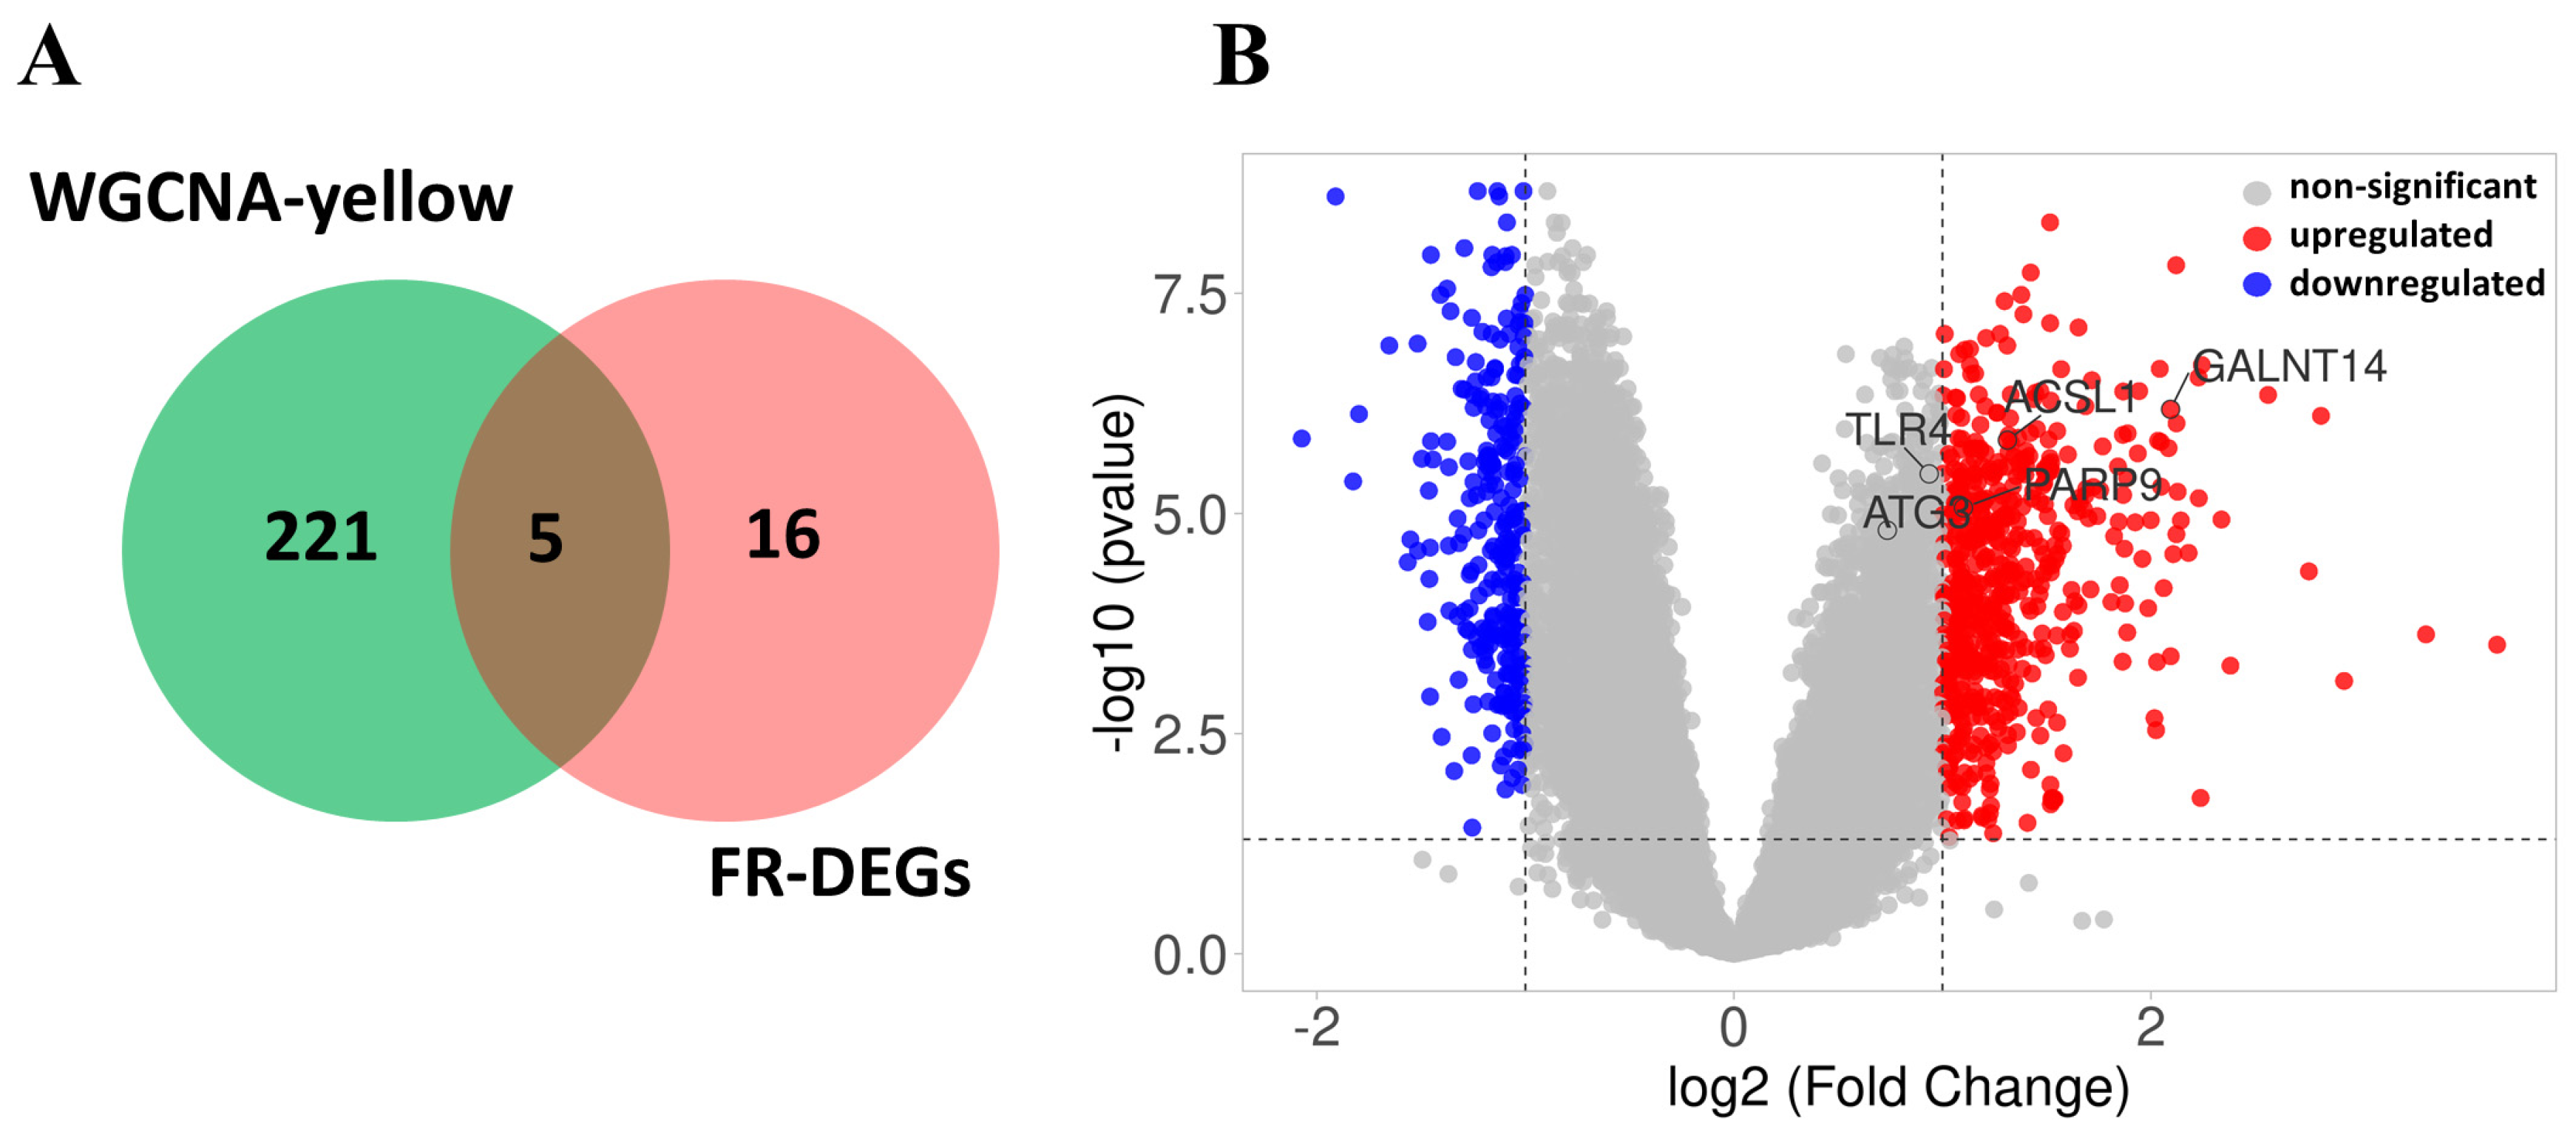
3.8. Identification of FR-DEGs in the Yellow Module
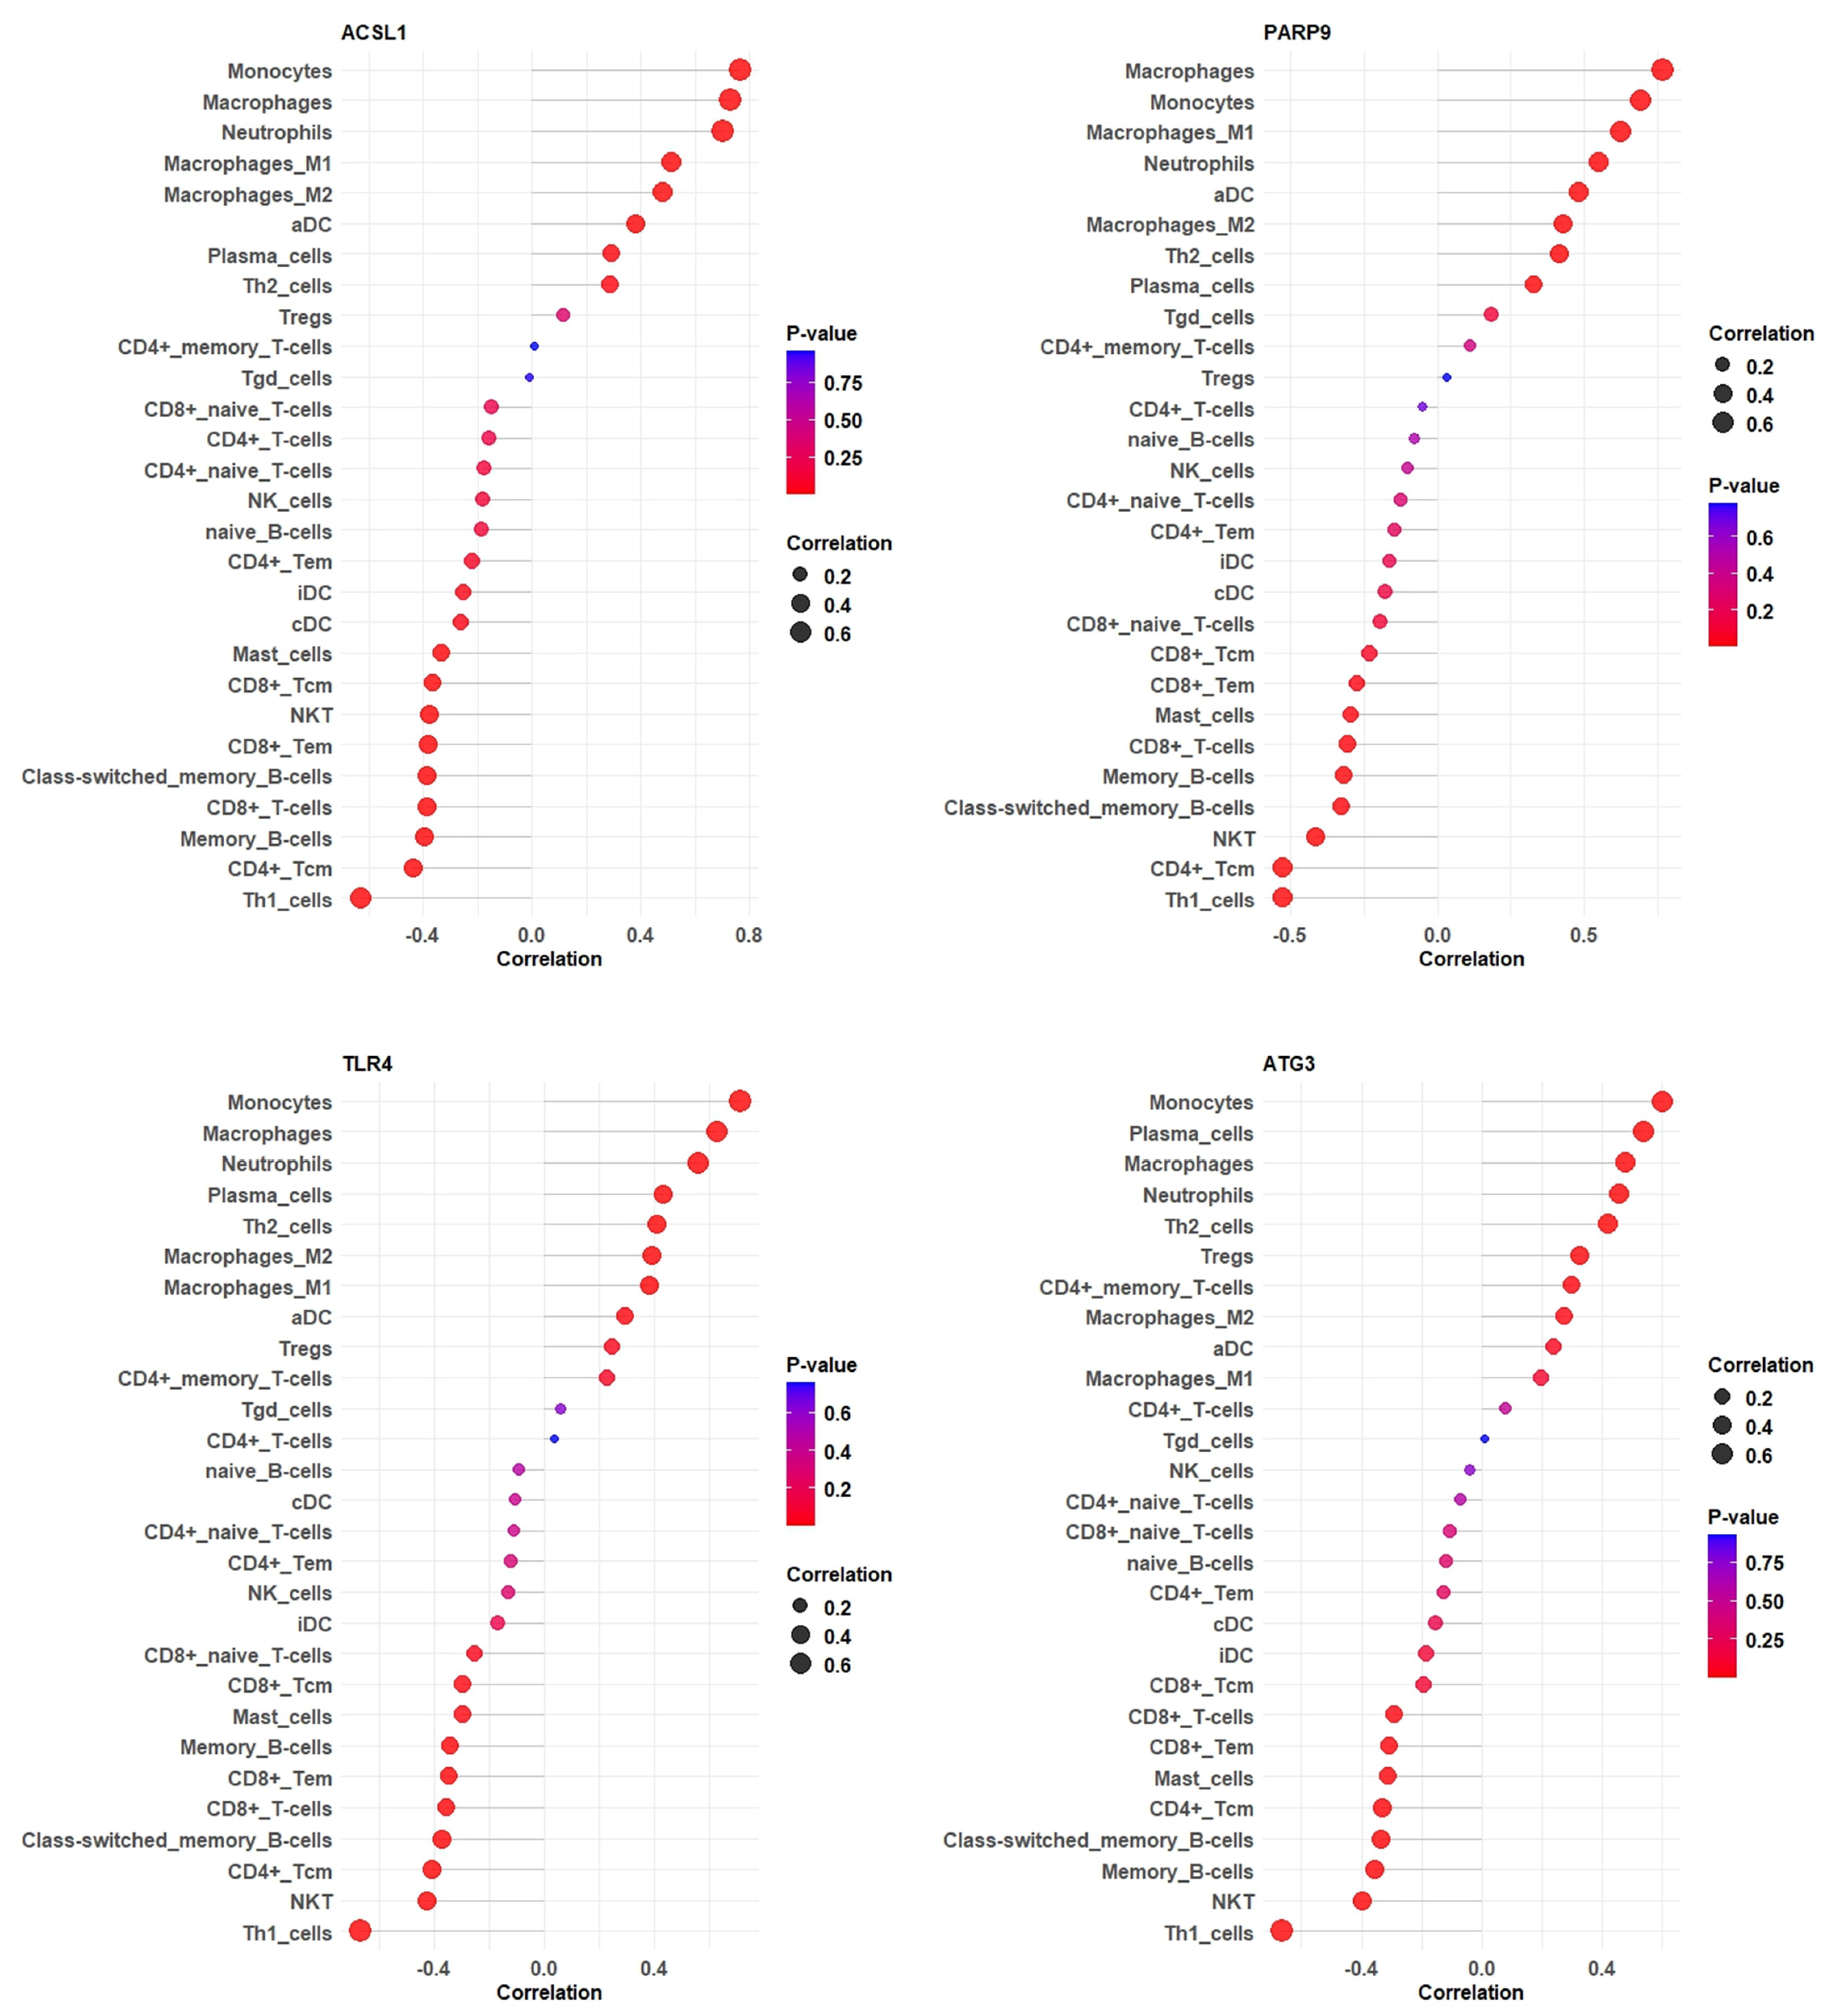
3.9. Correlation Between Hub Gene Expression and Immune Cell Infiltration Levels of GSE28623
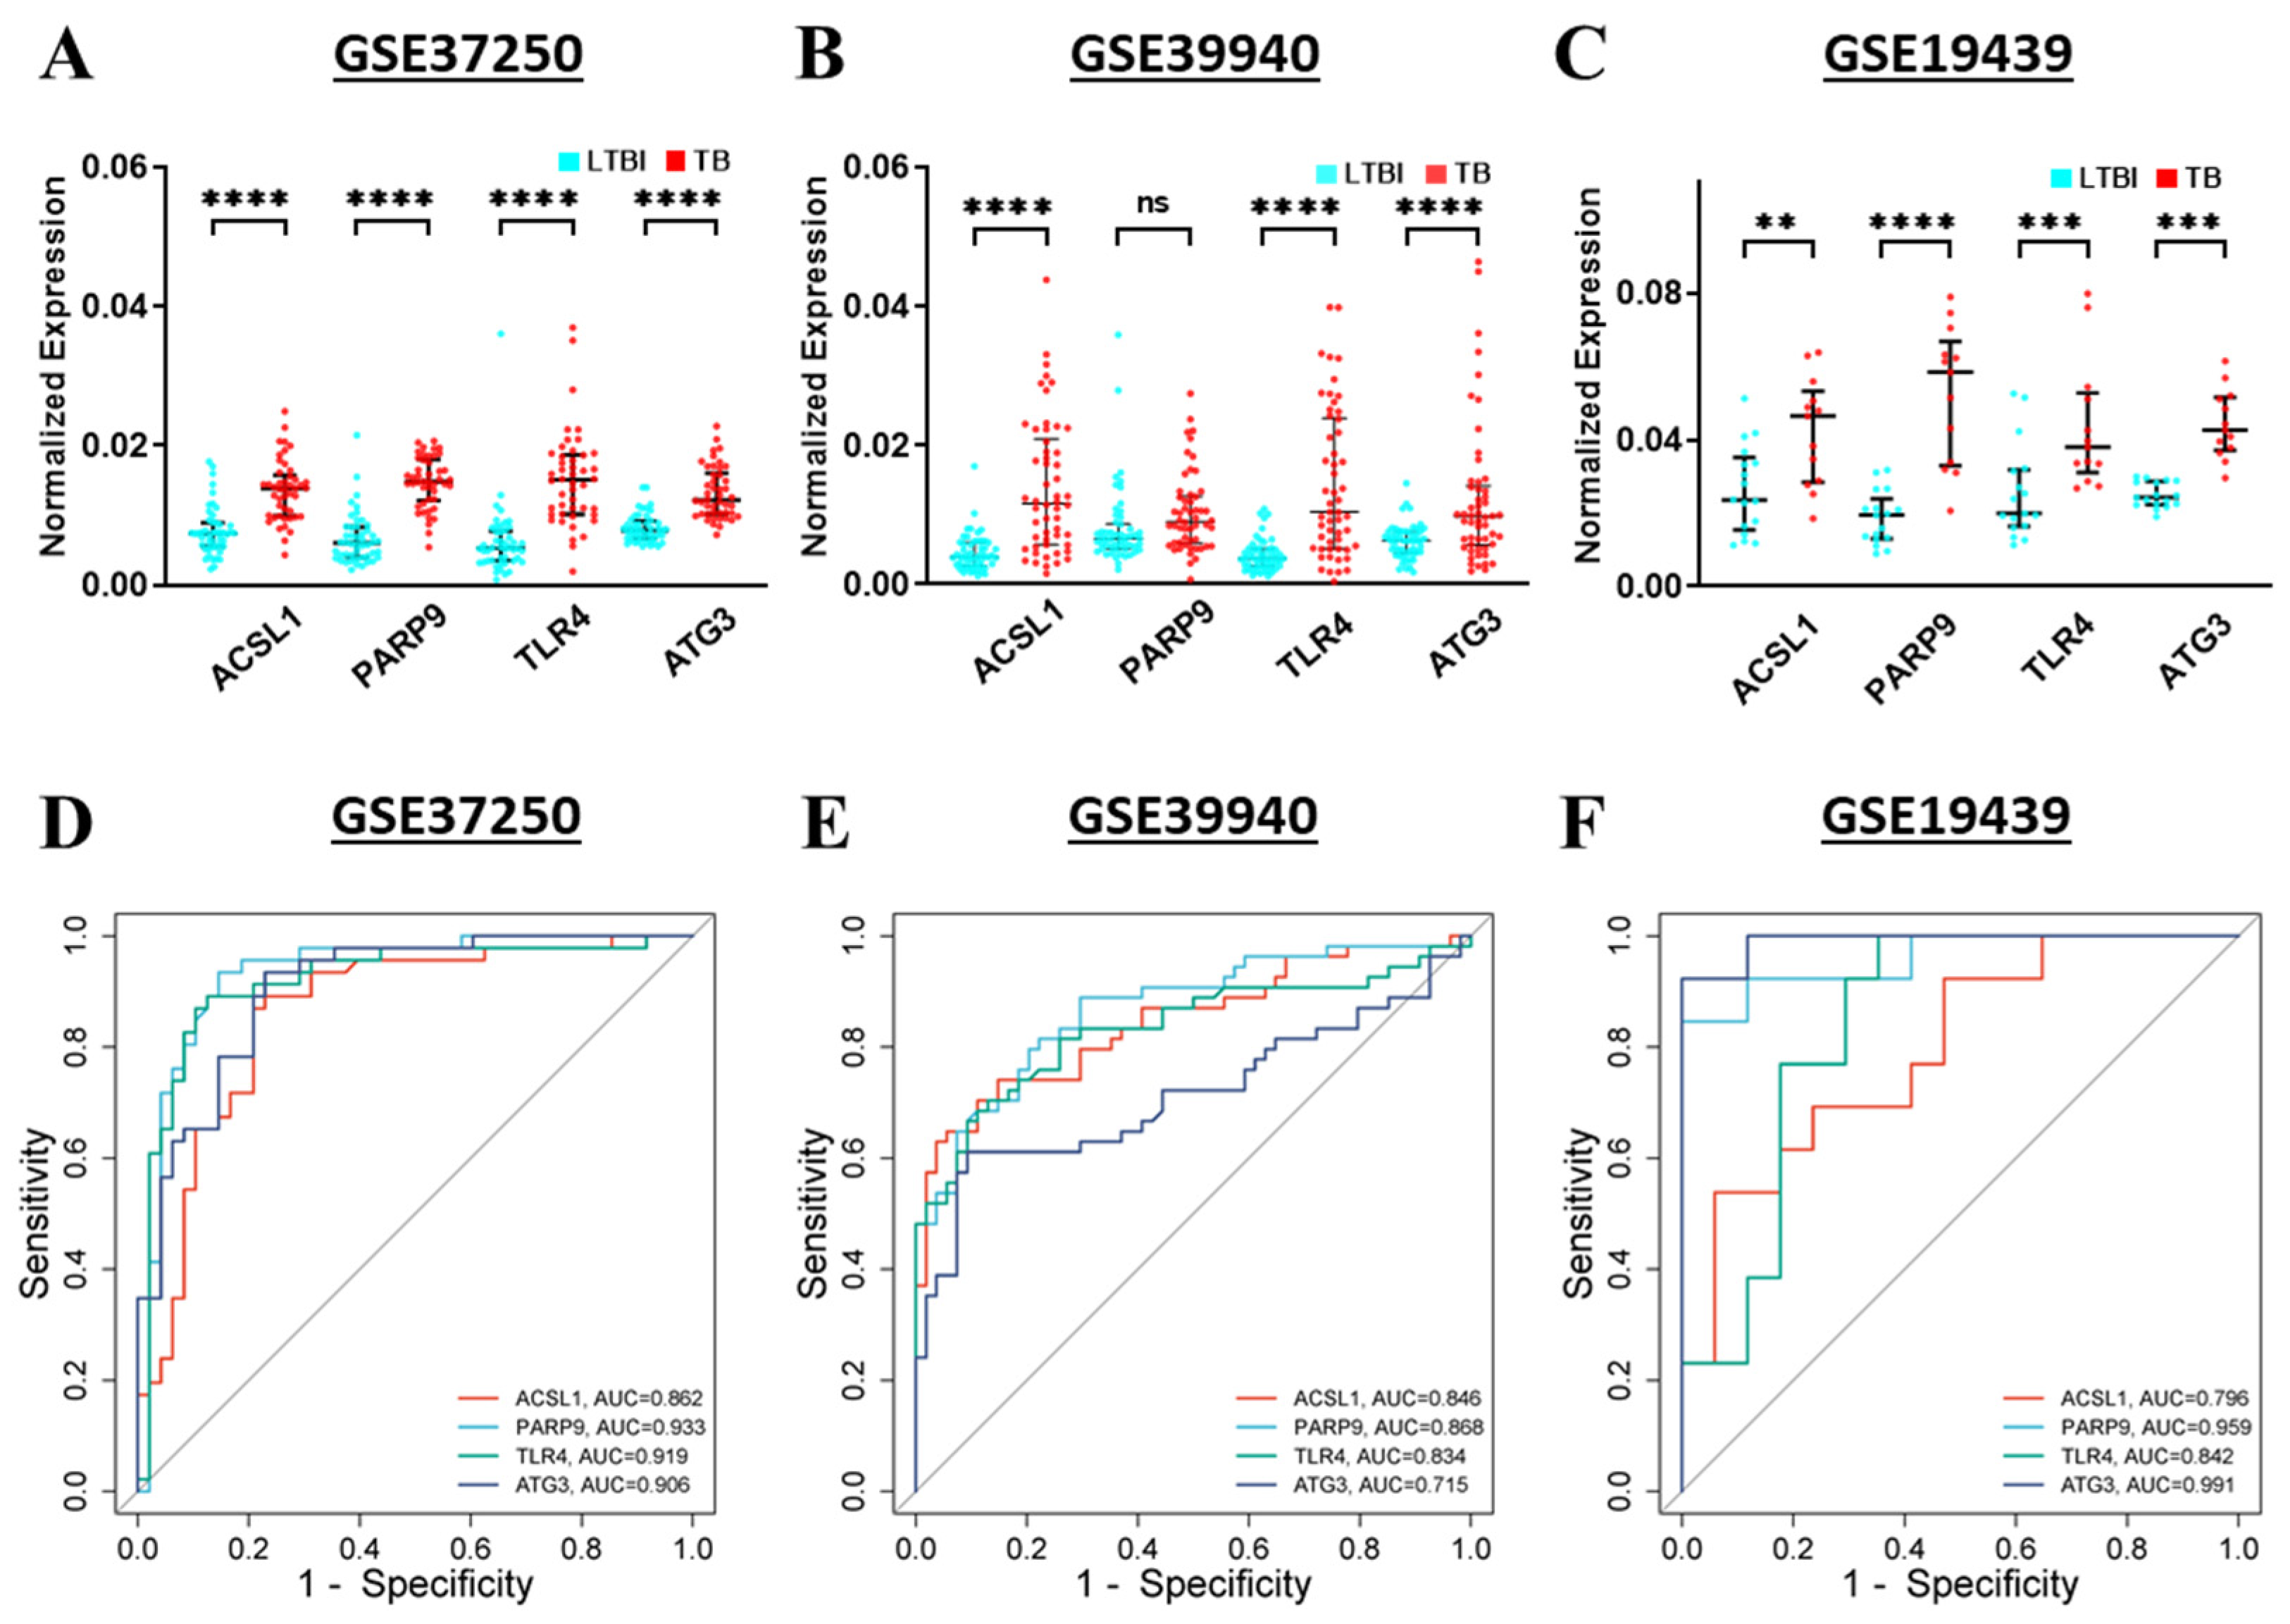
3.10. Validation and Diagnostic Value of Hub Genes in TB and LTBI
4. Discussion
5. Conclusions
Supplementary Materials
Author Contributions
Funding
Institutional Review Board Statement
Informed Consent Statement
Data Availability Statement
Conflicts of Interest
References
- WHO. Global Tuberculosis Report 2024; World Health Organization: Geneva, Switzerland, 2024. [Google Scholar]
- Turner, C.T.; Gupta, R.K.; Tsaliki, E.; Roe, J.K.; Mondal, P.; Nyawo, G.R.; Palmer, Z.; Miller, R.F.; Reeve, B.W.; Theron, G.; et al. Blood Transcriptional Biomarkers for Active Pulmonary Tuberculosis in a High-Burden Setting: A Prospective, Observational, Diagnostic Accuracy Study. Lancet Respir. Med. 2020, 8, 407–419. [Google Scholar] [CrossRef] [PubMed]
- Chandra, P.; Grigsby, S.J.; Philips, J.A. Immune Evasion and Provocation by Mycobacterium tuberculosis. Nat. Rev. Microbiol. 2022, 20, 750–766. [Google Scholar] [CrossRef]
- Nisa, A.; Kipper, F.C.; Panigrahy, D.; Tiwari, S.; Kupz, A.; Subbian, S. Different Modalities of Host Cell Death and Their Impact on Mycobacterium tuberculosis Infection. Am. J. Physiol.-Cell Physiol. 2022, 323, C1444–C1474. [Google Scholar] [CrossRef] [PubMed]
- Cui, Y.; Tang, Y.; Shao, M.; Zang, X.; Jiang, Y.; Cui, Z.; Dang, G.; Liu, S. Mycobacterium tuberculosis Protease Rv3090 Is Associated with Late Cell Apoptosis and Participates in Organ Injuries and Mycobacterial Dissemination in Mice. Microb. Pathog. 2022, 173, 105880. [Google Scholar] [CrossRef]
- Stockwell, B.R.; Friedmann Angeli, J.P.; Bayir, H.; Bush, A.I.; Conrad, M.; Dixon, S.J.; Fulda, S.; Gascón, S.; Hatzios, S.K.; Kagan, V.E.; et al. Ferroptosis: A Regulated Cell Death Nexus Linking Metabolism, Redox Biology, and Disease. Cell 2017, 171, 273–285. [Google Scholar] [CrossRef]
- Hirschhorn, T.; Stockwell, B.R. The Development of the Concept of Ferroptosis. Free Radic. Biol. Med. 2019, 133, 130–143. [Google Scholar] [CrossRef]
- Amaral, E.P.; Costa, D.L.; Namasivayam, S.; Riteau, N.; Kamenyeva, O.; Mittereder, L.; Mayer-Barber, K.D.; Andrade, B.B.; Sher, A. A Major Role for Ferroptosis in Mycobacterium tuberculosis—Induced Cell Death and Tissue Necrosis. J. Exp. Med. 2019, 216, 556–570. [Google Scholar] [CrossRef] [PubMed]
- Paik, S.; Kim, J.K.; Chung, C.; Jo, E.-K. Autophagy: A New Strategy for Host-Directed Therapy of Tuberculosis. Virulence 2019, 10, 448–459. [Google Scholar] [CrossRef]
- Lam, A.; Prabhu, R.; Gross, C.M.; Riesenberg, L.A.; Singh, V.; Aggarwal, S. Role of Apoptosis and Autophagy in Tuberculosis. Am. J. Physiol.-Lung Cell. Mol. Physiol. 2017, 313, L218–L229. [Google Scholar] [CrossRef]
- Yang, B.; Zhai, F.; Li, Z.; Wang, X.; Deng, X.; Cao, Z.; Liu, Y.; Wang, R.; Jiang, J.; Cheng, X. Identification of Ferroptosis-Related Gene Signature for Tuberculosis Diagnosis and Therapy Efficacy. iScience 2024, 27, 110182. [Google Scholar] [CrossRef]
- Chen, L.; Hua, J.; Dai, X.; He, X. Assessment of Ferroptosis-Associated Gene Signatures as Potential Biomarkers for Differentiating Latent from Active Tuberculosis in Children. Microb. Genom. 2023, 9, 000997. [Google Scholar] [CrossRef] [PubMed]
- Wufuer, D.; Li, Y.; Aierken, H.; Zheng, J. Bioinformatics-Led Discovery of Ferroptosis-Associated Diagnostic Biomarkers and Molecule Subtypes for Tuberculosis Patients. Eur. J. Med. Res. 2023, 28, 445. [Google Scholar] [CrossRef] [PubMed]
- Zhang, W.; Zhu, D.; Jiang, H.; Wang, L. Identification of Ferroptosis-Related Key Genes in Tuberculosis by Bioinformatics Methods. AMB Express. 2025, 15, 31. [Google Scholar] [CrossRef] [PubMed]
- Arya, R.; Shakya, H.; Chaurasia, R.; Kumar, S.; Vinetz, J.M.; Kim, J.J. Computational Reassessment of RNA-Seq Data Reveals Key Genes in Active Tuberculosis. PLoS ONE 2024, 19, e0305582. [Google Scholar] [CrossRef]
- Elliott, T.O.J.P.; Owolabi, O.; Donkor, S.; Kampmann, B.; Hill, P.C.; Ottenhoff, T.H.M.; Haks, M.C.; Kaufmann, S.H.E.; Maertzdorf, J.; Sutherland, J.S. Dysregulation of Apoptosis Is a Risk Factor for Tuberculosis Disease Progression. J. Infect. Dis. 2015, 212, 1469–1479. [Google Scholar] [CrossRef]
- Kaforou, M.; Wright, V.J.; Oni, T.; French, N.; Anderson, S.T.; Bangani, N.; Banwell, C.M.; Brent, A.J.; Crampin, A.C.; Dockrell, H.M.; et al. Detection of Tuberculosis in HIV-Infected and -Uninfected African Adults Using Whole Blood RNA Expression Signatures: A Case-Control Study. PLoS Med. 2013, 10, e1001538. [Google Scholar] [CrossRef]
- Anderson, S.T.; Kaforou, M.; Brent, A.J.; Wright, V.J.; Banwell, C.M.; Chagaluka, G.; Crampin, A.C.; Dockrell, H.M.; French, N.; Hamilton, M.S.; et al. Diagnosis of Childhood Tuberculosis and Host RNA Expression in Africa. N. Engl. J. Med. 2014, 370, 1712–1723. [Google Scholar] [CrossRef]
- Berry, M.P.R.; Graham, C.M.; McNab, F.W.; Xu, Z.; Bloch, S.A.A.; Oni, T.; Wilkinson, K.A.; Banchereau, R.; Skinner, J.; Wilkinson, R.J.; et al. An Interferon-Inducible Neutrophil-Driven Blood Transcriptional Signature in Human Tuberculosis. Nature 2010, 466, 973–977. [Google Scholar] [CrossRef]
- Cliff, J.M.; Lee, J.-S.; Constantinou, N.; Cho, J.-E.; Clark, T.G.; Ronacher, K.; King, E.C.; Lukey, P.T.; Duncan, K.; Van Helden, P.D.; et al. Distinct Phases of Blood Gene Expression Pattern Through Tuberculosis Treatment Reflect Modulation of the Humoral Immune Response. J. Infect. Dis. 2013, 207, 18–29. [Google Scholar] [CrossRef]
- Aran, D.; Hu, Z.; Butte, A.J. XCell: Digitally Portraying the Tissue Cellular Heterogeneity Landscape. Genome Biol. 2017, 18, 220. [Google Scholar] [CrossRef]
- Subramanian, A.; Tamayo, P.; Mootha, V.K.; Mukherjee, S.; Ebert, B.L.; Gillette, M.A.; Paulovich, A.; Pomeroy, S.L.; Golub, T.R.; Lander, E.S.; et al. Gene Set Enrichment Analysis: A Knowledge-Based Approach for Interpreting Genome-Wide Expression Profiles. Proc. Natl. Acad. Sci. USA 2005, 102, 15545–15550. [Google Scholar] [CrossRef] [PubMed]
- Mootha, V.K.; Lindgren, C.M.; Eriksson, K.-F.; Subramanian, A.; Sihag, S.; Lehar, J.; Puigserver, P.; Carlsson, E.; Ridderstråle, M.; Laurila, E.; et al. PGC-1α-Responsive Genes Involved in Oxidative Phosphorylation Are Coordinately Downregulated in Human Diabetes. Nat. Genet. 2003, 34, 267–273. [Google Scholar] [CrossRef]
- Barrett, T.; Wilhite, S.E.; Ledoux, P.; Evangelista, C.; Kim, I.F.; Tomashevsky, M.; Marshall, K.A.; Phillippy, K.H.; Sherman, P.M.; Holko, M.; et al. NCBI GEO: Archive for Functional Genomics Data Sets—Update. Nucleic Acids Res. 2012, 41, D991–D995. [Google Scholar] [CrossRef]
- Zhou, N.; Yuan, X.; Du, Q.; Zhang, Z.; Shi, X.; Bao, J.; Ning, Y.; Peng, L. FerrDb V2: Update of the Manually Curated Database of Ferroptosis Regulators and Ferroptosis-Disease Associations. Nucleic Acids Res. 2023, 51, D571–D582. [Google Scholar] [CrossRef] [PubMed]
- Szklarczyk, D.; Kirsch, R.; Koutrouli, M.; Nastou, K.; Mehryary, F.; Hachilif, R.; Gable, A.L.; Fang, T.; Doncheva, N.T.; Pyysalo, S.; et al. The STRING Database in 2023: Protein–Protein Association Networks and Functional Enrichment Analyses for Any Sequenced Genome of Interest. Nucleic Acids Res. 2023, 51, D638–D646. [Google Scholar] [CrossRef] [PubMed]
- Tang, D.; Chen, M.; Huang, X.; Zhang, G.; Zeng, L.; Zhang, G.; Wu, S.; Wang, Y. SRplot: A Free Online Platform for Data Visualization and Graphing. PLoS ONE 2023, 18, e0294236. [Google Scholar] [CrossRef]
- Ge, S.X.; Jung, D.; Yao, R. ShinyGO: A Graphical Gene-Set Enrichment Tool for Animals and Plants. Bioinformatics 2020, 36, 2628–2629. [Google Scholar] [CrossRef]
- Langfelder, P.; Horvath, S. WGCNA: An R Package for Weighted Correlation Network Analysis. BMC Bioinform. 2008, 9, 559. [Google Scholar] [CrossRef]
- Chen, C.; Wu, Y.; Li, J.; Wang, X.; Zeng, Z.; Xu, J.; Liu, Y.; Feng, J.; Chen, H.; He, Y.; et al. TBtools-II: A “One for All, All for One” Bioinformatics Platform for Biological Big-Data Mining. Mol. Plant. 2023, 16, 1733–1742. [Google Scholar] [CrossRef]
- Goedhart, J.; Luijsterburg, M.S. VolcaNoseR Is a Web App for Creating, Exploring, Labeling and Sharing Volcano Plots. Sci. Rep. 2020, 10, 20560. [Google Scholar] [CrossRef]
- Wickham, H. Data Analysis: In “Ggplot2”; Use R! Springer: Cham, Switzerland, 2016; pp. 189–201. [Google Scholar]
- Natarajan, A.; Beena, P.M.; Devnikar, A.V.; Mali, S. A Systemic Review on Tuberculosis. Indian J. Tuberc. 2020, 67, 295–311. [Google Scholar] [CrossRef] [PubMed]
- Kunkel, A.; Abel zur Wiesch, P.; Nathavitharana, R.R.; Marx, F.M.; Jenkins, H.E.; Cohen, T. Smear Positivity in Paediatric and Adult Tuberculosis: Systematic Review and Meta-Analysis. BMC Infect. Dis. 2016, 16, 282. [Google Scholar] [CrossRef] [PubMed]
- Tsareva, A.; Shelyakin, P.V.; Shagina, I.A.; Myshkin, M.Y.; Merzlyak, E.M.; Kriukova, V.V.; Apt, A.S.; Linge, I.A.; Chudakov, D.M.; Britanova, O.V. Aberrant Adaptive Immune Response Underlies Genetic Susceptibility to Tuberculosis. Front. Immunol. 2024, 15, 1380971. [Google Scholar] [CrossRef]
- Guerrero, G.G.; Hernández-Pando, R. Routing Innate and Adaptive Immune Response against M. Tuberculosis and Boosting Mycobacterium Bovis Bacillus Calmette Güerin (BCG) Vaccine Immunity through Prime Boost Protocols. Trends Immunother. 2023, 7, 2451. [Google Scholar] [CrossRef]
- Gan, B. Ferroptosis Hijacking by Mycobacterium tuberculosis. Nat. Commun. 2023, 14, 1431. [Google Scholar] [CrossRef]
- Meunier, E.; Neyrolles, O. Die Another Way: Ferroptosis Drives Tuberculosis Pathology. J. Exp. Med. 2019, 216, 471–473. [Google Scholar] [CrossRef]
- Vu, A.; Glassman, I.; Campbell, G.; Yeganyan, S.; Nguyen, J.; Shin, A.; Venketaraman, V. Host Cell Death and Modulation of Immune Response against Mycobacterium tuberculosis Infection. Int. J. Mol. Sci. 2024, 25, 6255. [Google Scholar] [CrossRef] [PubMed]
- Amaral, E.P.; Foreman, T.W.; Namasivayam, S.; Hilligan, K.L.; Kauffman, K.D.; Barbosa Bomfim, C.C.; Costa, D.L.; Barreto-Duarte, B.; Gurgel-Rocha, C.; Santana, M.F.; et al. GPX4 Regulates Cellular Necrosis and Host Resistance in Mycobacterium tuberculosis Infection. J. Exp. Med. 2022, 219, e20220504. [Google Scholar] [CrossRef]
- Gindeh, A.; Owolabi, O.; Donkor, S.; Sutherland, J.S. Mycobacterium tuberculosis-Specific Plasmablast Levels Are Differentially Modulated in Tuberculosis Infection and Disease. Tuberculosis 2020, 124, 101978. [Google Scholar] [CrossRef]
- Cardona, P.; Cardona, P.-J. Regulatory T Cells in Mycobacterium tuberculosis Infection. Front. Immunol. 2019, 10, 02139. [Google Scholar] [CrossRef]
- Luo, M.; Zou, X.; Zeng, Q.; Wu, Y.; Yang, H.; Qin, L.; Zheng, R.; Yu, F.; Hu, Y.; Liu, Z. Monocyte at Diagnosis as a Prognosis Biomarker in Tuberculosis Patients with Anemia. Front. Med. 2023, 10, 1141949. [Google Scholar] [CrossRef]
- Ahmad, F.; Rani, A.; Alam, A.; Zarin, S.; Pandey, S.; Singh, H.; Hasnain, S.E.; Ehtesham, N.Z. Macrophage: A Cell With Many Faces and Functions in Tuberculosis. Front. Immunol. 2022, 13, 747799. [Google Scholar] [CrossRef]
- Lu, Y.-B.; Xiao, D.-Q.; Liang, K.-D.; Zhang, J.-A.; Wang, W.-D.; Yu, S.-Y.; Zheng, B.-Y.; Gao, Y.-C.; Dai, Y.-C.; Jia, Y.; et al. Profiling Dendritic Cell Subsets in the Patients with Active Pulmonary Tuberculosis. Mol. Immunol. 2017, 91, 86–96. [Google Scholar] [CrossRef] [PubMed]
- Lo, C.-Y.; Huang, Y.-C.; Huang, H.-Y.; Chung, F.-T.; Lin, C.-W.; Chung, K.F.; Wang, C.-H. Increased Th1 Cells with Disease Resolution of Active Pulmonary Tuberculosis in Non-Atopic Patients. Biomedicines 2021, 9, 724. [Google Scholar] [CrossRef] [PubMed]
- Andrews, J.T.; Zhang, Z.; Prasad, G.V.R.K.; Huey, F.; Nazarova, E.V.; Wang, J.; Ranaraja, A.; Weinkopff, T.; Li, L.-X.; Mu, S.; et al. Metabolically Active Neutrophils Represent a Permissive Niche for Mycobacterium tuberculosis. Mucosal Immunol. 2024, 17, 825–842. [Google Scholar] [CrossRef]
- Liang, T.; Chen, J.; Xu, G.; Zhang, Z.; Xue, J.; Zeng, H.; Jiang, J.; Chen, T.; Qin, Z.; Li, H.; et al. Ferroptosis-Related Gene SOCS1, a Marker for Tuberculosis Diagnosis and Treatment, Involves in Macrophage Polarization and Facilitates Bone Destruction in Tuberculosis. Tuberculosis 2022, 132, 102140. [Google Scholar] [CrossRef]
- Ma, R.; Yang, W.; Guo, W.; Zhang, H.; Wang, Z.; Ge, Z. Single-Cell Transcriptome Analysis Reveals the Dysregulated Monocyte State Associated with Tuberculosis Progression. BMC Infect. Dis. 2025, 25, 210. [Google Scholar] [CrossRef] [PubMed]
- Young, P.A.; Senkal, C.E.; Suchanek, A.L.; Grevengoed, T.J.; Lin, D.D.; Zhao, L.; Crunk, A.E.; Klett, E.L.; Füllekrug, J.; Obeid, L.M.; et al. Long-Chain Acyl-CoA Synthetase 1 Interacts with Key Proteins That Activate and Direct Fatty Acids into Niche Hepatic Pathways. J. Biol. Chem. 2018, 293, 16724–16740. [Google Scholar] [CrossRef]
- Li, L.O.; Mashek, D.G.; An, J.; Doughman, S.D.; Newgard, C.B.; Coleman, R.A. Overexpression of Rat Long Chain Acyl-CoA Synthetase 1 Alters Fatty Acid Metabolism in Rat Primary Hepatocytes. J. Biol. Chem. 2006, 281, 37246–37255. [Google Scholar] [CrossRef]
- Qiu, Y.; Cao, Y.; Cao, W.; Jia, Y.; Lu, N. The Application of Ferroptosis in Diseases. Pharmacol. Res. 2020, 159, 104919. [Google Scholar] [CrossRef]
- Kim, M.; Wainwright, H.C.; Locketz, M.; Bekker, L.; Walther, G.B.; Dittrich, C.; Visser, A.; Wang, W.; Hsu, F.; Wiehart, U.; et al. Caseation of Human Tuberculosis Granulomas Correlates with Elevated Host Lipid Metabolism. EMBO Mol. Med. 2010, 2, 258–274. [Google Scholar] [CrossRef] [PubMed]
- Yang, Y.; Sauve, A.A. NAD + Metabolism: Bioenergetics, Signaling and Manipulation for Therapy. Biochim. Biophys. Acta (BBA)-Proteins Proteom. 2016, 1864, 1787–1800. [Google Scholar] [CrossRef] [PubMed]
- Iwata, H.; Goettsch, C.; Sharma, A.; Ricchiuto, P.; Bin Goh, W.W.; Halu, A.; Yamada, I.; Yoshida, H.; Hara, T.; Wei, M.; et al. PARP9 and PARP14 Cross-Regulate Macrophage Activation via STAT1 ADP-Ribosylation. Nat. Commun. 2016, 7, 12849. [Google Scholar] [CrossRef]
- Ahmed, M.; Thirunavukkarasu, S.; Rosa, B.A.; Thomas, K.A.; Das, S.; Rangel-Moreno, J.; Lu, L.; Mehra, S.; Mbandi, S.K.; Thackray, L.B.; et al. Immune Correlates of Tuberculosis Disease and Risk Translate across Species. Sci. Transl. Med. 2020, 12, eaay0233. [Google Scholar] [CrossRef]
- Chen, Y.-C.; Hsiao, C.-C.; Chen, T.-W.; Wu, C.-C.; Chao, T.-Y.; Leung, S.-Y.; Eng, H.-L.; Lee, C.-P.; Wang, T.-Y.; Lin, M.-C. Whole Genome DNA Methylation Analysis of Active Pulmonary Tuberculosis Disease Identifies Novel Epigenotypes: PARP9/MiR-505/RASGRP4/GNG12 Gene Methylation and Clinical Phenotypes. Int. J. Mol. Sci. 2020, 21, 3180. [Google Scholar] [CrossRef]
- Thompson, E.G.; Shankar, S.; Gideon, H.P.; Braun, J.; Valvo, J.; Skinner, J.A.; Aderem, A.; Flynn, J.L.; Lin, P.L.; Zak, D.E. Prospective Discrimination of Controllers From Progressors Early After Low-Dose Mycobacterium tuberculosis Infection of Cynomolgus Macaques Using Blood RNA Signatures. J. Infect. Dis. 2018, 217, 1318–1322. [Google Scholar] [CrossRef] [PubMed]
- Wei, J.; Zhang, Y.; Li, H.; Wang, F.; Yao, S. Toll-like Receptor 4: A Potential Therapeutic Target for Multiple Human Diseases. Biomed. Pharmacother. 2023, 166, 115338. [Google Scholar] [CrossRef]
- Chang, J.-S.; Huggett, J.F.; Dheda, K.; Kim, L.U.; Zumla, A.; Rook, G.A.W. Myobacterium tuberculosis Induces Selective Up-Regulation of TLRs in the Mononuclear Leukocytes of Patients with Active Pulmonary Tuberculosis. J. Immunol. 2006, 176, 3010–3018. [Google Scholar] [CrossRef]
- Feng, Z.; Meng, F.; Huo, F.; Zhu, Y.; Qin, Y.; Gui, Y.; Zhang, H.; Lin, P.; He, Q.; Li, Y.; et al. Inhibition of Ferroptosis Rescues M2 Macrophages and Alleviates Arthritis by Suppressing the HMGB1/TLR4/STAT3 Axis in M1 Macrophages. Redox Biol. 2024, 75, 103255. [Google Scholar] [CrossRef]
- Chen, Y.; Fang, Z.-M.; Yi, X.; Wei, X.; Jiang, D.-S. The Interaction between Ferroptosis and Inflammatory Signaling Pathways. Cell Death Dis. 2023, 14, 205. [Google Scholar] [CrossRef]
- Fang, D.; Xie, H.; Hu, T.; Shan, H.; Li, M. Binding Features and Functions of ATG3. Front. Cell Dev. Biol. 2021, 9, 685625. [Google Scholar] [CrossRef] [PubMed]
- Etna, M.P.; Sinigaglia, A.; Grassi, A.; Giacomini, E.; Romagnoli, A.; Pardini, M.; Severa, M.; Cruciani, M.; Rizzo, F.; Anastasiadou, E.; et al. Mycobacterium tuberculosis-Induced MiR-155 Subverts Autophagy by Targeting ATG3 in Human Dendritic Cells. PLoS Pathog. 2018, 14, e1006790. [Google Scholar] [CrossRef] [PubMed]

| Gene Symbol | Gene Title | −log10 (p-Value) | log2 (Fold Change) | UP/DOWN |
|---|---|---|---|---|
| GALNT14 | Polypeptide N-acetylgalactosaminyltransferase 14 | 6.18 | 2.09 | UP |
| ACSL1 | acyl-CoA synthetase long-chain family member 1 | 5.83 | 1.31 | UP |
| CISD2 | CDGSH iron sulfur domain 2 | 4.96 | 1.31 | UP |
| LCN2 | lipocalin 2 | 3.44 | 1.31 | UP |
| PROK2 | prokineticin 2 | 3.87 | 1.21 | UP |
| BACH1 | BTB domain and CNC homolog 1 | 4.55 | 1.18 | UP |
| ACSL4 | acyl-CoA synthetase long-chain family member 4 | 4.13 | 1.16 | UP |
| CREB5 | cAMP responsive element binding protein 5 | 5.37 | 1.15 | UP |
| SLC40A1 | solute carrier family 40 member 1 | 5.74 | 1.15 | UP |
| ATG3 | autophagy related 3 | 4.20 | 1.11 | UP |
| PARP9 | Poly (ADP-ribose) polymerase family member 9 | 5.06 | 1.10 | UP |
| MAPK14 | mitogen-activated protein kinase 14 | 5.18 | 1.10 | UP |
| TLR4 | toll-like receptor 4 | 4.92 | 1.10 | UP |
| PTGS2 | prostaglandin-endoperoxide synthase 2 | 2.46 | 1.09 | UP |
| ATF3 | activating transcription factor 3 | 3.31 | 1.09 | UP |
| GCLC | glutamate-cysteine ligase catalytic subunit | 3.84 | 1.08 | UP |
| GLRX5 | glutaredoxin 5 | 4.38 | 1.07 | UP |
| CHMP5 | charged multivesicular body protein 5 | 4.21 | 1.05 | UP |
| GABARAPL2 | GABA type A receptor associated protein like 2 | 5.27 | 1.05 | UP |
| TP53 | tumor protein p53 | 3.29 | −1.00 | DOWN |
| ALOX15 | arachidonate 15-lipoxygenase | 2.25 | −1.26 | DOWN |
Disclaimer/Publisher’s Note: The statements, opinions and data contained in all publications are solely those of the individual author(s) and contributor(s) and not of MDPI and/or the editor(s). MDPI and/or the editor(s) disclaim responsibility for any injury to people or property resulting from any ideas, methods, instructions or products referred to in the content. |
© 2025 by the authors. Licensee MDPI, Basel, Switzerland. This article is an open access article distributed under the terms and conditions of the Creative Commons Attribution (CC BY) license (https://creativecommons.org/licenses/by/4.0/).
Share and Cite
Arya, R.; Shakya, H.; Biswas, V.K.; Kumar, G.; Yogarayan, S.; Shakya, H.K.; Kim, J.-J. Bioinformatics-Driven Identification of Ferroptosis-Related Gene Signatures Distinguishing Active and Latent Tuberculosis. Genes 2025, 16, 716. https://doi.org/10.3390/genes16060716
Arya R, Shakya H, Biswas VK, Kumar G, Yogarayan S, Shakya HK, Kim J-J. Bioinformatics-Driven Identification of Ferroptosis-Related Gene Signatures Distinguishing Active and Latent Tuberculosis. Genes. 2025; 16(6):716. https://doi.org/10.3390/genes16060716
Chicago/Turabian StyleArya, Rakesh, Hemlata Shakya, Viplov Kumar Biswas, Gyanendra Kumar, Sumendra Yogarayan, Harish Kumar Shakya, and Jong-Joo Kim. 2025. "Bioinformatics-Driven Identification of Ferroptosis-Related Gene Signatures Distinguishing Active and Latent Tuberculosis" Genes 16, no. 6: 716. https://doi.org/10.3390/genes16060716
APA StyleArya, R., Shakya, H., Biswas, V. K., Kumar, G., Yogarayan, S., Shakya, H. K., & Kim, J.-J. (2025). Bioinformatics-Driven Identification of Ferroptosis-Related Gene Signatures Distinguishing Active and Latent Tuberculosis. Genes, 16(6), 716. https://doi.org/10.3390/genes16060716