
ChromoCheck: Predicting Postnatal Chromosomal Trisomy Cases Using a Support Vector Machine Learning Model

Abstract
1. Introduction
2. Methods
2.1. The Ethical Statement
2.2. Data Collection
2.3. Data Preprocessing
2.4. Training and Testing Support Vector Machine (SVM) Classifier
2.5. Classifier Evaluation Metrics
2.6. Web Deployment
2.7. Case Studies
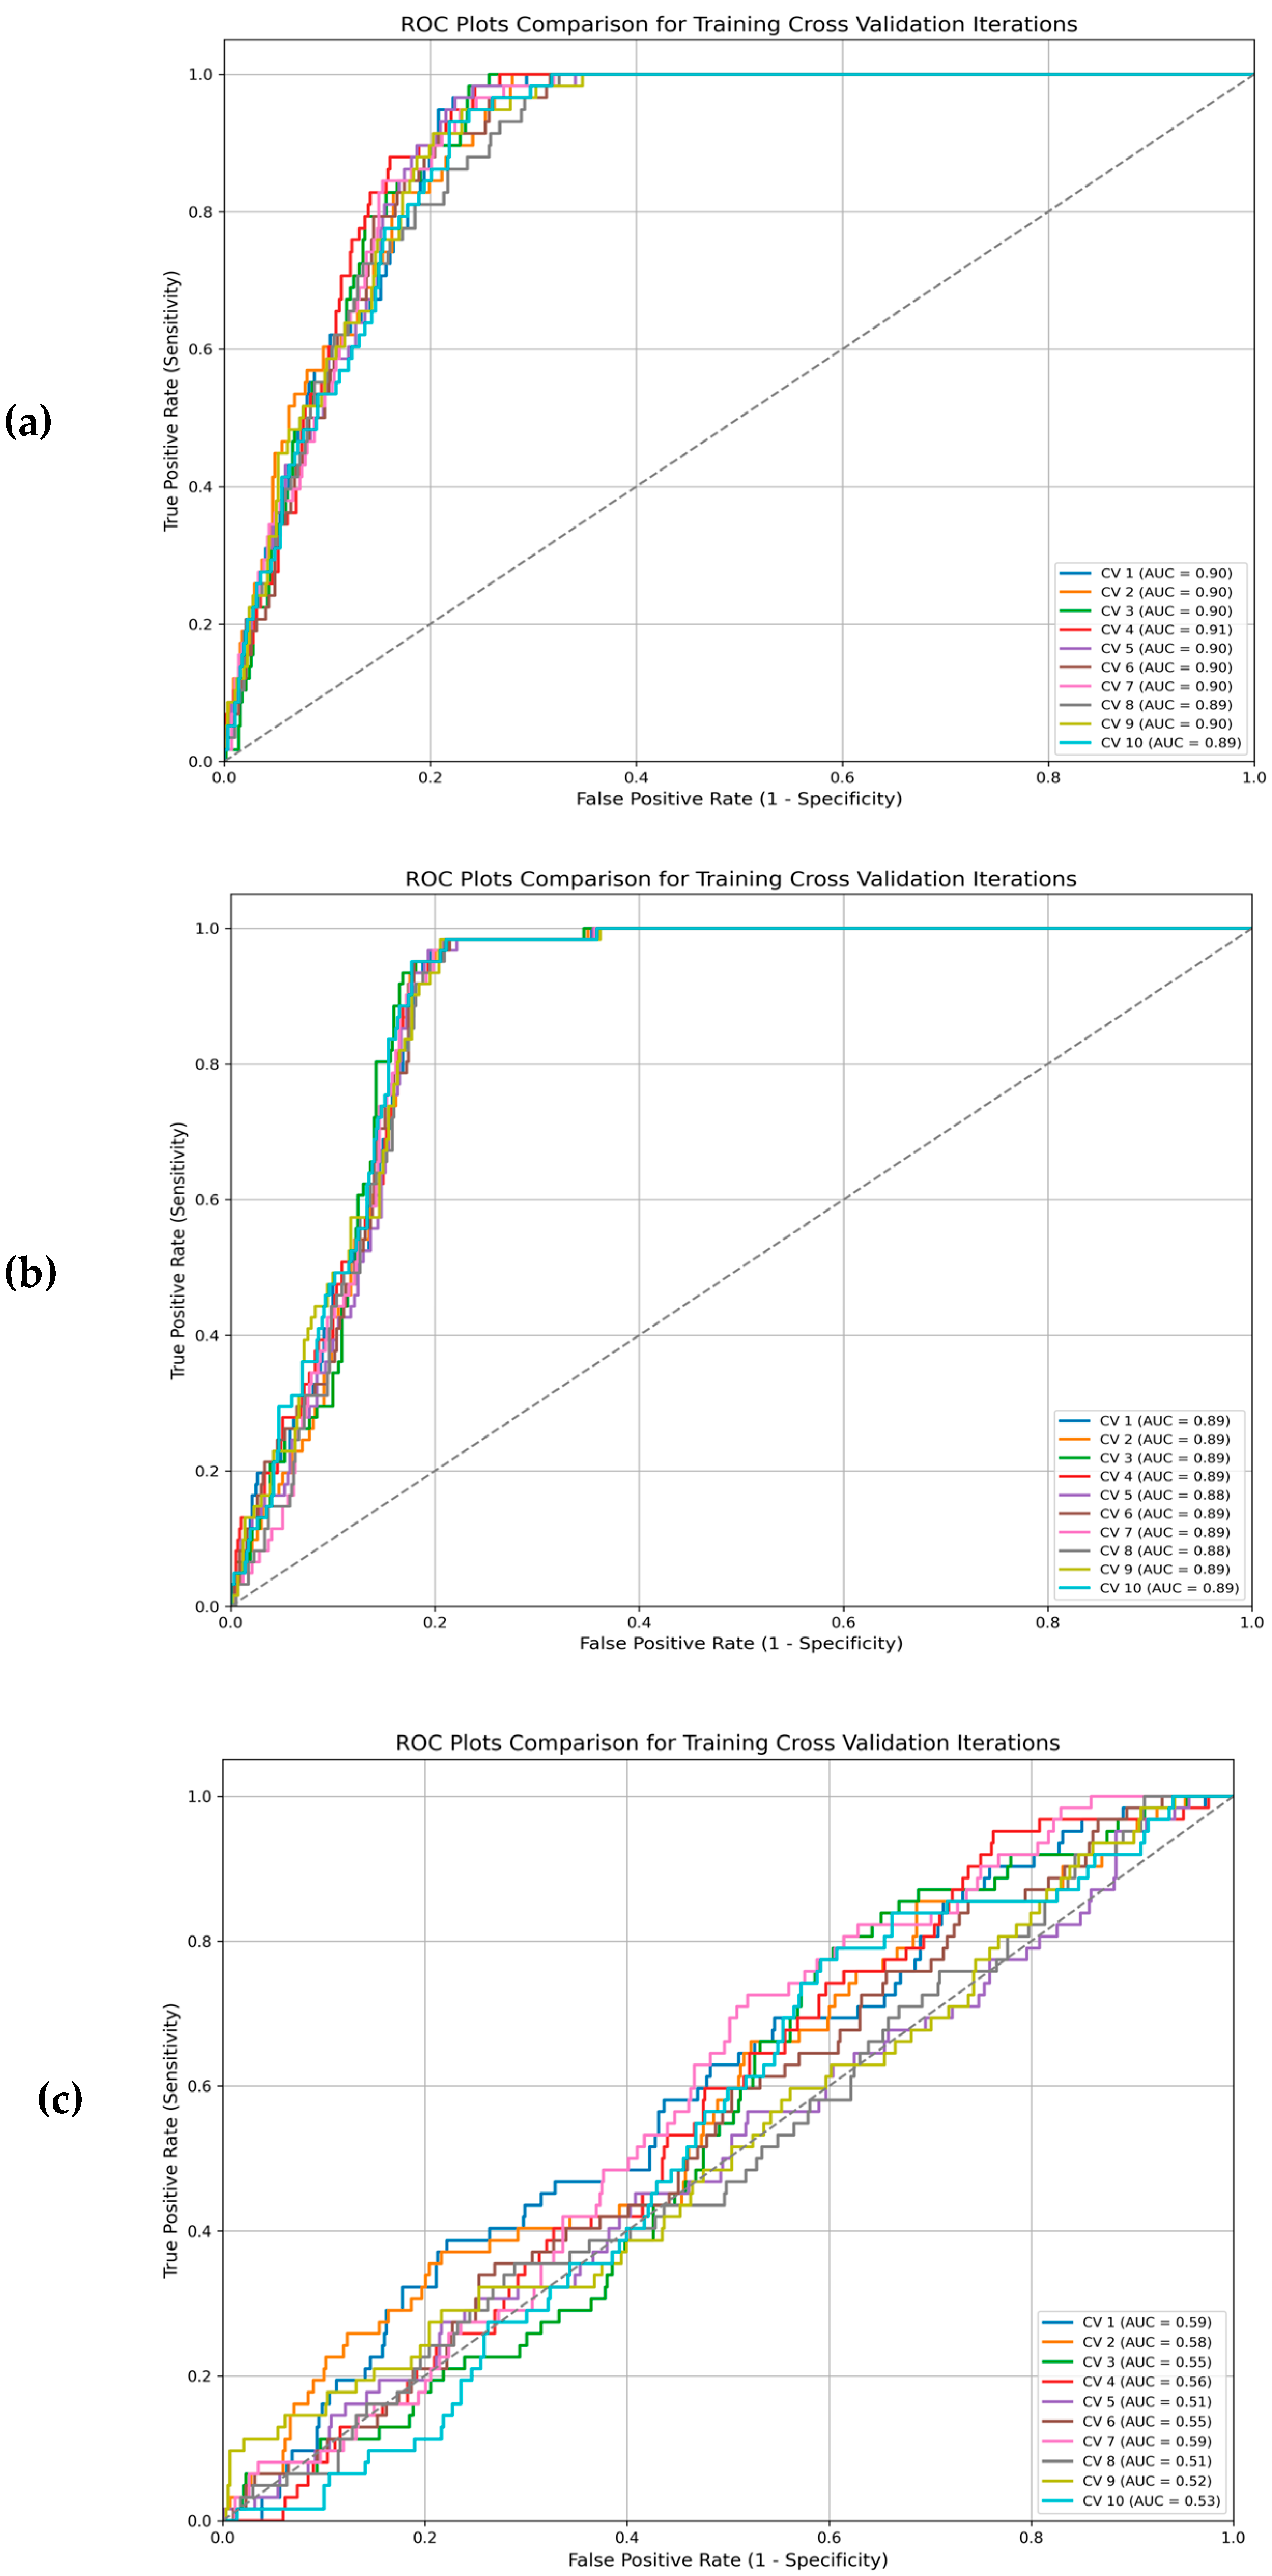
3. Results
4. Discussion
5. Conclusions
Supplementary Materials
Author Contributions
Funding
Institutional Review Board Statement
Informed Consent Statement
Data Availability Statement
Acknowledgments
Conflicts of Interest
Abbreviations
| AI | Artificial Intelligence |
| AFP | Alpha-Fetoprotein |
| AUC | Area Under the Curve |
| DS | Down Syndrome |
| FN | False Negative |
| FP | False Positive |
| LOOCV | Leave-One-Out Cross-Validation |
| ML | Machine Learning |
| MODY | Maturity Onset Diabetes of the Young |
| PCR | Polymerase Chain Reaction |
| QF-PCR | Quantitative Fluorescent Polymerase Chain Reaction |
| RF | Random Forest |
| ROC | Receiver Operating Characteristic |
| STR | Short Tandem Repeat |
| SVM | Support Vector Machine |
| T4 | Thyroxine Hormone |
| TN | True Negative |
| TP | True Positive |
| TSH | Thyroid-Stimulating Hormone |
| uE3 | Unconjugated Estriol |
| kNN | k-Nearest Neighbor |
| k-means | k-Means Clustering |
| PHA | Phytohemagglutinin |
| RPMI | Roswell Park Memorial Institute (medium for cell culture) |
| EIA | Enzyme Immunoassay |
| CRAN | Comprehensive R Archive Network |
| CV | Cross-Validation |
References
- Vermeesch, J.R.; Fiegler, H.; de Leeuw, N.; Szuhai, K.; Schoumans, J.; Ciccone, R.; Speleman, F.; Rauch, A.; Clayton-Smith, J.; Van Ravenswaaij, C.; et al. Guidelines for molecular karyotyping in constitutional genetic diagnosis. Eur. J. Hum. Genet. 2007, 15, 1105–1114. [Google Scholar] [CrossRef] [PubMed]
- Ford, C.E.; Hamerton, J.L. The Chromosomes of Man. Nature 1956, 178, 1020–1023. [Google Scholar] [CrossRef] [PubMed]
- Botstein, D.; Risch, N. Discovering genotypes underlying human phenotypes: Past successes for mendelian disease, future approaches for complex disease. Nat. Genet. 2003, 33, 228–237. [Google Scholar] [CrossRef] [PubMed]
- Joshi, C.J.; Ke, W.; Drangowska-Way, A.; O’Rourke, E.J.; Lewis, N.E. What are housekeeping genes? PLOS Comput. Biol. 2022, 18, e1010295. [Google Scholar] [CrossRef]
- Cornish, A.J.; Gruber, A.J.; Kinnersley, B.; Chubb, D.; Frangou, A.; Caravagna, G.; Noyvert, B.; Lakatos, E.; Wood, H.M.; Thorn, S.; et al. The genomic landscape of 2,023 colorectal cancers. Nature 2024, 633, 127–136. [Google Scholar] [CrossRef]
- Bull, M.J. Down Syndrome. N. Engl. J. Med. 2020, 382, 2344–2352. [Google Scholar] [CrossRef]
- Goel, N.; Morris, J.K.; Tucker, D.; De Walle, H.E.K.; Bakker, M.K.; Kancherla, V.; Marengo, L.; Canfield, M.A.; Kallen, K.; Lelong, N.; et al. Trisomy 13 and 18-Prevalence and mortality-A multi-registry population based analysis HHS Public Access. Am. J. Med. Genet. A 2019, 179, 2382–2392. [Google Scholar] [CrossRef]
- Ozkan, E.; Lacerda, M.P. Genetics, Cytogenetic Testing and Conventional Karyotype. StatPearls. August 2022. Available online: https://www.ncbi.nlm.nih.gov/books/NBK563293/ (accessed on 7 March 2023).
- Badenas, C.; Rodríguez-Revenga, L.; Morales, C.; Mediano, C.; Plaja, A.; Pérez-Iribarne, M.M.; Soler, A.; Clusellas, N.; Borrell, A.; Sánchez, M.Á.; et al. Assessment of QF-PCR as the first approach in prenatal diagnosis. J. Mol. Diagn. 2010, 12, 828–834. [Google Scholar] [CrossRef]
- Mao, W.; Mu, X.; Zheng, Y.; Yan, G. Leave-one-out cross-validation-based model selection for multi-input multi-output support vector machine. Neural Comput. Appl. 2012, 24, 441–451. [Google Scholar] [CrossRef]
- Libbrecht, M.W.; Noble, W.S. Machine learning in genetics and genomics. Nat. Rev. Genet. 2015, 16, 321–332. [Google Scholar] [CrossRef]
- Mahood, E.H.; Kruse, L.H.; Moghe, G.D. Machine learning: A powerful tool for gene function prediction in plants. Appl. Plant Sci. 2020, 8, e11376. [Google Scholar] [CrossRef] [PubMed]
- Meyer, D.; Leisch, F.; Hornik, K. The support vector machine under test. Neurocomputing 2023, 55, 16. [Google Scholar] [CrossRef]
- Breiman, L. Random forests. Mach. Learn. 2001, 45, 5–32. [Google Scholar] [CrossRef]
- Saligan, L.N.; Fernández-Martínez, J.L.; de Andrés-Galiana, E.J.; Sonis, S. Supervised classification by filter methods and recursive feature elimination predicts risk of radiotherapy-related fatigue in patients with prostate cancer. Cancer Inform. 2014, 13, 141–152. [Google Scholar] [CrossRef] [PubMed]
- Jiang, T.; Gradus, J.L.; Rosellini, A.J. Supervised Machine Learning: A Brief Primer. Behav. Ther. 2020, 51, 675–687. [Google Scholar] [CrossRef]
- González-Carrasco, F.; Espinosa Parra, F.; Álvarez-Aguado, I.; Ponce Olguín, S.; Vega Córdova, V.; Roselló-Peñaloza, M. Item reduction of the “Support Intensity Scale” for people with intellectual disabilities, using machine learning. Br. J. Learn. Disabil. 2025, 53, 43–50. [Google Scholar] [CrossRef]
- Koivu, A.; Korpimäki, T.; Kivelä, P.; Pahikkala, T.; Sairanen, M. Evaluation of machine learning algorithms for improved risk assessment for Down’s syndrome. Comput. Biol. Med. 2018, 98, 1–7. [Google Scholar] [CrossRef]
- Zhang, Z.; Zhao, Y.; Liao, X.; Shi, W.; Li, K.; Zou, Q.; Peng, S. Deep learning in omics: A survey and guideline. Brief. Funct. Genom. 2019, 18, 41–57. [Google Scholar] [CrossRef]
- Jayalakshmi, T.; Santhakumaran, A. Statistical Normalization and Back Propagation for Clasification. Int. J. Comput. Theory Eng. 2011, 3, 89–93. [Google Scholar] [CrossRef]
- Meyer, D.; Dimitriadou, E.; Hornik, K.; Weingessel, A.; Leisch, F. Misc Functions of the Department of Statistics, Probability Theory Group (Formerly: E1071), TU Wien [R package e1071 version 1.7-16]. CRAN Contrib. Packag. 2024. [Google Scholar] [CrossRef]
- Amari, S.; Wu, S. Improving support vector machine classifiers by modifying kernel functions. Neural Netw. 1999, 12, 783–789. [Google Scholar] [CrossRef]
- Hajian-Tilaki, K. Receiver Operating Characteristic (ROC) Curve Analysis for Medical Diagnostic Test Evaluation. Casp. J. Intern. Med. 2013, 4, 627–635. [Google Scholar]
- Themes, T.; Version, S.; Themes, D.; Gpl-, L.; Roxygennote, L.; Chang, A.W.; Park, T.; Dziedzic, L.; Willis, N.; Cycle, N.; et al. Package ‘shinythemes’. 2022. Available online: https://CRAN.R-project.org/package=shinythemes (accessed on 6 May 2025).
- Fredes, D.; Astudillo, P.; Lizama Calvo, M. Late start of early intervention in children with Down syndrome. Andes Pediatr. Rev. Chil. Pediatr. 2021, 92, 411–419. [Google Scholar] [CrossRef] [PubMed]
- Peroos, S.; Forsythe, E.; Pugh, J.H.; Arthur-Farraj, P.; Hodes, D. Longevity and Patau syndrome: What determines survival? BMJ Case Rep. 2012, 2012, bcr0620114381. [Google Scholar] [CrossRef] [PubMed]
- He, F.; Lin, B.; Mou, K.; Jin, L.; Liu, J. A machine learning model for the prediction of down syndrome in second trimester antenatal screening. Clin. Chim. Acta 2021, 521, 206–211. [Google Scholar] [CrossRef]
- Zhang, L.; Dong, D.; Sun, Y.; Hu, C.; Sun, C.; Wu, Q.; Tian, J. Development and Validation of a Deep Learning Model to Screen for Trisomy 21 during the First Trimester from Nuchal Ultrasonographic Images. JAMA Netw. Open 2022, 5, E2217854. [Google Scholar] [CrossRef]


| Average of Accuracy (%) | Average of Specificity (%) | Average of Sensitivity (%) | ||||
|---|---|---|---|---|---|---|
| Train | Test | Train | Test | Train | Test | |
| Linear | 81% | 82% | 79% | 80% | 97% | 98% |
| Radial | 77% | 79% | 75% | 77% | 96% | 95% |
| Polynomial | 43% | 79% | 40% | 78% | 74% | 87% |
Disclaimer/Publisher’s Note: The statements, opinions and data contained in all publications are solely those of the individual author(s) and contributor(s) and not of MDPI and/or the editor(s). MDPI and/or the editor(s) disclaim responsibility for any injury to people or property resulting from any ideas, methods, instructions or products referred to in the content. |
© 2025 by the authors. Licensee MDPI, Basel, Switzerland. This article is an open access article distributed under the terms and conditions of the Creative Commons Attribution (CC BY) license (https://creativecommons.org/licenses/by/4.0/).
Share and Cite
Al-Mahrami, N.; Al Jabri, N.; Sallam, A.A.W.; Al Jahdhami, N.; Zadjali, F. ChromoCheck: Predicting Postnatal Chromosomal Trisomy Cases Using a Support Vector Machine Learning Model. Genes 2025, 16, 695. https://doi.org/10.3390/genes16060695
Al-Mahrami N, Al Jabri N, Sallam AAW, Al Jahdhami N, Zadjali F. ChromoCheck: Predicting Postnatal Chromosomal Trisomy Cases Using a Support Vector Machine Learning Model. Genes. 2025; 16(6):695. https://doi.org/10.3390/genes16060695
Chicago/Turabian StyleAl-Mahrami, Nabras, Nuha Al Jabri, Amal A. W. Sallam, Najwa Al Jahdhami, and Fahad Zadjali. 2025. "ChromoCheck: Predicting Postnatal Chromosomal Trisomy Cases Using a Support Vector Machine Learning Model" Genes 16, no. 6: 695. https://doi.org/10.3390/genes16060695
APA StyleAl-Mahrami, N., Al Jabri, N., Sallam, A. A. W., Al Jahdhami, N., & Zadjali, F. (2025). ChromoCheck: Predicting Postnatal Chromosomal Trisomy Cases Using a Support Vector Machine Learning Model. Genes, 16(6), 695. https://doi.org/10.3390/genes16060695