
Markers Associated with Starch, Protein and Asparagine Content in Grain of Common Wheat

Abstract
1. Introduction
2. Materials and Methods
2.1. Plant Material
2.2. Phenotypic Data Collection
2.3. Genotyping
2.4. Data Analysis
2.5. Identification of Candidate Genes
3. Results
3.1. Phenotypic Data
3.2. Genotype Variation
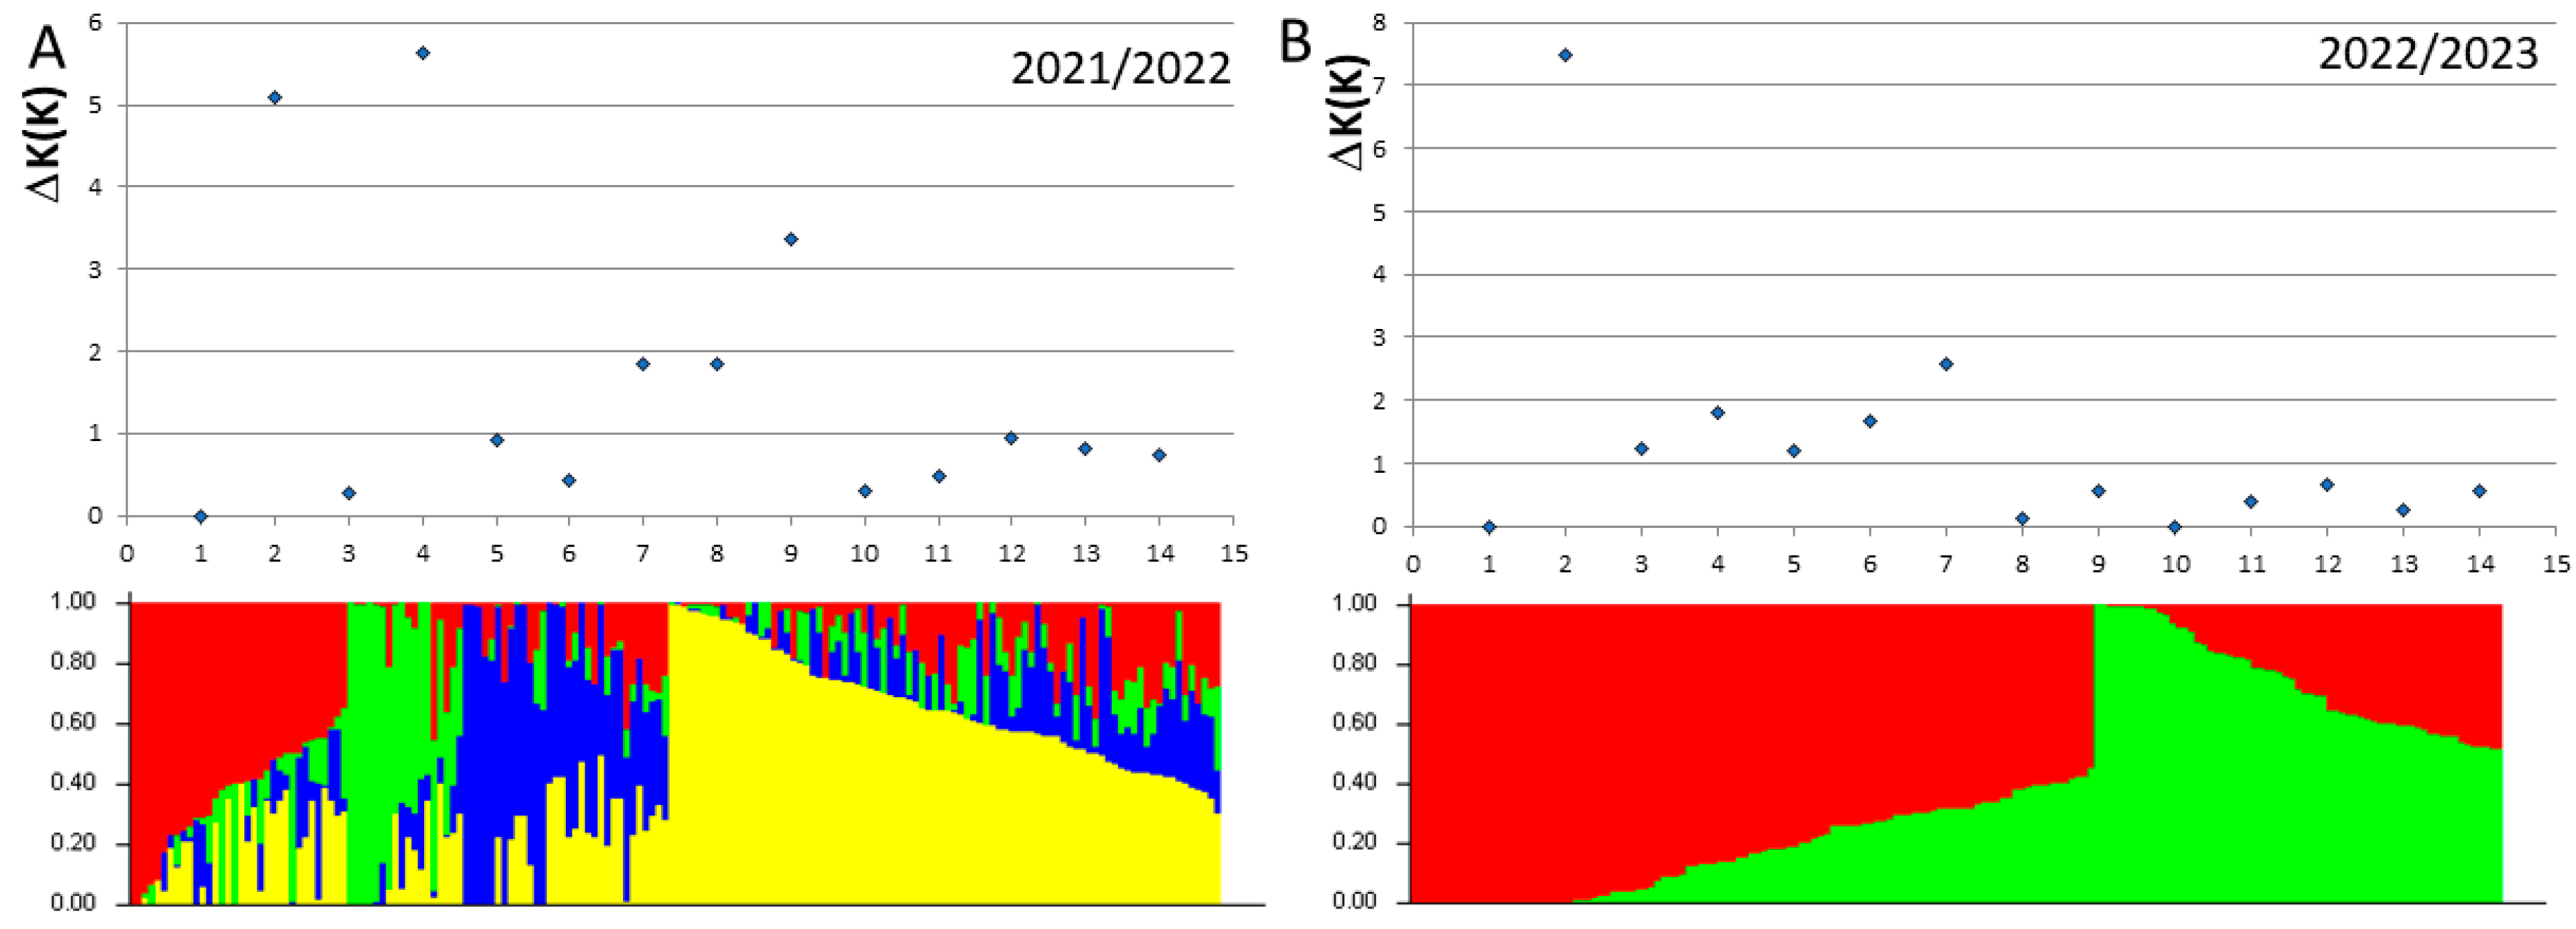
3.3. Population Structure
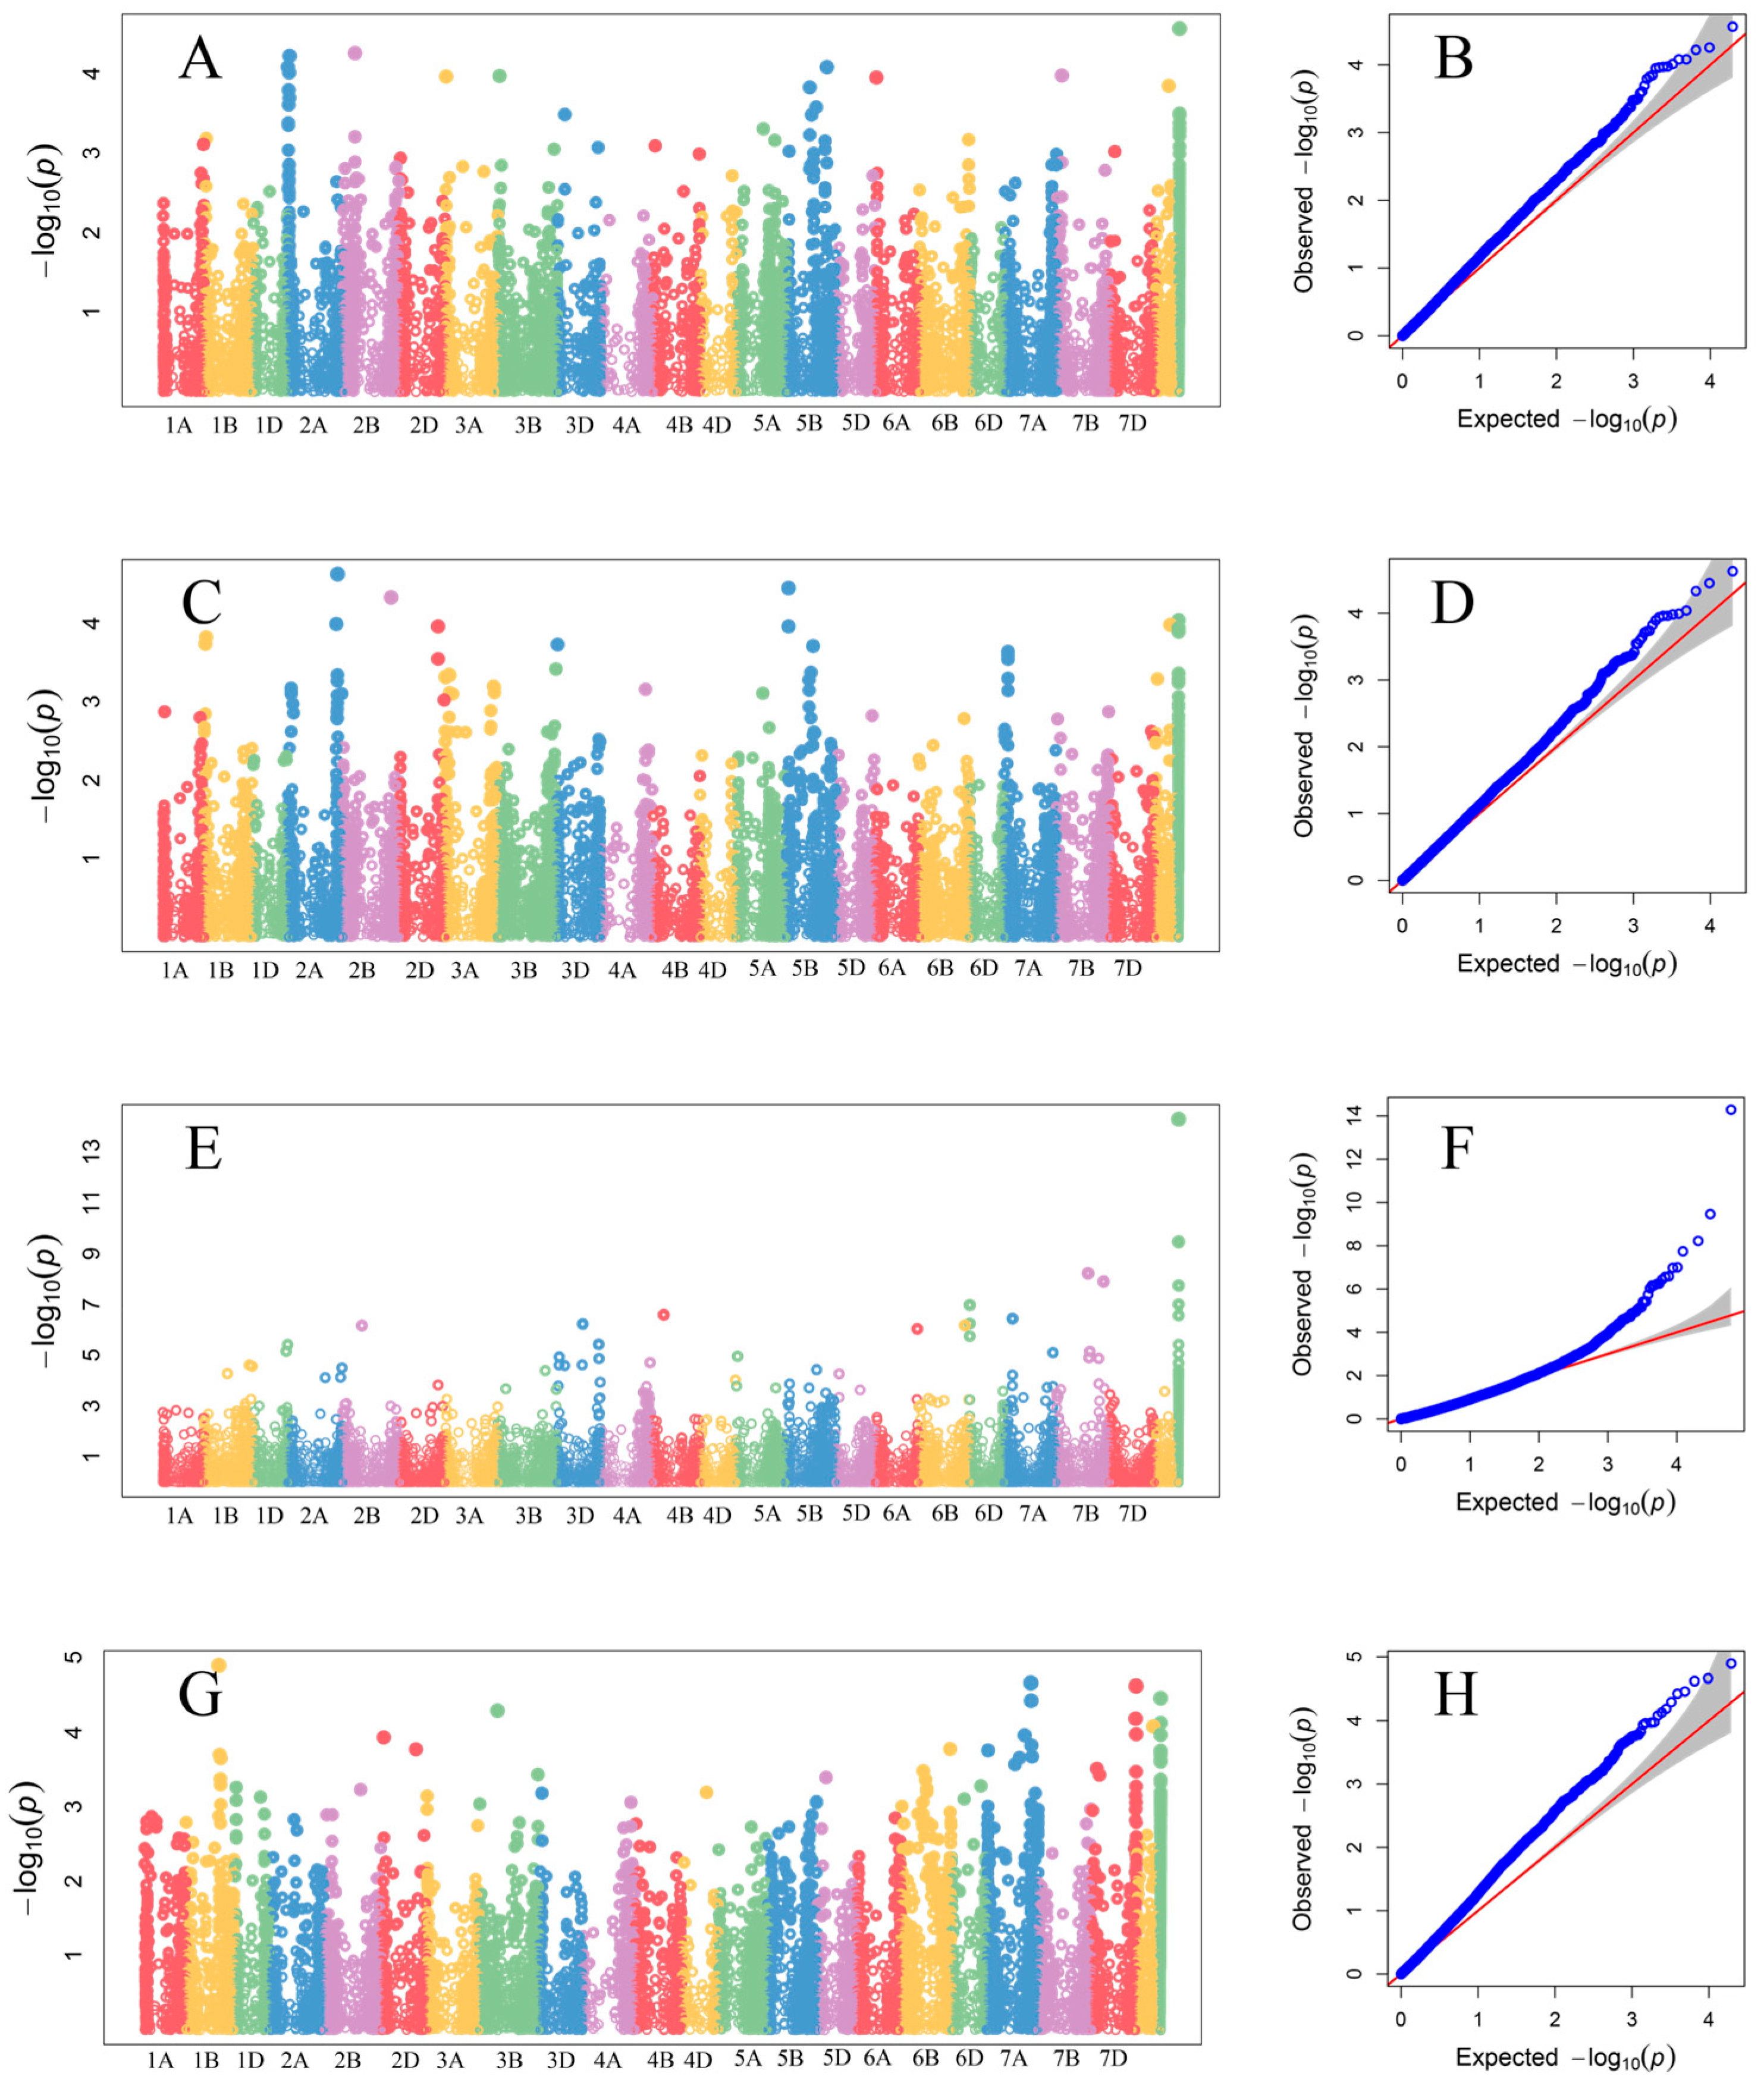
3.4. GWAS Results
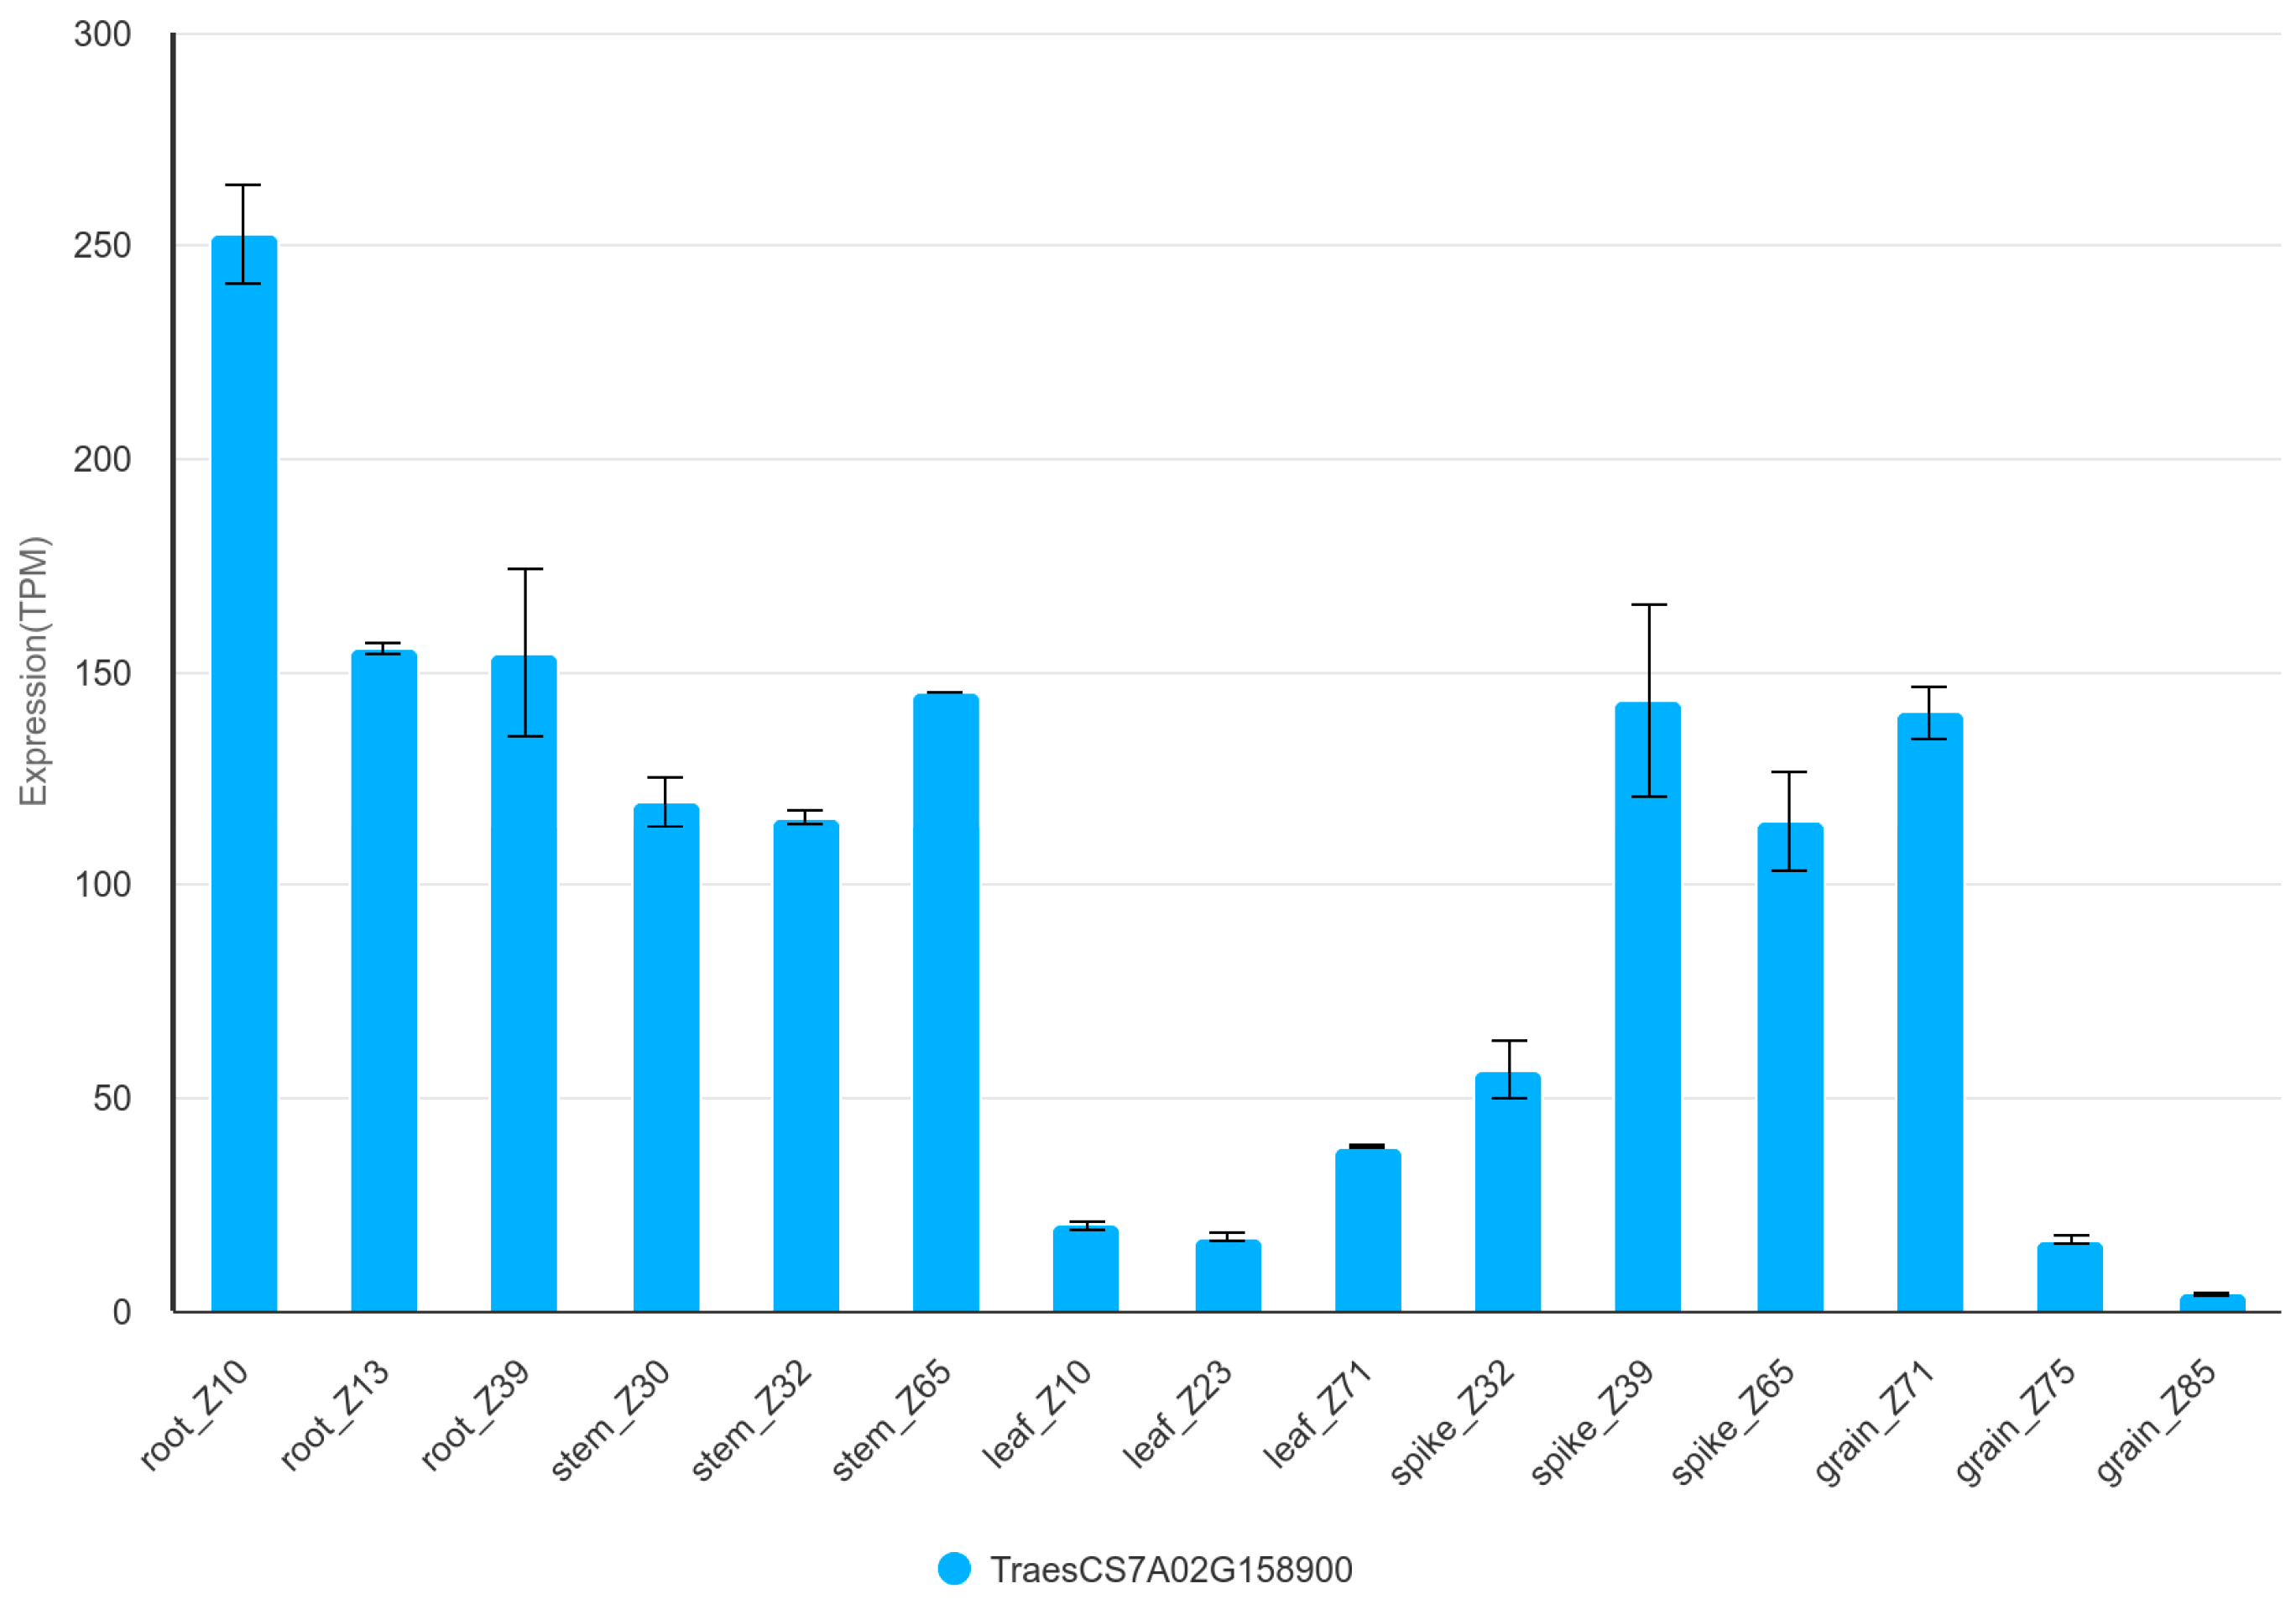
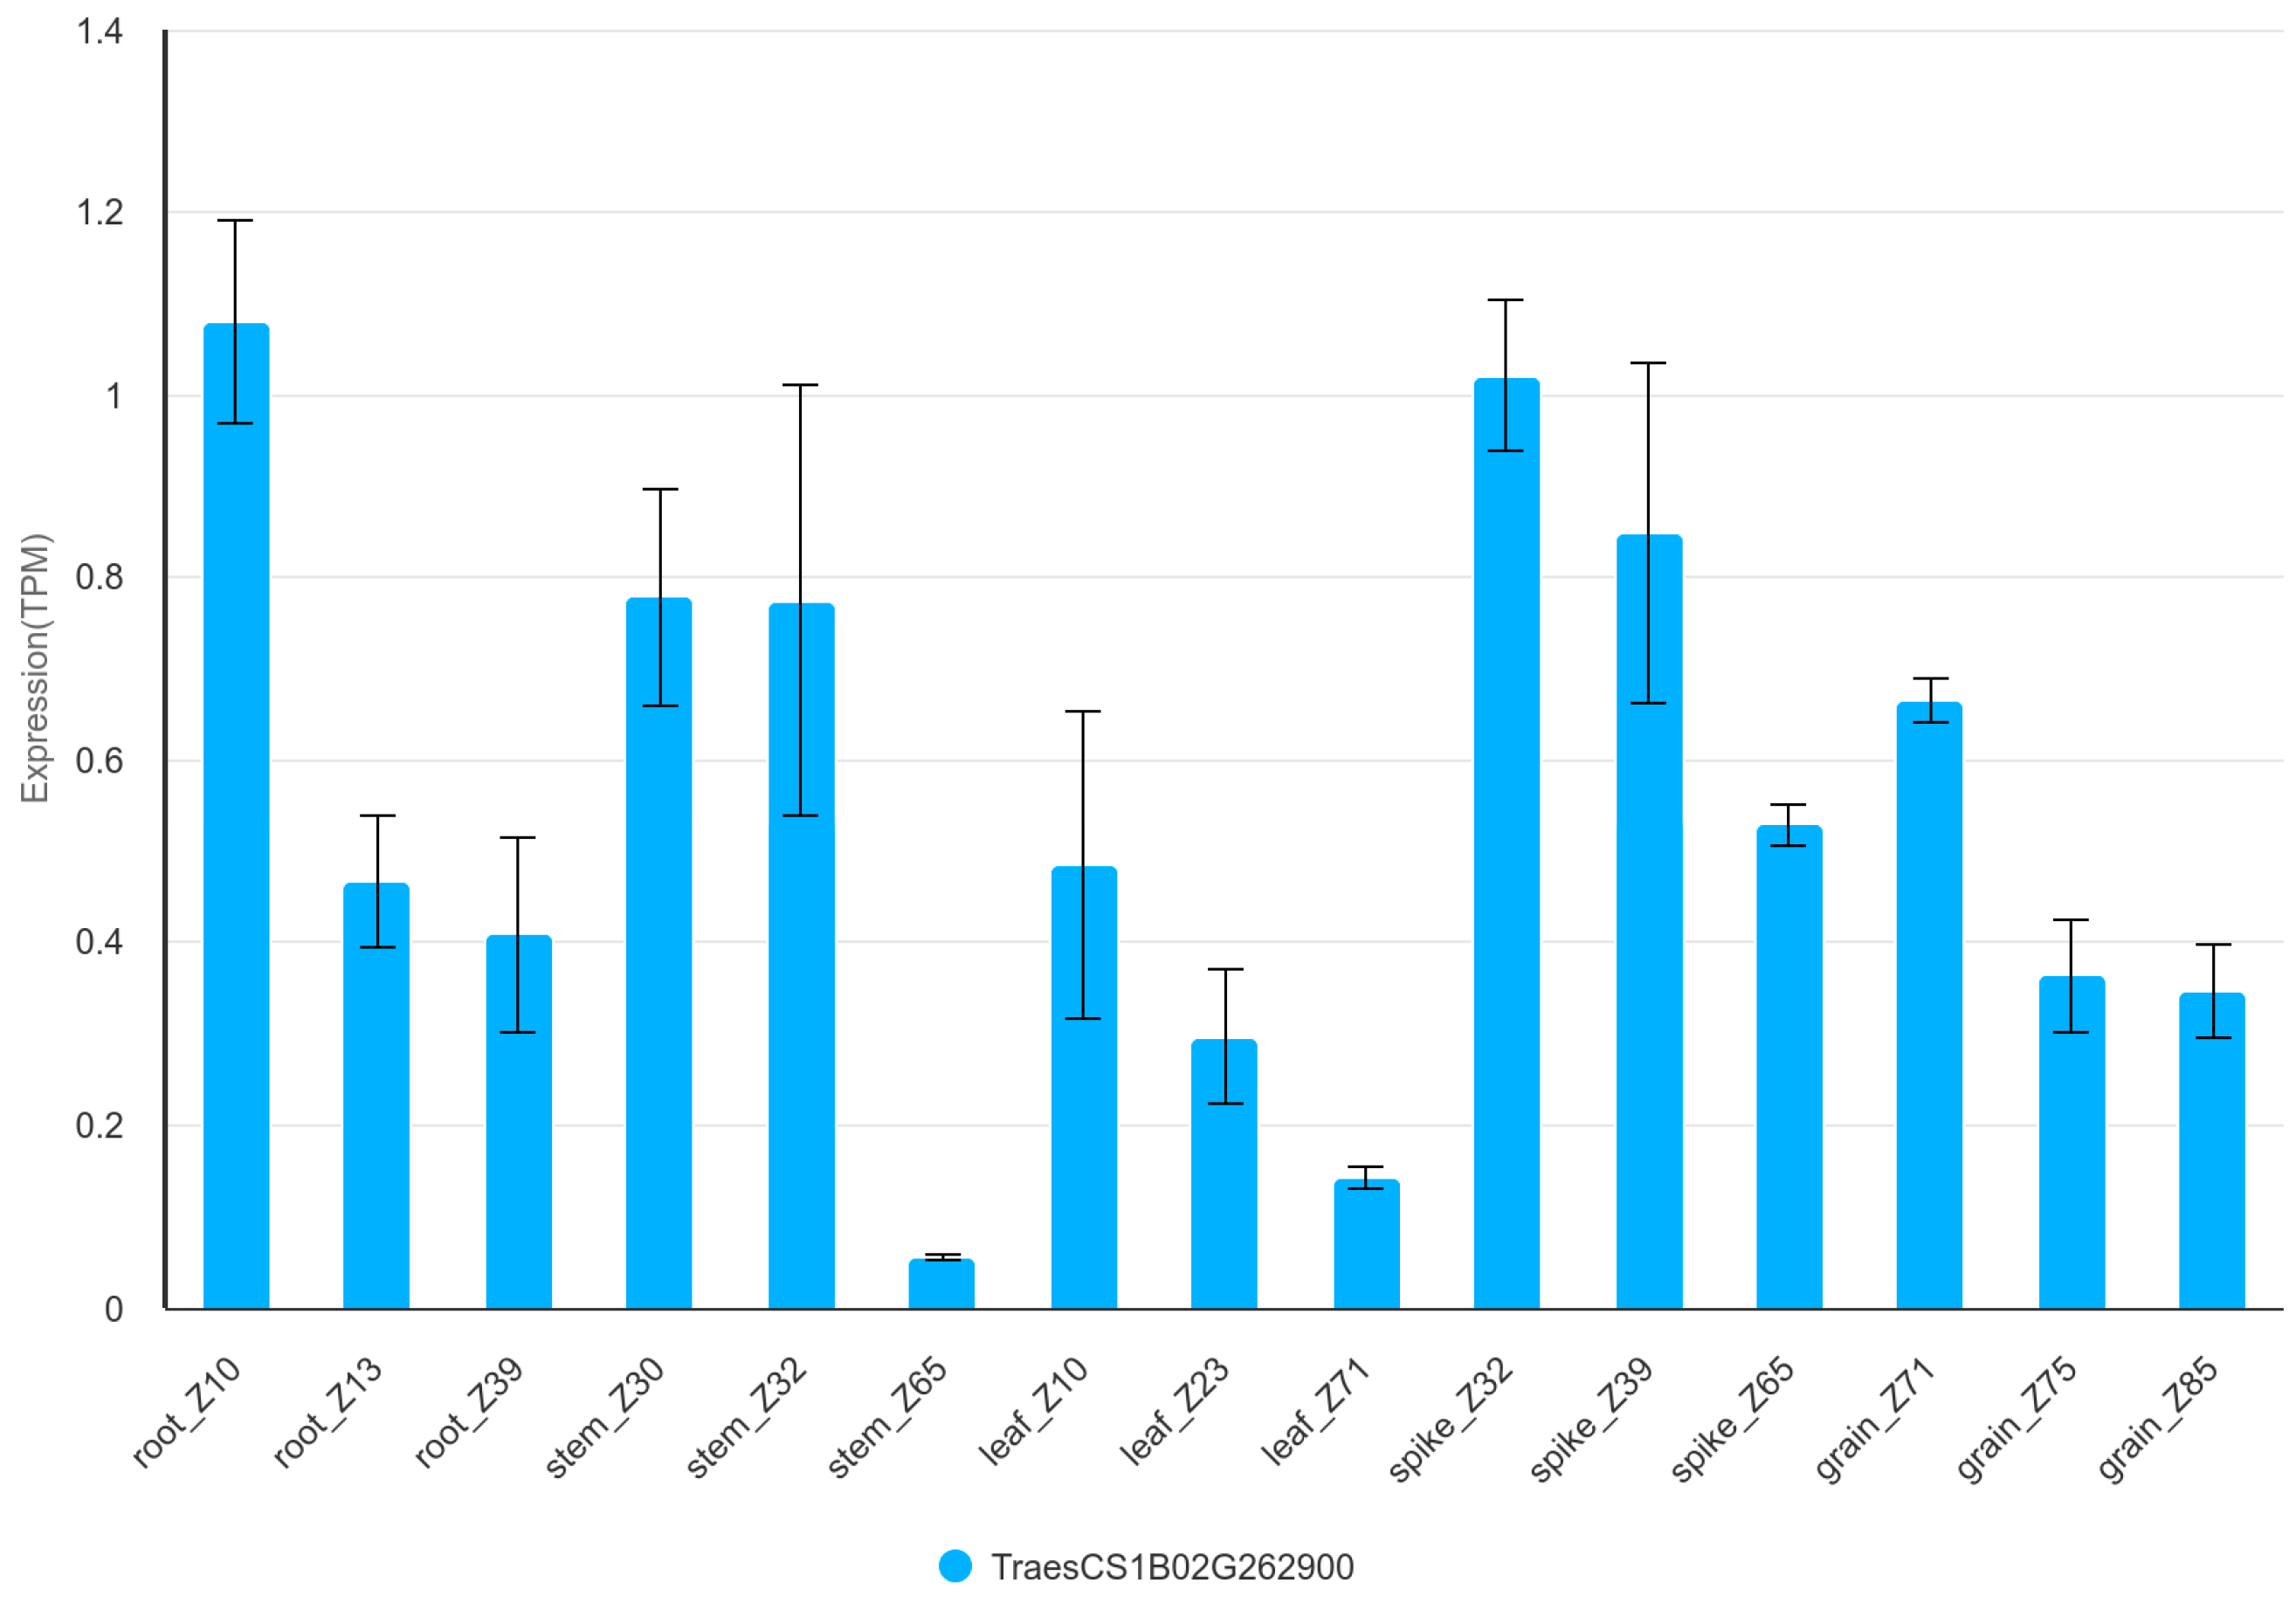
3.5. Candidate Genes
4. Discussion
5. Conclusions
Supplementary Materials
Author Contributions
Funding
Data Availability Statement
Conflicts of Interest
Abbreviations
| ADP-ase | ADP-glucose pyrophosphorylase |
| ADPG | ADPG—ADP-glucose |
| AMP | adenosine monophosphate |
| Asn | asparagine |
| ATP | adenosine triphosphate |
| DBE | starch debranching enzymes |
| FK | fructokinase |
| G1P | glucose-1-phosphate |
| G6P | glucose-6-phosphate |
| GBSS | granule-bound starch synthase, |
| GPC | grain protein content |
| GSC | grain starch content |
| HK | hexokinase |
| INV | invertase |
| ISA | isoamylase-type starch debranching enzyme |
| NIR | near infrared spectroscopy |
| PGI | phosphoglucose isomerase |
| PGM | phosphoglucomutase |
| PPi | pyrophosphate |
| PUL | pullanase |
| QTL | quantitative trait loci |
| SBE | starch branching enzyme |
| SS | starch synthase |
| SuSy | sucrose synthase |
| UDPG | UDP-glucose |
References
- FAOSTAT. Available online: https://www.fao.org/faostat/en/#home (accessed on 14 April 2025).
- Vitale, J.; Adam, B.; Vitale, P. Economics of Wheat Breeding Strategies: Focusing on Oklahoma Hard Red Winter Wheat. Agronomy 2020, 10, 238. [Google Scholar] [CrossRef]
- Abedi, T.; Mojiri, A. Cadmium Uptake by Wheat (Triticum aestivum L.): An Overview. Plants 2020, 9, 500. [Google Scholar] [CrossRef] [PubMed]
- Shewry, P.R.; Hey, S.J. The Contribution of Wheat to Human Diet and Health. Food Energy Secur. 2015, 4, 178–202. [Google Scholar] [CrossRef] [PubMed]
- Šramková, Z.; Gregová, E.; Šturdík, E. Chemical Composition and Nutritional Quality of Wheat Grain. Acta Chim. Slovaca 2009, 2, 115–138. [Google Scholar]
- Khalid, A.; Hameed, A.; Tahir, M.F. Wheat Quality: A Review on Chemical Composition, Nutritional Attributes, Grain Anatomy, Types, Classification, and Function of Seed Storage Proteins in Bread Making Quality. Front. Nutr. 2023, 10, 1053196. [Google Scholar] [CrossRef]
- Shewry, P.R.; Van Schaik, F.; Ravel, C.; Charmet, G.; Rakszegi, M.; Bedo, Z.; Ward, J.L. Genotype and Environment Effects on the Contents of Vitamins B1, B2, B3, and B6 in Wheat Grain. J. Agric. Food Chem. 2011, 59, 10564–10571. [Google Scholar] [CrossRef]
- Wieser, H.; Koehler, P.; Scherf, K.A. The Two Faces of Wheat. Front. Nutr. 2020, 7, 517313. [Google Scholar] [CrossRef]
- Guo, Y.; Wang, G.; Guo, X.; Chi, S.; Yu, H.; Jin, K.; Huang, H.; Wang, D.; Wu, C.; Tian, J.; et al. Genetic Dissection of Protein and Starch during Wheat Grain Development Using QTL Mapping and GWAS. Front. Plant Sci. 2023, 14, 1189887. [Google Scholar] [CrossRef]
- Muqaddasi, Q.H.; Brassac, J.; Ebmeyer, E.; Kollers, S.; Korzun, V.; Argillier, O.; Stiewe, G.; Plieske, J.; Ganal, M.W.; Röder, M.S. Prospects of GWAS and Predictive Breeding for European Winter Wheat’s Grain Protein Content, Grain Starch Content, and Grain Hardness. Sci. Rep. 2020, 10, 12541. [Google Scholar] [CrossRef]
- Zhang, L.Y.; Liu, D.C.; Guo, X.L.; Yang, W.L.; Sun, J.Z.; Wang, D.W.; Sourdille, P.; Zhang, A.M. Investigation of Genetic Diversity and Population Structure of Common Wheat Cultivars in Northern China Using DArT Markers. BMC Genet. 2011, 12, 42. [Google Scholar] [CrossRef]
- Graybosch, R.A. Waxy Wheats: Origin, Properties, and Prospects. Trends Food Sci. Technol. 1998, 9, 135–142. [Google Scholar] [CrossRef]
- Liu, Q.; Hu, Y.; Hu, M.; Sun, L.; Chen, X.; Li, Q.; Wang, P.; Wang, L.-A.; Zhang, Y.; Li, H. Identification and Molecular Characterization of Mutant Line Deficiency in Three Waxy Proteins of Common Wheat (Triticum aestivum L.). Sci. Rep. 2021, 11, 3510. [Google Scholar] [CrossRef] [PubMed]
- Tian, B.; Deng, Z.; Xie, Q.; Tian, J.; Tian, B.; Deng, Z.; Xie, Q.; Tian, J. Genetic Dissection of the Developmental Behaviour of Total Starch Content and Its Components in Wheat Grain. Crop. Pasture Sci. 2015, 66, 445–455. [Google Scholar] [CrossRef]
- Zhang, X.; Guo, D.; Blennow, A.; Zörb, C. Mineral Nutrients and Crop Starch Quality. Trends Food Sci. Technol. 2021, 114, 148–157. [Google Scholar] [CrossRef]
- Wang, Z.; Li, W.; Qi, J.; Shi, P.; Yin, Y. Starch Accumulation, Activities of Key Enzyme and Gene Expression in Starch Synthesis of Wheat Endosperm with Different Starch Contents. J. Food Sci. Technol. 2014, 51, 419–429. [Google Scholar] [CrossRef]
- Chen, X.; Fang, W.; Ji, M.; Xu, S.; Jiang, Y.; Song, S.; Chen, G.; Tian, J.; Deng, Z. Genome-Wide Association Study of Total Starch and Its Components in Common Wheat. Euphytica 2019, 215, 201. [Google Scholar] [CrossRef]
- Shewry, P.R. Wheat. J. Exp. Bot. 2009, 60, 1537–1553. [Google Scholar] [CrossRef]
- Paull, A.E.; Anderson, J.A. The Effects of Amount and Distribution of Rainfall on the Protein Content of Western Canadian Wheat. Can. J. Res. 1942, 20c, 212–227. [Google Scholar] [CrossRef]
- McCartney, C.A.; Somers, D.J.; Lukow, O.; Ames, N.; Noll, J.; Cloutier, S.; Humphreys, D.G.; McCallum, B.D. QTL Analysis of Quality Traits in the Spring Wheat Cross RL4452 × ‘AC Domain’. Plant Breed. 2006, 125, 565–575. [Google Scholar] [CrossRef]
- Sun, H.; Lu, J.; Fan, Y.; Zhao, Y.; Kong, F.; Li, R.; Wang, H.; Li, S. Quantitative Trait Loci (QTLs) for Quality Traits Related to Protein and Starch in Wheat. Prog. Nat. Sci. 2008, 18, 825–831. [Google Scholar] [CrossRef]
- Zi, Y.; Cheng, D.; Li, H.; Guo, J.; Ju, W.; Wang, C.; Humphreys, D.G.; Liu, A.; Cao, X.; Liu, C.; et al. Effects of the Different Waxy Proteins on Starch Biosynthesis, Starch Physicochemical Properties and Chinese Noodle Quality in Wheat. Mol. Breed. 2022, 42, 23. [Google Scholar] [CrossRef] [PubMed]
- Murai, J.; Taira, T.; Ohta, D. Isolation and Characterization of the Three Waxy Genes Encoding the Granule-Bound Starch Synthase in Hexaploid Wheat. Gene 1999, 234, 71–79. [Google Scholar] [CrossRef] [PubMed]
- Araki, E.; Miura, H.; Sawada, S. Identification of Genetic Loci Affecting Amylose Content and Agronomic Traits on Chromosome 4A of Wheat. Theor. Appl. Genet. 1999, 98, 977–984. [Google Scholar] [CrossRef]
- Kartseva, T.; Alqudah, A.M.; Aleksandrov, V.; Alomari, D.Z.; Doneva, D.; Arif, M.A.R.; Börner, A.; Misheva, S. Nutritional Genomic Approach for Improving Grain Protein Content in Wheat. Foods 2023, 12, 1399. [Google Scholar] [CrossRef]
- Kartseva, T.; Aleksandrov, V.; Alqudah, A.M.; Arif, M.A.R.; Kocheva, K.; Doneva, D.; Prokopova, K.; Börner, A.; Misheva, S. GWAS in a Collection of Bulgarian Old and Modern Bread Wheat Accessions Uncovers Novel Genomic Loci for Grain Protein Content and Thousand Kernel Weight. Plants 2024, 13, 1084. [Google Scholar] [CrossRef]
- Claus, A.; Schreiter, P.; Weber, A.; Graeff, S.; Herrmann, W.; Claupein, W.; Schieber, A.; Carle, R. Influence of Agronomic Factors and Extraction Rate on the Acrylamide Contents in Yeast-Leavened Breads. J. Agric. Food Chem. 2006, 54, 8968–8976. [Google Scholar] [CrossRef]
- Halford, N.G.; Curtis, T.Y.; Muttucumaru, N.; Postles, J.; Mottram, D.S. Sugars in Crop Plants. Ann. Appl. Biol. 2011, 158, 1–25. [Google Scholar] [CrossRef]
- Krishnakumar, T. Acrylamide in Food Products: A Review. J. Food Process. Technol. 2014, 5, 344. [Google Scholar] [CrossRef]
- Mottram, D.S.; Wedzicha, B.L.; Dodson, A.T. Acrylamide Is Formed in the Maillard Reaction. Nature 2002, 419, 448–449. [Google Scholar] [CrossRef]
- Oddy, J.; Raffan, S.; Wilkinson, M.D.; Elmore, J.S.; Halford, N.G. Understanding the Relationships between Free Asparagine in Grain and Other Traits to Breed Low-Asparagine Wheat. Plants 2022, 11, 669. [Google Scholar] [CrossRef]
- Raffan, S.; Halford, N.G. Acrylamide in Food: Progress in and Prospects for Genetic and Agronomic Solutions. Ann. Appl. Biol. 2019, 175, 259–281. [Google Scholar] [CrossRef] [PubMed]
- Stadler, R.H.; Blank, I.; Varga, N.; Robert, F.; Hau, J.; Guy, P.A.; Robert, M.C.; Riediker, S. Acrylamide from Maillard Reaction Products. Nature 2002, 419, 449–450. [Google Scholar] [CrossRef] [PubMed]
- Yaylayan, V.A.; Wnorowski, A.; Perez Locas, C. Why Asparagine Needs Carbohydrates to Generate Acrylamide. J. Agric. Food Chem. 2003, 51, 1753–1757. [Google Scholar] [CrossRef] [PubMed]
- Zyzak, D.V.; Sanders, R.A.; Stojanovic, M.; Tallmadge, D.H.; Eberhart, B.L.; Ewald, D.K.; Gruber, D.C.; Morsch, T.R.; Strothers, M.A.; Rizzi, G.P.; et al. Acrylamide Formation Mechanism in Heated Foods. J. Agric. Food Chem. 2003, 51, 4782–4787. [Google Scholar] [CrossRef]
- Mottram, D.S. The Maillard Reaction: Source of Flavour in Thermally Processed Foods. In Flavours and Fragrances: Chemistry, Bioprocessing and Sustainability; Springer: Berlin/Heidelberg, Germany, 2007; pp. 269–283. [Google Scholar] [CrossRef]
- Lea, P.J.; Azevedo, R.A. Nitrogen Use Efficiency. 2. Amino Acid Metabolism. Ann. Appl. Biol. 2007, 151, 269–275. [Google Scholar] [CrossRef]
- Raffan, S.; Halford, N.G. Cereal Asparagine Synthetase Genes. Ann. Appl. Biol. 2021, 178, 6–22. [Google Scholar] [CrossRef]
- Emebiri, L.C. Genetic Variation and Possible SNP Markers for Breeding Wheat with Low-Grain Asparagine, the Major Precursor for Acrylamide Formation in Heat-Processed Products. J. Sci. Food Agric. 2014, 94, 1422–1429. [Google Scholar] [CrossRef]
- Curtis, T.Y.; Muttucumaru, N.; Shewry, P.R.; Parry, M.A.J.; Powers, S.J.; Elmore, J.S.; Mottram, D.S.; Hook, S.; Halford, N.G. Effects of Genotype and Environment on Free Amino Acid Levels in Wheat Grain: Implications for Acrylamide Formation During Processing. J. Agric. Food Chem. 2009, 57, 1013–1021. [Google Scholar] [CrossRef]
- Curtis, T.Y.; Powers, S.J.; Wang, R.; Halford, N.G. Effects of Variety, Year of Cultivation and Sulphur Supply on the Accumulation of Free Asparagine in the Grain of Commercial Wheat Varieties. Food Chem. 2018, 239, 304–313. [Google Scholar] [CrossRef]
- Rapp, M.; Schwadorf, K.; Leiser, W.L.; Würschum, T.; Longin, C.F.H. Assessing the Variation and Genetic Architecture of Asparagine Content in Wheat: What Can Plant Breeding Contribute to a Reduction in the Acrylamide Precursor? Theor. Appl. Genet. 2018, 131, 2427–2437. [Google Scholar] [CrossRef]
- Peng, Y.; Liu, H.; Chen, J.; Shi, T.; Zhang, C.; Sun, D.; He, Z.; Hao, Y.; Chen, W. Genome-Wide Association Studies of Free Amino Acid Levels by Six Multi-Locus Models in Bread Wheat. Front. Plant Sci. 2018, 9, 1196. [Google Scholar] [CrossRef] [PubMed]
- Oddy, J.; Chhetry, M.; Awal, R.; Addy, J.; Wilkinson, M.; Smith, D.; King, R.; Hall, C.; Testa, R.; Murray, E.; et al. Genetic Control of Grain Amino Acid Composition in a UK Soft Wheat Mapping Population. Plant Genome 2023, 16, e20335. [Google Scholar] [CrossRef] [PubMed]
- Lavoignat, M.; Cassan, C.; Pétriacq, P.; Gibon, Y.; Heumez, E.; Duque, C.; Momont, P.; Rincent, R.; Blancon, J.; Ravel, C.; et al. Different Wheat Loci Are Associated to Heritable Free Asparagine Content in Grain Grown under Different Water and Nitrogen Availability. Theor. Appl. Genet. 2024, 137, 46. [Google Scholar] [CrossRef] [PubMed]
- Gao, R.; Curtis, T.Y.; Powers, S.J.; Xu, H.; Huang, J.; Halford, N.G. Food Safety: Structure and Expression of the Asparagine Synthetase Gene Family of Wheat. J. Cereal Sci. 2016, 68, 122–131. [Google Scholar] [CrossRef]
- Xu, H.; Curtis, T.Y.; Powers, S.J.; Raffan, S.; Gao, R.; Huang, J.; Heiner, M.; Gilbert, D.R.; Halford, N.G. Genomic, Biochemical, and Modeling Analyses of Asparagine Synthetases from Wheat. Front. Plant Sci. 2018, 8, 2237. [Google Scholar] [CrossRef]
- Lecart, B.; Jacquet, N.; Anseeuw, L.; Renier, M.; Njeumen, P.; Bodson, B.; Vanderschuren, H.; Richel, A. Nonconventional Enzymatic Method to Determine Free Asparagine Level in Whole-Grain Wheat. Food Chem. 2018, 251, 64–68. [Google Scholar] [CrossRef]
- Piepho, H.P.; Möhring, J.; Melchinger, A.E.; Büchse, A. BLUP for Phenotypic Selection in Plant Breeding and Variety Testing. Euphytica 2008, 161, 209–228. [Google Scholar] [CrossRef]
- Bates, D.; Mächler, M.; Bolker, B.M.; Walker, S.C. Fitting Linear Mixed-Effects Models Using Lme4. J. Stat. Softw. 2015, 67, 1–48. [Google Scholar] [CrossRef]
- Wu, J.; Yu, R.; Wang, H.; Zhou, C.; Huang, S.; Jiao, H.; Yu, S.; Nie, X.; Wang, Q.; Liu, S.; et al. A Large-Scale Genomic Association Analysis Identifies the Candidate Causal Genes Conferring Stripe Rust Resistance under Multiple Field Environments. Plant Biotechnol. J. 2021, 19, 177–191. [Google Scholar] [CrossRef]
- Tyrka, M.; Mokrzycka, M.; Bakera, B.; Tyrka, D.; Szeliga, M.; Stojałowski, S.; Matysik, P.; Rokicki, M.; Rakoczy-Trojanowska, M.; Krajewski, P. Evaluation of Genetic Structure in European Wheat Cultivars and Advanced Breeding Lines Using High-Density Genotyping-by-Sequencing Approach. BMC Genom. 2021, 22, 81. [Google Scholar] [CrossRef]
- Pritchard, J.K.; Wen, X.; Falush, D. Documentation for Structure Software, Version 2.2.; Stanford University: Stanford, CA, USA, 2007. [Google Scholar]
- Chen, C.J.; Zhang, Z. IPat: Intelligent Prediction and Association Tool for Genomic Research. Bioinformatics 2018, 34, 1925–1927. [Google Scholar] [CrossRef] [PubMed]
- Alaux, M.; Rogers, J.; Letellier, T.; Flores, R.; Alfama, F.; Pommier, C.; Mohellibi, N.; Durand, S.; Kimmel, E.; Michotey, C.; et al. Linking the International Wheat Genome Sequencing Consortium Bread Wheat Reference Genome Sequence to Wheat Genetic and Phenomic Data. Genome Biol. 2018, 19, 111. [Google Scholar] [CrossRef] [PubMed]
- Ma, S.; Wang, M.; Wu, J.; Guo, W.; Chen, Y.; Li, G.; Wang, Y.; Shi, W.; Xia, G.; Fu, D.; et al. WheatOmics: A Platform Combining Multiple Omics Data to Accelerate Functional Genomics Studies in Wheat. Mol. Plant 2021, 14, 1965–1968. [Google Scholar] [CrossRef] [PubMed]
- Bi, H.; Liu, Z.; Liu, S.; Qiao, W.; Zhang, K.; Zhao, M.; Wang, D. Genome-Wide Analysis of Wheat Xyloglucan Endotransglucosylase/Hydrolase (XTH) Gene Family Revealed TaXTH17 Involved in Abiotic Stress Responses. BMC Plant Biol. 2024, 24, 640. [Google Scholar] [CrossRef]
- Zhang, W.; Zhang, Z.; Chen, Q.; Wang, Z.; Song, W.; Yang, K.; Xin, M.; Hu, Z.; Liu, J.; Peng, H.; et al. Mutation of a Highly Conserved Amino Acid in RPM1 Causes Leaf Yellowing and Premature Senescence in Wheat. Theor. Appl. Genet. 2023, 136, 254. [Google Scholar] [CrossRef]
- Chandra, S.; Kazmi, A.Z.; Ahmed, Z.; Roychowdhury, G.; Kumari, V.; Kumar, M.; Mukhopadhyay, K. Genome-Wide Identification and Characterization of NB-ARC Resistant Genes in Wheat (Triticum aestivum L.) and Their Expression during Leaf Rust Infection. Plant Cell Rep. 2017, 36, 1097–1112. [Google Scholar] [CrossRef]
- Gunupuru, L.R.; Arunachalam, C.; Malla, K.B.; Kahla, A.; Perochon, A.; Jia, J.; Thapa, G.; Doohan, F.M. A Wheat Cytochrome P450 Enhances Both Resistance to Deoxynivalenol and Grain Yield. PLoS ONE 2018, 13, e0204992. [Google Scholar] [CrossRef]
- Ma, M.; Wang, Q.; Li, Z.; Cheng, H.; Li, Z.; Liu, X.; Song, W.; Appels, R.; Zhao, H. Expression of TaCYP78A3, a Gene Encoding Cytochrome P450 CYP78A3 Protein in Wheat (Triticum aestivum L.), Affects Seed Size. Plant J. 2015, 83, 312–325. [Google Scholar] [CrossRef]
- Jiang, Q.; Hou, J.; Hao, C.; Wang, L.; Ge, H.; Dong, Y.; Zhang, X. The Wheat (T. aestivum) Sucrose Synthase 2 Gene (TaSus2) Active in Endosperm Development Is Associated with Yield Traits. Funct. Integr. Genom. 2011, 11, 49–61. [Google Scholar] [CrossRef]
- Lukaszewski, A.J.; Alberti, A.; Sharpe, A.; Kilian, A.; Stanca, A.M.; Keller, B.; Clavijo, B.J.; Friebe, B.; Gill, B.; Wulff, B.; et al. A Chromosome-Based Draft Sequence of the Hexaploid Bread Wheat (Triticum aestivum) Genome. Science 2014, 345, 1251788. [Google Scholar] [CrossRef]
- Pfeifer, M.; Kugler, K.G.; Sandve, S.R.; Zhan, B.; Rudi, H.; Hvidsten, T.R.; Mayer, K.F.X.; Olsen, O.A.; Rogers, J.; Doležel, J.; et al. Genome Interplay in the Grain Transcriptome of Hexaploid Bread Wheat. Science 2014, 345, 1250091. [Google Scholar] [CrossRef] [PubMed]
- Wei, J.; Cao, H.; Liu, J.-D.; Zuo, J.-H.; Fang, Y.; Lin, C.-T.; Sun, R.-Z.; Li, W.-L.; Liu, Y.-X. Insights into Transcriptional Characteristics and Homoeolog Expression Bias of Embryo and De-Embryonated Kernels in Developing Grain through RNA-Seq and Iso-Seq. Funct. Integr. Genom. 2019, 19, 919–932. [Google Scholar] [CrossRef] [PubMed]
- van Dongen, J.T.; Gupta, K.J.; Ramírez-Aguilar, S.J.; Araújo, W.L.; Nunes-Nesi, A.; Fernie, A.R. Regulation of Respiration in Plants: A Role for Alternative Metabolic Pathways. J. Plant Physiol. 2011, 168, 1434–1443. [Google Scholar] [CrossRef]
- Zayed, O.; Hewedy, O.A.; Abdelmoteleb, A.; Ali, M.; Youssef, M.S.; Roumia, A.F.; Seymour, D.; Yuan, Z.-C. Nitrogen Journey in Plants: From Uptake to Metabolism, Stress Response, and Microbe Interaction. Biomolecules 2023, 13, 1443. [Google Scholar] [CrossRef] [PubMed]
- White, J.; Sharma, R.; Balding, D.; Cockram, J.; Mackay, I.J. Genome-Wide Association Mapping of Hagberg Falling Number, Protein Content, Test Weight, and Grain Yield in U.K. Wheat. Crop Sci. 2022, 62, 965–981. [Google Scholar] [CrossRef]


| Trait | Mean± SD | Min | Max | Median | Skewness | Kurtosis | H2 |
|---|---|---|---|---|---|---|---|
| GSC [%] | 60.97 ± 1.14 | 56.2 | 65.8 | 61.0 | 0.01 | 0.32 | |
| kbp22 | 60.48 ± 0.75 | 57.3 | 62.3 | 60.5 | −0.56 | 0.93 | 0.70 |
| smh22 | 60.16 ± 0.82 | 57.5 | 62.2 | 60.2 | −0.15 | −0.21 | |
| sth22 | 61.15 ± 0.87 | 58.4 | 65.8 | 61.1 | 0.83 | 3.10 | |
| kbp23 | 61.09 ± 0.82 | 57.9 | 63.3 | 61.1 | −0.28 | 0.51 | 0.45 |
| smh23 | 60.49 ± 1.24 | 56.2 | 64.2 | 60.5 | 0.00 | 0.13 | |
| sth23 | 62.27 ± 0.72 | 60.0 | 65.6 | 62.2 | 0.46 | 0.73 | |
| GPC [%] | 11.31 ± 1.44 | 6.8 | 16.0 | 11.2 | 0.24 | −0.55 | |
| kbp22 | 12.37 ± 0.97 | 9.8 | 16 | 12.4 | 0.13 | 0.08 | 0.79 |
| smh22 | 12.92 ± 0.99 | 10.4 | 15.7 | 12.9 | 0.04 | −0.37 | |
| sth22 | 10.73 ± 0.72 | 6.8 | 12.9 | 10.7 | −0.24 | 1.46 | |
| kbp23 | 10.92 ± 0.96 | 8.4 | 13.7 | 10.9 | 0.04 | −0.36 | 0.78 |
| smh23 | 11.71 ± 1.15 | 8.7 | 14.8 | 11.7 | 0.05 | −0.38 | |
| sth23 | 9.61 ± 0.65 | 8.10 | 11.70 | 9.60 | 0.36 | 0.11 | |
| GFAC [ppm] | 91.11 ± 32.71 | 26.67 | 227.16 | 89.79 | 0.52 | 0.97 | 0.51 |
| Trait | MTA | DArTseq Marker | IWGSC v2.1 | Position [Mbp] | p-Value | R2 [%] | MAF | Effect |
|---|---|---|---|---|---|---|---|---|
| GPC_2022 | QGpc.rut.2A.1 | 1064413 | 2A | 0.9 | 8.31 × 10⁻⁵ | 8.2 | 0.106 | −0.673 |
| GPC_2022 | QGpc.rut.2A.2 | 1090321 | 2A | 11.6 | 2.47 × 10⁻⁴ | 7.1 | 0.444 | 0.449 |
| GPC_2022 | QGpc.rut.2A.3 | 3961191 | 2A | 18.2 | 9.73 × 10⁻⁵ | 8.0 | 0.424 | 0.572 |
| GPC_2022 | QGpc.rut.2A.3 | 7354314 | 2A | 21.3 | 2.03 × 10⁻⁴ | 7.3 | 0.479 | 0.376 |
| GPC_2022 | QGpc.rut.2D | 1090962 | 2D | 16.6 | 1.43 × 10⁻⁴ | 7.6 | 0.344 | 0.281 |
| GPC_2023 | QGpc.rut.2D | 4990459 | 2D | 16.6 | 1.20 × 10⁻⁵ | 10.2 | 0.017 | 1.620 |
| GPC_2022 | QGpc.rut.3A | 13880651 | 3A | 10.5 | 1.09 × 10⁻⁴ | 7.9 | 0.088 | −0.648 |
| GPC_2022 | QGpc.rut.3B | 4004943 | 3B | 23.2 | 1.07 × 10⁻⁴ | 7.9 | 0.309 | 0.297 |
| GPC_2022 | QGpc.rut.5B.1 | 16662440 | 5B | 334.8 | 1.49 × 10⁻⁴ | 7.6 | 0.129 | 0.376 |
| GPC_2022 | QGpc.rut.5B.2 | 1058250 | 5B | 359.8 | 3.30 × 10⁻⁴ | 6.8 | 0.109 | 0.390 |
| GPC_2022 | QGpc.rut.5B.3 | 3935268 | 5B | 426.2 | 2.65 × 10⁻⁴ | 7.0 | 0.153 | 0.383 |
| GPC_2022 | QGpc.rut.5B.4 | 1385698 | 5B | 534.3 | 3.36 × 10⁻⁴ | 6.8 | 0.076 | 0.493 |
| GPC_2022 | QGpc.rut.6A | 1116192 | 6A | 5.9 | 1.12 × 10⁻⁴ | 7.9 | 0.191 | 0.363 |
| GPC_2022 | QGpc.rut.7B | 1080641 | 7B | 68.7 | 1.06 × 10⁻⁴ | 8.0 | 0.068 | 0.594 |
| MTA | DArTseq Marker | IWGSC v2.1 | Position [Mbp] | p-Value | R2 [%] | MAF | Effect |
|---|---|---|---|---|---|---|---|
| QGsc.rut.1B.3 | 7352878 | 1B | 644.8 | 2.43 × 10⁻⁵ | 10.9 | 0.230 | −0.878 |
| QGsc.rut.1B.4 | 5324459 | 1B | 685.6 | 2.71 × 10⁻⁵ | 10.7 | 0.371 | −0.390 |
| QGsc.rut.3B | 7353108 | 3B | 105.1 | 2.09 × 10⁻⁴ | 8.3 | 0.236 | −0.779 |
| QGsc.rut.3D.2 | 1708238 | 3D | 107.5 | 2.55 × 10⁻⁵ | 10.8 | 0.227 | −0.829 |
| QGsc.rut.3D.4 | 7353553 | 3D | 613.1 | 2.21 × 10⁻⁴ | 8.2 | 0.164 | −0.815 |
| QGsc.rut.3D.4 | 7352096 | 3D | 617.1 | 1.15 × 10⁻⁴ | 9.0 | 0.233 | −0.777 |
| QGsc.rut.4A.2 | 2256486 | 4A | 695.4 | 2.64 × 10⁻⁴ | 8.0 | 0.417 | −0.325 |
| QGsc.rut.5A.1 | 1204378 | 5A | 7.4 | 1.64 × 10⁻⁴ | 8.6 | 0.103 | −0.519 |
| QGsc.rut.5A.4 | 1059886 | 5A | 569.7 | 1.93 × 10⁻⁴ | 8.4 | 0.086 | −0.658 |
| QGsc.rut.5B.4 | 1110565 | 5B | 574.2 | 3.04 × 10⁻⁴ | 7.8 | 0.342 | −0.322 |
| QGsc.rut.6D | 1066660 | 6D | 477.9 | 2.59 × 10⁻⁴ | 8.0 | 0.187 | 0.753 |
| QGsc.rut.7A.2 | 1127783 | 7A | 116.1 | 1.57 × 10⁻⁴ | 8.6 | 0.057 | −0.788 |
| QGsc.rut.7A.4 | 4909952 | 7A | 698.7 | 7.90 × 10⁻⁶ | 12.2 | 0.066 | −0.912 |
| QGsc.rut.7B.1 | 2276168 | 7B | 8.6 | 3.08 × 10⁻⁴ | 7.8 | 0.374 | 0.288 |
| QGsc.rut.7B.3 | 1067031 | 7B | 470.7 | 1.25 × 10⁻⁵ | 11.7 | 0.052 | −0.988 |
| QGsc.rut.7B.4 | 3935071 | 7B | 610.8 | 2.02 × 10⁻⁴ | 8.3 | 0.411 | −0.311 |
| MTA | SNP Marker | IWGSC v2.1 | Position [Mbp] | p-Value | R2 [%] | MAF | Effect |
|---|---|---|---|---|---|---|---|
| QGfac.rut.1B.1 | 4989859 | 1B | 468.9 | 1.52 × 10⁻⁵ | 11.9 | 0.293 | −14.28 |
| QGfac.rut.1B.2 | 1023929 | 1B | 481.0 | 1.53 × 10⁻⁴ | 8.5 | 0.207 | 13.48 |
| QGfac.rut.1B.3 | 996356 | 1B | 491.1 | 7.00 × 10⁻⁴ | 7.6 | 0.169 | 9.54 |
| QGfac.rut.1B.3 | 1063426 | 1B | 495.3 | 3.68 × 10⁻⁴ | 8.4 | 0.186 | 9.72 |
| QGfac.rut.1D.1 | 985475 | 1D | 20.5 | 3.39 × 10⁻⁴ | 7.3 | 0.494 | 7.89 |
| QGfac.rut.1D.2 | 1043337 | 1D | 368.0 | 1.07 × 10⁻³ | 6.9 | 0.130 | 14.40 |
| QGfac.rut.1D.3 | 1128816 | 1D | 423.0 | 1.06 × 10⁻³ | 6.3 | 0.112 | 11.33 |
| QGfac.rut.2B.1 | 7940434 | 2B | 31.5 | 1.06 × 10⁻³ | 6.3 | 0.337 | 7.09 |
| QGfac.rut.2B.2 | 1021699 | 2B | 111.5 | 1.01 × 10⁻³ | 6.3 | 0.157 | 10.43 |
| QGfac.rut.2B.3 | 1201965 | 2B | 516.7 | 9.11 × 10⁻⁴ | 7.2 | 0.210 | 9.03 |
| QGfac.rut.2D.1 | 1019419 | 2D | 35.8 | 1.32 × 10⁻⁴ | 9.1 | 0.154 | −12.22 |
| QGfac.rut.2D.2 | 2242065 | 2D | 496.8 | 1.84 × 10⁻⁴ | 8.7 | 0.183 | 15.04 |
| QGfac.rut.3A | 1069217 | 3A | 0.9 | 7.58 × 10⁻⁴ | 7.0 | 0.379 | −7.16 |
| QGfac.rut.3B.1 | 5005709 | 3B | 2.5 | 9.50 × 10⁻⁴ | 6.7 | 0.388 | −7.16 |
| QGfac.rut.3B.2 | 1081766 | 3B | 256.1 | 3.97 × 10⁻⁵ | 10.2 | 0.287 | −14.40 |
| QGfac.rut.3B.3 | 1101184 | 3B | 837.2 | 2.92 × 10⁻⁴ | 7.8 | 0.402 | 8.07 |
| QGfac.rut.3D | 1109137 | 3D | 40.6 | 6.99 × 10⁻⁴ | 7.1 | 0.183 | −8.94 |
| QGfac.rut.4A | 983765 | 4A | 698.2 | 4.96 × 10⁻⁴ | 6.7 | 0.266 | −9.02 |
| QGfac.rut.5B.1 | 3941721 | 5B | 634.2 | 9.91 × 10⁻⁴ | 6.3 | 0.322 | 7.63 |
| QGfac.rut.5B.2 | 1266853 | 5B | 697.9 | 9.76 × 10⁻⁴ | 6.8 | 0.180 | −8.50 |
| QGfac.rut.5D | 1139602 | 5D | 122.2 | 4.82 × 10⁻⁴ | 7.7 | 0.414 | −7.23 |
| QGfac.rut.6B.1 | 1250105 | 6B | 18.8 | 1.04 × 10⁻³ | 6.6 | 0.296 | 7.90 |
| QGfac.rut.6B.2 | 4992737 | 6B | 245.3 | 9.28 × 10⁻⁴ | 6.3 | 0.311 | −7.54 |
| QGfac.rut.6B.3 | 1009606 | 6B | 313.1 | 8.62 × 10⁻⁴ | 6.7 | 0.479 | −7.12 |
| QGfac.rut.6B.4 | 1001121 | 6B | 323.2 | 2.33 × 10⁻⁴ | 7.9 | 0.482 | −8.28 |
| QGfac.rut.6B.5 | 2322830 | 6B | 356.0 | 3.10 × 10⁻⁴ | 7.6 | 0.476 | −7.87 |
| QGfac.rut.6B.6 | 3533239 | 6B | 375.6 | 4.02 × 10⁻⁴ | 7.2 | 0.459 | −7.42 |
| QGfac.rut.6B.7 | 1089420 | 6B | 708.3 | 2.51 × 10⁻⁴ | 8.7 | 0.376 | 8.32 |
| QGfac.rut.6D.1 | 998928 | 6D | 181.1 | 5.46 × 10⁻⁴ | 6.9 | 0.281 | 13.93 |
| QGfac.rut.6D.2 | 1016778 | 6D | 418.4 | 6.77 × 10⁻⁴ | 7.3 | 0.269 | 13.52 |
| QGfac.rut.7A.1 | 1017632 | 7A | 25.8 | 1.94 × 10⁻⁴ | 8.7 | 0.349 | 9.24 |
| QGfac.rut.7A.2 | 1011371 | 7A | 413.0 | 2.34 × 10⁻⁴ | 8.1 | 0.062 | 16.25 |
| QGfac.rut.7A.3 | 1862702 | 7A | 477.5 | 1.84 × 10⁻⁴ | 8.4 | 0.053 | 18.50 |
| QGfac.rut.7A.4 | 994119 | 7A | 549.9 | 8.87 × 10⁻⁵ | 9.2 | 0.068 | 16.99 |
| QGfac.rut.7A.5 | 1696589 | 7A | 622.0 | 5.22 × 10⁻⁴ | 7.1 | 0.139 | 14.74 |
| QGfac.rut.7A.6 | 3953081 | 7A | 638.9 | 1.86 × 10⁻⁵ | 11.2 | 0.189 | 12.71 |
| QGfac.rut.7A.7 | 994476 | 7A | 656.7 | 1.71 × 10⁻⁴ | 8.4 | 0.062 | 17.59 |
| QGfac.rut.7A.8 | 1331106 | 7A | 702.8 | 9.12 × 10⁻⁴ | 7.1 | 0.322 | 8.10 |
| QGfac.rut.7B.9 | 985944 | 7B | 756.0 | 8.64 × 10⁻⁴ | 6.5 | 0.210 | 8.56 |
| QGfac.rut.7D.1 | 2269456 | 7D | 15.4 | 8.07 × 10⁻⁴ | 6.5 | 0.080 | 18.25 |
| QGfac.rut.7D.2 | 1022222 | 7D | 77.7 | 1.97 × 10⁻⁴ | 8.0 | 0.464 | 10.81 |
| QGfac.rut.7D.3 | 1062859 | 7D | 114.5 | 2.91 × 10⁻⁴ | 7.8 | 0.192 | 10.88 |
| QGfac.rut.7D.4 | 1236791 | 7D | 633.0 | 5.49 × 10⁻⁵ | 9.9 | 0.115 | 14.02 |
Disclaimer/Publisher’s Note: The statements, opinions and data contained in all publications are solely those of the individual author(s) and contributor(s) and not of MDPI and/or the editor(s). MDPI and/or the editor(s) disclaim responsibility for any injury to people or property resulting from any ideas, methods, instructions or products referred to in the content. |
© 2025 by the authors. Licensee MDPI, Basel, Switzerland. This article is an open access article distributed under the terms and conditions of the Creative Commons Attribution (CC BY) license (https://creativecommons.org/licenses/by/4.0/).
Share and Cite
Rączka, K.; Matysik, P.; Drzazga, T.; Dorczyk, A.; Olejniczak-Idczak, M.; Tyrka, D.; Tyrka, M. Markers Associated with Starch, Protein and Asparagine Content in Grain of Common Wheat. Genes 2025, 16, 661. https://doi.org/10.3390/genes16060661
Rączka K, Matysik P, Drzazga T, Dorczyk A, Olejniczak-Idczak M, Tyrka D, Tyrka M. Markers Associated with Starch, Protein and Asparagine Content in Grain of Common Wheat. Genes. 2025; 16(6):661. https://doi.org/10.3390/genes16060661
Chicago/Turabian StyleRączka, Kinga, Przemysław Matysik, Tadeusz Drzazga, Ada Dorczyk, Marta Olejniczak-Idczak, Dorota Tyrka, and Mirosław Tyrka. 2025. "Markers Associated with Starch, Protein and Asparagine Content in Grain of Common Wheat" Genes 16, no. 6: 661. https://doi.org/10.3390/genes16060661
APA StyleRączka, K., Matysik, P., Drzazga, T., Dorczyk, A., Olejniczak-Idczak, M., Tyrka, D., & Tyrka, M. (2025). Markers Associated with Starch, Protein and Asparagine Content in Grain of Common Wheat. Genes, 16(6), 661. https://doi.org/10.3390/genes16060661