Article

Comparative Analysis of Plastomes of Artemisia and Insights into the Infra-Generic Phylogenetic Relationships Within the Genus

1
College of Life and Environmental Sciences, Hangzhou Normal University, Hangzhou 311121, China
2
Zhejiang Provincial Key Laboratory for Genetic Improvement and Quality Control of Medicinal Plants, Hangzhou Normal University, Hangzhou 311121, China
*
Author to whom correspondence should be addressed.
Genes 2025, 16(6), 659; https://doi.org/10.3390/genes16060659
Submission received: 24 April 2025 / Revised: 24 May 2025 / Accepted: 28 May 2025 / Published: 29 May 2025
(This article belongs to the Topic Plant Chloroplast Genome and Evolution)

Abstract

Background: Artemisia is a large and complex genus comprising about 500 species. Currently, only a limited number of plastomes (the chloroplast genome) of Artemisia are available. Their structures have not been comparatively analyzed, and a phylogenetic backbone based on plastome-scale data is still lacking. This situation has greatly hindered our understanding of the plastome variation patterns and infra-generic relationships of the genus. Methods: We newly sequenced 34 Artemisia plastomes representing 30 species and three varieties. Combining this with previously published plastomes, we comparatively analyzed their structure and constructed phylogenetic relationships using the protein-coding sequences (CDS) of plastomes. Results: Our analyses indicated that the Artemisia plastomes are conserved in terms of their structure, GC content, gene number, and order. The sequence divergence is higher in the LSC and SSC regions than in the IR regions. Three protein-coding genes and four non-coding regions, i.e., accD, petG, ycf1, rpoC1-rpoC2, rpoC2-rps2, trnG(UCC)-trnfM(CAU), and ndhG-ndhI, were highly diverse and could be chosen as candidates of DNA barcodes. Phylogenetic trees were divided into several clades, and all four main subgenera were not monophyletic. Additionally, the phylogenetic position of A. stracheyi is still controversial. Conclusions: Plastomes can provide important information for phylogenetic constructions. This study provides insights into the infra-generic relationships within Artemisia and also lays a foundation for future evolutionary studies of this genus.

1. Introduction

Artemisia is the largest genus in the tribe Anthemideae of Asteraceae, comprising about 500 species [1,2,3,4]. Members of this genus are mainly distributed in temperate regions of the Northern Hemisphere, with a few species occurring in Africa, South America, and the Hawaiian Islands [1,2,3,4,5,6]. Members of this genus, i.e., A. argyi H. Lév. & Vaniot and A. capillaris Thunb. have been widely used as traditional herbal remedies in China, and some species have broad applications as food or forage. The most famous one is undoubtedly A. annua L. Youyou Tu discovered the anti-malaria artemisinin from this species and was awarded the Nobel Prize in Physiology or Medicine in 2015 [7,8,9]. This genus thus receives extensive scientific attention, especially in the fields of phytochemistry and pharmacology.
Artemisia represents one of the most notoriously difficult groups in plant taxonomy, largely due to the complex variation patterns of characters [2,3]. Historically, morphological characters were widely used to divide taxa and unravel the relationships within the genus. This has resulted in continuous taxonomic rearrangements [1,2,3,4,10,11,12,13,14,15,16]. Infra-generic classifications divided the genus into subgenera, but sections or series were also consecutively proposed. Among them, the generally accepted one comprises four subgenera, including subg. Absinthium (Miller) Less., subg. Artemisia, subg. Dracunculus (Besser) Rydb., and subg. Seriphidium Besser ex Less., and are mainly based on the type of capitula, fertility of disk florets, and hairy receptacles [3,4]. However, phylogenetic studies using a limited number of molecular markers (e.g., ITS, psbAtrnH, rpl32–trnH, trnL–trnF, and trnS–trnC) revealed that the infra-generic phylogenetic relationships of Artemisia were, to some degree, incongruent with the divisions based on morphological characters [5,17,18,19,20]. Subg. Absinthium, subg. Dracunculus, and subg. Seriphidium were not monophyletic. Species previously assigned to subg. Artemisia were even scattered into several clades. Furthermore, subg. Tridentatae (Rydb.) McArthur and subg. Pacifica Hobbs & Baldwin were proposed so as to accommodate some species occurring in America and three Hawaiian endemic species (A. australis, A. kauaiensis, and A. mauiensis) together with A. chinensis, respectively [5]. Using nuclear single-nucleotide polymorphism (SNP) data that were obtained by genome-skimming sequencing technology, Jiao et al. reconstructed a phylogeny for Artemisia consisting of eight main clades. Accordingly, they proposed a revised clade-based infra-generic classification, dividing the genus into eight subgenera [21]. To some extent, the discordance about the infra-generic relationships reflects the complex evolutionary history of Artemisia.
Plastids (chloroplasts), commonly found in plants, are important in plant growth and development [22,23,24]. Typically, the plastome (chloroplast genome) is a closed loop with a quadripartite structure comprising a large single-copy region (LSC), a small single-copy region (SSC), and two inverted repeat regions (IRa and IRb). In angiosperms, the length usually ranges from 120–200 kb. Each genome tends to contain approximately 80 protein-coding genes, four rRNAs, and 30 tRNAs [25,26]. Due to its small size, uniparental inheritance, conserved sequence and structure, and high cellular copy numbers, the plastome has been an advantageous resource for various evolutionary studies [27]. Some plastid genes (rbcL, matK) have been extensively used to estimate phylogenetic relationships at deep and shallow levels [26,27,28,29,30]. Some faster-evolving genes (i.e., matK, ndhF, rbcL, and rpoC1) and spacer regions (i.e., atpF-atpH, psbK-psbI, and trnH-psbA) have been developed as DNA barcode markers to identify taxa [31]. In Artemisia, a few plastid regions, including psbA–trnH, rpl32–trnH, and trnS–trnC, usually concatenated with nuclear regions (ITS and ETS), were used to construct generic or infra-generic phylogenetic relationships and explore the evolutionary history of the genus [5,6,7,17,18,19,20,32].
With the advancement of next-generation sequencing (NGS) technology and the decrease in sequencing costs, it is becoming easier to obtain complete plastome sequences. The plastome data have exhibited greater potential for resolving challenging phylogenetic relationships in a wide spectrum of plant lineages, e.g., Eriocaulon L. (Eriocaulaceae), Trigonotis Steven (Boraginaceae), Apocynaceae, and Ophioglossaceae [26,27,28,29,30,33,34]. Numerous historically difficult issues in plant phylogenetics have been satisfactorily addressed, indicating the indispensable role played by plastomes. For Artemisia, Kim et al. first conducted a comparative analysis of the plastomes of 32 Artemisia species in East Asia [35]. The study revealed that the coding sequences of accD and ycf1 were under weak positive selection and highly variable. The plastomes were sufficiently polymorphic for use as super-barcodes [35]. They further confirmed that subg. Artemisia was not monophyletic. Using a plastome data matrix of 38 species, including 18 species from subg. Seriphidium, Jin et al. found that subg. Seriphidium was inserted into the main clade of Artemisia and segregated into two main clades [36]. Furthermore, their structural analysis indicated that the plastomes are relatively conserved, with some variations only in the IR borders. At the National Center for Biotechnology Information (NCBI), only a limited number of plastomes of Artemisia are available. In contrast with the large number of taxa in the genus, the percentage of sequenced plastomes did not match the Artemisia biodiversity well. There are still gaps in our knowledge of the general variation pattern of Artemisia plastomes, especially regarding their structure, gene order, IR/SC boundary, and IR expansion. A finer-scale phylogenetic relationship, constructed using plastid data with more informative characters and denser taxon sampling, is still lacking. Comparisons between phylogenies constructed using data from nuclear DNA and plastome to explore cyto-nuclear (i.e., chloroplast–nuclear) discordance are also needed.
Considering this situation, we newly sequenced, assembled, and annotated 34 Artemisia plastomes representing 30 species and three varieties in this study. Combining this with previously published Artemisia plastomes from a public database, we conducted comparative analyses and constructed phylogenies in order to (1) study the plastome variation patterns of this genus, (2) identify variable regions as DNA barcode candidates for future taxa identification, and (3) recover the backbone of the Artemisia phylogeny using a plastome-scale dataset. Overall, this study will improve our knowledge of Artemisia plastomes, provide potential genetic markers for taxa identification, and also advance our understanding of the phylogenetic relationships within the genus.

2. Materials and Methods

2.1. Taxa Sampling, DNA Extraction, and Sequencing

In this study, we newly sequenced 34 plastomes representing 30 species and three varieties of Artemisia (Table 1). Detailed information on the taxon, voucher specimen, and collection locality is provided in Table S1. All the materials were collected during our field trips in China. The voucher specimens were all identified by Xinqiang Guo, the first author of this study, and deposited in the Herbarium of South China Botanical Garden, Chinese Academy of Sciences (IBSC). Additionally, we also downloaded 38 Artemisia plastomes (representing 34 species and one form) from the NCBI Genbank database (https://www.ncbi.nlm.nih.gov/nuccore/, accessed on 1 May 2024) (Table S2). A total of 72 plastomes of Artemisia were obtained and used in a comparative plastome analysis. For phylogenetic reconstruction, three plastomes representing three species of Ajania (A. fruticulosa (Ledeb.) Poljak., A. nematoloba (Hand.-Mazz.) Ling & Shih, A. khartensis (Dunn.) Shih), and Chrysanthemum przewalskii (Poljakov) H. Ohashi & Yonek., were selected as outgroups.
Fresh leaves were dried with silica gel and kept in a refrigerator. High-quality total genomic DNA of the plant samples was extracted from 10 mg of silica gel-dried leaves using a modified CTAB (cetyl trimethyl ammonium bromide) DNA extraction method [37]. The DNA samples were sent to Shanghai Personal Biotechnology Co., Ltd. (Shanghai, China), and a 150 bp paired-ended library with an average insert size of approximately 400 bp was prepared according to the manufacturer’s manual (Illumina, San Diego, CA, USA). Shotgun sequencing was performed on the Illumina NovaSeq 6000 platform. Approximately 3 Gb of raw reads were generated for each sample.
Table 1. Summary of the 34 plastomes newly sequenced in this study.
TaxonGenbank Accession NumberNucleotide Length (bp)Number of GenesGC Content
TotalLSCSSCIRProtein-Coding GenesrRNA GenestRNA Genes(%)
A. sichuanensisPP898074151,23082,93518,37524,9608737837.50%
A. adamsiiPP898105151,23182,95518,33724,9698737837.40%
A. bhutanicaPP898085151,26982,94918,39824,9618737837.50%
A. blepharolepisPP898101150,90882,96318,01924,9638737837.50%
A. comaiensisPP898079151,29882,93018,44824,9608737837.50%
A. fulgens var. meiguensisPP898075151,20182,85618,42524,9608737837.50%
A. gyitangensisPP898091151,19982,81018,47124,9598737837.50%
A. integrifoliaPP898104151,11782,91218,28524,9608737837.40%
A. jilongensisPP898086151,27582,53818,88324,9278737837.50%
A. linyoureunensisPP898096151,17482,71818,59424,9318737837.50%
A. maireiPP898080151,04582,91118,20024,9678737837.50%
A. mattfeldii var. etomentosaPP898076151,08782,92918,23824,9608737837.50%
A. minorPP898083151,08382,55618,67324,9278737837.50%
A. mongolicaPP898103151,19382,79518,47824,9608737837.50%
A. neosinensisPP898094151,17282,83218,42224,9598737837.50%
A. nortoniiPP898084151,02882,87318,23524,9608737837.50%
A. phyllobotrysPP898077151,17182,93118,31224,9648737837.50%
A. qinlingensisPP898098151,18182,92118,32624,9678737837.50%
A. selengensis-1PP898102151,22882,90218,40624,9608737837.50%
A. sericeaPP898073150,87082,85218,09424,9628737837.50%
A. smithiiPP898097151,22583,03718,27224,9588737837.40%
A. stracheyiPP898081151,32782,93718,47024,9608737837.50%
A. strictaPP898082150,77082,91117,93924,9608737837.50%
A. sylvaticaPP898100151,20082,98218,29624,9618737837.40%
A. tafelliiPP898088151,27482,93718,41724,9608737837.50%
A. tanguticaPP898099151,19182,83318,45224,9538737837.50%
A. tournefortianaPP898072151,10682,60018,60624,9508737837.50%
A. tridactylaPP898095150,65482,81017,94624,9498737837.50%
A. viscidissimaPP898078151,24182,65518,62224,9828737837.50%
A. waltoniiPP898087151,03882,90918,20924,9608737837.50%
A. waltonii var. yushuensisPP898092150,63682,98117,73524,9608737837.40%
A. youngiiPP898089151,24982,94818,36324,9698737837.40%
A. yunnanensi-1PP898090151,19082,98718,28324,9608737837.40%
A. yunnanensis-2PP898093151,23282,97718,33524,9608737837.40%

2.2. Plastome Assembly and Annotation

Trimmomatic v.0.40 [38] was used to remove adapters and filter low-quality reads. NOVOPlasty v2.5.9 [39] and GetOrganelle pipeline v1.7.2 [40] were used to de novo assemble plastomes with the suggested default parameters, with the complete plastome sequence of A. annua (Genbank Accession Number: KY085890.1) used as a reference. The obtained scaffolds were checked using Bandage v0.8.1 [41]. Assembled plastomes were annotated by using the program GeSeq [42] and Plastid Genome Annotator (PGA) [43], with the annotated plastome of A. annua (GenBank Accession Number: KY085890.1) used as a reference. To precisely define the start and stop codons, intron boundaries, and tRNA genes, annotations were manually adjusted according to the reference plastome in Geneious Primer v2021.0.3 (Biomatters Ltd., Auckland, New Zealand). The 34 newly sequenced plastomes were deposited into the GenBank database (Table S1). The raw data and plastome sequences downloaded from NCBI were reassembled and reannotated following the procedures of the newly sequenced samples. The circular plastid genome maps were visualized using OrganellarGenome DRAW v1.3.1 [44].

2.3. Comparative Analyses, Identification of Divergence Hotspots, and Simple Sequence Repeats

We selected 23 plastomes (representing 22 species and one variety) of Artemisia to conduct plastome comparisons using the mVISTA program with the Shuffle-LAGAN model [45]. The annotation of A. sieversiana (GenBank Accession Number: ON729303) was chosen as a reference. To identify potential hotspots of nucleotide diversity in 72 Artemisia plastomes, the protein-coding sequences (CDSs) and intergeneric regions were extracted, respectively, and aligned using MUSCLE v.3.8.31 [46] with the default parameters. Then, the nucleotide diversity was estimated using DnaSP v.6 [47], with the window length set as the whole length of each matrix (Table S3). To have a comprehensive overview of the IR expansion or contraction in the plastomes of Artemisia, we selected 66 plastomes and visualized the borders of the IR/SC regions using CPJSdraw v1.0.0 [48]. Simple sequence repeats (SSRs) of 72 plastomes (Table S4) were identified using MISA-web (MicroSAtellite; https://pgrc.ipk-gatersleben.de/misa/, accessed on 1 May 2024) [49] with the threshold repeat numbers of 10, 5, 4, 3, 3, and 3 for the mono-, di-, tri-, tetra-, penta-, and hexa-nucleotides, respectively.

2.4. Phylogenetic Analysis

The CDSs of 76 plastomes, including 72 of Artemisia, three of Ajania (A. fruticulosa, A. nematoloba, A. khartensis), and one of Chrysanthemum (C. przewalskii), were extracted using PhyloSuit v7.3.1 [50] and Geneious Primer v2021.0.3. The datasets were aligned using MUSCLE v. 3.8.31 [46] and manually adjusted using AliView v1.26 [51]. All the individual CDS matrices were concatenated into a single supermatrix using Geneious Primer v2021.0.3.
PartitionFinder 2 [52] was used to determine the best-fit partitioning scheme and the most suitable substitution model. Bayesian phylogenies were constructed using MrBayes v3.2.7a [53]. Two parallel analyses, each with four chains (one cold and three hot chains), were run for 40 million Markov Chain Monte Carlo (MCMC) generations, with the trees being sampled every 1000 generations. The first 25% of the sampled trees were discarded as burn-ins. The remaining trees were used to estimate the posterior probabilities (PP). Tracer v.1.6 [54] was used to ensure convergence and adequate sampling with the average standard deviation of split frequencies < 0.01 and effective sample sizes (ESS) of all parameters > 200. The maximum likelihood (ML) analysis was carried out in RAxML-HPC v8.2.12 [55] with 1000 bootstrap replicates using a fast bootstrapping algorithm (MLBS) to assess node support. Bootstrap percentage (MLBS and MPBS) values of ≥70 and PP values of ≥0.95 were regarded as strong support. The final tree files were visualized in FigTree v1.4.3 (https://tree.bio.ed.ac.uk/software/figtree/, accessed on 1 May 2024) and TreeGraph v2.15.0-887 beta [56].

3. Results

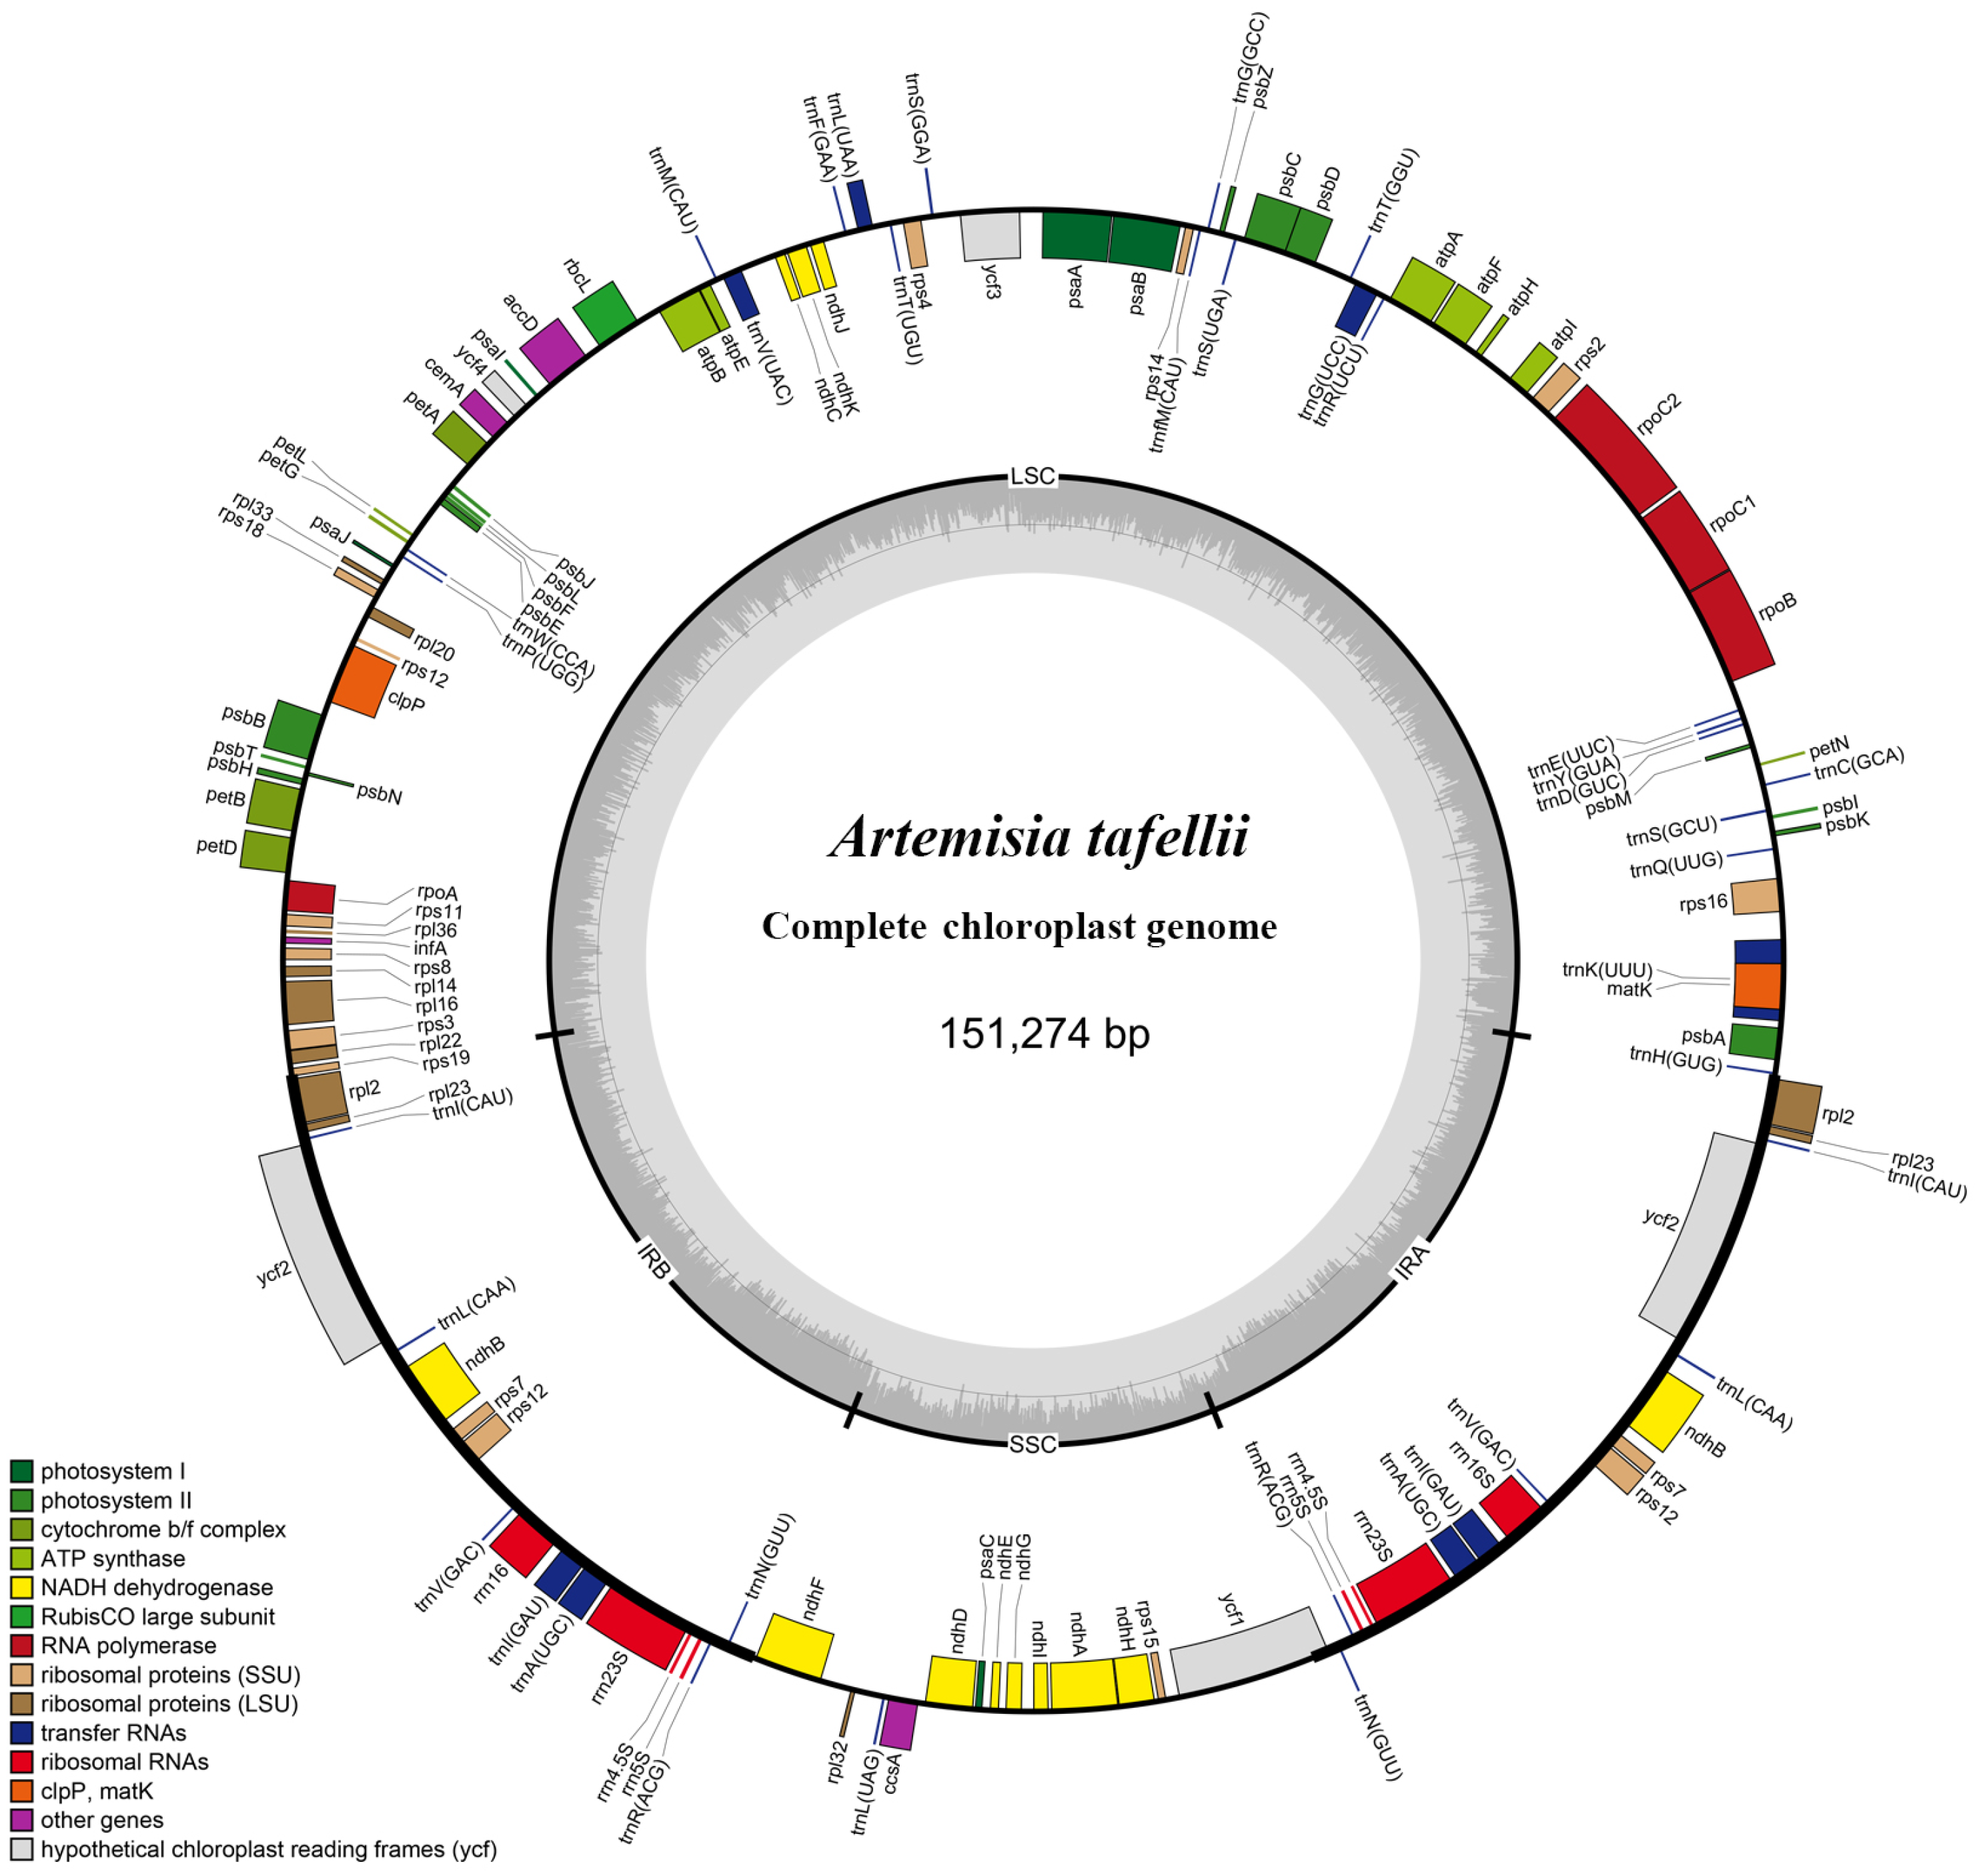
3.1. Plastome Features of Artemisia Species

A total of 72 Artemisia plastomes were included in this study, representing 63 species, three varieties, and one form (Table 1, Tables S1 and S2). Among them, 34 plastomes of 30 species and three varieties were newly sequenced and assembled in this study (Table 1 and Table S1). All plastomes showed a typical quadripartite structure, comprising a large single-copy (LSC) region, a small single-copy (SSC) region, and two inverted repeated (IRa/b) regions (Figure 1). Their sizes ranged from 150,586 bp (A. ferganensis) to 151,327 bp (A. stracheyi), with a difference of 741 bp and a mean length of 151,108 bp. The lengths of the LSC, SSC, and IR regions were 82,313–83,061 bp, 17,735–18,883 bp, and 24,927–24,985 bp, respectively. The total GC content ranged from 37.40% to 37.51%, with a mean value of 37.50%. The gene categories were rather conserved. A total of 132 genes, including 87 protein-coding genes, 37 tRNA genes, and eight rRNA genes, were included in every plastome. Detailed information on these plastomes is provided in Table 1, Tables S1 and S2.
The boundaries between the IR and SC regions were compared in 66 Artemisia plastomes that represented 62 species, three varieties, and one form. All of them have the same type of SC/IR junctions (Figure 2 and Figure S1). The LSC/IRb junction borders (JLB) were located in the gene rps19, with four types recovered. The length of rps19 in the LSC was 207–219 bp and 60–72 bp in the IRb region. The dominant type was 219 bp in the LSC region and 60 bp in the IRb region. The SSC/IRa junction borders (JSA) were located in the gene ycf1, with 4428–4500 bp in the SSC region and 556–565 bp in the IRa region. At the IRb/SSC junction borders (JSB), the distances between the gene ndhF and the border range were 42–82 bp. At the LSC/IRa junction borders (JLA), the distances between the gene trnH and the border range were 2–135 bp. The IR regions were highly conserved and similar in length and structure. Additionally, no gene rearrangements, inversions, or losses among these plastomes were found.

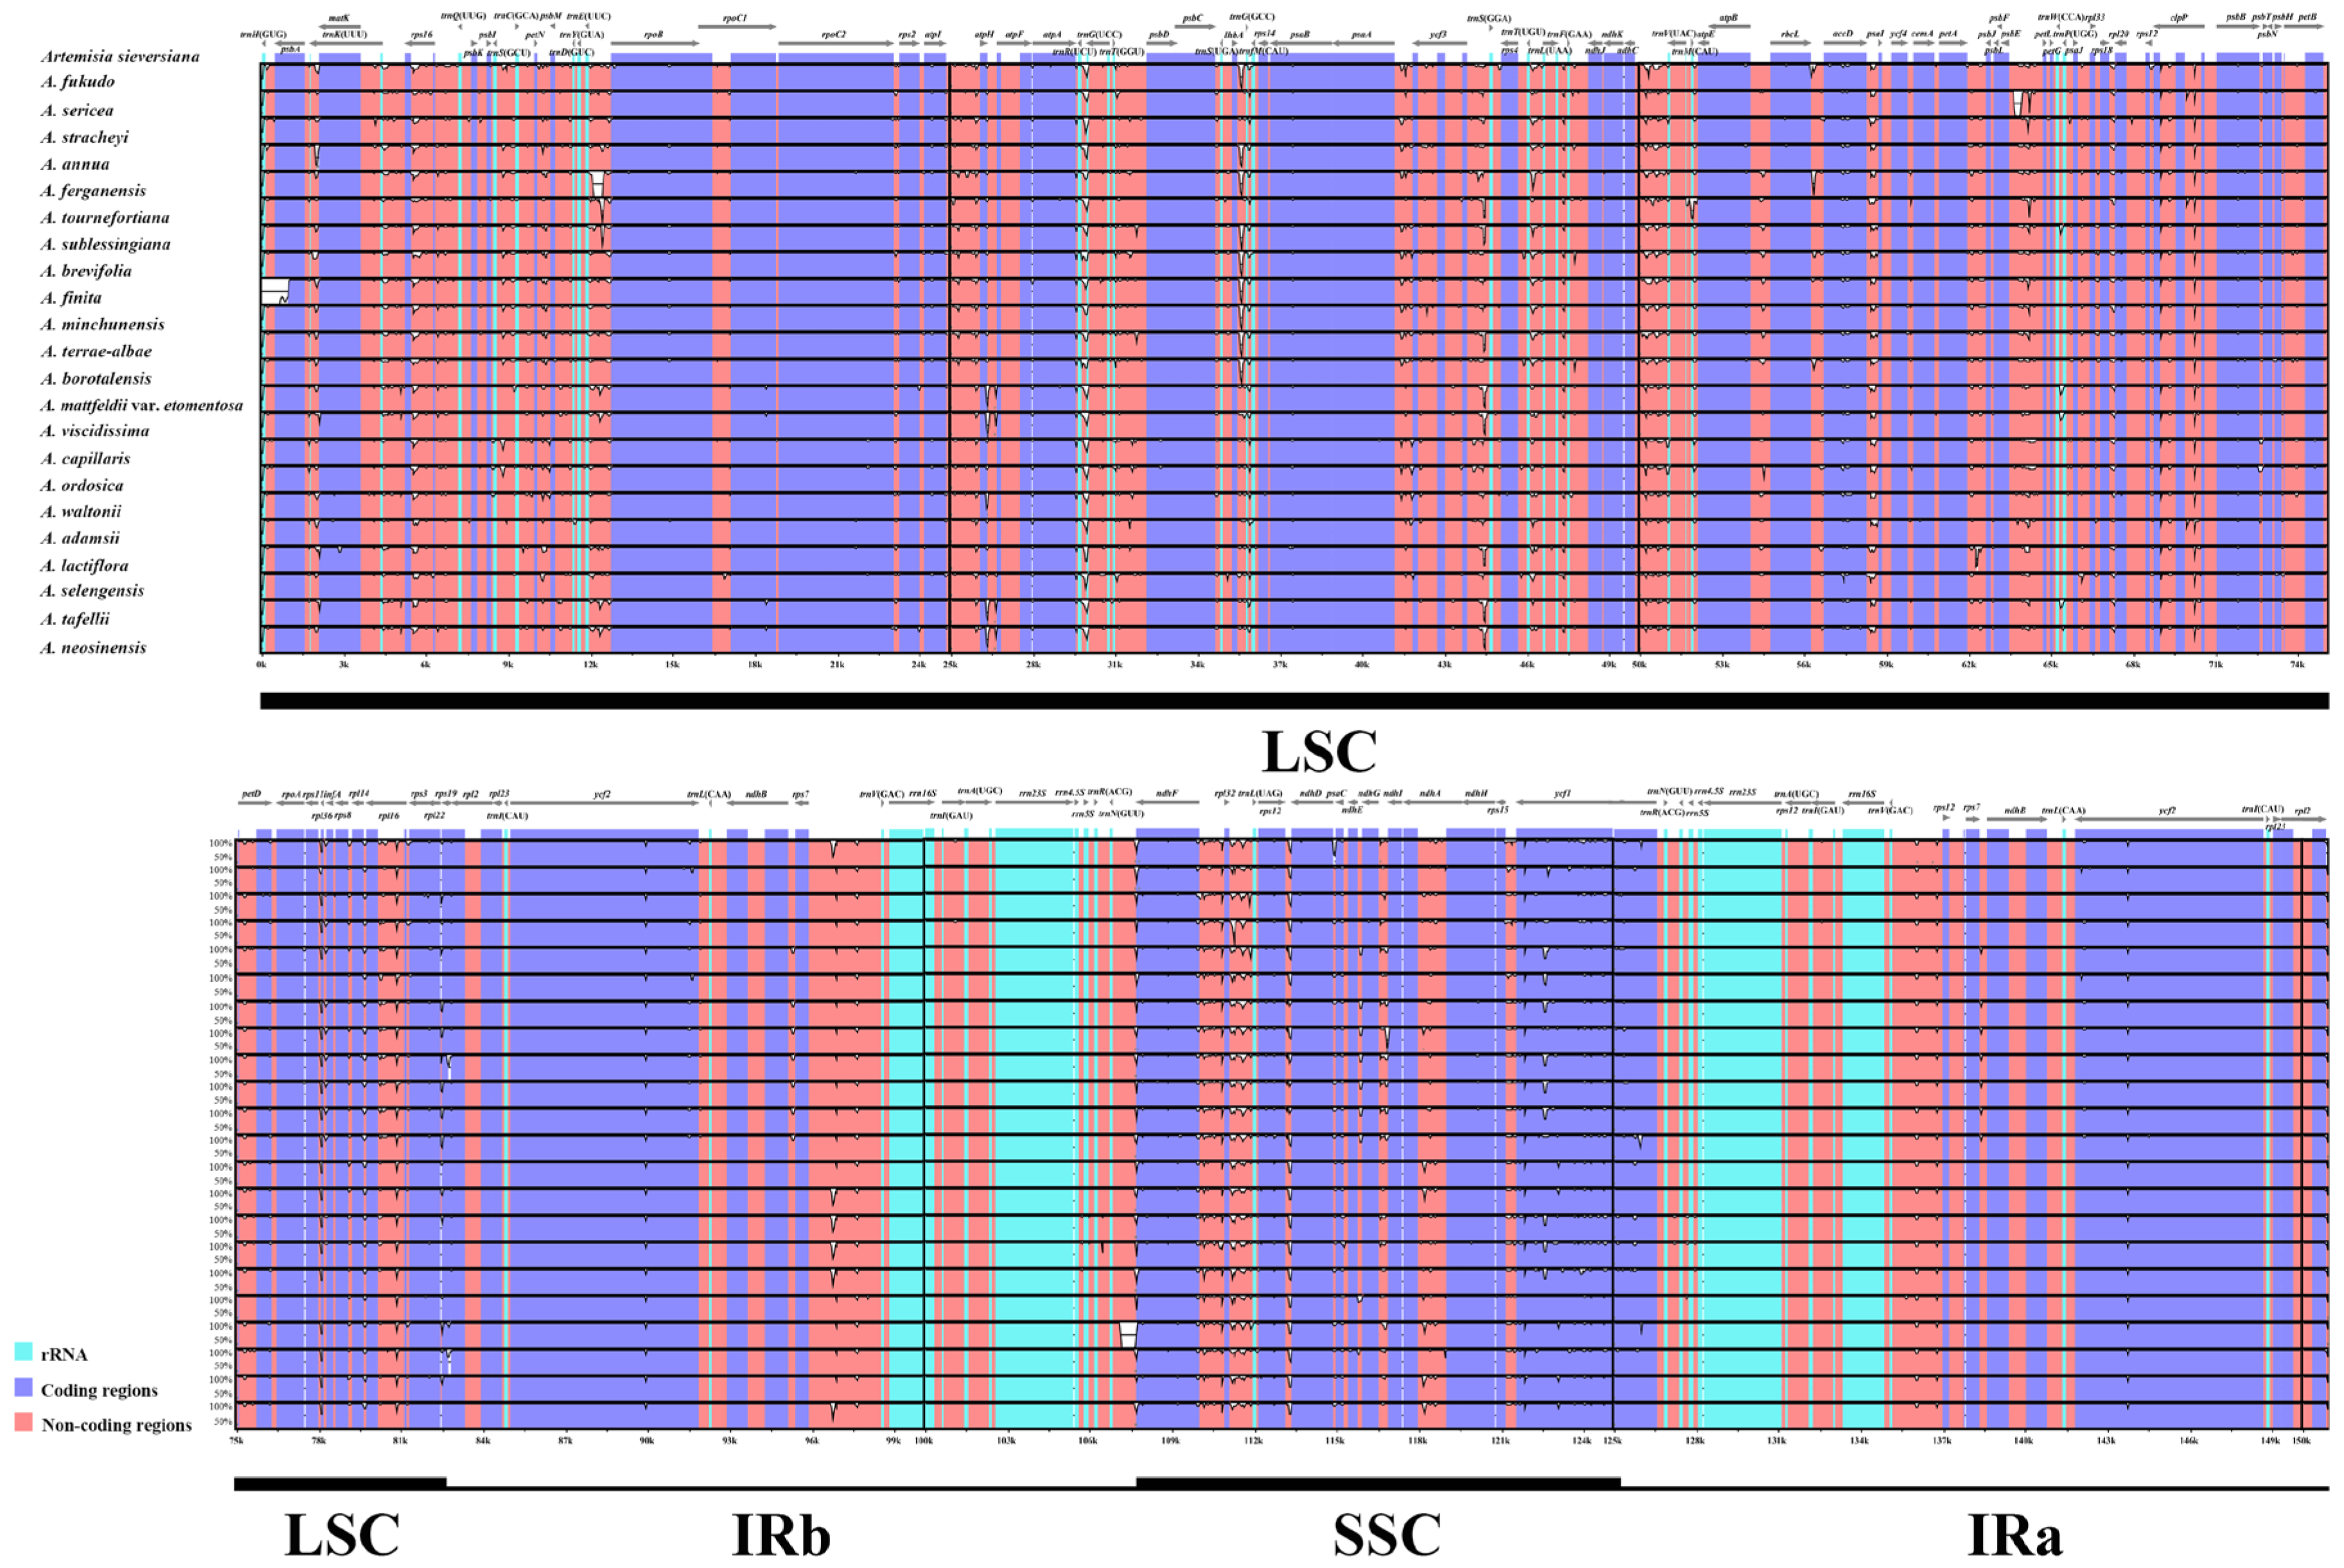
3.2. Plastome Sequence Divergence

The sequence divergence of 23 plastomes was analyzed using the mVISTA program, with A. sieversiana (Genbank accession number: ON729303) used as a reference. The plastomes of Artemisia were conserved (Figure 3), and the generic regions were more conserved than the intergenic spacer regions. In the LSC and SSC regions, sequence divergence was higher than that in the IR regions. The nucleotide polymorphism (Pi) values showed very similar results on sequence divergence (Figure 4). Most of the CDSs were conserved, with Pi values lower than 0.002. Only three genes (accD, petG, and ycf1) had Pi values between 0.004 and 0.006, and nine CDSs had Pi values between 0.002 and 0.004. Most of the genes with high Pi values (≥0.002) were located in the single-copy regions (Figure 4A, Table S3). The non-coding regions exhibited higher nucleotide variability (Figure 4B, Table S3). The regions ndhG-ndhI, trnG(UCC)-trnfM(CAU), and rpoC2-rps2 had Pi values higher than 0.06; the Pi value of rpoC1-rpoC2 was between 0.03 and 0.04, and the others had Pi values lower than 0.03. In the IR regions, the non-coding regions were highly conserved.

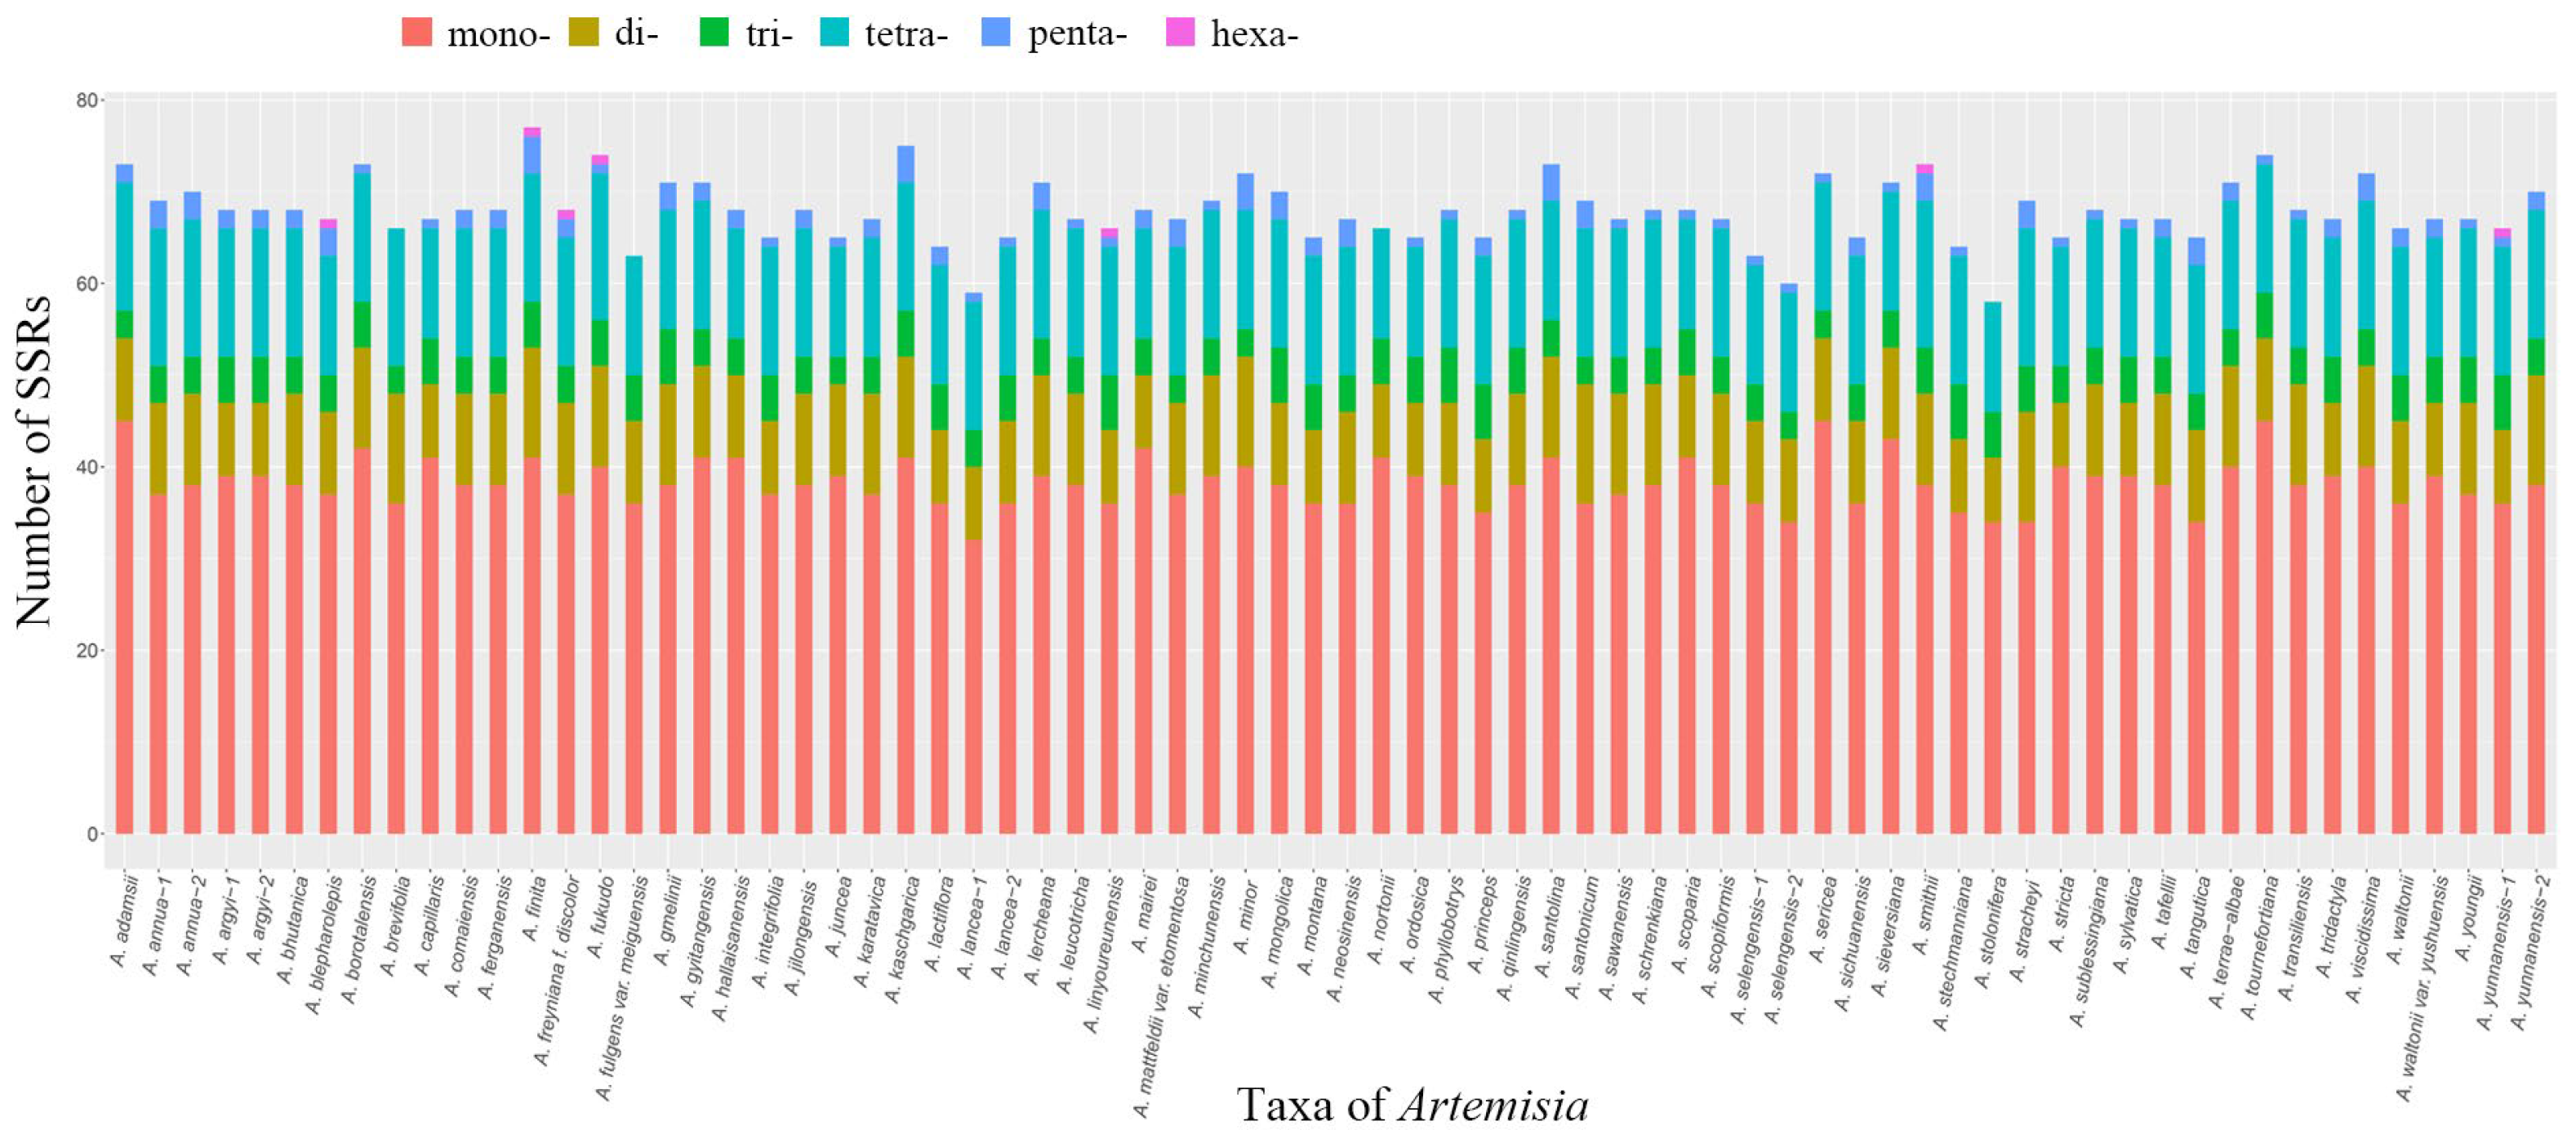
3.3. Simple Sequence Repeats (SSRs) in Artemisia Plastomes

Repeated DNA sequences are important in genome rearrangement. We investigated simple sequence repeats (SSRs) in the alignment of 72 plastomes of Artemisia. A total of 4886 SSRs were detected. The number of SSRs varied from 58 to 77 in each plastome. Four plastomes (i.e., A. finite Kitag., A. kaschgarica Krasch., A. fukudo Makino, and A. tournefortiana Rchb.) had more SSRs than the others (Figure 5, Table S4). Mono-nucleotide repeats are the most abundant (2754, 56.4%), followed by the tetra- (987, 20.2%), di- (692, 14.2%), tri- (318, 6.5%), penta- (128, 2.6%), and hexa-nucleotide (7, 0.1%) repeats (Table S4). The mono-, di-, tri-, and tetra-nucleotide repeats were found in all plastomes, while penta-nucleotide repeats were found in 67 plastomes. In only seven plastomes (representing six species and one form), including A. blepharolepis Bunge, A. finita, A. freyniana f. discolor (Kom.) Kitag., A. fukudo, A. linyoureunensis L. Shultz & Boufford, A. smithii Mattf., and A. yunnanensis Jeffrey ex Diels, hexa-nucleotide repeats were found. Most SSRs were located in single-copy regions, with 3794 found in the LSC and 673 in the SSC regions. Only 418 SSRs were in the IR regions. Mono-nucleotide repeats may play an important role in genetic variation than other SSR types. The A/T repeats account for nearly 97.8% of the mono-nucleotide repeats, and this result is similar to other studies. Di-nucleotide repeats are represented only by the AT/TA motif. Detailed information on the SSRs in each plastome is provided in Supplementary Table S4.

3.4. Phylogenetic Analysis

The topologies of the phylogenetic trees constructed from the maximum likelihood (ML) and Bayesian inference (BI) methods were basically similar (Figure 6, Figures S2 and S3). All samples of Artemisia were clustered into one single clade, which was a sister to the outgroup AjaniaChrysanthemum clade. The genus Artemisia was split into two clusters. The basal one (here referred to as Clade 1) further divides into two well-supported (ML bootstrap value (BS) = 100%; Bayesian posterior probabilities (PP) = 1) subclades, with one subclade comprising two samples of A. annua and one of A. fukudo, and another subclade comprising 17 of subg. Seriphidium. Another cluster (here referred to as Clade 2) divides into three main subclades, including one subclade comprising only A. stracheyi, one comprising ten samples of subg. Dracunculus, and two of A. selengensis of subg. Artemisia, while the remaining subclade comprises all other samples. However, Clade 2 was not strongly supported (BS = 81, PP = 0.89).
Consistent with previous phylogenetic studies using nuclear markers, our results also confirmed that all four subgenera sampled in this study, i.e., subg. Absinthium, subg. Artemisia, subg. Dracunculus, and subg. Seriphidium were not monophyletic (Figure 6, Figures S2 and S3). Most of the species of subg. Artemisia were clustered into a monophyletic group, and the other species were inserted into several clades. The phylogenetic position of A. juncea of subg. Seriphidium was not well resolved. The remaining species of subg. Seriphidium formed a monophyletic group. And the subg. Dracunculus was also monophyletic when A. blepharolepis was excluded. Only three species of subg. Absinthium was sampled, including A. sieversiana Ehrhart ex Willd., A. minor Jacquem. ex Besser, and A. sericea Weber ex Stechm., and they formed one clade with A. juncea of subg. Seriphidium and A. tournefortiana of subg. Artemisia.

4. Discussion

4.1. Characteristics of Plastomes and Genetic Variations in Artemisia

To have a better understanding of the variation patterns of the structure of Artemisia plastomes, a denser sampling within the genus is inevitable. In this study, a total of 72 plastomes were comparatively analyzed. Consistent with previous studies, the plastomes of Artemisia showed a high degree of similarity in terms of the GC content, configuration, gene number, and order [35,36,57,58]. The GC content variation in the genomes is a key feature of genomic organization and strongly varies between species. It is usually associated with the fundamental elements of genome organization, e.g., recombination [59,60,61,62,63]. In the plastomes of Artemisia, the GC content did not vary significantly between different species, ranging from 37.40% to 37.51%, which is typical in the plastomes of angiosperm [61]. No rearrangement has been found in these samples. This also reflects that Artemisia plastomes are very conservative. In general, the length of Artemisia plastomes also falls within the average length range of eudicots [22]. Sequence length uniformity was found between different samples of the same species. For example, two plastomes of A. annua were both 150952 bp. It is more common that different samples of the same species have different sequence lengths, e.g., A. argyi, A. lancea Van., and A. selengensis Turcz. ex Bess. Three factors have been proposed to drive the difference in plastome length, including intergenic region variations, differences in genes, and the expansion and contraction of IR regions [60]. All the plastomes are quadripartite, containing the same number of genes, including 87 protein-coding, 37 tRNA, and eight rRNA genes. The 66 plastomes analyzed using CPJSdraw belong to the same IR/SC boundary type. The IR regions only varied by 58 bp, while the LSC regions varied by 748 bp, and the SSC regions varied by 148 bp. Thus, the variations in the length of Artemisia plastomes were mainly in the LSC regions.
Previous analyses of whole plastomes revealed that the plastid regions accD, ndhF, trnT, ycf1, rpl32-trnL, trnE-ropB, trnH-psbA, trnK-rps16, ndhC-trnV, and ndhG-ndhI are highly variable [35,36,57,58]. As pointed out by Shaw et al., the plastid region might not be consistently variable across different groups [64]. In this study, accD, petG, ycf1, ndhG-ndhI, trnG(UCC)-trnfM(CAU), and rpoC2-rps2 have higher variability and were identified as mutational hotspots for Artemisia plastomes. Several plastid regions, including rpl32–trnH and trnS–trnC, have been used to construct the phylogeny of Artemisia [19,36]. However, we found that these regions were not the most informative. These regions may have limited power for resolving phylogenetic relationships within the genus. The combination of rbcL and matK was recommended as a core plant barcode by the CBOL Plant Working Group [31]. But, the Pi values of rbcL and matK here were both lower than 0.002, indicating they have a rather limited discriminative power in Artemisia. Plastid accD and ycf1 are important for plant fitness and leaf development. As observed in other plant groups, the accD and ycf1 genes have high variable nucleotide sequences in the plastomes analyzed in this study. The genus Artemisia is morphologically complex, and species identification is rather difficult. These hotspot regions could be developed as DNA barcodes and used to distinguish taxa.

4.2. Phylogenetic Relationships of Artemisia

A well-resolved phylogenetic relationship is critical for a better understanding of the evolutionary process of plants at different ranks, especially for the genus Artemisia, which is large and morphologically variable [17]. Using protein-coding sequences (CDS) of plastomes, we reconstructed the phylogenetic relationships for Artemisia with a broad taxonomic sampling. To some extent, our results are consistent with previous studies and further confirm that the taxonomic divisions based on morphological characters were in conflict with the molecular phylogenetic relationships. All four subgenera sampled here, including subg. Absinthium, subg. Artemisia, subg. Dracunculus, and subg. Seriphidium, were not supported as monophyletic. The subg. Artemisia, which is the largest genus in Artemisia, however, is polyphyletic, with the sampled taxa inserted into several clades. In his treatment of Chinese Artemisia, Ling divided subg. Artemisia into two sections: sect. Artemisia and sect. Abrotanum, which is mainly based on the shape of the leaflets [17]. This division was also not supported by our study. The subg. Seriphidium was once considered an independent genus, Seriphidium (Bess.) Poljak., by only having bisexual florets [2,65]. However, this was also not supported by our study [36]. Species of subg. Seriphidium were clustered into two clades. Artemisia juncea formed an independent clade, which is a sister to a large clade, including species of subg. Absinthium and subg. Artemisia. The other species of subg. Seriphidium formed a clade (Figure 6). The subg. Dracunculus was monophyletic when two samples of A. selengensis of subg. Artemisia were included.
Additionally, our analyses also revealed that there exists cyto-nuclear phylogenetic discordance, especially in the position of subg. Dracunculus and subg. Seriphidium. Previous studies using nuclear regions or nuclear single-nucleotide polymorphisms (SNPs) revealed similar phylogenetic topologies of Artemisia [21]. The species of subg. Dracunculus, together with some species of subg. Artemisia constituted the early divergent clade within Artemisia. The remaining taxa were further clustered into two main clades. Most species of subg. Seriphidium, together with some species of subg. Absinthium and subg. Artemisia formed a clade sister to another clade that was formed mainly by species of subg. Artemisia and subg. Absinthium. The phylogenetic relationships constructed using the CDSs of plastomes revealed a somewhat different topology. The earliest diverging clade of Artemisia was constituted by all the species of subg. Seriphidium except A. juncea, together with A. annua and A. fukudo of subg. Artemisia. The other species were clustered into one clade, which could be further divided into two main clades. One includes all samples of subg. Dracunculus, excluding A. blepharolepis, and two samples of A. selengensis, and the other was constituted by most species of subg. Artemisia and some species of subg. Absinthium, A. juncea of subg. Seriphidium, and A. blepharolepis of subg. Dracunculus (Figure 6). Hybridization is a significant biological process in the evolution of plants, often resulting in incongruence between nuclear and plastid phylogenies [66,67,68]. The cyto-nuclear discordance has been a good first approximation for the detection of reticulate evolution [69]. The incongruence of the topology of the phylogenies revealed in this study indicated that hybridization has occurred in the evolutionary history of Artemisia. In fact, morphology also provides evidence for such events. For example, the Artemisia species are often widely distributed and almost exclusively wind-pollinated [70]. In the future, single- and low-copy nuclear genes are needed to investigate hybridization in the genus.
The phylogenetic position of A. stracheyi Hook. f. & Thomson ex C. B. Clarke is still controversial. It was originally described as a new species in Artemisia and recorded to occur in Tibet and adjacent regions [71]. Ghafoor noted that A. stracheyi differs remarkably from the genus Artemisia in several of its morphological characteristics, including densely scaly corolla and ovary, included stamens, triangular-ovate and obtuse apical anther appendages, as well as quadrangular-pyramidal achenes [72]. They thus proposed a new genus, Artemisiella Ghafoor, to accommodate this species and accordingly proposed a new combination, i.e., Artemisella stracheyi (C.B. Clarke) Ghafoor. This treatment was not generally accepted by later authors [1,2]. Jiao et al. sampled this species in their phylogenetic study for the first time and found that Ajania quercifolia and Artemisiella stracheyi formed a clade that is a sister to the genus Artemisia. They thus accepted the treatment proposed by Ghafoor [21,50]. In this study, Artemisiella stracheyi (=Artemisia stracheyi) formed an independent clade within Artemisia. But, this clade was weakly supported (BS = 57, PP = 0.89). Morphologically, this species is unique in Artemisia by having 2- or 3-pinnatisect leaves with lobules narrowly linear, large (6–10 mm in diam.) involucre, and deciduously pubescent receptacles. The discordance may reflect the complex evolutionary history of A. stracheyi. It is highly likely that this species has a hybridization origin. Therefore, in the near future, phylogenetic analyses using plastome and nuclear data with denser sampling and more molecular data, combined with evidence from morphological, cytological, geographical, and ecological studies, are needed to reveal its evolutionary history and determine its phylogenetic position.
As mentioned before, Artemisia is such a large, complex, and economically important taxon. It should remain a priority for taxonomical and evolutionary studies, even though these tasks are rather challenging. In this study, we newly sequenced 34 Artemisia plastomes, but the taxon sampling is still inadequate, especially the taxa of subg. Pacifica and subg. Tridentatae, which were mainly distributed in the Hawaiian Islands and North America, respectively. In order to construct a robust phylogeny and to comprehensively reveal the evolutionary history of the genus, future studies should sample more taxa and use more molecular data, especially single-copy nuclear genes.

Supplementary Materials

The following supporting information can be downloaded at: https://www.mdpi.com/article/10.3390/genes16060659/s1, Figure S1. Comparison of the borders of large single-copy (LSC), inverted repeat (IR), and small single-copy (SSC) regions among 60 Artemisia plastomes. JLB (IRb /LSC), JSB (IRb/SSC), JSA (SSC/IRa), and JLA (IRa/LSC) denote the JSs between each corresponding region in the genome. Figure S2. Maximum likelihood (ML) tree constructed using 79 CDSs of plastomes. Figure S3. Bayesian inference (BI) tree constructed using 79 CDSs of plastomes. Table S1. Information for newly sampled taxa with Genbank accession number for plastome sequences. Table S2. Information for plastomes was downloaded from NCBI. Table S3. The nucleotide variability (Pi) values of protein-coding genes (CDS) and intergenic regions in 72 Artemisia plastomes. Table S4. The number of different types of SSR in each plastome.

Author Contributions

Conceptualization, X.G., D.X., and Y.W.; methodology, X.G.; software, X.G., Z.Z., and W.H.; validation, X.G.; formal analysis, X.G., Z.Z., and W.H.; investigation, X.G.; resources, X.G.; data curation, X.G.; writing—original draft preparation, X.G.; writing—review and editing, X.G. and D.X.; visualization, X.G., Z.Z., and W.H.; supervision, D.X. and Y.W.; project administration, X.G. and Y.W.; funding acquisition, X.G. and Y.W. All authors have read and agreed to the published version of the manuscript.

Funding

This work was supported by the National Natural Science Foundation of China (32270215) and the Zhejiang Provincial Natural Science Foundation of China (LQ24C020002).

Institutional Review Board Statement

Not applicable.

Informed Consent Statement

Not applicable.

Data Availability Statement

The original contributions presented in this study are included in the article/Supplementary Materials. Further inquiries can be directed to the the first author and corresponding author.

Conflicts of Interest

The authors declare no conflicts of interest.

Abbreviations

CDSprotein-coding sequences
LSClarge single-copy region
SSCsmall single-copy region
IRinverted repeat region

References

  1. Ling, Y.R.; Humphries, C.J.; Gilbert, M.G. Artemisia Linnaeus. In Flora of China; Wu, Z.Y., Raven, P.H., Hong, D.Y., Eds.; Science Press: Beijing, China; Missouri Botanical Garden Press: St. Louis, MO, USA, 2011; Volume 20–21, pp. 676–737. [Google Scholar]
  2. Ling, Y.R. Artemisia L. In Flora Reipublicae Popularis Sinicae; Ling, Y., Ling, Y.R., Eds.; Science Press: Beijing, China, 1991; Volume 76, pp. 1–253. [Google Scholar]
  3. Shulz, L.M. Artemisia L. In Flora of North America; Oxford University Press: New York, NY, USA, 2006; Volume 19–21, pp. 503–534. [Google Scholar]
  4. Vallès, J.; McArthur, E.D. Artemisia systematics and phylogeny: Cytogenetic and molecular in sights. In Proceedings of Shrubland Ecosystem, Genetics and Biodiversity; US Department of Agriculture Forest Service, Rocky Mountain Research Station: Ogden, UT, USA, 2001; pp. 67–74. [Google Scholar]
  5. Hobbs, C.R.; Baldwin, B.G. Asian origin and upslope migration of Hawaiian Artemisia (Compositae-Anthemideae). J. Biogeogr. 2013, 40, 442–454. [Google Scholar] [CrossRef]
  6. Tkach, N.V.; Hoffmann, M.H.; Röser, M.; Korobkov, A.A.; Hagen, K.B. Parallel evolutionary patterns in multiple lineages of arctic Artemisia L. (Asteraceae). Evolution 2008, 62, 184–198. [Google Scholar] [CrossRef] [PubMed]
  7. Pellicer, J.; Saslis-Lagoudakis, C.H.; Carrió, E.; Ernst, M.; Garnatje, T.; Grace, O.M.; Gras, A.; Mumbrú, M.; Vallès, J.; Vitales, D.; et al. A phylogenetic road map to antimalarial Artemisia species. J. Ethnopharmacol. 2018, 225, 1–9. [Google Scholar] [CrossRef]
  8. Tu, Y.Y. The discovery of artemisinin (qinghaosu) and gifts from Chinese medicine. Nat. Med. 2011, 17, 1217–1220. [Google Scholar] [CrossRef]
  9. Normile, D. DRUG DISCOVERY. Nobel for antimalarial drug highlights East-West divide. Science 2015, 350, 265. [Google Scholar] [CrossRef] [PubMed]
  10. Ling, Y.R. The Chinese Artemisia Linn.—The classification, distribution and application of Artemisia Linn. in China. Bull. Bot. Res. 1988, 8, 1–61. [Google Scholar]
  11. Besser, W.S. Lettre de Mr. le Dr. Besser au directeur monsieur le directeur. Bull. Soc. Imp. Nat. Moscou 1829, 1, 219–265. [Google Scholar]
  12. Besser, W.S. Tentamen de Abrotanis seu de sectione IIa Artemisiarum Linnaei. Nouv. Mém. Soc. Imp. Nat. Moscou 1832, 3, 3–89. [Google Scholar]
  13. Besser, W.S. De Seriphidiis seu de sectione IIIa Artemisiarum Linnaei. Bull. Soc. Imp. Nat. Moscou 1934, 7, 1–46. [Google Scholar]
  14. Besser, W.S. Dracunculi, seu de sectione quarta et ultima Artemisiarum Linnaei. Bull. Soc. Imp. Nat. Moscou 1835, 8, 1–97. [Google Scholar]
  15. Kitamura, S. A classification of Artemisia. Acta Phytotax. Geobot. 1939, 8, 62–66. [Google Scholar]
  16. Poljakov, P.P. Artemisia L. In Flora U.S.S.R.; Akademiya Nauk SSSR: Leninggrad, Russia, 1961; Volume 26, pp. 425–631. [Google Scholar]
  17. Garcia, S.; McArthur, E.D.; Pellicer, J.; Sanderson, S.C.; Vallès, J.; Garnatje, T. A molecular phylogenetic approach to western North America endemic Artemisia and allies (Asteraceae): Untangling the sagebrushes. Am. J. Bot. 2011, 98, 638–653. [Google Scholar] [CrossRef] [PubMed]
  18. Malik, S.; Vitales, D.; Hayat, M.Q.; Korobkov, A.A.; Garnatje, T.; Vallès, J. Phylogeny and biogeography of Artemisia subgenus Seriphidium (Asteraceae: Anthemideae). Taxon 2017, 66, 934–952. [Google Scholar] [CrossRef]
  19. Pellicer, J.; Garnatje, T.; Korobkov, A.A.; Garnatje, T. Phylogenetic relationships of subgenus Dracunculus (genus Artemisia, Asteraceae) based on ribosomal and chloroplast DNA sequences. Taxon 2011, 60, 691–704. [Google Scholar] [CrossRef]
  20. Watson, L.E.; Bates, P.L.; Evans, T.M.; Unwin, M.W.; Estes, J.R. Molecular phylogeny of subtribe Artemisiinae (Asteraceae), including Artemisia and its allied and segregate genera. BMC Evol. Biol. 2002, 2, 17. [Google Scholar] [CrossRef] [PubMed]
  21. Jiao, B.H.; Chen, C.; Wei, M.; Niu, G.H.; Zheng, J.Y.; Zhang, G.J.; Shen, J.H.; Vitales, D.; Vallès, J.; Verloove, F.; et al. Phylogenomics and morphological evolution of the mega-diverse genus Artemisia (Asteraceae: Anthemideae): Implications for its circumscription and infrageneric taxonomy. Am. J. Bot. 2023, 131, 867–883. [Google Scholar] [CrossRef]
  22. Davis, C.D.; Xi, Z.X.; Mathews, S. Plastid phylogenomics and green plant phylogeny: Almost full circle but not quite there. BMC Biol. 2014, 12, 11. [Google Scholar] [CrossRef]
  23. Llorente, B.; Torres-Montilla, S.; Morelli, L.; Florez-Sarasa, I.; Matus, J.T.; Ezquerro, M.; D’Andrea, L.; Houhou, F.; Majer, E.; Picó, B.; et al. Synthetic conversion of leaf chloroplasts into carotenoidrich plastids reveals mechanistic basis of natural chromoplast development. Proc. Natl. Acad. Sci. USA 2020, 117, 21796–21803. [Google Scholar] [CrossRef]
  24. Medina-Puche, L.; Tan, H.; Dogra, V.; Wu, M.; Rosas-Diaz, T.; Wang, L.; Ding, X.; Zhang, D.; Fu, X.; Kim, C.; et al. A defense pathway linking plasma membrane and chloroplasts and coopted by pathogens. Cell 2020, 182, 1109–1124. [Google Scholar] [CrossRef]
  25. Gitzendanner, M.A.; Soltis, P.S.; Yi, T.S.; Li, D.Z.; Soltis, D.E. Plastome phylogenetics: 30 years of inferences into plant evolution. Adv. Bot. Res. 2018, 85, 293–313. [Google Scholar]
  26. Simmonds, S.E.; Smith, J.F.; Davidson, C.; Buerki, S. Phylogenetics and comparative plastome genomics of two of the largest genera of angiosperms, Piper and Peperomia (Piperaceae). Mol. Phylogenet. Evol. 2021, 163, 107229. [Google Scholar] [CrossRef] [PubMed]
  27. Li, H.T.; Luo, Y.; Gan, L.; Ma, P.F.; Gao, L.M.; Yang, J.B.; Cai, J.; Gitzendanner, M.A.; Fritsch, P.W.; Zhang, T.; et al. Plastid phylogenomic insights into relationships of all flowering plant families. BMC Biol. 2021, 19, 232. [Google Scholar] [CrossRef] [PubMed]
  28. Guo, X.Y.; Liu, J.Q.; Hao, G.Q.; Zhang, L.; Mao, K.S.; Wang, X.J.; Zhang, D.; Ma, T.; Hu, Q.J.; Al-Shehbaz, I.A.; et al. Plastome phylogeny and early diversification of Brassicaceae. BMC Genom. 2017, 18, 176. [Google Scholar] [CrossRef]
  29. Li, E.Z.; Liu, K.J.; Deng, R.Y.; Gao, Y.W.; Liu, X.Y.; Dong, W.P.; Zhang, Z.X. Insights into the phylogeny and chloroplast genome evolution of Eriocaulon (Eriocaulaceae). BMC Plant Biol. 2023, 23, 32. [Google Scholar] [CrossRef]
  30. Wang, Y.; Zhang, C.F.; Odago, W.O.; Jiang, H.; Yang, J.X.; Hu, G.W.; Wang, Q.F. Evolution of 101 Apocynaceae plastomes and phylogenetic implications. Mol. Phylogenet Evol. 2023, 180, 107688. [Google Scholar] [CrossRef]
  31. Hollingsworth, P.M.; Forrest, L.L.; Spouge, J.L.; Hajibabaei, M.; Ratnasingham, S.; van der Bank, M.; Chase, M.W.; Cowan, R.S.; Erickson, D.L.; Fazekas, A.J. A DNA barcode for land plants. Proc. Natl. Acad. Sci. USA 2009, 106, 12794–12797. [Google Scholar]
  32. Riggins, C.W.; Seigler, D.S. The genus Artemisia (Asteraceae: Anthemideae) at a continental crossroads: Molecular insights into migrations, disjunctions, and reticulations among Old and New World species from a Beringian perspective. Mol. Phylogenet Evol. 2012, 64, 471–490. [Google Scholar] [CrossRef]
  33. Xu, X.M.; Liu, D.H.; Zhu, S.X.; Wang, Z.L.; Wei, Z.; Liu, Q.R. Phylogeny of Trigonotis in Chinadwith a special reference to its nutlet morphology and plastid genome. Plant Divers. 2023, 45, 409–421. [Google Scholar] [CrossRef] [PubMed]
  34. Zhang, L.; Zhang, L.B. Phylogeny, character evolution, and systematics of the fern family Ophioglossaceae based on Sanger sequence data, plastomes, and morphology. Mol. Phylogenet Evol. 2022, 173, 107512. [Google Scholar] [CrossRef]
  35. Kim, G.B.; Lim, C.E.; Kim, J.S.; Kim, K.; Lee, J.H.; Yu, H.J.; Mun, J.H. Comparative chloroplast genome analysis of Artemisia (Asteraceae) in East Asia: Insights into evolutionary divergence and phylogenomic implications. BMC Plant Biol. 2020, 21, 415. [Google Scholar] [CrossRef]
  36. Jin, G.Z.; Li, W.J.; Song, F.; Yang, L.; Wen, Z.B.; Feng, Y. Comparative analysis of complete Artemisia subgenus Seriphidium (Asteraceae: Anthemideae) chloroplast genomes: Insights into structural divergence and phylogenetic relationships. BMC Plant Biol. 2023, 23, 136. [Google Scholar] [CrossRef] [PubMed]
  37. Doyle, J.J.; Doyle, J.L. A rapid DNA isolation procedure for small quantities of fresh leaf tissue. Phytochem. Bull. 1987, 19, 11–15. [Google Scholar]
  38. Bolger, A.M.; Lohse, M.; Usadel, B. Trimmomatic: A flexible trimmer for Illumina Sequence Data. Bioinformatics 2014, 30, 2114–2120. [Google Scholar] [CrossRef]
  39. Dierckxsens, N.; Mardulyn, P.; Smits, G. NOVOPlasty: De novo assembly of organelle genomes from whole genome data. Nucleic Acids Res. 2016, 45, e18. [Google Scholar]
  40. Jin, J.J.; Yu, W.B.; Yang, J.B.; Song, Y.; de Pamphilis, C.W.; Yi, T.S.; Li, D.Z. GetOrganelle: A fast and versatile toolkit for accurate de novo assembly of organelle genomes. Genome Biol. 2020, 21, 241. [Google Scholar] [CrossRef]
  41. Wick, R.R.; Schultz, M.B.; Zobel, J.; Holt, K.E. Bandage: Interactive visualisation of de novo genome assemblies. Bioinformatics 2015, 31, 3350–3352. [Google Scholar] [CrossRef]
  42. Tillich, M.; Lehwark, P.; Pellizzer, T.; Ulbricht-Jones, E.S.; Fischer, A.; Bock, R.; Greiner, S. GeSeq-versatile and accurate annotation of organelle genomes. Nucleic Acids Res. 2017, 45, W6–W11. [Google Scholar] [CrossRef]
  43. Qu, X.J.; Moore, M.J.; Li, D.Z.; Yi, T.S. PGA: A software package for rapid, accurate, and flexible batch annotation of plastomes. Plant Methods 2019, 15, 50. [Google Scholar] [CrossRef]
  44. Greiner, S.; Lehwark, P.; Bock, R. OrganellarGenomeDRAW (OGDRAW) version 1.3.1: Expanded toolkit for the graphical visualization of organellar genomes. Nucleic Acids Res. 2019, 47, W59–W64. [Google Scholar] [CrossRef]
  45. Mayor, C.; Brudno, M.; Schwartz, J.R.; Poliakov, A.; Rubin, E.M.; Frazer, K.A.; Pachter, L.S.; Dubchak, I. VISTA: Visualizing Global DNA Sequence Alignments of Arbitrary Length. Bioinformatics 2000, 16, 1046. [Google Scholar] [CrossRef]
  46. Edgar, R.C. MUSCLE: Multiple sequence alignment with high accuracy and high throughput. Nucleic Acids Res. 2004, 32, 1792–1797. [Google Scholar] [CrossRef]
  47. Rozas, J.; Ferrer-Mata, A.; Sánchez-DelBarrio, J.C.; Guirao-Rico, S.; Librado, P.; Ramos-Onsins, S.E.; Sánchez-Gracia, A. DnaSP 6: DNA Sequence Polymorphism Analysis of Large Datasets. Mol. Biol. Evol. 2017, 34, 3299–3302. [Google Scholar] [CrossRef] [PubMed]
  48. Li, H.; Guo, Q.; Xu, L.; Gao, H.; Liu, L.; Zhou, X. CPJSdraw: Analysis and visualization of junction sites of chloroplast genomes. PeerJ 2023, 11, e15326. [Google Scholar] [CrossRef]
  49. Beier, S.; Thiel, T.; Münch, T.; Scholz, U.; Mascher, M. MISA-web: A web server for microsatellite prediction. Bioinformatics 2017, 33, 2583–2585. [Google Scholar] [CrossRef] [PubMed]
  50. Zhang, D.; Gao, F.; Jakovlić, I.; Zou, H.; Zhang, J.; Li, W.X.; Wang, G.T. PhyloSuite: An integrated and scalable desktop platform for streamlined molecular sequence data management and evolutionary phylogenetics studies. Mol. Ecol. Resour. 2020, 20, 348–355. [Google Scholar] [CrossRef]
  51. Larsson, A. AliView: A fast and lightweight alignment viewer and editor for large data sets. Bioinformatics 2014, 30, 3276–3278. [Google Scholar] [CrossRef]
  52. Lanfear, R.; Frandsen, P.B.; Wright, A.M.; Senfeld, T.; Calcott, B. PartitionFinder 2: New Methods for Selecting Partitioned Models of Evolution for Molecular and Morphological Phylogenetic Analyses. Mol. Biol. Evol. 2017, 34, 772–773. [Google Scholar] [CrossRef]
  53. Ronquist, F.; Teslenko, M.; van der Mark, P.; Ayres, D.L.; Darling, A.; Höhna, S.; Larget, B.; Liu, L.; Suchard, M.A.; Huelsenbeck, J.P. MrBayes 3.2: Efficient Bayesian phylogenetic inference and model choice across a large model space. Syst. Biol. 2012, 61, 539–542. [Google Scholar] [CrossRef]
  54. Rambaut, A.; Drummond, A.J.; Xie, D.; Baele, G.; Suchard, M.A. Posterior Summarization in Bayesian Phylogenetics Using Tracer 1.7. Syst. Biol. 2018, 67, 901–904. [Google Scholar] [CrossRef]
  55. Alexandros, S. RAxML-VI-HPC: Maximum likelihood-based phylogenetic analyses with thousands of taxa and mixed models. Bioinformatics 2006, 22, 2688–2690. [Google Scholar]
  56. Stöver, B.C.; Müller, K.F. TreeGraph 2: Combining and visualizing evidence from different phylogenetic analyses. BMC Bioinformatics 2010, 11, 7. [Google Scholar] [CrossRef]
  57. Chen, C.J.; Miao, Y.H.; Luo, D.D.; Li, J.X.; Wang, Z.X.; Luo, M.; Zhao, T.T.; Liu, D.H. Sequence Characteristics and Phylogenetic Analysis of the Artemisia argyi Chloroplast Genome. Front. Plant Sci. 2022, 13, 906725. [Google Scholar] [CrossRef]
  58. Lan, Z.H.; Shi, Y.H.; Yin, Q.G.; Gao, R.R.; Liu, C.L.; Wang, W.T.; Tian, X.F.; Liu, J.W.; Nong, Y.Y.; Xiang, L.; et al. Comparative and phylogenetic analysis of complete chloroplast genomes from five Artemisia species. Front. Plant Sci. 2022, 13, 1049209. [Google Scholar] [CrossRef]
  59. Freudenberg, J.; Wang, M.Y.; Yang, Y.N.; Li, W.T. Partial correlation analysis indicates causal relationships between GC-content, exon density and recombination rate in the human genome. BMC Bioinform. 2009, 10, S66. [Google Scholar] [CrossRef] [PubMed]
  60. Singh, R.; Ming, R.; Yu, Q.Y. Comparative analysis of GC content variations in plant genomes. Trop. Plant Biol. 2016, 9, 136–146. [Google Scholar] [CrossRef]
  61. Glémin, S.; Clémin, Y.; David, J.; Ressayre, A. GC content evolution in coding regions of angiosperm genomes: A unifying hypothesis. Trend. Genet. 2014, 30, 263–270. [Google Scholar] [CrossRef] [PubMed]
  62. Eyre-Walker, A.; Hurst, L.D. The evolution of isochores. Nat. Rev. Genet. 2001, 2, 549–555. [Google Scholar] [CrossRef]
  63. Zheng, X.M.; Wang, J.R.; Feng, L.; Liu, S.; Pang, H.B.; Qi, L.; Li, J.; Sun, Y.; Qiao, W.; Zhang, L.; et al. Inferring the evolutionary mechanism of the chloroplast genome size by comparing whole-chloroplast genome sequences in seed plants. Sci. Rep. 2017, 7, 1555. [Google Scholar]
  64. Shaw, J.; Shafer, H.L.; Leonard, O.R.; Kovach, M.J.; Schorr, M.; Morris, A.B. Chloroplast DNA sequence utility for the lowest phylogenetic and phylogeographic inferences in angiosperms: The tortoise and the hare IV. Am. J. Bot. 2014, 101, 1987–2004. [Google Scholar] [CrossRef]
  65. Ling, Y.R. Taxa nova generum Artemisiae et Seriphidii xizangensis. Acta Phytotax. Sin. 1980, 18, 504–513. [Google Scholar]
  66. Soltis, E.D.; Soltis, P.S. Contributions of plant molecular systematics to studies of molecular evolution. Plant Mol. Biol. 2000, 42, 45–75. [Google Scholar] [CrossRef] [PubMed]
  67. Zou, X.H.; Ge, S. Conflicting gene trees and phylogenomics. J. Syst. Evol. 2008, 46, 795–807. [Google Scholar]
  68. Mallet, J.; Besansky, N.; Hahn, M.W. How reticulated are species? BioEssays 2016, 38, 140–149. [Google Scholar] [CrossRef] [PubMed]
  69. Zhou, B.F.; Yuan, S.; Crowl, A.A.; Liang, Y.Y.; Shi, Y.; Chen, X.Y.; An, Q.Q.; Kang, M.; Manos, P.S.; Wang, B.S. Phylogenomic analyses highlight innovation and introgression in the continental radiations of Fagaceae across the Northern Hemisphere. Nat. Commun. 2022, 13, 1320. [Google Scholar] [CrossRef] [PubMed]
  70. Abbott, R.J.; Hegarty, M.J.; Hiscock, S.J.; Brennan, A.C. Homoploid hybrid speciation in action. Taxon 2010, 59, 1375–1386. [Google Scholar] [CrossRef]
  71. Clarke, C.B. Compositae Indicae; Thacker, Spink and Co.: Calcutta, India, 1876; pp. 1–347. [Google Scholar]
  72. Ghafoor, A. Artemisiella: A new genus of Compositae based on Artemisia stracheyii Hook. F. & Thoms. ex Clarke. Candollea 1992, 47, 635–643. [Google Scholar]
Figure 1. Gene map of the plastome of Artemisia tafellii. Genes shown inside the circle are transcribed clockwise, and those shown outside are transcribed counterclockwise. Genes belonging to different functional groups are shown in different colors. The darker gray color in the inner circle corresponds to the GC content, and the lighter gray color corresponds to the AT content. IR, inverted repeat region; LSC, large single copy; SSC, small single copy.
Genes 16 00659 g001
Figure 2. Comparison of the borders of large single-copy (LSC), inverted repeat (IR), and small single-copy (SSC) regions among six Artemisia plastomes. JLB (IRb /LSC), JSB (IRb/SSC), JSA (SSC/IRa), and JLA (IRa/LSC) denote the JSs between each corresponding region in the plastome.
Genes 16 00659 g002
Figure 3. Sequence alignment of 23 Artemisia plastomes using the mVISTA program with A. sieversiana used as a reference. The X-axis indicates the sequence length, and the Y-axis indicates the percentage identity, ranging from 50 to 100%. The gray arrows below the genes denote the gene orientation. The bars below the X-axis show the gene position of the plastome region.
Genes 16 00659 g003
Figure 4. The nucleotide variability (Pi) values in the 72 Artemisia plastomes: (A) intergenic regions; (B) protein-coding genes. These regions are arranged according to their location in the plastome.
Genes 16 00659 g004
Figure 5. The number of simple sequence repeats (SSRs) in the plastomes of Artemisia species. Note: mono-, mono-nucleotides; di-, di-nucleotides; tri-, tri-nucleotides; tetra-, tetra-nucleotides; penta-, penta-nucleotides; hexa-, hexa-nucleotides.
Genes 16 00659 g005
Figure 6. Phylogeny of Artemisia based on 79 protein-coding sequences (CDS) of 72 Artemisia species and four outgroups: (a) Consensus phylogenetic tree reconstructed by Bayesian inference (BI) analysis. The numbers near the branches are the bootstrap support (BS) percentages, obtained from maximum likelihood inference, and the posterior probabilities (PP), obtained from Bayesian analysis (BS/PP). (b) A phylogenetic backbone reconstructed by maximum likelihood (ML) inference.
Genes 16 00659 g006
Disclaimer/Publisher’s Note: The statements, opinions and data contained in all publications are solely those of the individual author(s) and contributor(s) and not of MDPI and/or the editor(s). MDPI and/or the editor(s) disclaim responsibility for any injury to people or property resulting from any ideas, methods, instructions or products referred to in the content.

