Article

Colorectal Cancer Biomarker Identification via Joint DNA-Methylation and Transcriptomics Analysis Workflow

by
Olajumoke B. Oladapo
1 and
Marmar R. Moussa
1,2,*
1
Stephenson School of Biomedical Engineering, University of Oklahoma, Norman, OK 73019, USA
2
School of Computer Science, University of Oklahoma, Norman, OK 73019, USA
*
Author to whom correspondence should be addressed.
Genes 2025, 16(6), 620; https://doi.org/10.3390/genes16060620
Submission received: 31 March 2025 / Revised: 9 May 2025 / Accepted: 14 May 2025 / Published: 23 May 2025
(This article belongs to the Special Issue Bioinformatics and Computational Genomics)

Abstract

:
Background: Colorectal cancer (CRC) is a term that refers to the combination of colon and rectal cancer as they are being treated as a single tumor. In CRC, 72% of tumors are colon cancer, while the other 28% represent rectal cancer. CRC is a multifactorial disease caused by both genetic and epigenetic changes in the colon mucosal cells, affecting the oncogenes, DNA repair genes, and tumor suppressor genes. Currently, two DNA methylation-based biomarkers for CRC have received FDA approval: SEPT9, used in blood-based screening tests, and a combination of NDRG4 and BMP3 for stool-based tests. Although DNA methylation biomarkers have been explored in colorectal cancer (CRC), the identification of robust and clinically valuable biomarkers remains a challenge, particularly for early-stage detection and precancerous lesions. Patients often receive diagnoses at the locally advanced stage, which limits the potential utility of current biomarkers in clinical settings. Methods: The datasets used in this study were retrieved from the GEO database, specifically GSE75548 and GSE75546 for rectal cancer and GSE50760 and GSE101764 for colon cancer, summing up to a total of 130 paired samples. These datasets represent expression profiling by array, methylation profiling by genome tiling array, and expression profiling by high-throughput sequencing and include rectal and colon cancer samples paired with adjacent normal tissue samples. Differential analysis was used to identify differentially methylated CPG sites (DMCs) and identify differentially expressed genes (DEGs). Results: From the integration of DMCs with DEGs in colorectal cancer, we identified 150 candidates for methylation-regulated genes (MRGs) with two genes common across all cohorts (GNG7 and PDX1) highlighted as candidate biomarkers in CRC. The functional enrichment analysis and protein–protein interactions (PPIs) identified relevant pathways involved in CRC, including the Wnt signaling pathway, extracellular matrix (ECM) organization, among other enriched pathways. Conclusions: Our findings show the strength of our in silco computational approach in jointly identifying methylation-regulated biomarkers for colon cancer and highlight several genes and pathways as biomarker candidates for further investigations.

1. Introduction

Colorectal cancer (CRC) is a term that refers to the combination of colon and rectal cancers, which are treated as a single tumor. In CRC, 72% of tumors are colon cancer, while the remaining 28% are rectal cancer [1]. Colorectal cancer ranks as the third most prevalent cancer and the second largest cause of mortality, with an anticipated incidence rate exceeding 60% by 2030 [1,2]. The 5-year survival rate for 90% of patients diagnosed with CRC in early and localized stages is significantly higher than the 13.1% rate observed in advanced stages and metastatic cases [3]. Early detection is essential for the survival of patients diagnosed with CRC, and biomarkers are pivotal in its diagnosis and prognosis. However, only a limited number of biomarkers have been integrated into clinical practice, underscoring the necessity to develop additional biomarkers in CRC [4]. Currently, microRNAs, DNA mutations, methylation, proteins encompassing various epigenetic functions, and gut microbiomes are areas investigated for the identification of CRC biomarkers [5].
DNA methylation patterns in normal and tumor-specific cells exhibit markedly distinct profiles, which can facilitate the identification of DNA from tumor samples, hence serving as a promising biomarker [6]. Currently, two DNA methylation biomarkers for colorectal cancer (CRC) have been approved by the FDA: SEPT9, utilized in blood screening tests, and a combination of NDRG4 and BMP3 for stool tests [7]. Recently, many studies have introduced promising DNA methylation biomarkers for CRC. Shen et al. [7] identified two potential CpG site biomarkers for colorectal cancer: cg13096260 and cg12993163, from 76 pairs of CRC and adjacent normal tissue samples, 348 stool samples, and 136 blood samples. In a similar manner, the Stool ColoDefense test used by Zhao et al. [8] found the DNA methylation of SEPT9 and SDC2 as a composite biomarker for CRC. Despite the investigation of DNA methylation biomarkers in CRC, the discovery of reliable and clinically significant biomarkers continues to pose a problem, especially for early-stage detection and precancerous lesions. Current biomarkers frequently exhibit insufficient sensitivity and specificity for early detection, resulting in patients typically being diagnosed at a locally advanced stage, which constrains their potential application in clinical environments [4,9].
This study seeks to fill this gap by utilizing a bioinformatics pipeline to find novel DNA methylation-regulated genes linked to CRC. This study employs the methodology established by Li et al. [10], who identified methylation-regulated genes in varicose vein disease and classified these genes as biomarkers for varicose vein disease alongside their traits which were taken into consideration in their analysis. In this study, we aim to identify methylation-regulated genes in CRC samples by analyzing publicly accessible methylation and expression datasets of CRC for candidate biomarkers that demonstrate consistent epigenetic modifications in CRC samples. The primary objective is to identify biomarkers that may be subsequently validated for their diagnostic and prognostic capabilities in CRC and precancerous lesions.

2. Materials and Methods

In the following section, we describe the main components of our joint analysis workflow. An overview of the workflow processes is shown in Figure 1.

2.1. Data Collection

The datasets utilized in this study were retrieved from the Gene Expression Omnibus (GEO) database (https://www.ncbi.nlm.nih.gov/geo/, accessed on 13 May 2025) using the GEOquery package [11]. Specifically, datasets GSE75548 and GSE75546 were obtained for rectal cancer, consisting of matched patient samples. GSE75548 represents expression profiling by microarray, whereas GSE75546 represents methylation profiling by genome tiling array; both datasets contain six paired samples of rectal cancer and corresponding normal tissues. Additionally, datasets GSE50760 (expression profiling by high-throughput sequencing) and GSE101764 (methylation profiling by microarray) were employed for colon cancer analyses. The GSE50760 dataset was subsetted to retain only colon cancer samples, yielding a total of 36 samples. The GSE101764 dataset was filtered to include paired samples from patients aged 40 and above, resulting in a total of 82 samples, thus ensuring consistency in biological characteristics, including age, across all analyses. In total, 130 samples are analyzed in this study; Figure 2 summarizes the samples in both expression and methylation data via principal component analysis.

2.2. Identifying and Mapping Differentially Methylated CpG Sites

Differentially methylated CpG sites (DMCs) between normal and cancer tissue samples were identified using the Limma package [12]. For rectal cancer, DMCs with Adj.P.Value < 0.05 and log 2 FC > 1 were considered statistically significant. Due to the larger sample size available for colon cancer analyses, more stringent thresholds were applied, with significance defined by an Adj.P.Value < 0.01 and log 2 FC > 2 . Differentially methylated regions (DMRs) between normal and cancer samples were identified using the DMRcate package [13], with a false discovery rate (FDR) threshold of 0.001. DMRs were defined as genomic regions containing at least two significant DMCs (C = 2) within a 1000 bp window ( λ = 1000 ). Genomic coordinates of identified regions were validated using the BSgenome.Hsapiens.UCSC.hg19 package [14], ensuring the inclusion of only standard autosomal chromosomes. Subsequently, DMCs obtained from Limma were cross-referenced with the DMR results, classifying them into hypermethylated, hypomethylated, or non-significant categories. A karyogram visualizing hypermethylated (red) and hypomethylated (blue) genomic regions was generated using the karyoploteR package [15].

2.3. Normalization and Filtering

Expression data for rectal cancer were obtained in a pre-normalized form from the GEO archive and further filtered using median expression values. For colon cancer, the normalization and filtering of samples were performed using EdgeR [16], ensuring minimal batch effect in expression and methylation data (see Supplementary Figure S1).

2.4. Identification of Differentially Expressed Genes (DEGs)

Differentially expressed genes (DEGs) between normal and cancer tissue samples were identified using the Limma package [12]. For rectal cancer, DEGs with Adj.P.Value < 0.05 and log 2 FC > 1 were considered statistically significant. Due to the larger sample size available for colon cancer analyses, more stringent thresholds were applied, with significance defined by an Adj.P.Value < 0.01 and log 2 FC > 2 . The results were visualized using a volcano plot to highlight upregulated, downregulated, and non-significant genes.

2.5. Statistical Methods for Differential Analyzes

As discussed in previous sections, Limma R package and algorithms were used to calculate differential expression (or methylation). To summarize, this method apply fitting linear models to normalized expression data, considering factors like inter-gene correlation and precision weights. The method then compares the expression levels of different groups or conditions using t-tests, identifying genes with significant differences.

2.6. Identification and Analysis of Methylation-Regulated Genes (MRGs)

Gene symbols from the annotated DMRs were compared with significantly differentially expressed genes (DEGs). This integration identified common genes: methylation-regulated genes (MRGs) that showed both methylation alterations and differential expression patterns.

2.7. Validation and Functional Enrichment of Methylation-Regulated Genes

Biological processes and pathways associated with methylation-regulated genes (MRGs) were identified using Gene Ontology (GO) and KEGG pathway enrichment analysis performed using g:Profiler [17] methods. Protein–protein interaction (PPI) networks were constructed using the STRING database [18] to identify gene clusters and their associated functional and regulatory pathways, further validating the methylation-based regulation of genes. Additionally, survival analysis (Kaplan–Meier (KM) [19] overall survival (OS) method) was conducted on select genes using clinical data from colon and rectal cancer patients to evaluate the prognostic significance of two spotlight MRGs.

3. Results

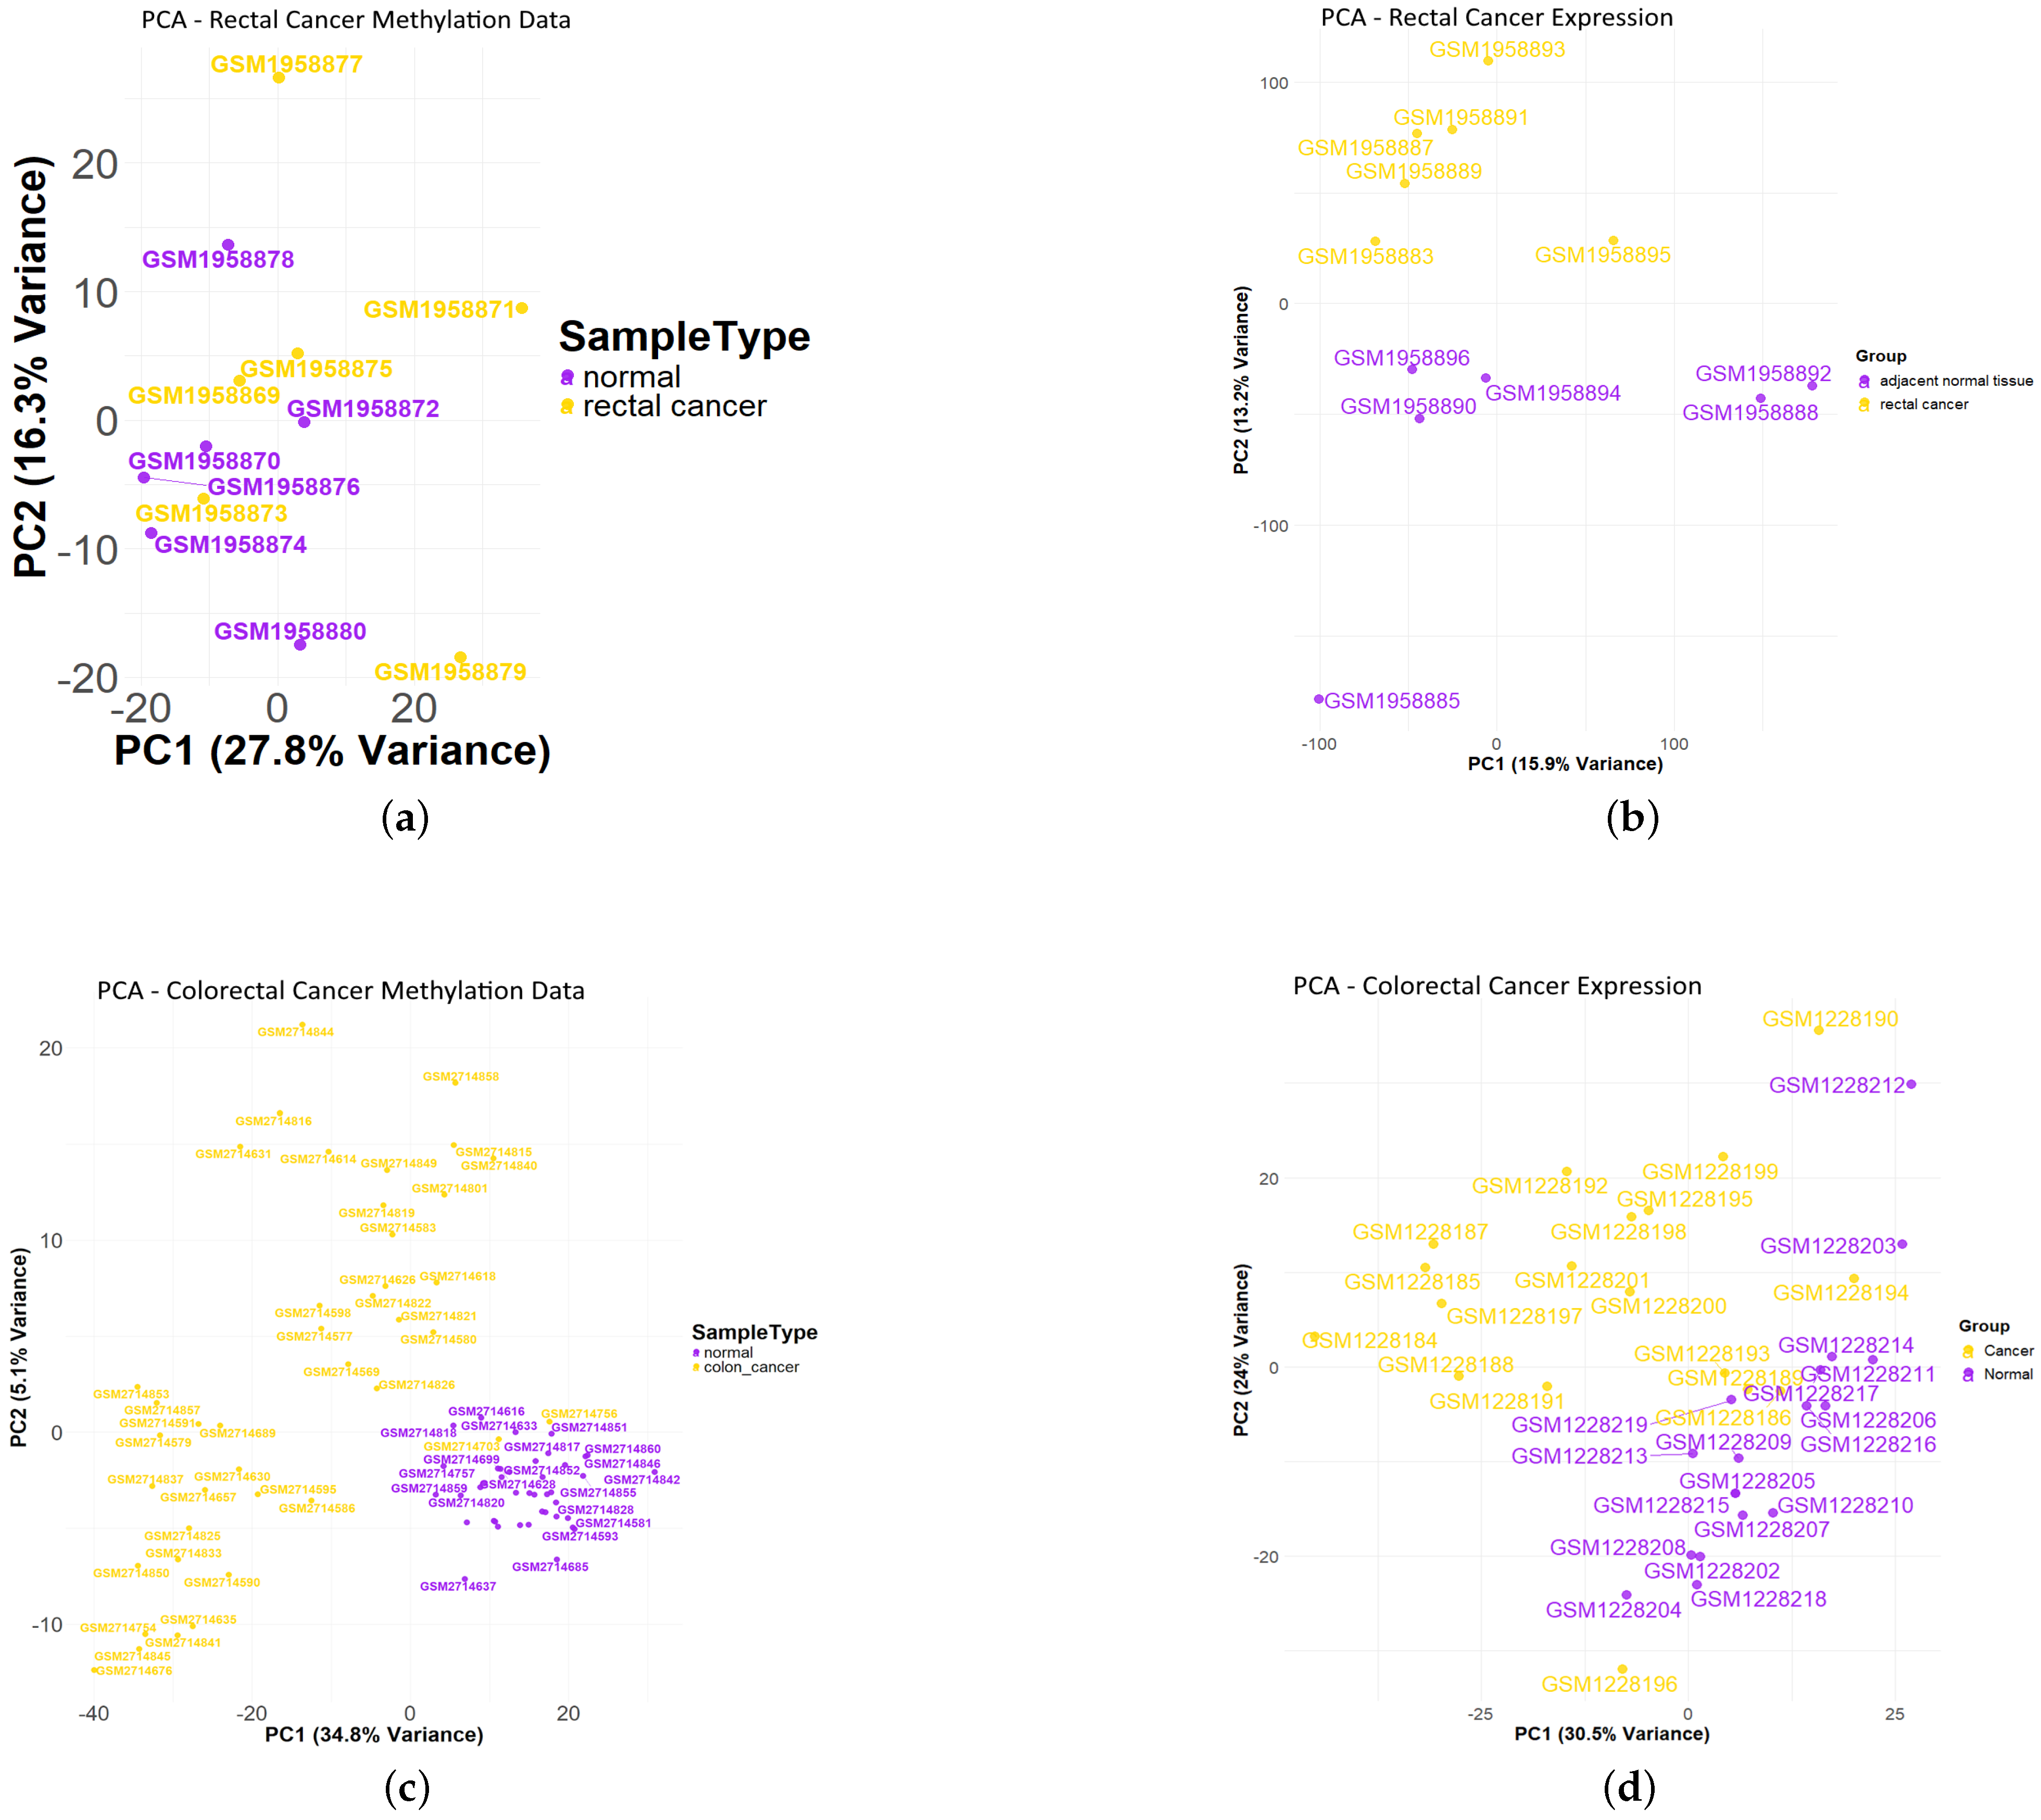
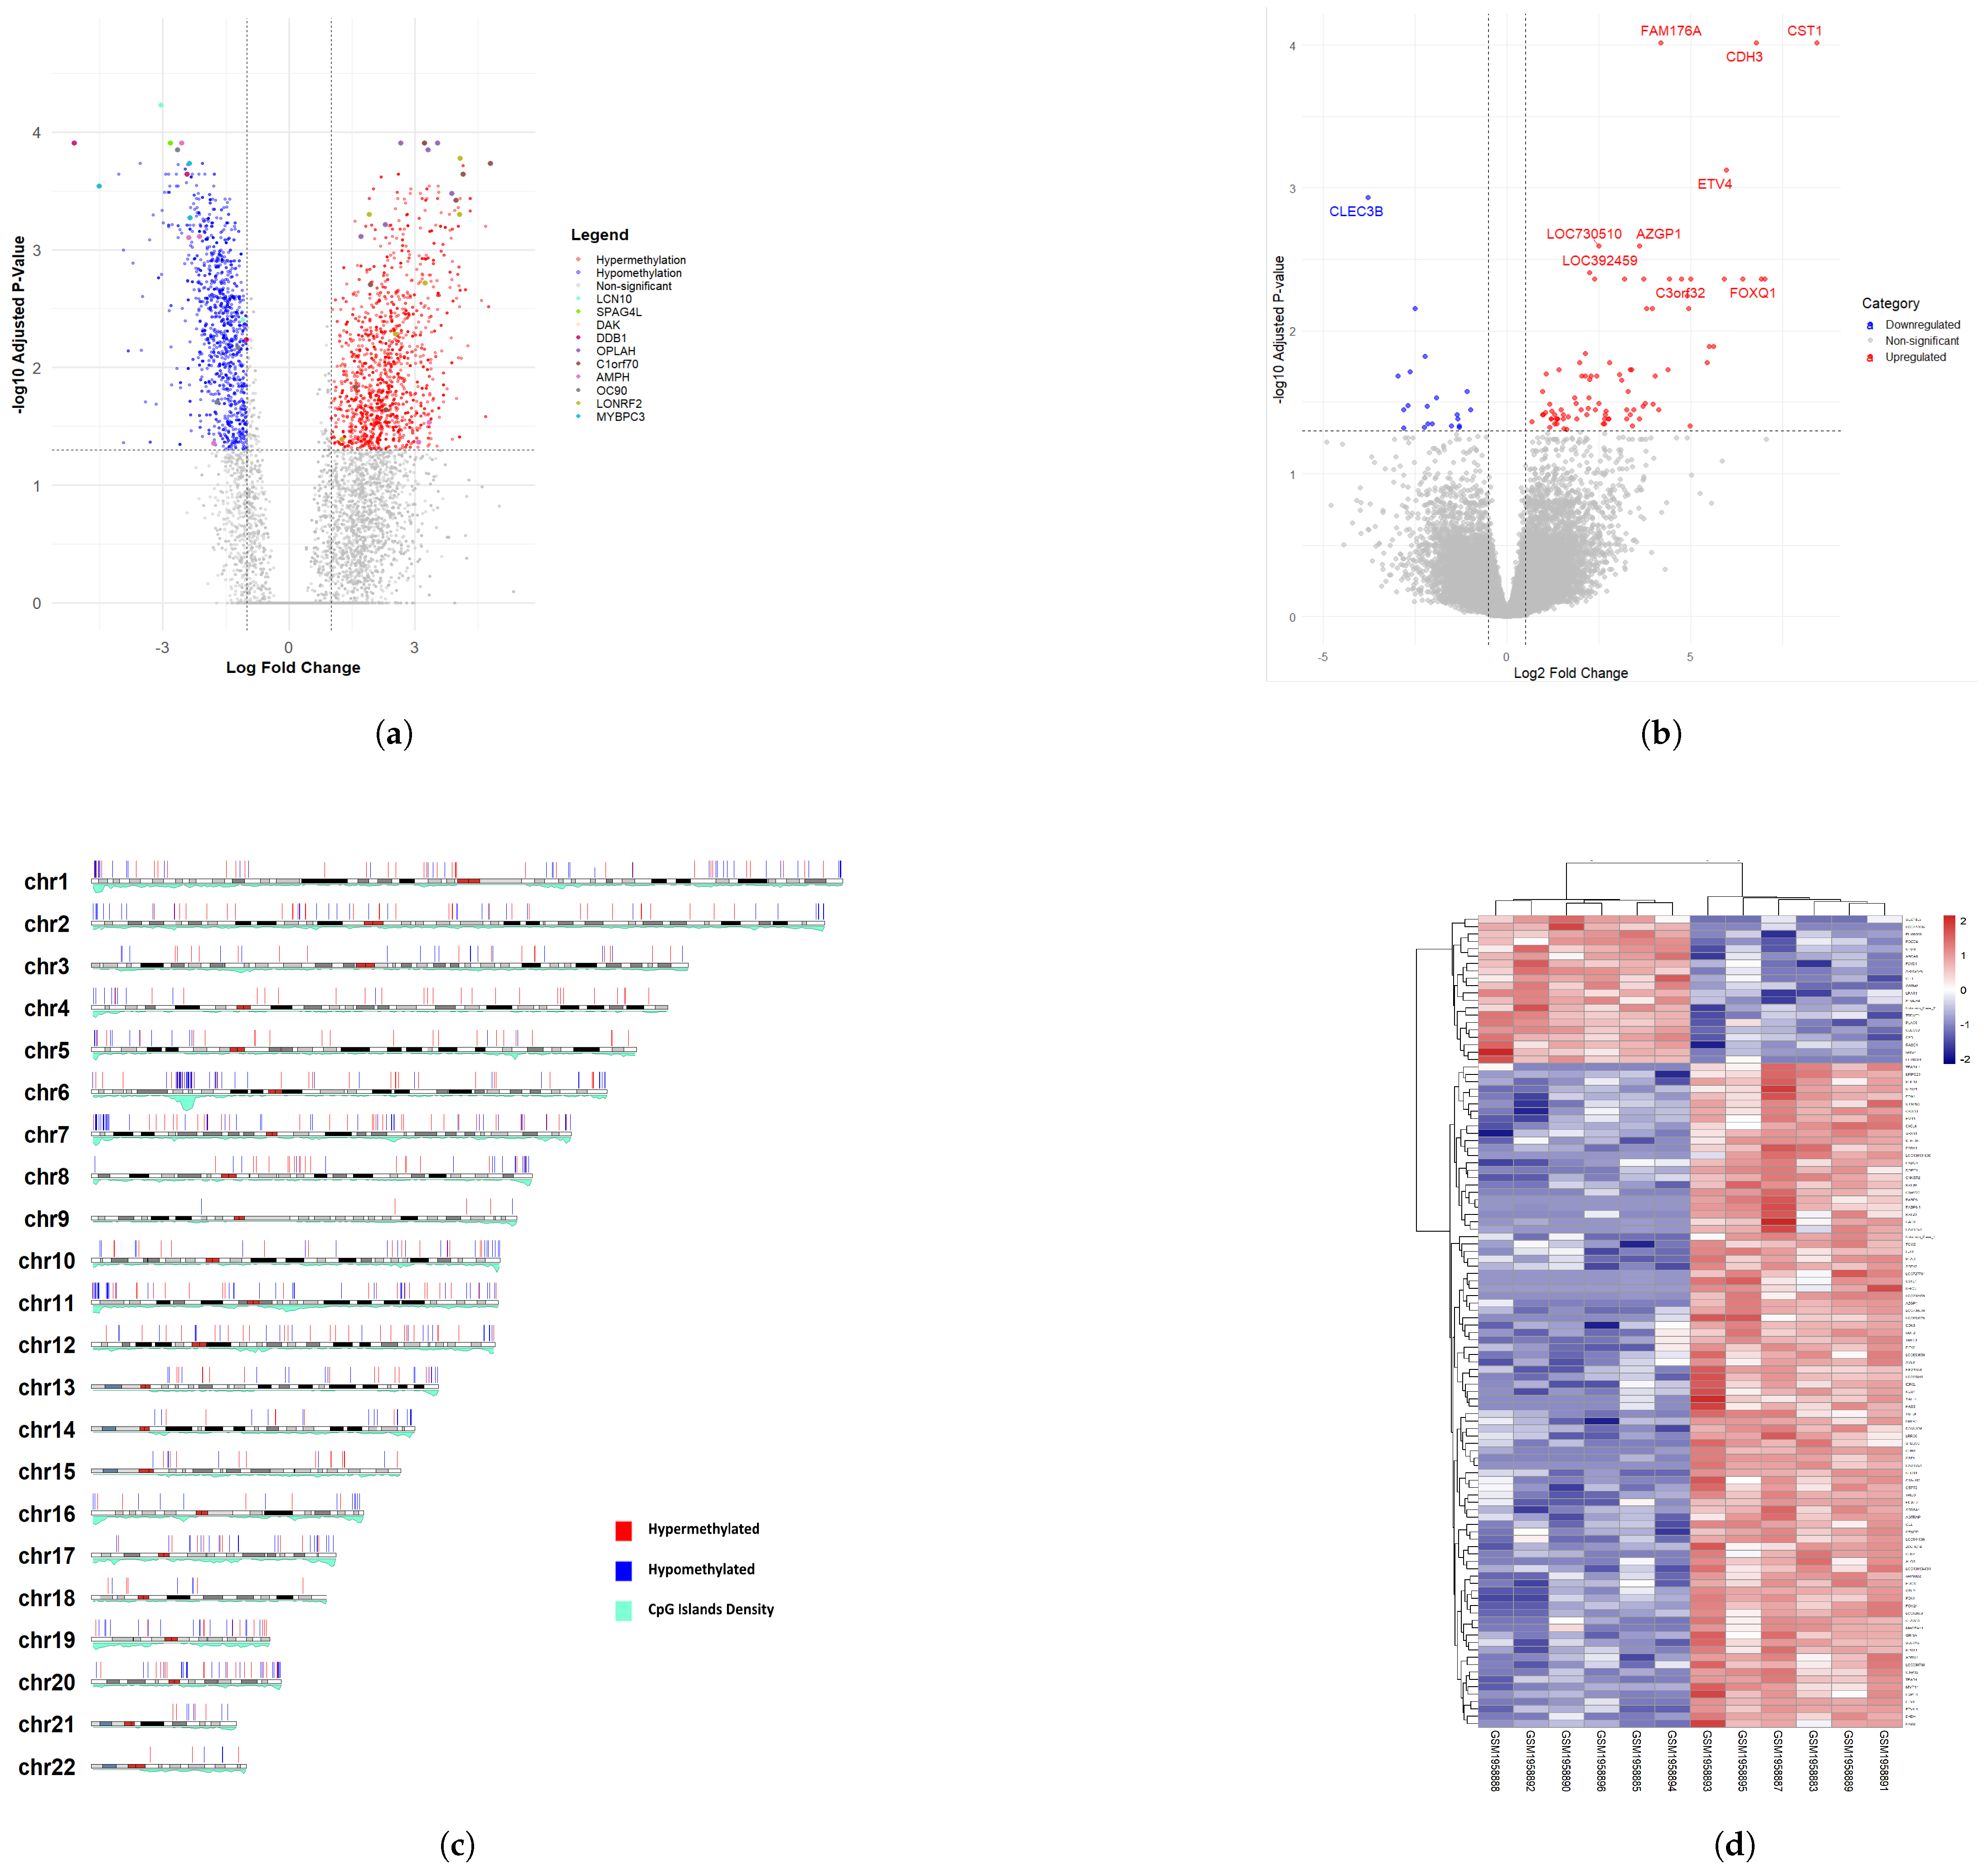
3.1. Differentially Methylated CpG Sites (DMCs) and Differentially Expressed Genes (DEGs) of Rectal Cancer Cohort

The methylation and expression datasets of rectal cancer were analyzed to identify differentially methylated CpG sites (DMCs) by fitting a generalized linear model from limma. The results from the DMC analysis were cross-referenced with differentially methylated regions (DMRs) to enhance the reliability of the findings. A total of 678 genes were classified as significantly hypermethylated or hypomethylated within the identified DMRs. Differential expression analysis revealed 101 genes that were significantly up- or downregulated in rectal cancer. The lists of significant genes from the methylation and expression analyses are provided in Supplementary Tables S1 and S2, respectively. Figure 3 illustrates the volcano plots for DMCs and DEGs, the karyogram highlighting DMRs with significant hypermethylation and hypomethylation, and a heatmap of the top 50 differentially expressed genes.

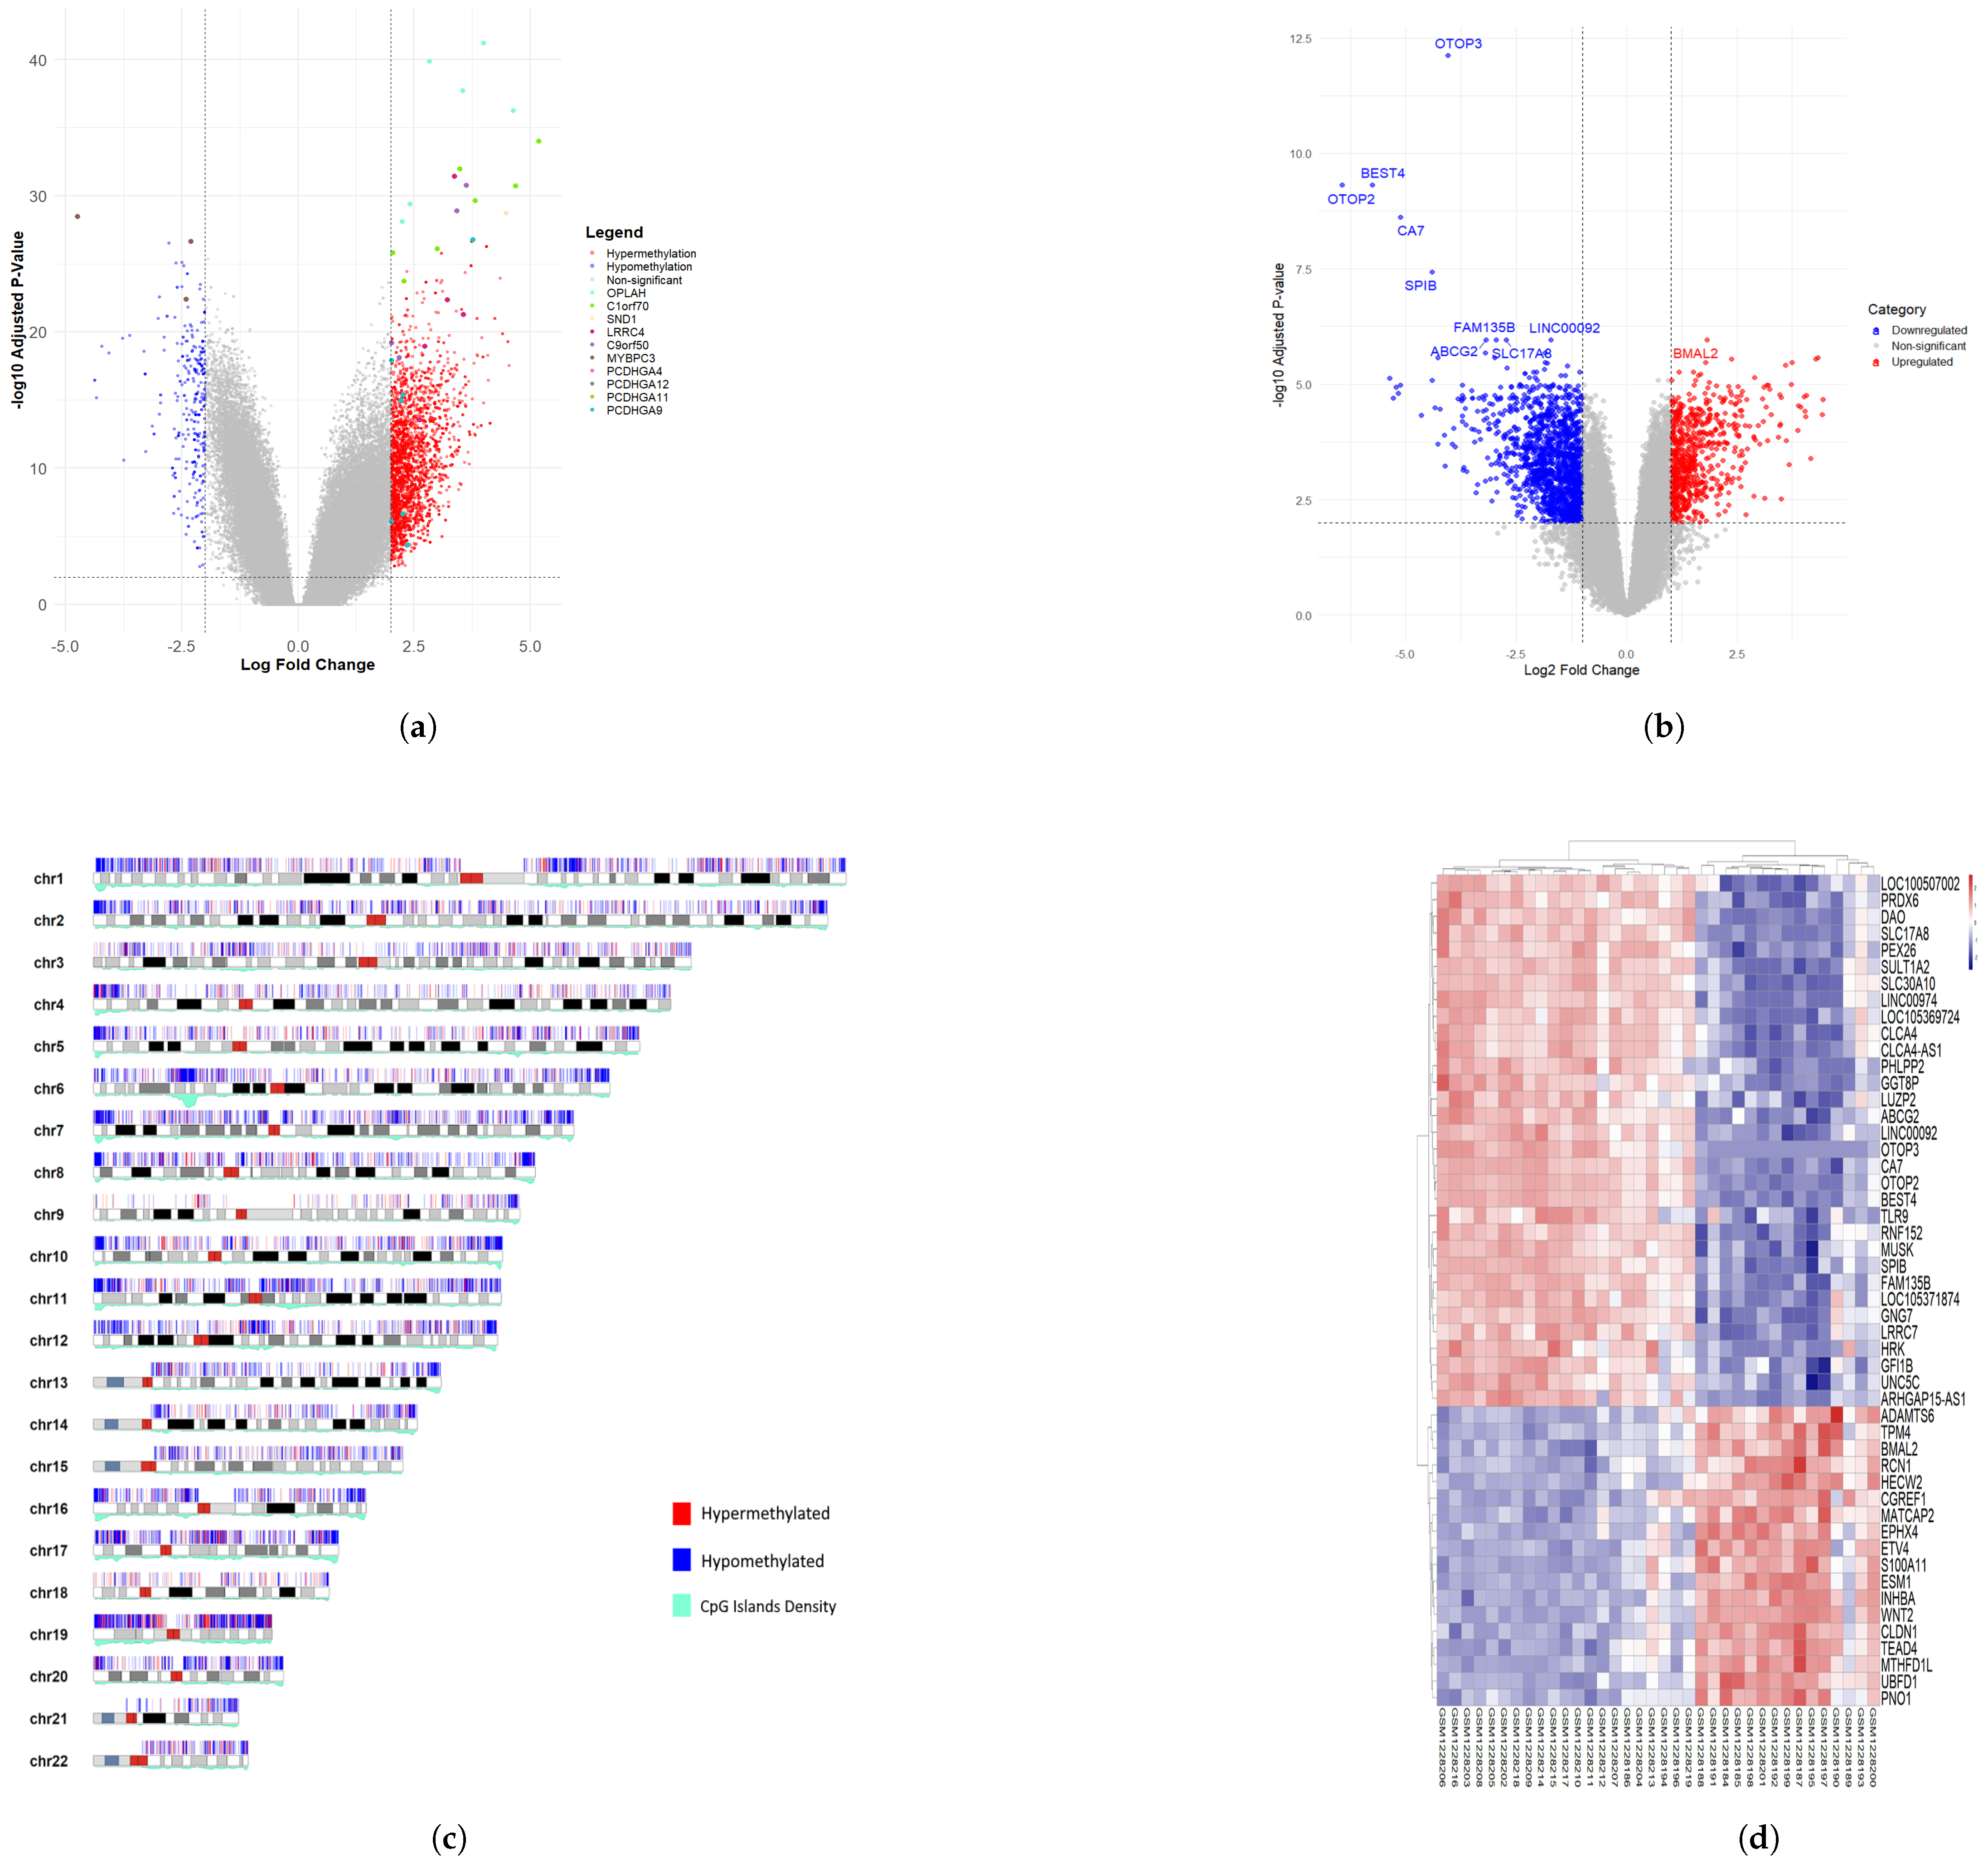
3.2. Differentially Methylated CpG Sites (DMCs) and Differentially Expressed Genes (DEGs) of Colon Cancer Cohort

Conserving the methodology applied to the rectal cancer cohort, we extended this analysis to the colon cancer datasets. The methylation and expression data of the colon cancer samples were analyzed to identify differentially methylated CpG sites (DMCs) by fitting a linear model from limma. The results from the DMC analysis were cross-referenced with differentially methylated regions (DMRs) to enhance the reliability of the findings. A total of 1053 genes were classified as significantly hypermethylated or hypomethylated within the identified DMRs. Differential expression analysis revealed 2130 genes that were significantly upregulated or downregulated in the colon cancer group. The lists of significant genes from the methylation and expression analyses are provided in Supplementary Tables S3 and S4, respectively. Figure 4 illustrates the volcano plots for DMCs and DEGs, the karyogram highlighting DMRs with significant hypermethylation and hypomethylation, and a heatmap of the top 50 differentially expressed genes.

3.3. Methylation-Regulated Genes (MRGs)

Out of the 678 unique genes identified from both the DMC and DMR analyses in rectal cancer, six genes that overlapped with the 101 differentially expressed genes (DEGs). Similarly, 146 overlapping genes were identified from the colon cancer DMC and DMR analyses with corresponding DEGs. In total, 150 genes were inferred as methylation-regulated genes (MRGs) across the total colorectal cancer cohort, with two genes in particular—PDX1 and GNG7—consistently identified in both rectal and colon cancer individual analyses. These common genes were considered as promising candidates of MRGs. To validate the identified MRGs, we conducted further functional annotation, pathway enrichment, and survival analysis, highlighting the role of these genes in CRC. A select group of the identified MRGs, along with their log 2 fold change, average expression, and adjusted p-values, is summarized in Table 1, which highlight all genes pertaining to rectal cancer cohort (six genes in total) and the top 10 MRGs from colon cancer; the full list includes the shared genes (highlighted in bold) across all samples.

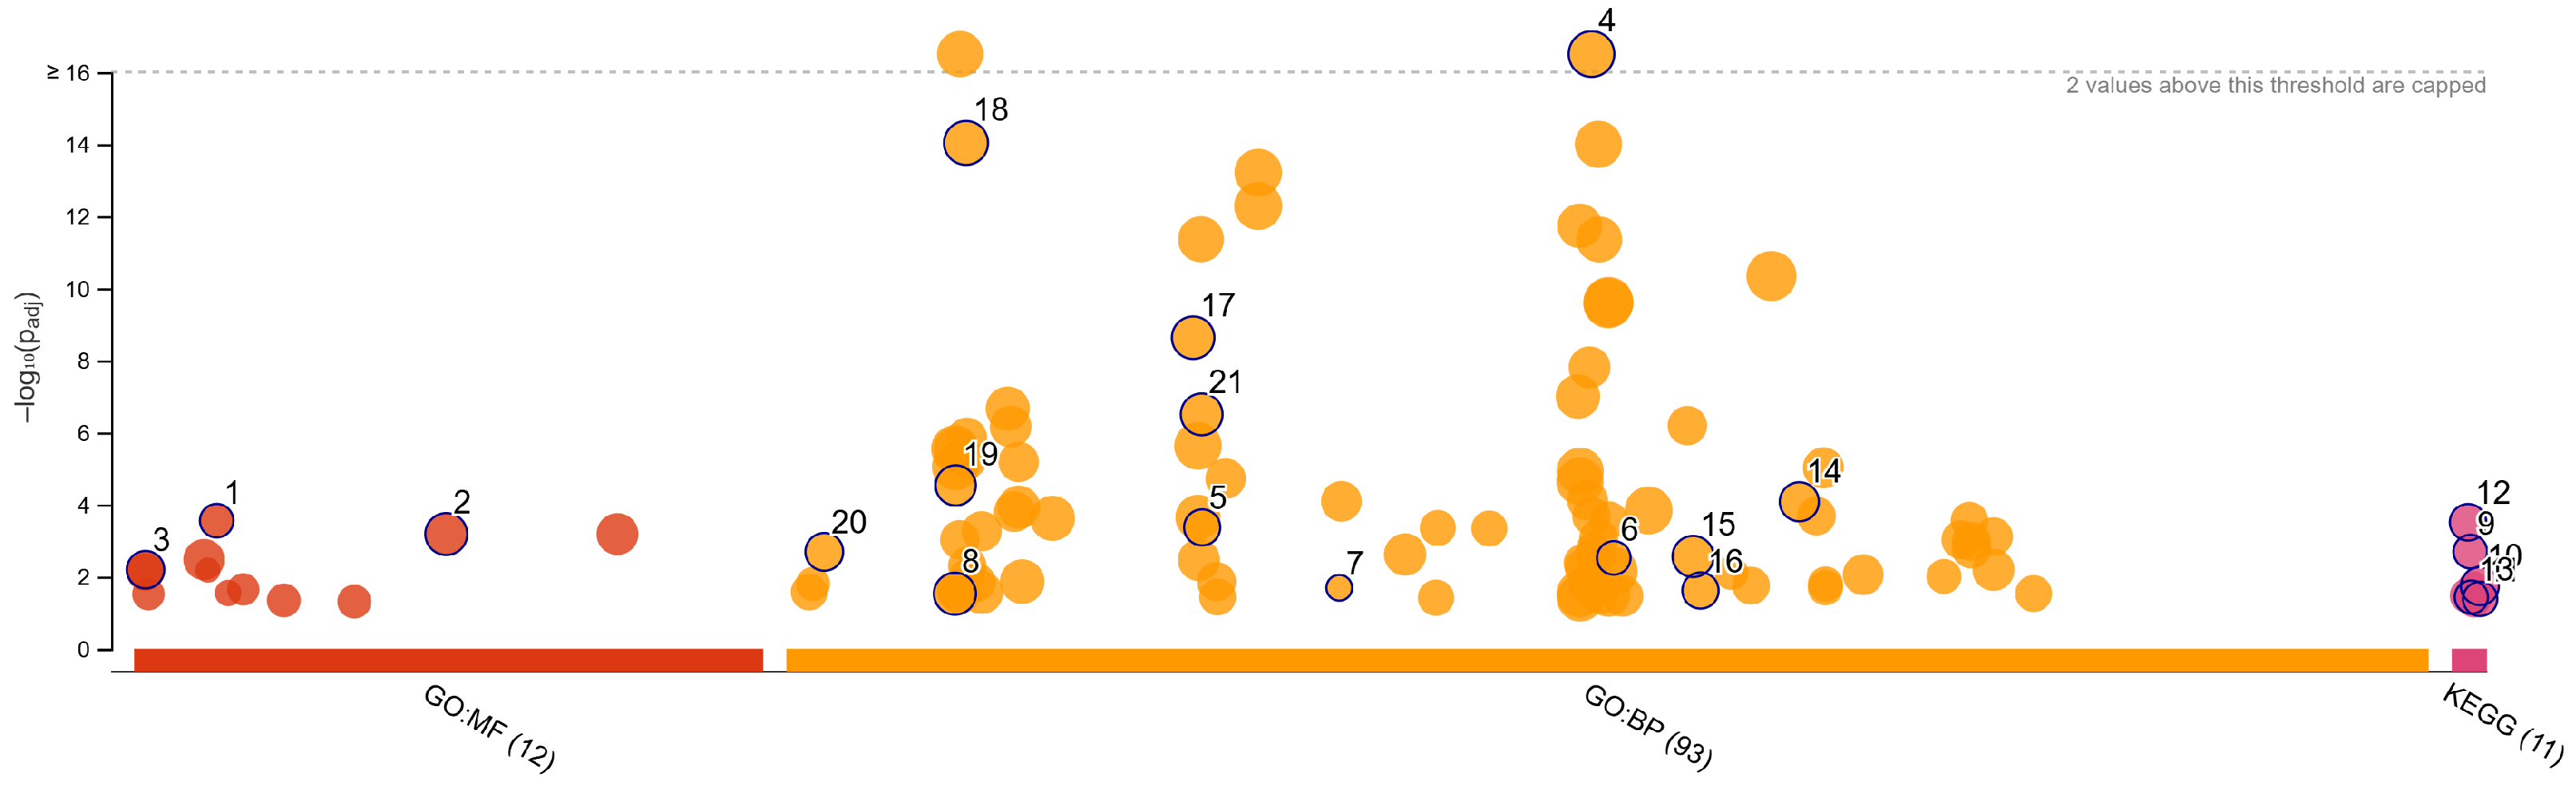
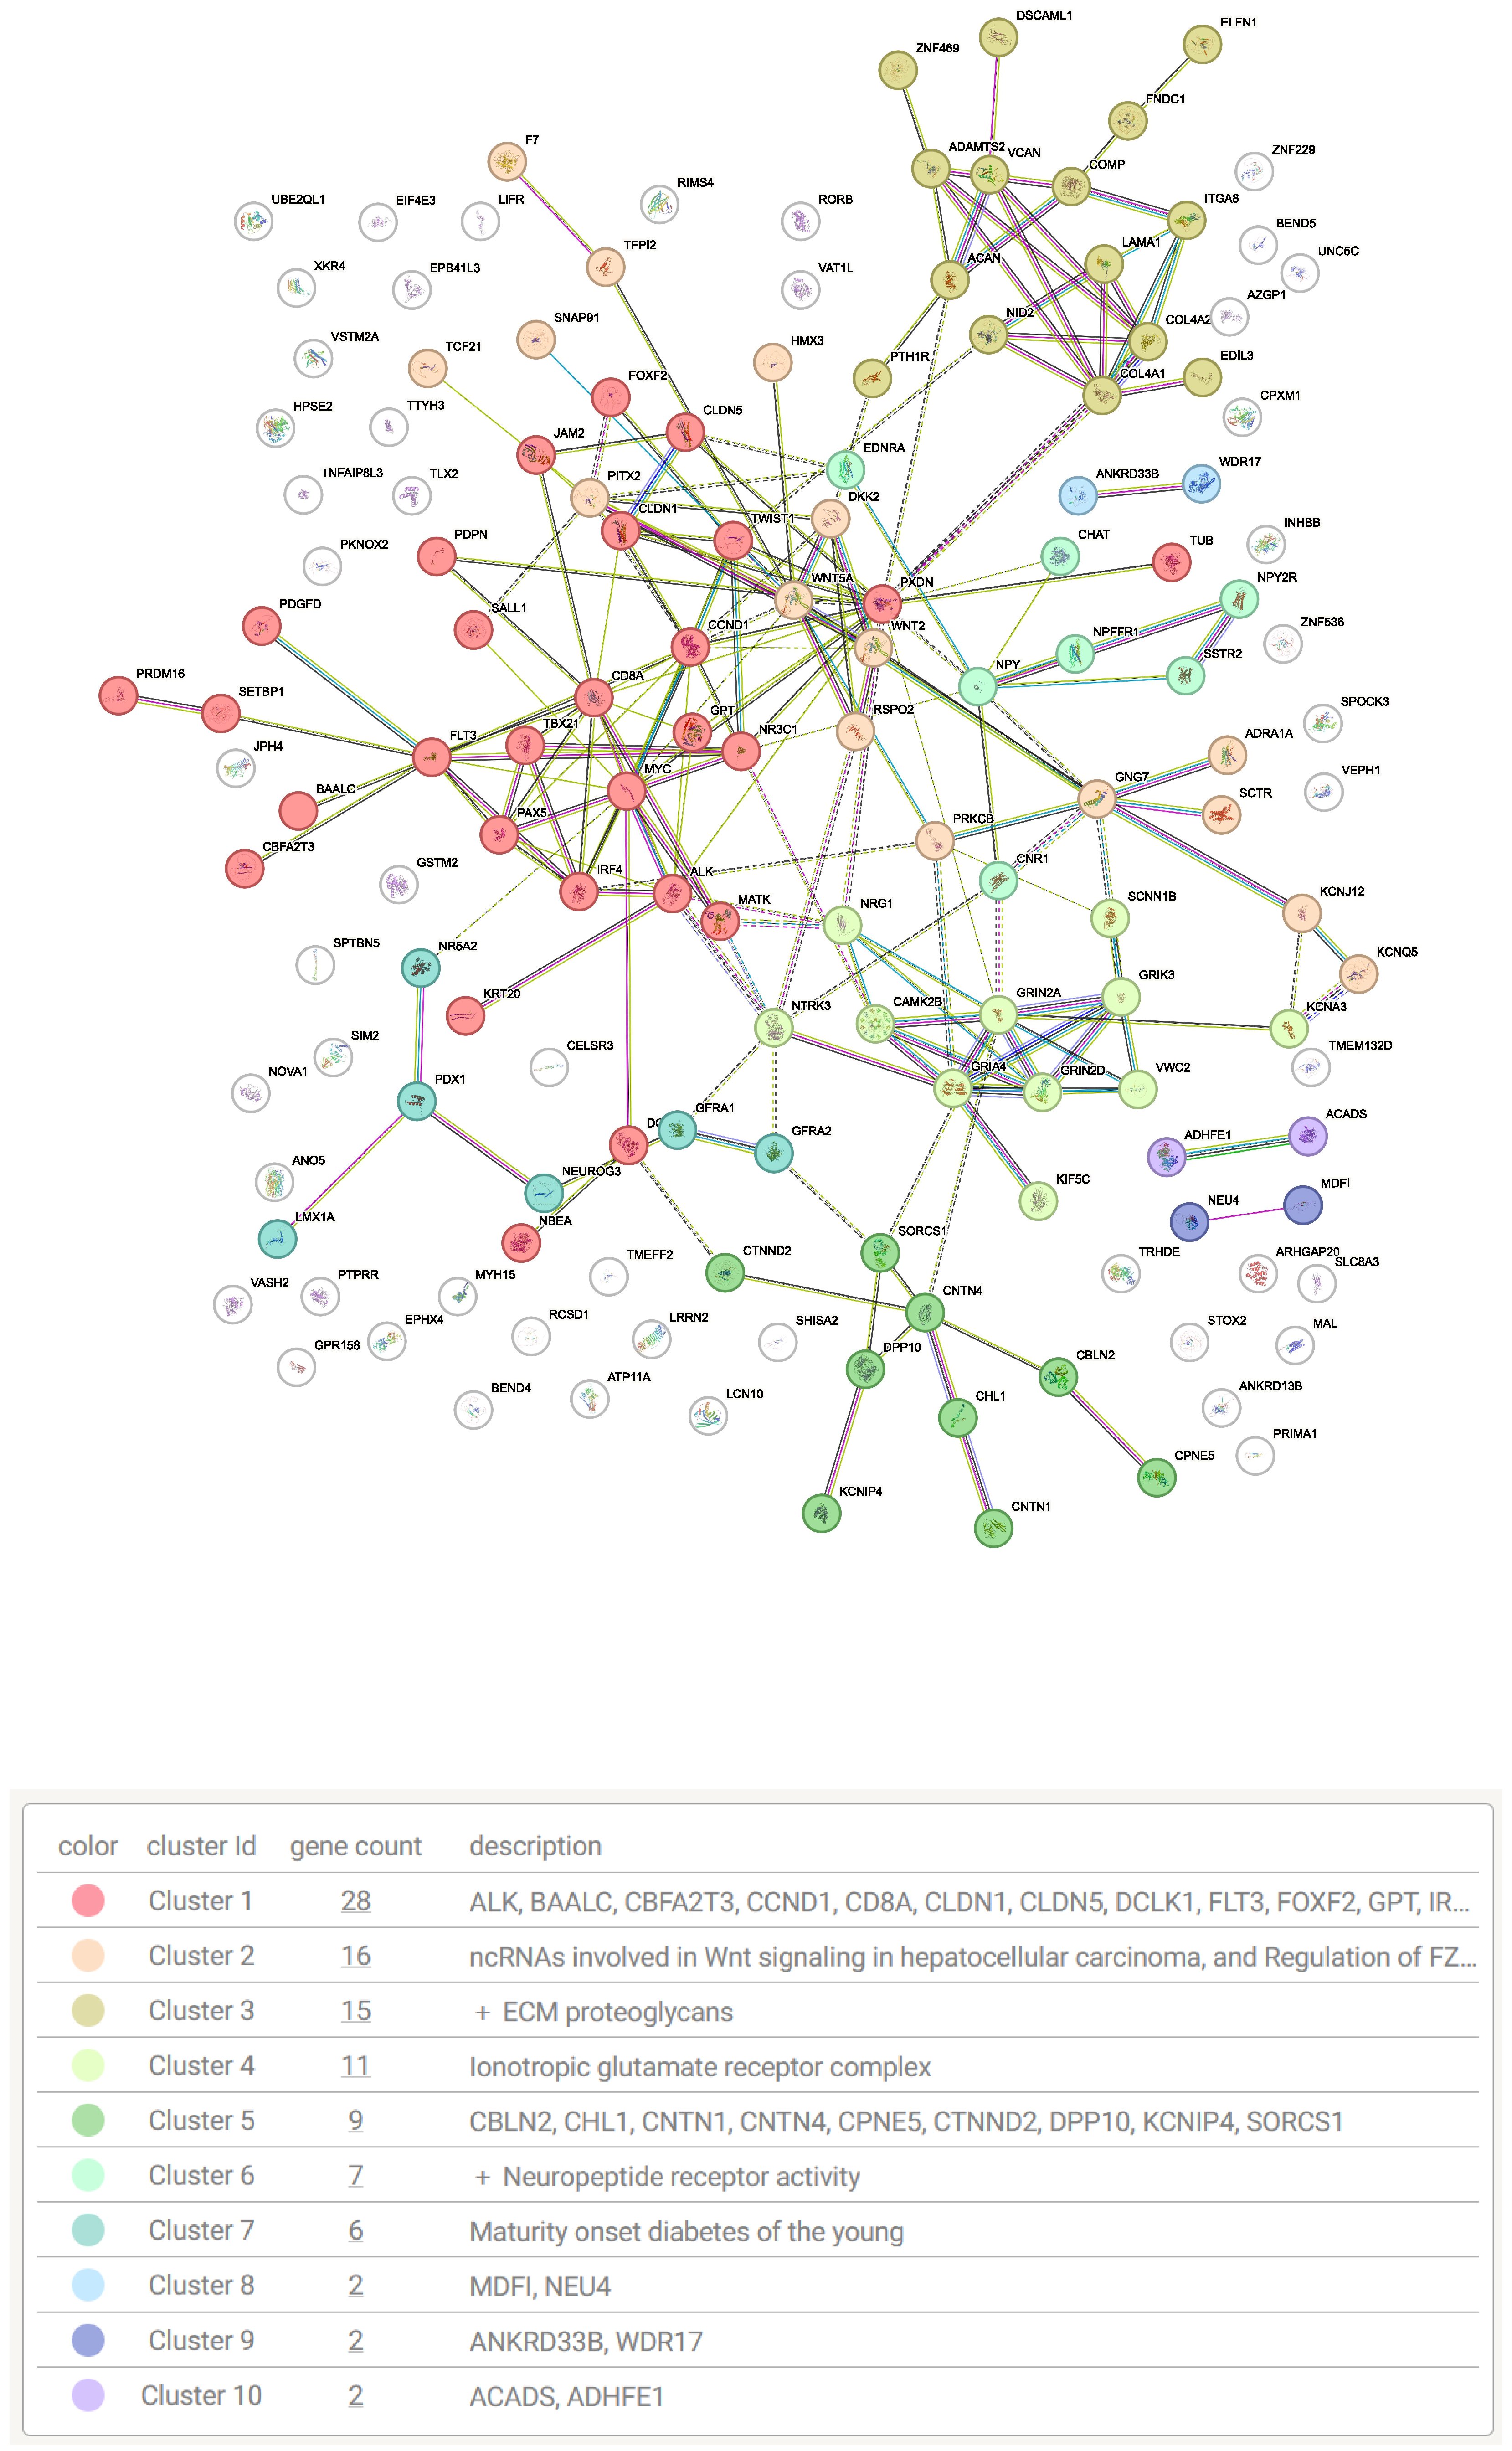
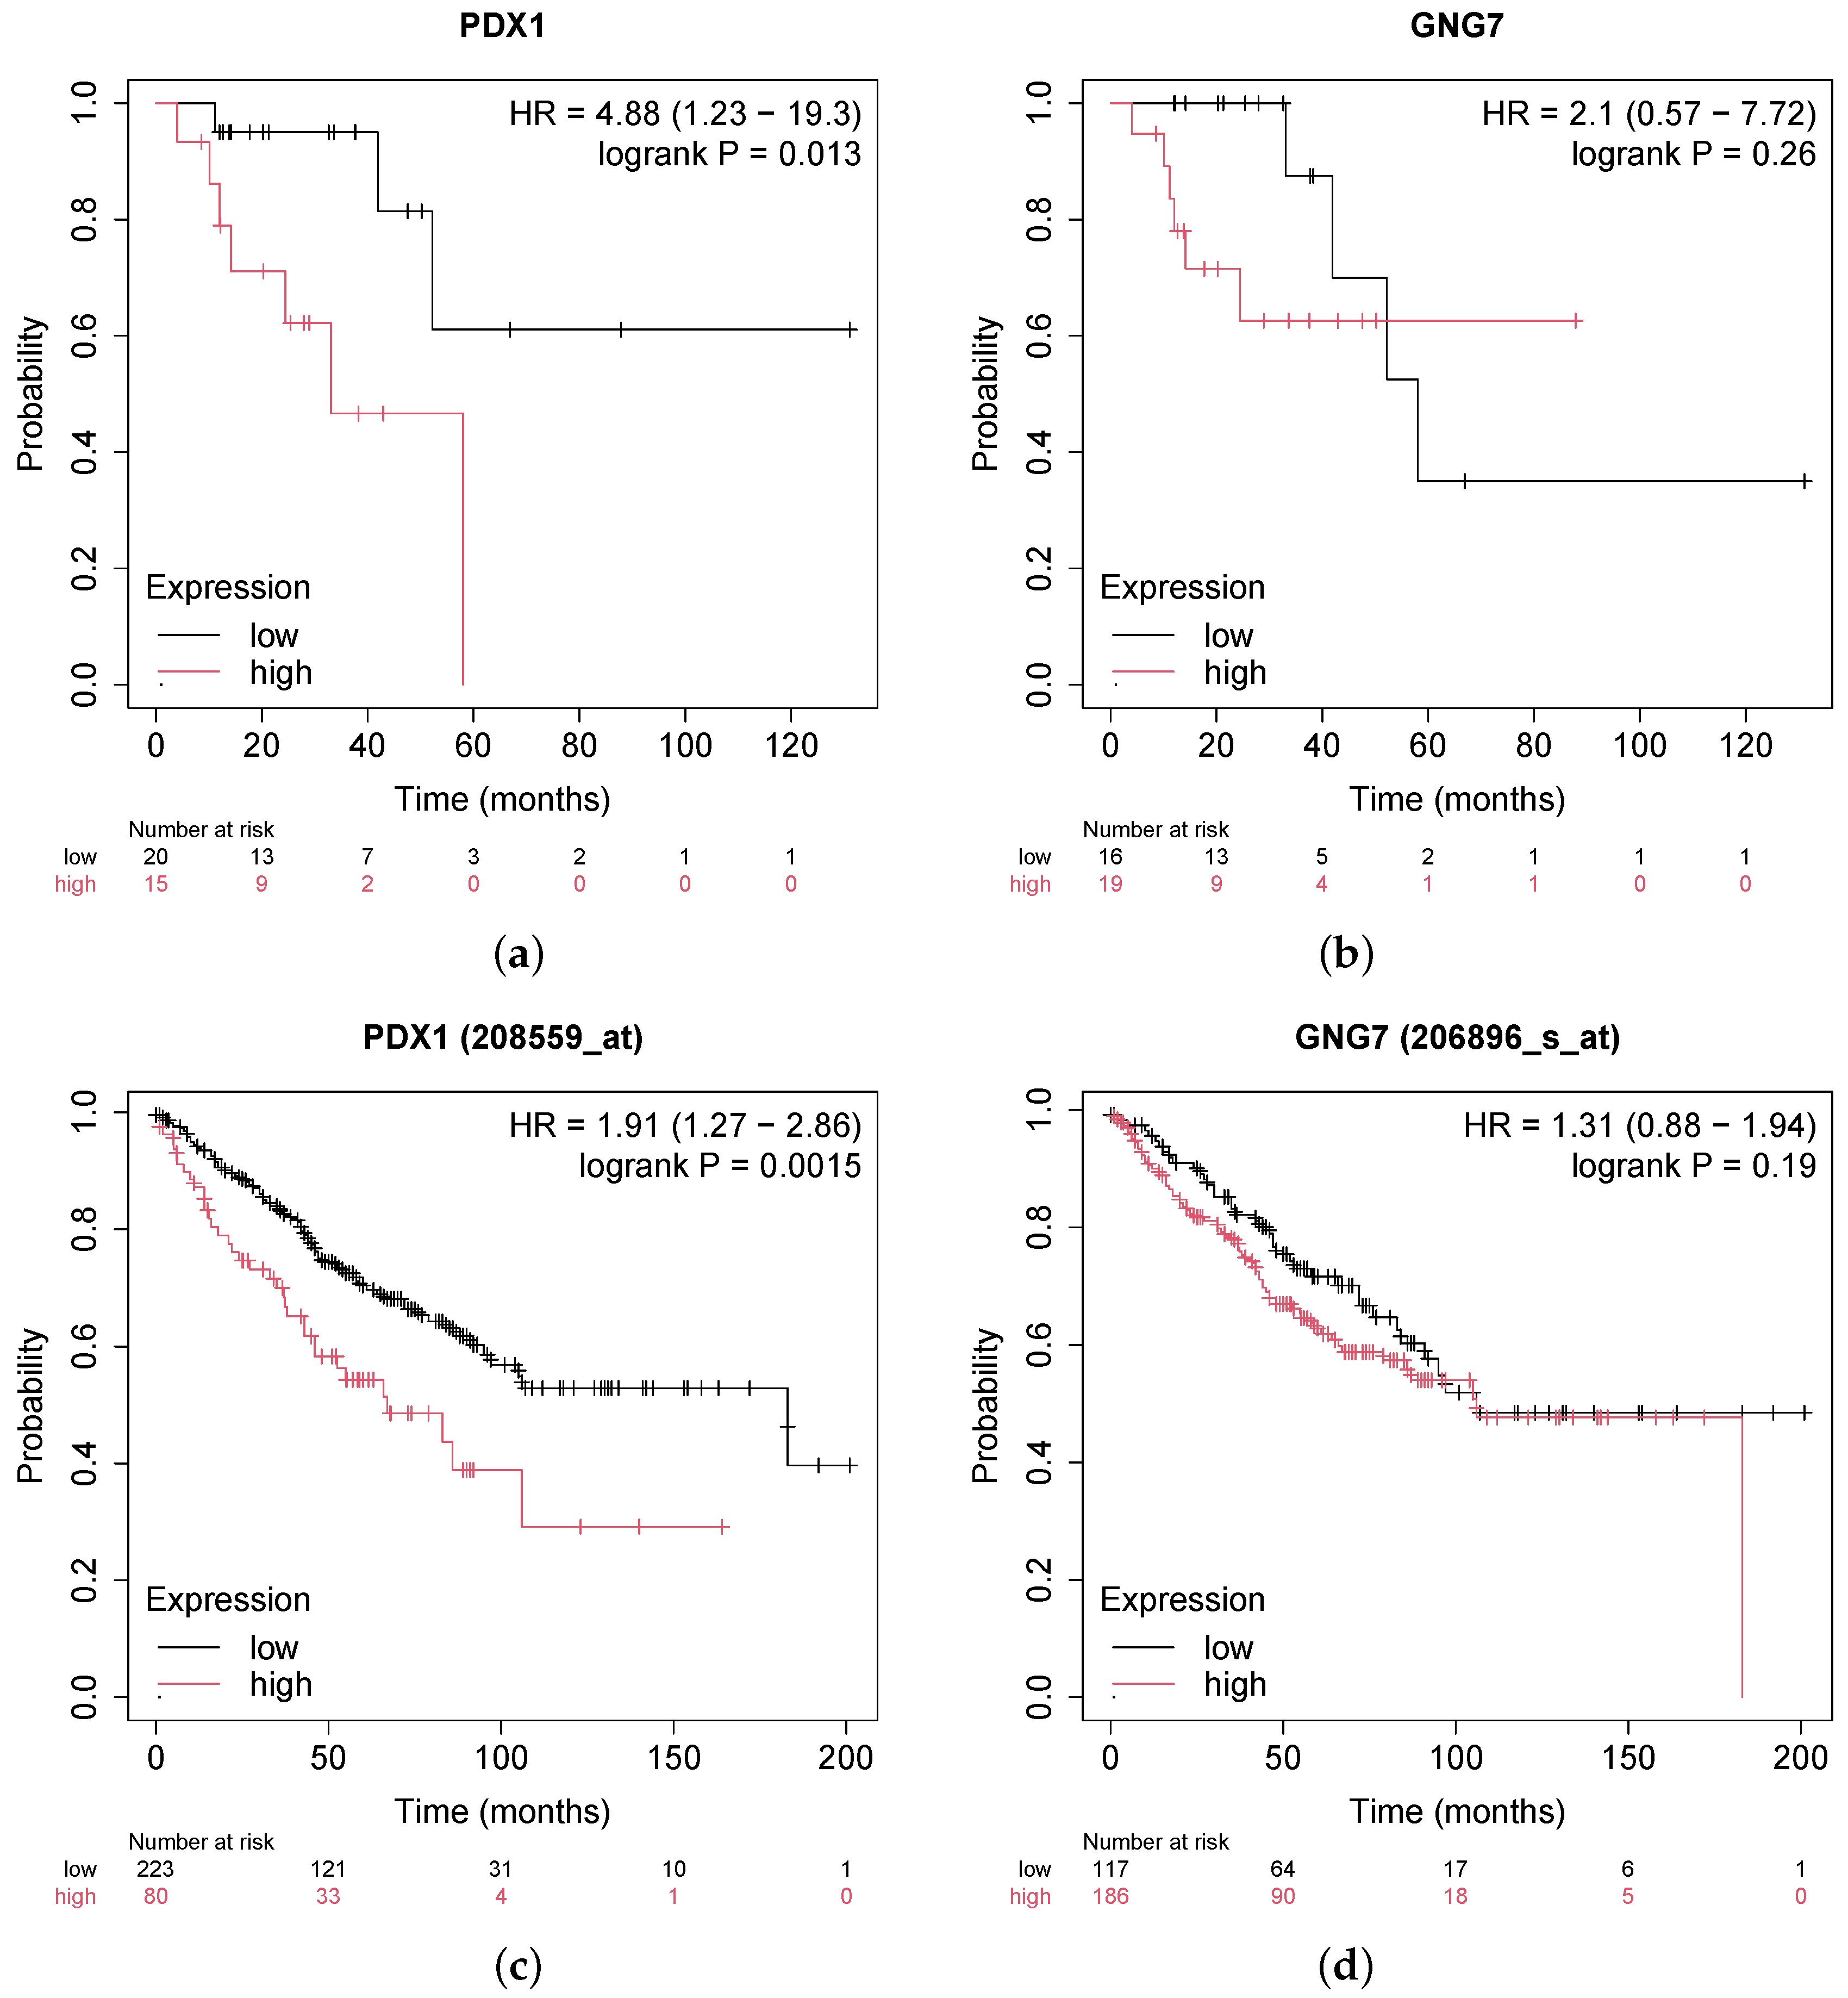
3.4. Validation and Functional Enrichment of Methylation-Regulated Genes

The methylation-regulated genes (MRGs) were further subjected to functional enrichment analysis using KEGG and Gene Ontology databases via g:Profiler methods [19]. Key biological pathways identified from the enrichment results include the Wnt signaling pathway, pathways in cancer, and extracellular matrix organization, among others. Additionally, several neurogenesis and neuron development pathways were identified, highlighting the role of the nervous system (enteric nervous system) in the etiology and development in CRC. Figure 5 presents the enrichment and functional analysis results, highlighting the top enriched pathways associated with MRGs. Table 2 summarizes the functional pathways associated with the methylation-regulated genes (MRGs), as identified through Gene Ontology and KEGG pathway enrichment analysis.
In addition, Figure 6 illustrates the protein–protein interaction (PPI) network generated using the STRING database, along with functionally relevant pathways derived from these interactions.
Furthermore, we performed additional validation through survival analysis performed on public clinical data for two selected highlighted genes, PDX1 and GNG7—which were commonly identified in both datasets. This analysis is presented in Figure 7. These Kaplan–Meier plots illustrate the association between gene expression levels and patient survival across rectal and colon cancer cohorts.

4. Discussion

Colorectal cancer (CRC) arises when the normal epithelial cells of the colon and rectum undergo transformation into a precancerous lesion, ultimately progressing to an advanced carcinoma capable of metastasizing to other organs [1]. The risks of developing colorectal cancer (CRC) are associated with age, environmental influences, behavioral patterns, and genetic determinants [20]. Raut et al. [21] identified two fecal DNA methylation biomarkers for detecting stages in colorectal cancer (CRC). Bach et al. [22] discovered SEPT9 and SDC2 as critical markers for non-invasive colorectal cancer (CRC) detection by urine-based DNA methylation analysis. DNA methylation has been extensively studied in CRC; Huang et al. [23] identified distinct tumor clusters with methylated CpG islands linked to metabolic pathways, enhanced ATP production, and tumor aggressiveness in CRC.
In this current study, we analyzed data from a publicly available dataset on colon and rectal cancer samples and carried out differential methylation and expression analysis on these datasets. We identified significant hypermethylated and hypomethylated genes in CRC and found genes that were methylation-regulated suggesting methylation plays a role in the alterations of these gene expression patterns. Similarly, Miao et al. [24], through an integrated analysis in the pathogenesis of coronary artery disease, found overlaps between differentially methylated genes (DMGs) and DEGs through their intersection and carried out subsequent analysis to highlight genes important in the pathogenesis of coronary heart disease. Sun et al. [25], through an integrated analysis, identified eight genes that are regulated by methylation and proposed these genes to have therapeutic and diagnostic relevance in lung cancer.
A total of 150 genes were identified as MRGs from CRC analysis which includes PDX1 and GNG7 as spotlight genes were consistently found in rectal as well as colorectal cancer samples in both differentially expressed and methylated gene groups.
Findings from Liu et al. [26] showed 411 upregulated genes that were significantly hypomethylated and 239 downregulated genes that were hypermethylated. The hub genes that can serve as important biomarkers for CRC. Similarly, Sun et al. [27] identified hub genes that were differentially expressed in CRC analysis and suggested these hub genes as biomarkers of CRC.
In this study, we identified 101 and 2130 significant differentially expressed genes (DEGs) in rectal and colon cancer, respectively. Correspondingly, 678 and 1053 significant differentially methylated CpG sites (DMCs) were detected in rectal and colon cancer. By intersecting the DEGs and DMCs from each dataset, we identified a total of 150 methylation-regulated genes (MRGs). Notably, PDX1 and GNG7 were common to both rectal and colon cancer analyses, with GNG7 also ranking among the top ten genes in colon cancer.
GNG7, a component of heterotrimeric G proteins, is highly enriched in the striatum and plays a crucial role in the neuroprotective response mediated by A2A adenosine and D1 dopamine receptors. Previous studies have reported GNG7 downregulation in various cancers, including pancreatic, gastrointestinal tract, renal, and lung cancers [28]. In our study, we identified GNG7 as being downregulated and hypomethylated in colorectal cancer. PDX1 is predominantly expressed in the islets of Langerhans, central nervous system, and gastrointestinal tract [29,30]. It is a critical transcription factor involved in pancreas development and has been implicated in colorectal cancer (CRC). A recent study by Lee et al. [31] reported that the hypermethylation of PDX1 serves as a potential biomarker for CRC prognosis [31]. Consistent with these findings, our current analysis also demonstrates that PDX1 is hypermethylated and correspondingly upregulated in colorectal cancer samples.
We performed KEGG pathway enrichment and Gene Ontology (GO) analyses using g:Profiler, alongside protein–protein interaction (PPI) and gene network enrichment analyses via the STRING database, to explore the functional significance of the identified methylation-regulated genes (MRGs). Important pathways enriched among the MRGs include the Wnt signaling pathway, extracellular matrix (ECM) organization, neurogenesis and neuronal differentiation, and maturity-onset diabetes of the young. Zhu et al. [32] reported that the Wnt signaling pathway plays a crucial role in colorectal cancer (CRC), particularly affecting the survival and proliferation of CRC cells, including cancer stem cells. Similarly, Li et al. [33] highlighted that genetic aberrations in components of the Wnt/ β -catenin signaling pathway are associated with CRC progression. Karlsson et al. [34] identified the ECM as a potential prognostic marker for CRC due to its critical role within the tumor microenvironment and its possible contribution to metastasis. In agreement, Kim et al. [35] also suggested ECM components as important biomarkers for CRC. Additionally, our PPI network analysis highlighted genes implicated in neurogenesis and neural differentiation. Gut autonomic functions are regulated by the enteric nervous system, and impairments in this system could disrupt interactions with other cellular components, potentially driving CRC tumorigenesis [36,37,38]. Several studies have reported associations between colorectal cancer and Type II diabetes mellitus (T2DM). Liu et al. [39] reviewed evidence demonstrating increased DNA methylation at multiple CpG sites in pancreatic islets of T2DM patients, which significantly reduces PDX1 mRNA expression, impairing insulin secretion. Similarly, Cheng et al. [40] reviewed how insulin resistance might influence tumor growth, thereby linking diabetes and colorectal cancer progression. Survival analysis was carried out for the two spotlight genes, and the high expression of PDX1 was seen to be correlated to low survival, while GNG7 upregulation and downregulation showed similar low survival across samples.
In conclusion, 150 genes were identified as methylation-regulated genes through a comprehensive bioinformatics analysis, suggesting that methylation affects their expression levels. These genes have been associated with a variety of tumors in literature studies, with some specifically linked to colorectal cancer (CRC). We propose the highlighted genes could serve as biomarkers for CRC etiology and disease prognosis. Our study is limited to the secondary analysis, and further experimental tests can further validate the functional insights gained from this study. We look forward to continuing experimental validation as a future direction for this project.

Supplementary Materials

The following supporting information can be downloaded at: https://www.mdpi.com/article/10.3390/genes16060620/s1. Table S1: rectal cancer methylation DMC; Table S2: rectal cancer expression DEG; Table S3: colon cancer methylation DMC; Table S4: colon cancer expression DEG; Figure S1: Normalization/Batch Effect; Figure S2: Venn diagram showing the gene overlap in colon and rectal cancer

Author Contributions

Conceptualization, O.B.O.; Methodology, O.B.O. and M.R.M.; Software, O.B.O.; Formal analysis, O.B.O.; Investigation, M.R.M.; Resources, M.R.M.; Data curation, O.B.O.; Writing—original draft, O.B.O.; Writing—review & editing, M.R.M.; Supervision, M.R.M.; Project administration, M.R.M.; Funding acquisition, M.R.M. All authors have read and agreed to the published version of the manuscript.

Funding

This work is supported by: NSF 2341725, NIH K25CA270079 and OU-BIC2.0.

Data Availability Statement

The data used in this work are publicly available from GEO archive under accession number GSE75550, GSE50760 and GSE101764.

Conflicts of Interest

The authors declare no conflicts of interest. The funders had no role in the design of the study; in the collection, analyses, or interpretation of data; in the writing of the manuscript; or in the decision to publish the results.

Abbreviations

The following abbreviations are used in this manuscript:
CRCColorectal cancer
MRGsMethylation-regulated genes
DMCsDifferentially methylated CpG sites
DMRsDifferentially methylated regions
DEGsDifferentially expressed genes

References

  1. Alzahrani, S.M.; Al Doghaither, H.A.; Al-Ghafari, A.B. General insight into cancer: An overview of colorectal cancer. Mol. Clin. Oncol. 2021, 15, 271. [Google Scholar] [CrossRef] [PubMed]
  2. Hoang, T.; Kim, H.; Kim, J. Dietary intake in association with all-cause mortality and colorectal cancer mortality among colorectal cancer survivors: A systematic review and meta-analysis of prospective studies. Cancers 2020, 12, 3391. [Google Scholar] [CrossRef] [PubMed]
  3. Housini, M.; Dariya, B.; Ahmed, N.; Stevens, A.; Fiadjoe, H.; Nagaraju, G.P.; Basha, R. Colorectal cancer: Genetic alterations, novel biomarkers, current therapeutic strategies and clinical trials. Gene 2024, 892, 147857. [Google Scholar] [CrossRef]
  4. Ogunwobi, O.O.; Mahmood, F.; Akingboye, A. Biomarkers in colorectal cancer: Current research and future prospects. Int. J. Mol. Sci. 2020, 21, 5311. [Google Scholar] [CrossRef] [PubMed]
  5. Zygulska, A.L.; Pierzchalski, P. Novel diagnostic biomarkers in colorectal cancer. Int. J. Mol. Sci. 2022, 23, 852. [Google Scholar] [CrossRef]
  6. Vrba, L.; Futscher, B.W. DNA methylation changes in biomarker loci occur early in cancer progression. F1000Research 2020, 8, 2106. [Google Scholar] [CrossRef]
  7. Shen, Y.; Wang, D.; Yuan, T.; Fang, H.; Zhu, C.; Qin, J.; Xu, X.; Zhang, C.; Liu, J.; Zhang, Y.; et al. Novel DNA methylation biomarkers in stool and blood for early detection of colorectal cancer and precancerous lesions. Clin. Epigenet. 2023, 15, 26. [Google Scholar] [CrossRef]
  8. Zhao, G.; Liu, X.; Liu, Y.; Li, H.; Ma, Y.; Li, S.; Zhu, Y.; Miao, J.; Xiong, S.; Fei, S.; et al. Aberrant DNA methylation of SEPT9 and SDC2 in stool specimens as an integrated biomarker for colorectal cancer early detection. Front. Genet. 2020, 11, 643. [Google Scholar] [CrossRef]
  9. Nikolouzakis, T.K.; Vassilopoulou, L.; Fragkiadaki, P.; Mariolis Sapsakos, T.; Papadakis, G.Z.; Spandidos, D.A.; Tsatsakis, A.M.; Tsiaoussis, J. Improving diagnosis, prognosis and prediction by using biomarkers in CRC patients. Oncol. Rep. 2018, 39, 2455–2472. [Google Scholar] [CrossRef]
  10. Li, S.; Liu, Y.; Liu, M.; Wang, L.; Li, X. Comprehensive bioinformatics analysis reveals biomarkers of DNA methylation-related genes in varicose veins. Front. Genet. 2022, 13, 1013803. [Google Scholar] [CrossRef]
  11. Davis, S.; Meltzer, P.S. GEOquery: A bridge between the Gene Expression Omnibus (GEO) and BioConductor. Bioinformatics 2007, 23, 1846–1847. [Google Scholar] [CrossRef]
  12. Ritchie, M.E.; Phipson, B.; Wu, D.; Hu, Y.; Law, C.W.; Shi, W.; Smyth, G.K. limma powers differential expression analyses for RNA-sequencing and microarray studies. Nucleic Acids Res. 2015, 43, e47. [Google Scholar] [CrossRef] [PubMed]
  13. Peters, T.J.; Buckley, M.J.; Statham, A.L.; Pidsley, R.; Samaras, K.; V Lord, R.; Clark, S.J.; Molloy, P.L. De novo identification of differentially methylated regions in the human genome. Epigenet. Chromatin 2015, 8, 6. [Google Scholar] [CrossRef] [PubMed]
  14. Team TBD. BSgenome.Hsapiens.UCSC.hg19: Full Genome Sequences for Homo Sapiens (UCSC Version hg19, Based on GRCh37.p13), R package version 1.4.3; Team TBD: Houston, TX, USA, 2020. [Google Scholar]
  15. Gel, B.; Serra, E. karyoploteR: An R/Bioconductor package to plot customizable genomes displaying arbitrary data. Bioinformatics 2017, 33, 3088–3090. [Google Scholar] [CrossRef] [PubMed]
  16. Robinson, M.D.; McCarthy, D.J.; Smyth, G.K. edgeR: A Bioconductor package for differential expression analysis of digital gene expression data. Bioinformatics 2010, 26, 139–140. [Google Scholar] [CrossRef]
  17. Raudvere, U.; Kolberg, L.; Kuzmin, I.; Arak, T.; Adler, P.; Peterson, H.; Vilo, J. g: Profiler: A web server for functional enrichment analysis and conversions of gene lists (2019 update). Nucleic Acids Res. 2019, 47, W191–W198. [Google Scholar] [CrossRef]
  18. Szklarczyk, D.; Gable, A.L.; Lyon, D.; Junge, A.; Wyder, S.; Huerta-Cepas, J.; Simonovic, M.; Doncheva, N.T.; Morris, J.H.; Bork, P.; et al. STRING v11: Protein–protein association networks with increased coverage, supporting functional discovery in genome-wide experimental datasets. Nucleic Acids Res. 2019, 47, D607–D613. [Google Scholar] [CrossRef]
  19. Lánczky, A.; Györffy, B. Web-based survival analysis tool tailored for medical research (KMplot): Development and implementation. J. Med. Internet Res. 2021, 23, e27633. [Google Scholar] [CrossRef]
  20. Lewandowska, A.; Rudzki, G.; Lewandowski, T.; Stryjkowska-Gora, A.; Rudzki, S. Risk factors for the diagnosis of colorectal cancer. Cancer Control 2022, 29, 10732748211056692. [Google Scholar] [CrossRef]
  21. Raut, J.R.; Guan, Z.; Schrotz-King, P.; Brenner, H. Fecal DNA methylation markers for detecting stages of colorectal cancer and its precursors: A systematic review. Clin. Epigenet. 2020, 12, 122. [Google Scholar] [CrossRef]
  22. Bach, S.; Paulis, I.; Sluiter, N.; Tibbesma, M.; Martin, I.; Van De Wiel, M.; Tuynman, J.; Bahce, I.; Kazemier, G.; Steenbergen, R. Detection of colorectal cancer in urine using DNA methylation analysis. Sci. Rep. 2021, 11, 2363. [Google Scholar] [CrossRef] [PubMed]
  23. Huang, H.; Li, Q.; Tu, X.; Yu, D.; Zhou, Y.; Ma, L.; Wei, K.; Gao, Y.; Zhao, G.; Han, R.; et al. DNA hypomethylation patterns and their impact on the tumor microenvironment in colorectal cancer. Cell. Oncol. 2024, 47, 1375–1389. [Google Scholar] [CrossRef] [PubMed]
  24. Miao, L.; Yin, R.X.; Zhang, Q.H.; Hu, X.J.; Huang, F.; Chen, W.X.; Cao, X.L.; Wu, J.Z. Integrated DNA methylation and gene expression analysis in the pathogenesis of coronary artery disease. Aging 2019, 11, 1486. [Google Scholar] [CrossRef] [PubMed]
  25. Sun, X.; Yi, J.; Yang, J.; Han, Y.; Qian, X.; Liu, Y.; Li, J.; Lu, B.; Zhang, J.; Pan, X.; et al. An integrated epigenomic-transcriptomic landscape of lung cancer reveals novel methylation driver genes of diagnostic and therapeutic relevance. Theranostics 2021, 11, 5346. [Google Scholar] [CrossRef]
  26. Liu, J.; Li, H.; Sun, L.; Wang, Z.; Xing, C.; Yuan, Y. Aberrantly methylated-differentially expressed genes and pathways in colorectal cancer. Cancer Cell Int. 2017, 17, 75. [Google Scholar] [CrossRef]
  27. Sun, G.; Li, Y.; Peng, Y.; Lu, D.; Zhang, F.; Cui, X.; Zhang, Q.; Li, Z. Identification of differentially expressed genes and biological characteristics of colorectal cancer by integrated bioinformatics analysis. J. Cell. Physiol. 2019, 234, 15215–15224. [Google Scholar] [CrossRef]
  28. Wei, Q.; Miao, T.; Zhang, P.; Jiang, B.; Yan, H. Comprehensive analysis to identify GNG7 as a prognostic biomarker in lung adenocarcinoma correlating with immune infiltrates. Front. Genet. 2022, 13, 984575. [Google Scholar] [CrossRef]
  29. Ebrahim, N.; Shakirova, K.; Dashinimaev, E. PDX1 is the cornerstone of pancreatic β-cell functions and identity. Front. Mol. Biosci. 2022, 9, 1091757. [Google Scholar] [CrossRef]
  30. Vinogradova, T.; Sverdlov, E. PDX1: A unique pancreatic master regulator constantly changes its functions during embryonic development and progression of pancreatic cancer. Biochemistry 2017, 82, 887–893. [Google Scholar] [CrossRef]
  31. Lee, Y.; Dho, S.H.; Lee, J.; Hwang, J.H.; Kim, M.; Choi, W.Y.; Lee, J.Y.; Lee, J.; Chang, W.; Lee, M.Y.; et al. Hypermethylation of PDX1, EN2, and MSX1 predicts the prognosis of colorectal cancer. Exp. Mol. Med. 2022, 54, 156–168. [Google Scholar] [CrossRef]
  32. Zhu, Y.; Li, X. Advances of Wnt signalling pathway in colorectal cancer. Cells 2023, 12, 447. [Google Scholar] [CrossRef] [PubMed]
  33. Li, Q.; Geng, S.; Luo, H.; Wang, W.; Mo, Y.Q.; Luo, Q.; Wang, L.; Song, G.B.; Sheng, J.P.; Xu, B. Signaling pathways involved in colorectal cancer: Pathogenesis and targeted therapy. Signal Transduct. Target. Ther. 2024, 9, 266. [Google Scholar] [CrossRef] [PubMed]
  34. Karlsson, S.; Nyström, H. The extracellular matrix in colorectal cancer and its metastatic settling–Alterations and biological implications. Crit. Rev. Oncol. /Hematol. 2022, 175, 103712. [Google Scholar] [CrossRef] [PubMed]
  35. Kim, M.S.; Ha, S.E.; Wu, M.; Zogg, H.; Ronkon, C.F.; Lee, M.Y.; Ro, S. Extracellular matrix biomarkers in colorectal cancer. Int. J. Mol. Sci. 2021, 22, 9185. [Google Scholar] [CrossRef]
  36. Holland, A.M.; Bon-Frauches, A.C.; Keszthelyi, D.; Melotte, V.; Boesmans, W. The enteric nervous system in gastrointestinal disease etiology. Cell. Mol. Life Sci. 2021, 78, 4713–4733. [Google Scholar] [CrossRef]
  37. Battaglin, F.; Jayachandran, P.; Strelez, C.; Lenz, A.; Algaze, S.; Soni, S.; Lo, J.H.; Yang, Y.; Millstein, J.; Zhang, W.; et al. Neurotransmitter signaling: A new frontier in colorectal cancer biology and treatment. Oncogene 2022, 41, 4769–4778. [Google Scholar] [CrossRef]
  38. Zhang, L.; Yang, L.; Jiang, S.; Yu, M. Nerve dependence in colorectal cancer. Front. Cell Dev. Biol. 2022, 10, 766653. [Google Scholar] [CrossRef]
  39. Liu, J.; Lang, G.; Shi, J. Epigenetic regulation of PDX-1 in type 2 diabetes mellitus. Diabetes Metab. Syndr. Obes. 2021, 14, 431–442. [Google Scholar] [CrossRef]
  40. Cheng, H.C.; Chang, T.K.; Su, W.C.; Tsai, H.L.; Wang, J.Y. Narrative review of the influence of diabetes mellitus and hyperglycemia on colorectal cancer risk and oncological outcomes. Transl. Oncol. 2021, 14, 101089. [Google Scholar] [CrossRef]
Figure 1. Workflow overview. This workflow illustrates the integrated analysis of matched DNA methylation and RNA expression sample data, incorporating pre-processing, differential analysis, genomic annotation, functional enrichment, and data visualization to identify methylation-regulated genes.
Genes 16 00620 g001
Figure 2. Principal component analysis (PCA) of colorectal cancer samples illustrating distinct clustering patterns between cancerous and normal tissues. Cancer samples exhibit greater dispersion, reflecting heterogeneity, whereas normal samples form a more compact, homogeneous cluster. (a) PCA plot of rectal cancer methylation samples. (b) PCA plot of rectal cancer expression samples. (c) PCA plot of colon cancer methylation samples. (d) PCA plot of colon cancer expression samples.
Genes 16 00620 g002
Figure 3. Combined visualization of rectal cancer methylation and expression analyses. (a) Volcano plot of rectal cancer methylation analysis. (b) Volcano plot of rectal cancer expression analysis. (c) Karyogram showing DMRs with significant methylation changes. (d) Heatmap of the top 50 differentially expressed genes.
Genes 16 00620 g003
Figure 4. Combined visualization of colon cancer methylation and expression analyses. (a) Volcano plot of colon cancer methylation analysis. (b) Volcano plot of colon cancer expression analysis. (c) Karyogram showing DMRs with significant methylation changes. (d) Heatmap of the top 50 differentially expressed genes.
Genes 16 00620 g004
Figure 5. Pathway enrichment analysis of methylation-regulated genes.
Genes 16 00620 g005
Figure 6. Gene network analysis highlighting relevant gene clusters and pathways.
Genes 16 00620 g006
Figure 7. Kaplan Meier Survival Analysis. (a) Survival analysis of PDX1 expression level across cohorts with rectal cancer (b) Survival analysis of GNG1 expression level across cohorts with rectal cancer (c) Survival analysis of PDX1 expression level across cohorts with colon cancer (d) Survival analysis of GNG7 expression level across cohorts with colon cancer.
Genes 16 00620 g007
Table 1. Methylation Regulated genes identified from combined colorectal cancer analysis.
RC MRGs
GenelogFC (Expr)AveExpr (Expr)t (Expr)p.Value (Expr)Adj.P.Val (Expr)B (Expr)Up- or DownregulationHyper- or Hypomethylation
GNG7−2.026334.84152−5.95184 9.20 × 10 5 0.044561.72179DownHypo
HKDC13.600535.908766.04456 8.04 × 10 5 0.041501.84160UpHypo
AZGP13.602732.1037610.7325 3.33 × 10 7 0.002556.29499UpHypo
ALG1L3.058631.815747.23563 1.58 × 10 5 0.020283.25665UpHypo
PITX23.707352.942346.50273 4.21 × 10 5 0.033762.41281UpHyper
PDX14.373603.777357.36968 1.33 × 10 5 0.018713.40209UpHyper
CRC MRGs
WNT24.33366−0.089317.87975 2.10 × 10 9 2.69 × 10 6 11.45417UpHyper
UNC5C−1.797962.91492−7.67632 3.86 × 10 9 3.52 × 10 6 10.87752DownHyper
CLDN13.600332.979427.62796 4.46 × 10 9 3.88 × 10 6 10.73974UpHypo
GNG7−2.202292.97970−7.24621 1.41 × 10 8 7.11 × 10 6 9.64326DownHypo
EPHX42.89609−0.177797.23503 1.46 × 10 8 7.16 × 10 6 9.61091UpHypo
PDPN2.039583.267376.94714 3.50 × 10 8 1.10 × 10 5 8.77430UpHyper
TRHDE−1.748391.34963−6.77779 5.88 × 10 8 1.33 × 10 5 8.27887DownHyper
CPNE5−1.315923.69191−6.64090 8.95 × 10 8 1.67 × 10 5 7.87689DownHyper
VWC2−1.58839−0.61997−6.47318 1.50 × 10 7 2.00 × 10 5 7.38269DownHyper
COL4A12.225047.580716.44237 1.65 × 10 7 2.01 × 10 5 7.29174UpHyper
Table 2. Functional pathways of MRGs.
SourceTerm NameTerm ID−log10 pIntersect
GO:MFextracellular matrix structural constituentGO:00052013.552410
GO:MFsignaling receptor activityGO:00380233.181329
GO:MFDNA-binding transcription activator activity...GO:00012282.192314
GO:BPsystem developmentGO:004873116.361675
GO:BPnervous system developmentGO:000739914.033257
GO:BPneurogenesisGO:00220088.629340
GO:BPneuron differentiationGO:00301826.502433
GO:BPenzyme-linked receptor protein signaling pathwayGO:00071674.530224
GO:BPresponse to growth factorGO:00708484.076820
GO:BPextracellular matrix organizationGO:00301983.366013
GO:BPmorphogenesis of an epitheliumGO:00020092.686915
GO:BPepithelium developmentGO:00604292.558824
GO:BPneuromuscular processGO:00509052.52019
GO:BPionotropic glutamate receptor signaling pathwayGO:00352351.69124
GO:BPepithelial tube morphogenesisGO:00605621.614411
GO:BPcell adhesionGO:00071551.526425
KEGGNeuroactive ligand-receptor interactionKEGG:040803.507714
KEGGWnt signaling pathwayKEGG:043102.69359
KEGGPathways in cancerKEGG:052001.738214
KEGGCell adhesion moleculesKEGG:045141.43207
KEGGProteoglycans in cancerKEGG:052051.38308
Disclaimer/Publisher’s Note: The statements, opinions and data contained in all publications are solely those of the individual author(s) and contributor(s) and not of MDPI and/or the editor(s). MDPI and/or the editor(s) disclaim responsibility for any injury to people or property resulting from any ideas, methods, instructions or products referred to in the content.

