
Association of CETP, APOA5, IL6, and PON1 Gene Variants with Dyslipidemia and Cardiovascular Risk in a Population from Cauca Department, Colombia


Abstract
1. Introduction
2. Materials and Methods
2.1. Study Design and Population
2.2. Inclusion and Exclusion Criteria
- Between 40 and 69 years old.
- Working-age individuals.
- Provided informed consent for genetic, clinical, and paraclinical analysis.
- Individuals under 40 years of age.
- Individuals with incomplete data on key variables.
- Pregnant women or individuals with severe chronic illnesses (e.g., cancer, autoimmune diseases) that might confound the analysis.
2.3. Data Collection
2.4. Cardiovascular Risk Factor Measurements
2.5. Statistical Analysis and Data Visualization
2.6. Data Visualization
3. Results
3.1. Patient Demographics
3.2. Clinical Characteristics
3.3. Multivariable Logistic Regression Analysis
3.4. Genetic Associations
3.4.1. Genotypic Distribution
3.4.2. Association with Lipid Levels
3.4.3. Association Between CETP Genotype and Lipid Indices
3.4.4. Association Between CETP Genotype and Dyslipidemia
3.4.5. Evaluation of Lipid Levels by Polymorphism Using Non-Parametric Tests
4. Discussion
4.1. Main Findings
Biological Mechanisms of APOA5_rs 662799 and Dyslipidemia
4.2. Comparison with Other Studies

| Study (Author, Year) | Population | Location | Sample Size (n) | Genes/Polymorphisms Investigated | Study Design/Type | Age (Mean/Range) | Key Outcomes |
|---|---|---|---|---|---|---|---|
| Rios et al. (2010) [46] | Patients undergoing coronary angiography (African- and Caucasian-Brazilians) | Brazil | 667 (253 African; 414 Caucasian) | IL-1B (-511C > T) and IL-6 (-174G/C) | Case–control study | Not specified | In African-Brazilians, IL-1B-511CC and IL-6-174GG genotypes independently predicted CAD risk. |
| Vinueza et al. (2010) [40] | General adult population assessed for dyslipidemia (CARMELA study) | Multiple Latin American cities (e.g., Barquisimeto, Bogotá, Buenos Aires, Lima, Mexico City, Quito, Santiago) | 11,550 (aggregated across cities) | Lipid profile assessment (no specific genes) | Cross-sectional, population-based | 25–64 years (adults) | High prevalence of dyslipidemia with low HDL-C and high triglycerides; significant between-city variability. |
| Giraldo et al. (2012) [42] | Patients with coronary artery disease | Quindío, Colombia | 559 | CETP polymorphisms (TaqIB, MspI, RsaI) and CETP activity | Case–control study | Not specified | No significant association between CETP activity/polymorphisms and the degree of coronary obstruction. |
| Suárez-Sánchez et al. (2016) [47] | School-aged children (5–14 years) | Mexico (urban settings, recreational facilities) | 1559 | APOA5 (rs662799) and APOA1 (rs5072) | Cross-sectional study (with meta-analysis component) | 5–14 years | Significant association between APOA5/APOA1 variants and elevated triglyceride levels, indicating genetic influence on lipid levels. |
| Carranza Alva et al. (2017) [18] | Clinically healthy adults | Junín district, Peru | 79 | PON1 Q192R | Descriptive, cross-sectional | Not specified (adults) | Genotype distribution: QQ 13.9%, QR 45.6%, RR 40.5; high frequency of 192R allele; no association with lipid profile or APOA1 levels. |
| Siller-López et al. (2017) [13] | Coffee harvesters (occupational group potentially exposed to pesticides) | Central Colombia (Coffee Belt) | 205 | PON1 Q192R (rs662) | Cross-sectional occupational study | Not specified | PON1 Q192R genotype frequencies: QQ 38%, QR 44%, RR 18%; association of the 192Q allele with increased hypertension risk and overall cardiovascular risk. |
| Ponte-Negretti et al. (2017) [41] | General adult population (data aggregated from multiple surveys) | Latin America (various cities) | Data from ~11,550 participants (CARMELA) | Atherogenic dyslipidemia profile (lipid fractions) | Consensus review and epidemiological analysis | 25–64 years (adults) | Reported high prevalence of atherogenic dyslipidemia (low HDL-C and high triglycerides) across Latin American cities; provided recommendations for diagnosis/treatment. |
| Moreno-Godínez et al. (2019) [20] | Adults with cardiovascular risk factors | Various regions, Mexico | ~480 | PON1 (L55M and Q192R polymorphisms) | Cross-sectional study | Not specified | Demonstrated associations between PON1 variants and paraoxonase activity; significant correlations with cardiovascular risk factors. |
| Corredor-Orlandelli et al. (2021) [12] | Patients with acute coronary syndrome (ACS) | Central Colombia (e.g., Bogotá) | 163 patients (cases) with controls from gnomAD (n = 17,711) | PON1 Q192R (rs662) | Retrospective case–control study | Not specified (adults) | Found that the 192R allele was associated with lower CAD risk under a dominant model (OR 0.58; 95% CI 0.42–0.8; p < 0.01); no association with platelet reactivity under clopidogrel treatment. |
| Rai et al. (2021) [43] | Diverse global populations (meta-analysis; focus on ancestral subgroups) | Global (various ancestral groups) | 51,213 (CAD endpoint); 6807 (IL-6 levels endpoint) | IL6-174 G/C (rs1800795) | Systematic review and meta-analysis | Not applicable | Overall significant association between IL6-174 G/C and CAD, mainly driven by Asian/Asian-Indian groups; “C” allele carriers had higher IL-6 levels. |
| Rodríguez-Gutiérrez et al. (2023) [45] | Biochemical, clinical, and genetic characteristics of Mexican patients with primary hypertriglyceridemia, including the first case of hyperchylomicronemia syndrome due to GPIHBP1 deficiency | Jalisco, Mexico | 58 | APOA5, GPIHBP1, LMF1, LPL | Cross-sectional study with genetic sequencing | Mean age ~37.5 years (variable among groups) | Detailed biochemical–clinical–genetic characterization of primary hypertriglyceridemia; identified 74 variants; first Mexican case of hyperchylomicronemia syndrome due to GPIHBP1 deficiency. |
| Puerto-Baracaldo et al. (2024) [44] | Adults with severe hypertriglyceridemia (sHTG) | Multiple regions in Colombia (Bogotá, Bucaramanga, Medellín, Manizales) | 166 participants (62% male) | LPL, APOC2, APOA5, GPIHBP1, LMF1 | Cross-sectional genetic sequencing study | Mean age: 50.0 ± 14.1 years | Identified 92 genetic variants; 18 were novel. Pathogenic and likely pathogenic variants found primarily in LMF1. Genetic variation in LMF1 significantly associated with sHTG. Highest ever triglyceride levels, significantly higher among participants with a history of pancreatitis (4317 mg/dL) compared to those without pancreatitis (1769 mg/dL). Suggests that genetic variants, particularly in LMF1, play an important role in the pathogenesis of sHTG in Colombian populations. |
| This study (2025) | Adults with and without dyslipidemia | Cauca, Colombia | 304 | CETP, APOA5, IL6, PON1 | Cross-sectional observational study with multivariable logistic regression | Median age 52 years (IQR = 13) | Found dyslipidemia to be associated with higher BMI and altered lipid profiles; significant differences in CETP genotype distribution between groups, although CETP variants did not independently predict dyslipidemia risk. |
4.3. Clinical Implications
Public Health and Preventive Perspective
4.4. Limitations and Strengths
5. Conclusions
Author Contributions
Funding
Institutional Review Board Statement
Informed Consent Statement
Data Availability Statement
Acknowledgments
Conflicts of Interest
References
- Di Cesare, M.; Perel, P.; Taylor, S.; Kabudula, C.; Bixby, H.; Gaziano, T.A.; McGhie, D.V.; Mwangi, J.; Pervan, B.; Narula, J.; et al. The Heart of the World. Glob. Heart 2024, 19, 11. [Google Scholar] [CrossRef] [PubMed]
- Rivera-Andrade, Á.; Luna, M.A. Trends and Heterogeneity of Cardiovascular Disease and Risk Factors across Latin American and Caribbean Countries. Prog. Cardiovasc. Dis. 2014, 57, 276–285. [Google Scholar] [PubMed]
- Du, Z.; Qin, Y. Dyslipidemia and Cardiovascular Disease: Current Knowledge, Existing Challenges, and New Opportunities for Management Strategies. J. Clin. Med. 2023, 12, 363. [Google Scholar] [CrossRef] [PubMed]
- Lopez-Jaramillo, P.; Joseph, P.; Lopez-Lopez, J.P.; Lanas, F.; Avezum, A.; Diaz, R.; Camacho, P.A.; Seron, P.; Oliveira, G.; Orlandini, A.; et al. Risk Factors, Cardiovascular Disease, and Mortality in South America: A PURE Substudy. Eur. Heart J. 2022, 43, 2841–2851. [Google Scholar] [CrossRef]
- López-Jaramillo, P.; Lopez-Lopez, J.P.; Cohen, D.D.; Alarcon-Ariza, N.; Mogollon-Zehr, M. Epidemiology of Hypertension and Diabetes Mellitus in Latin America. Curr. Hypertens. Rev. 2020, 17, 112–120. [Google Scholar] [CrossRef]
- López, C.Z.; Santacruz, J.D.C.; Giraldo, C.D.R.; Palma, B.E.P.; Saa, P.A.C. Factors Associated with Cardiovascular Risk in High School Students of a Public School in the City of Santiago de Cali, Colombia. Rev. Cienc. Salud 2020, 18, 24–36. [Google Scholar]
- Camacho, P.A.; Otero, J.; Pérez, M.; Arcos, E.G.; García, H.; Narváez, C.; Molina, D.I.; Sánchez, G.; Duran, M.; Cure, C.C.; et al. The Spectrum of the Dyslipidemia in Colombia: The PURE Study. Int. J. Cardiol. 2019, 284, 111–117. [Google Scholar]
- Patiño-Villada, F.A.; Arango-Vélez, E.F.; Quintero-Velásquez, M.A.; Arenas-Sosa, M.M. Cardiovascular Risk Factors in an Urban Colombia Population. Rev. Salud Publica 2011, 13, 433–445. [Google Scholar]
- Zambrano, A.K.; Cadena-Ullauri, S.; Guevara-Ramírez, P.; Paz-Cruz, E.; Tamayo-Trujillo, R.; Ruiz-Pozo, V.A.; Doménech, N.; Ibarra-Rodríguez, A.A.; Gaviria, A. The Autosomal Short Tandem Repeat Polymorphisms Are Potentially Associated with Cardiovascular Disease Predisposition in the Latin American Population: A Mini Review. BioMed Res. Int. 2023, 2023, 6152905. [Google Scholar] [CrossRef]
- Sotos-Prieto, M.; Frances, F.V.L.; Corella, D. Impacto de La Apolipoproteína A5 En El Riesgo Cardiovascular. Modulaciones Genéticas y Ambientales. Rev. Med. Chil. 2010, 138, 868–880. [Google Scholar]
- Merriman, T.R. Application of Genetic Epidemiology to CETP (Cholesteryl Ester Transfer Protein) Concentration and Risk of Cardiovascular Disease. Circ. Genomic Precis. Med. 2018, 11, e002138. [Google Scholar] [CrossRef] [PubMed]
- Corredor-Orlandelli, D.; Sambracos-Parrado, S.; Mantilla-García, S.; Tovar-Tirado, J.; Vega-Ramírez, V.; Mendoza-Ayús, S.D.; Peña, L.C.; Leal, M.F.; Rodríguez-Carrillo, J.; León-Torres, J.; et al. Association between Paraoxonase-1 p.Q192R Polymorphism and Coronary Artery Disease Susceptibility in the Colombian Population. Vasc. Health Risk Manag. 2021, 17, 689–699. [Google Scholar] [CrossRef]
- Siller-López, F.; Garzón-Castaño, S.C.; Ramos-Márquez, M.E.; Hernández-Cañaveral, I.I. Association of Paraoxonase-1 Q192R (Rs662) Single Nucleotide Variation with Cardiovascular Risk in Coffee Harvesters of Central Colombia. J. Toxicol. 2017, 2017, 6913106. [Google Scholar] [CrossRef]
- Mudd-Martin, G.; Cirino, A.L.; Barcelona, V.; Fox, K.; Hudson, M.; Sun, Y.V.; Taylor, J.Y.; Cameron, V.A. Considerations for Cardiovascular Genetic and Genomic Research with Marginalized Racial and Ethnic Groups and Indigenous Peoples: A Scientific Statement from the American Heart Association. Circ. Genomic Precis. Med. 2021, 14, 547–558. [Google Scholar] [CrossRef] [PubMed]
- Chappell, E.; Arbour, L.; Laksman, Z. The Inclusion of Underrepresented Populations in Cardiovascular Genetics and Epidemiology. J. Cardiovasc. Dev. Dis. 2024, 11, 56. [Google Scholar] [CrossRef]
- Durrington, P.N.; Bashir, B.; Soran, H. Paraoxonase 1 and Atherosclerosis. Front. Cardiovasc. Med. 2023, 10, 1065967. [Google Scholar] [CrossRef]
- Darand, M.; Salehi-Abargouei, A.; Vahidi Mehrjardi, M.Y.; Feizi, A.; Seyedhossaini, S.M.; Askari, G. The Association of the Paraoxonase 1 Q192R Polymorphism with Coronary Artery Disease (CAD) and Cardiometabolic Risk Factors in Iranian Patients Suspected of CAD. Front. Cardiovasc. Med. 2022, 9, 1037940. [Google Scholar] [CrossRef]
- Carranza Alva, E.; Suasnábar, C.P.; Carranza, A.F. Distribución Del Polimorfismo Q192R Del Gen de La Paraoxonasa 1 En Una Población Del Distrito de Junín (Región Junín, Perú). Horiz. Méd. 2017, 17, 30–37. [Google Scholar] [CrossRef]
- Fridman, O.; Gariglio, L.; Rivière, S.; Porcile, R.; Fuchs, A.G.; Potenzoni, M.A. Paraoxonase 1 Gene Polymorphisms and Enzyme Activities in Coronary Artery Disease and Its Relationship to Serum Lipids and Glycemia. Arch. Cardiol. Mex. 2016, 86, 350–357. [Google Scholar] [CrossRef]
- Moreno-Godinez, M.E.; Galarce-Sosa, C.; Cahua-Pablo, J.Á.; Rojas-García, A.E.; Huerta-Beristain, G.; Alarcón-Romero, L.d.C.; Cruz, M.; Valladares-Salgado, A.; Antonio-Véjar, V.; Ramírez-Vargas, M.A.; et al. Genotypes of Common Polymorphisms in the PON1 Gene Associated with Paraoxonase Activity as Cardiovascular Risk Factor. Arch. Med. Res. 2018, 49, 486–496. [Google Scholar] [CrossRef]
- Ochoa-Martínez, Á.C.; Araiza-Gamboa, Y.; Varela-Silva, J.A.; Orta-García, S.T.; Carrizales-Yáñez, L.; Pérez-Maldonado, I.N. Effect of Gene-Environment Interaction (Arsenic Exposure—PON1 Q192R Polymorphism) on Cardiovascular Disease Biomarkers in Mexican Population. Environ. Toxicol. Pharmacol. 2020, 81, 103519. [Google Scholar] [CrossRef]
- Miller, S.A.; Dykes, D.D.; Polesky, H.F. A Simple Salting out Procedure for Extracting DNA from Human Nucleated Cells. Nucleic Acids Res. 1988, 16, 1215. [Google Scholar] [CrossRef] [PubMed]
- Brajkovic, I.; Komosar-Cvetkovic, M.; Kuzet Miokovic, I. Cardiovascular Risk Factors in a Healthy Population in the Croatian Centre for Cardiac Rehabilitation. Eur. J. Cardiovasc. Nurs. 2022, 21, zvac060.043. [Google Scholar] [CrossRef]
- 2019 ESC/EAS Guidelines for the Management of Dyslipidaemias: Lipid Modification to Reduce Cardiovascular Risk. Atherosclerosis 2019, 290, 140–205. [CrossRef] [PubMed]
- Echeverri, D.; León-Galindo, J.; Barón, A.; Anchique, C.V.; Aristizábal, D.; Aristizábal, J.M.; Benítez, L.M.; Bohórquez, R.; Carreño, M.; Escobar, A.; et al. EDITOR JEFE/EDITOR IN CHIEF. Colombian Consensus on the Diagnosis and Treatment of Dyslipidemias in Adults Revista Colombiana de Cardiología. Volumen 31 Suplemento 4, 2024. Available online: https://rccardiologia.com/portadas/rcc_24_31_supl-4.pdf (accessed on 26 April 2025).
- Saqlain, M.; Khalid, M.; Fiaz, M.; Saeed, S.; Mehmood Raja, A.; Mobeen Zafar, M.; Fatima, T.; Bosco Pesquero, J.; Maglio, C.; Valadi, H.; et al. Risk Variants of Obesity Associated Genes Demonstrate BMI Raising Effect in a Large Cohort. PLoS ONE 2022, 17, e0274904. [Google Scholar] [CrossRef] [PubMed]
- Ferreira, C.N.; Carvalho, M.G.; Fernandes, A.P.; Santos, I.R.; Rodrigues, K.F.; Lana, A.M.Q.; Almeida, C.R.; Loures-Vale, A.A.; Gomes, K.B.; Sousa, M.O. The Polymorphism -1131T>C in Apolipoprotein A5 Gene Is Associated with Dyslipidemia in Brazilian Subjects. Gene 2013, 516, 171–175. [Google Scholar] [CrossRef]
- Martin, A.; Lang, S.; Goeser, T.; Demir, M.; Steffen, H.-M.; Kasper, P. Management of Dyslipidemia in Patients with Non-Alcoholic Fatty Liver Disease. Curr. Atheroscler. Rep. 2022, 24, 533–546. [Google Scholar] [CrossRef]
- Butnariu, L.I.; Gorduza, E.V.; Țarcă, E.; Pânzaru, M.-C.; Popa, S.; Stoleriu, S.; Lupu, V.V.; Lupu, A.; Cojocaru, E.; Trandafir, L.M.; et al. Current Data and New Insights into the Genetic Factors of Atherogenic Dyslipidemia Associated with Metabolic Syndrome. Diagnostics 2023, 13, 2348. [Google Scholar] [CrossRef]
- May-Zhang, L.S.; Liu, M.; Black, D.D.; Tso, P. Apolipoprotein A5, a Unique Modulator of Fasting and Postprandial Triglycerides. Biochim. Biophys. Acta Mol. Cell Biol. Lipids 2022, 1867, 159185. [Google Scholar] [CrossRef]
- Pennacchio, L.A.; Olivier, M.; Hubacek, J.A.; Cohen, J.C.; Cox, D.R.; Fruchart, J.C.; Krauss, R.M.; Rubin, E.M. An Apolipoprotein Influencing Triglycerides in Humans and Mice Revealed by Comparative Sequencing. Science 2001, 294, 169–173. [Google Scholar] [CrossRef]
- De Caterina, R.; Talmud, P.J.; Merlini, P.A.; Foco, L.; Pastorino, R.; Altshuler, D.; Mauri, F.; Peyvandi, F.; Lina, D.; Kathiresan, S.; et al. Strong Association of the APOA5-1131T>C Gene Variant and Early-Onset Acute Myocardial Infarction. Atherosclerosis 2011, 214, 397–403. [Google Scholar] [CrossRef]
- Hubacek, J.A. Apolipoprotein A5 Fifteen Years Anniversary: Lessons from Genetic Epidemiology. Gene 2016, 592, 193–199. [Google Scholar] [CrossRef] [PubMed]
- Stankov, S.; Vitali, C.; Park, J.; Nguyen, D.V.; Englander, S.W.; Phillips, M.C.; Hand, N.J.; Rader, D.J. Abstract 121: Exploiting Natural Genetic Variation In The Human Triglyceride Regulator APOA5 To Understand Its Function. Arterioscler. Thromb. Vasc. Biol. 2021, 41. [Google Scholar] [CrossRef]
- Ibi, D.; Boot, M.; Dollé, M.E.T.; Jukema, J.W.; Rosendaal, F.R.; Christodoulides, C.; Neville, M.J.; Koivula, R.; Rensen, P.C.N.; Karpe, F.; et al. Apolipoprotein A-V Is a Potential Target for Treating Coronary Artery Disease: Evidence from Genetic and Metabolomic Analyses. J. Lipid Res. 2022, 63, 100193. [Google Scholar] [CrossRef]
- Dron, J.S.; Hegele, R.A. Genetics of Triglycerides and the Risk of Atherosclerosis. Curr. Atheroscler. Rep. 2017, 19, 31. [Google Scholar] [CrossRef]
- Guardiola, M.; Cofán, M.; Castro-Orós, I.D.; Cenarro, A.; Plana, N.; Talmud, P.J.; Masana, L.; Ros, E.; Civeira, F.; Ribalta, J. APOA5 Variants Predispose Hyperlipidemic Patients to Atherogenic Dyslipidemia and Subclinical Atherosclerosis. Atherosclerosis 2015, 240, 98–104. [Google Scholar] [CrossRef] [PubMed]
- Ramos-Lopez, O.; Martinez, J.A.; Milagro, F.I. Holistic Integration of Omics Tools for Precision Nutrition in Health and Disease. Nutrients 2022, 14, 4074. [Google Scholar] [CrossRef]
- Kang, M.; Sung, J. A Genome-Wide Search for Gene-by-Obesity Interaction Loci of Dyslipidemia in Koreans Shows Diverse Genetic Risk Alleles. J. Lipid Res. 2019, 60, 2090–2101. [Google Scholar] [CrossRef]
- Vinueza, R.; Boissonnet, C.P.; Acevedo, M.; Uriza, F.; Benitez, F.J.; Silva, H.; Schargrodsky, H.; Champagne, B.; Wilson, E. Dyslipidemia in Seven Latin American Cities: CARMELA Study. Prev. Med. 2010, 50, 106–111. [Google Scholar] [CrossRef]
- Ponte-Negretti, C.I.; Isea-Pérez, J.; Lanas, F.; Medina, J.; Gómez-Mancebo, J.; Morales, E.; Acevedo, M.; Pirskorz, D.; Machado, L.; Lozada, A.; et al. Dislipidemia Aterogénica En Latinoamérica: Prevalencia, Causas y Tratamiento. Un Consenso. Rev. Mex. De Cardiol. 2017, 28, 57–85. [Google Scholar]
- Giraldo, A.M.; Loango, N.; Castaño, H.; Landázuri, P. Actividad de la proteína transportadora de ésteres de colesterol. Polimorfismos del gen en pacientes colombianos con enfermedad coronaria. Rev. Colomb. Cardiol. 2012, 19, 172–179. [Google Scholar] [CrossRef]
- Rai, H.; Colleran, R.; Cassese, S.; Joner, M.; Kastrati, A.; Byrne, R.A. Association of Interleukin 6-174 G/C Polymorphism with Coronary Artery Disease and Circulating IL-6 Levels: A Systematic Review and Meta-Analysis. Inflamm. Res. 2021, 70, 1075–1087. [Google Scholar] [CrossRef] [PubMed]
- Puerto-Baracaldo, K.; Amaya-Montoya, M.; Parra-Serrano, G.; Prada-Robles, D.C.; Serrano-Gómez, S.; Restrepo-Giraldo, L.M.; Fragozo-Ramos, M.C.; Tangarife, V.; Giraldo-González, G.C.; Builes-Barrera, C.A.; et al. Genetic Variants in Triglyceride Metabolism Genes among Individuals with Hypertriglyceridemia in Colombia. J. Clin. Lipidol. 2024, 18, e1074–e1085. [Google Scholar] [CrossRef] [PubMed]
- Rodríguez-Gutiérrez, P.G.; Colima-Fausto, A.G.; Zepeda-Olmos, P.M.; Hernández-Flores, T.D.J.; González-García, J.R.; Magaña-Torres, M.T. Biochemical, Clinical, and Genetic Characteristics of Mexican Patients with Primary Hypertriglyceridemia, Including the First Case of Hyperchylomicronemia Syndrome Due to GPIHBP1 Deficiency. Int. J. Mol. Sci. 2022, 24, 465. [Google Scholar] [CrossRef]
- Rios, D.L.S.; Cerqueira, C.C.S.; Bonfim-Silva, R.; Araújo, L.J.; Pereira, J.F.; Gadelha, S.R.; Barbosa, A.A.L. Interleukin-1 β and Interleukin-6 Gene Polymorphism Associations with Angiographically Assessed Coronary Artery Disease in Brazilians. Cytokine 2010, 50, 292–296. [Google Scholar] [CrossRef]
- Suárez-Sánchez, F.; Klunder-Klunder, M.; Valladares-Salgado, A.; Gómez-Zamudio, J.; Peralta-Romero, J.; Meyre, D.; Burguete-García, A.; Cruz, M. APOA5 and APOA1 Polymorphisms Are Associated with Triglyceride Levels in Mexican Children. Pediatr. Obes. 2017, 12, 330–336. [Google Scholar] [CrossRef]
- Salcedo-Cifuentes, M.; Belalcazar, S.; Acosta, E.Y.; Medina-Murillo, J.J. Conventional Biomarkers for Cardiovascular Risks and Their Correlation with the Castelli Risk Index-Indices and Tg/Hdl-c. Arch. Med. Manizales 2019, 20, 11–22. [Google Scholar] [CrossRef]
- Majanović, S.K.; Peloza, O.C.; Detel, D.; Jovanović, G.K.; Bakula, M.; Rahelić, D.; Mance, T.C.; Šoić Vranić, T.; Cvek, S.Z. Dyslipidemia: Current Perspectives and Implications for Clinical Practice. In Management of Dyslipidemia; IntechOpen: London, UK, 2021. [Google Scholar]
- Berberich, A.J.; Hegele, R.A. A Modern Approach to Dyslipidemia. Endocr. Rev. 2022, 43, 611–653. [Google Scholar] [CrossRef]
- Zaid, M.; Ameer, F.; Munir, R.; Rashid, R.; Farooq, N.; Hasnain, S.; Zaidi, N. Anthropometric and Metabolic Indices in Assessment of Type and Severity of Dyslipidemia. J. Physiol. Anthropol. 2017, 36, 19. [Google Scholar] [CrossRef]
- Barbosa, L.G.; Chaves, O.C.; Ribeiro, R.d.C.L. Anthropometric and Body Composition Parameters to Predict Body Fat Percentage and Lipid Profile in Schoolchildren. Rev. Paul. Pediatr. 2012, 30, 520–528. [Google Scholar]
- Hanh, N.T.M.; Nhung, B.T.; Hop, L.T.; Tuyết, L.T.; Dao, D.T.A.; Thu, N.T.T.; Binh, T.Q. The APOA5-Rs662799 Polymorphism Is a Determinant of Dyslipidemia in Vietnamese Primary School Children. Lipids 2020, 55, 683–691. [Google Scholar] [CrossRef] [PubMed]
- Figorilli, F.; Mannarino, M.R.; Sahebkar, A.; Pirro, M. Lipid Profile Screening and ASCVD Prevention. Expert Rev. Cardiovasc. Ther. 2023, 21, 463–471. [Google Scholar] [CrossRef] [PubMed]
- Vellakkal, S.; Khan, Z.; Alavani, H.; Fledderjohann, J.; Stuckler, D. Effects of Public Policies in the Prevention of Cardiovascular Diseases: A Systematic Review of Global Literature. Public Health 2022, 207, 73–81. [Google Scholar] [CrossRef] [PubMed]
- Mahboob, M. Addressing the Public Health Crisis of Dyslipidemia. J. Cardiovasc. Dis. 2024, 19, 107. [Google Scholar] [CrossRef]
- Srisawasdi, P.; Rodcharoen, P.; Vanavanan, S.; Chittamma, A.; Sukasem, C.; Nakorn, C.N.; Dejthevaporn, C.; Kroll, M.H. Association of CETP Gene Variants with Atherogenic Dyslipidemia Among Thai Patients Treated with Statin. Pharmacogenom. Pers. Med. 2021, 14, 1–13. [Google Scholar] [CrossRef]
- Leite, J.M.R.S.; Pereira, J.L.; Damasceno, N.R.T.; Soler, J.M.P.; Fisberg, R.M.; Rogero, M.M.; Sarti, F.M. Association of Dyslipidemia with Single Nucleotide Polymorphisms of the Cholesteryl Ester Transfer Protein Gene and Cardiovascular Disease Risk Factors in a Highly Admixed Population. Clin. Nutr. ESPEN 2023, 58, 242–252. [Google Scholar] [CrossRef]
- Yu, C.; Bakshi, A.; Watts, G.F.; Renton, A.E.; Fulton-Howard, B.; Goate, A.M.; Natarajan, P.; Chasman, D.I.; Robman, L.D.; Woods, R.L.; et al. Genome-Wide Association Study of Cardiovascular Resilience Identifies Protective Variation in the CETP Gene. J. Am. Heart Assoc. Cardiovasc. Cerebrovasc. Dis. 2023, 12, e031459. [Google Scholar] [CrossRef]

| Variable | Non-Dyslipidemia Group (n = 116) | With Dyslipidemia (n = 188) | Total (n = 304) | p-Value | Statistic |
|---|---|---|---|---|---|
| Age (Years) (Median ± IQR) | 51.0 ± 12 | 53 ± 14 | 52 ± 13 | 0.858 | U Mann–Whitney |
| BMI (kg/m2) (Median ± IQR) | 25.4 ± 5.4 | 26.6 ± 6.2 | 26.1 ± 6.1 | 0.035 | U Mann–Whitney |
| Systolic Pressure (Median ± IQR) | 140 ± 40 | 135 ± 30 | 140 ± 30 | 0.026 | U Mann–Whitney |
| Diastolic Pressure (Median ± IQR) | 80 ± 10 | 80 ± 10 | 80 ± 10 | 0.132 | U Mann–Whitney |
| Glycemia (Median ± IQR) | 99.0 ± 21.5 | 99.0 ± 25 | 99.0 ± 23.0 | 0.402 | U Mann–Whitney |
| Cholesterol (Median ± IQR) | 186 ± 27 | 256.5 ± 96 | 200 ± 95.0 | <0.001 | U Mann–Whitney |
| HDL (Median ± IQR) | 49 ± 11 | 40 ± 14 | 43 ± 12.0 | <0.001 | U Mann–Whitney |
| VLDL (Median ± IQR) | 28 ± 4.0 | 33.5 ± 14.8 | 30.0 ± 9.0 | <0.001 | U Mann–Whitney |
| Body Fat Percentage (Median ± IQR) | 27.0 ± 8.3 | 28.8 ± 7.3 | 28.3 ± 7.8 | 0.014 | U Mann–Whitney |
| Sex (Female) (n, %) | 61 (54.3%) | 102 (52.6%) | 163 (53.6%) | 0.777 | Chi-squared |
| Sex (Male) (n, %) | 55 (47.4%) | 86 (45.7%) | 141 (46.4%) | ||
| Ethnicity (n, %) | Mestizo: 72 (62.1%) | Mestizo: 131 (72.9%) | 209 (68.8%) | 0.013 | Chi-squared |
| White: 31 (26.7%) | White: 25 (13.3%) | 56 (18.4%) | |||
| Afro-descendant: 13 (11.2%) | Afro-descendant: 26 (13.8%) | 39 (12.8%) | |||
| Origin (n, %) | Urban: 86 (74.1%) | Urban: 144 (76.6%) | 230 (75.7%) | 0.628 | Chi-squared |
| Rural: 30 (25.9%) | Rural: 44 (23.4%) | 74 (24.3%) | |||
| In a Relationship (n, %) | Yes 71 (61.2%) | Yes 105 (55.9%) | 176 (57.9%) | 0.358 | Chi-squared |
| No: 45 (38.8%) | No: 83 (44.1%) | 128 (42.1%) | |||
| Educational Level (n, %) | Secondary and technical education: 88 (75.9%) | Secondary and technical education: 117 (62.2%) | 205 (67.4%) | 0.014 | Chi-squared |
| Professional: 28 (24.1%) | Professional: 71 (37.8%) | 99 (32.6%) | |||
| Hypertension (n, %) | Yes 107 (92.2%) | Yes 171 (91%) | 278 (91.4%) | 0.697 | Chi-squared |
| No: 9 (7.8%) | No: 17 (9%) | 26 (8.6%) | |||
| Diabetes (n, %) | Yes 30 (25.9%) | Yes 50 (26.6%) | 80 (26.3%) | 0.888 | Chi-squared |
| No: 86 (74.1%) | No: 138 (73.4%) | 224 (73.7%) | |||
| Smokers (n, %) | Yes 70 (60.3%) | Yes 105 (55.9%) | 175 (57.6%) | 0.441 | Chi-squared |
| No: 46 (39.7%) | No: 83 (44.1%) | 129 (42.4%) | |||
| Drinkers (n, %) | Yes 1 (0.9%) | Yes 5 (2.7%) | 6 (2%) | 0.274 | Chi-squared |
| No: 115 (99.1%) | No: 183 (97.3%) | 298 (98%) |
| (A) | |||||
|---|---|---|---|---|---|
| Variables | Standard Error | OR | Wald | 95% CI (Lower–Upper) | p-Value |
| BMI (kg/m2) | 0.069 | 1.064 | 0.808 | 0.929–1.219 | 0.369 |
| Systolic Pressure | 0.008 | 1.011 | 1.985 | 0.996–1.026 | 0.159 |
| Cholesterol | 0.005 | 0.966 | 42.927 | 0.956–0.976 | <0.001 |
| HDL | 0.021 | 1.077 | 12.540 | 1.033–1.121 | <0.001 |
| Triglycerides | 0.443 | 7.84 | 21.57 | 3.289–18.708 | <0.001 |
| LDL | 0.502 | 3.723 | 6.850 | 1.391–9.963 | 0.009 |
| VLDL | 0.025 | 0.909 | 15.007 | 0.866–0.954 | <0.001 |
| Plasma Atherogenic Index (AIP) (TG/HDLc) | 1.61 | 1.865 | 0.288 | 0.192–18.143 | 0.591 |
| Castelli II Index = LDL/HDL Men | 0.632 | 13.722 | 17.160 | 3.974–47.378 | <0.001 |
| Castelli II Index = LDL/HDL Women | 0.404 | 16.786 | 48.718 | 7.603–37060 | <0.001 |
| Body Fat Percentage | 0.048 | 0.980 | 0.180 | 0.893–1.076 | 0.671 |
| Ethnicity | 0.644 | 3.237 | 0.073 | 0.917–11.428 | 0.068 |
| Educational Level | 0.385 | 1.422 | 0.835 | 0.668–3.024 | 0.361 |
| (B) | |||||
| Predictor | OR | 95% CI | p-Value | ||
| Total Cholesterol | 0.944 | 0.919–0.970 | <0.001 | ||
| HDL | 0.651 | 0.472–0.898 | 0.009 | ||
| Triglycerides | 2.568 | 1.734–3.804 | <0.001 | ||
| LDL | 1.015 | 0.954–1.079 | 0.643 | ||
| VLDL | 0.878 | 0.795–0.971 | 0.011 | ||
| AIP | ~ 0.000 | 0.000–0.195 | 0.013 | ||
| Castelli II Men | 0.282 | 0.021–3.745 | 0.337 | ||
| Castelli II Women | 0.066 | 0.002–2.351 | 0.136 | ||
| CETP rs3764261 (CA vs. CC) | 125.695 | 0.191–82,713.866 | 0.144 | ||
| CETP rs3764261 (AA vs. CC) | 19.733 | 0.027–14,512.118 | 0.376 | ||
| APOA5 rs662799 (AG vs. AA) | 68.776 | 0.137–34,569.115 | 0.182 | ||
| APOA5 rs662799 (GG vs. AA) | 187.290 | 0.371–94,447.467 | 0.099 | ||
| PON1 Q192R (QR vs. RR) | 5.158 | 0.123–216,509 | 0.390 | ||
| PON1 Q192R (QQ vs. RR) | 3.039 | 0.060–153,669 | 0.579 | ||
| IL6 rs1800796 (GC vs. GG) | 0.023 | 0.000–14,703 | 0.251 | ||
| IL6 rs1800796 (CC vs. GG) | 0.064 | 0.000–50,292 | 0.420 | ||
| (C) | |||||
| Predictor | OR | 95% CI | p-Value | ||
| Percentage Body Fat | 0.973 | 0.851–1.112 | 0.683 | ||
| Body Mass Index (kg/m2) | 1.131 | 0.931–1.374 | 0.215 | ||
| VLDL (mg/dL) | 0.908 | 0.857–0.962 | 0.001 | ||
| HDL (mg/dL) | 1.122 | 1.063–1.184 | <0.001 | ||
| Total Cholesterol (mg/dL) | 0.951 | 0.933–0.969 | <0.001 | ||
| Ethnicity (Mestizo vs. Reference) | 1.796 | 0.395–8.176 | 0.449 | ||
| Ethnicity (Afro-Descendant vs. Reference) | 8.973 | 1.376–58.495 | 0.022 | ||
| Educational Level (Sec./Tech. vs. Prof.) | 1.245 | 0.433–3.582 | 0.684 | ||
| Systolic Blood Pressure (mm Hg) | 1.018 | 0.997–1.041 | 0.099 | ||
| Triglycerides (mg/dL) | 1.522 | 1.355–1.709 | <0.001 | ||
| Variable | Non-Dyslipidemia (n = 116) | With Dyslipidemia (n = 188) | Total (n = 304) | p-Value | Statistic |
|---|---|---|---|---|---|
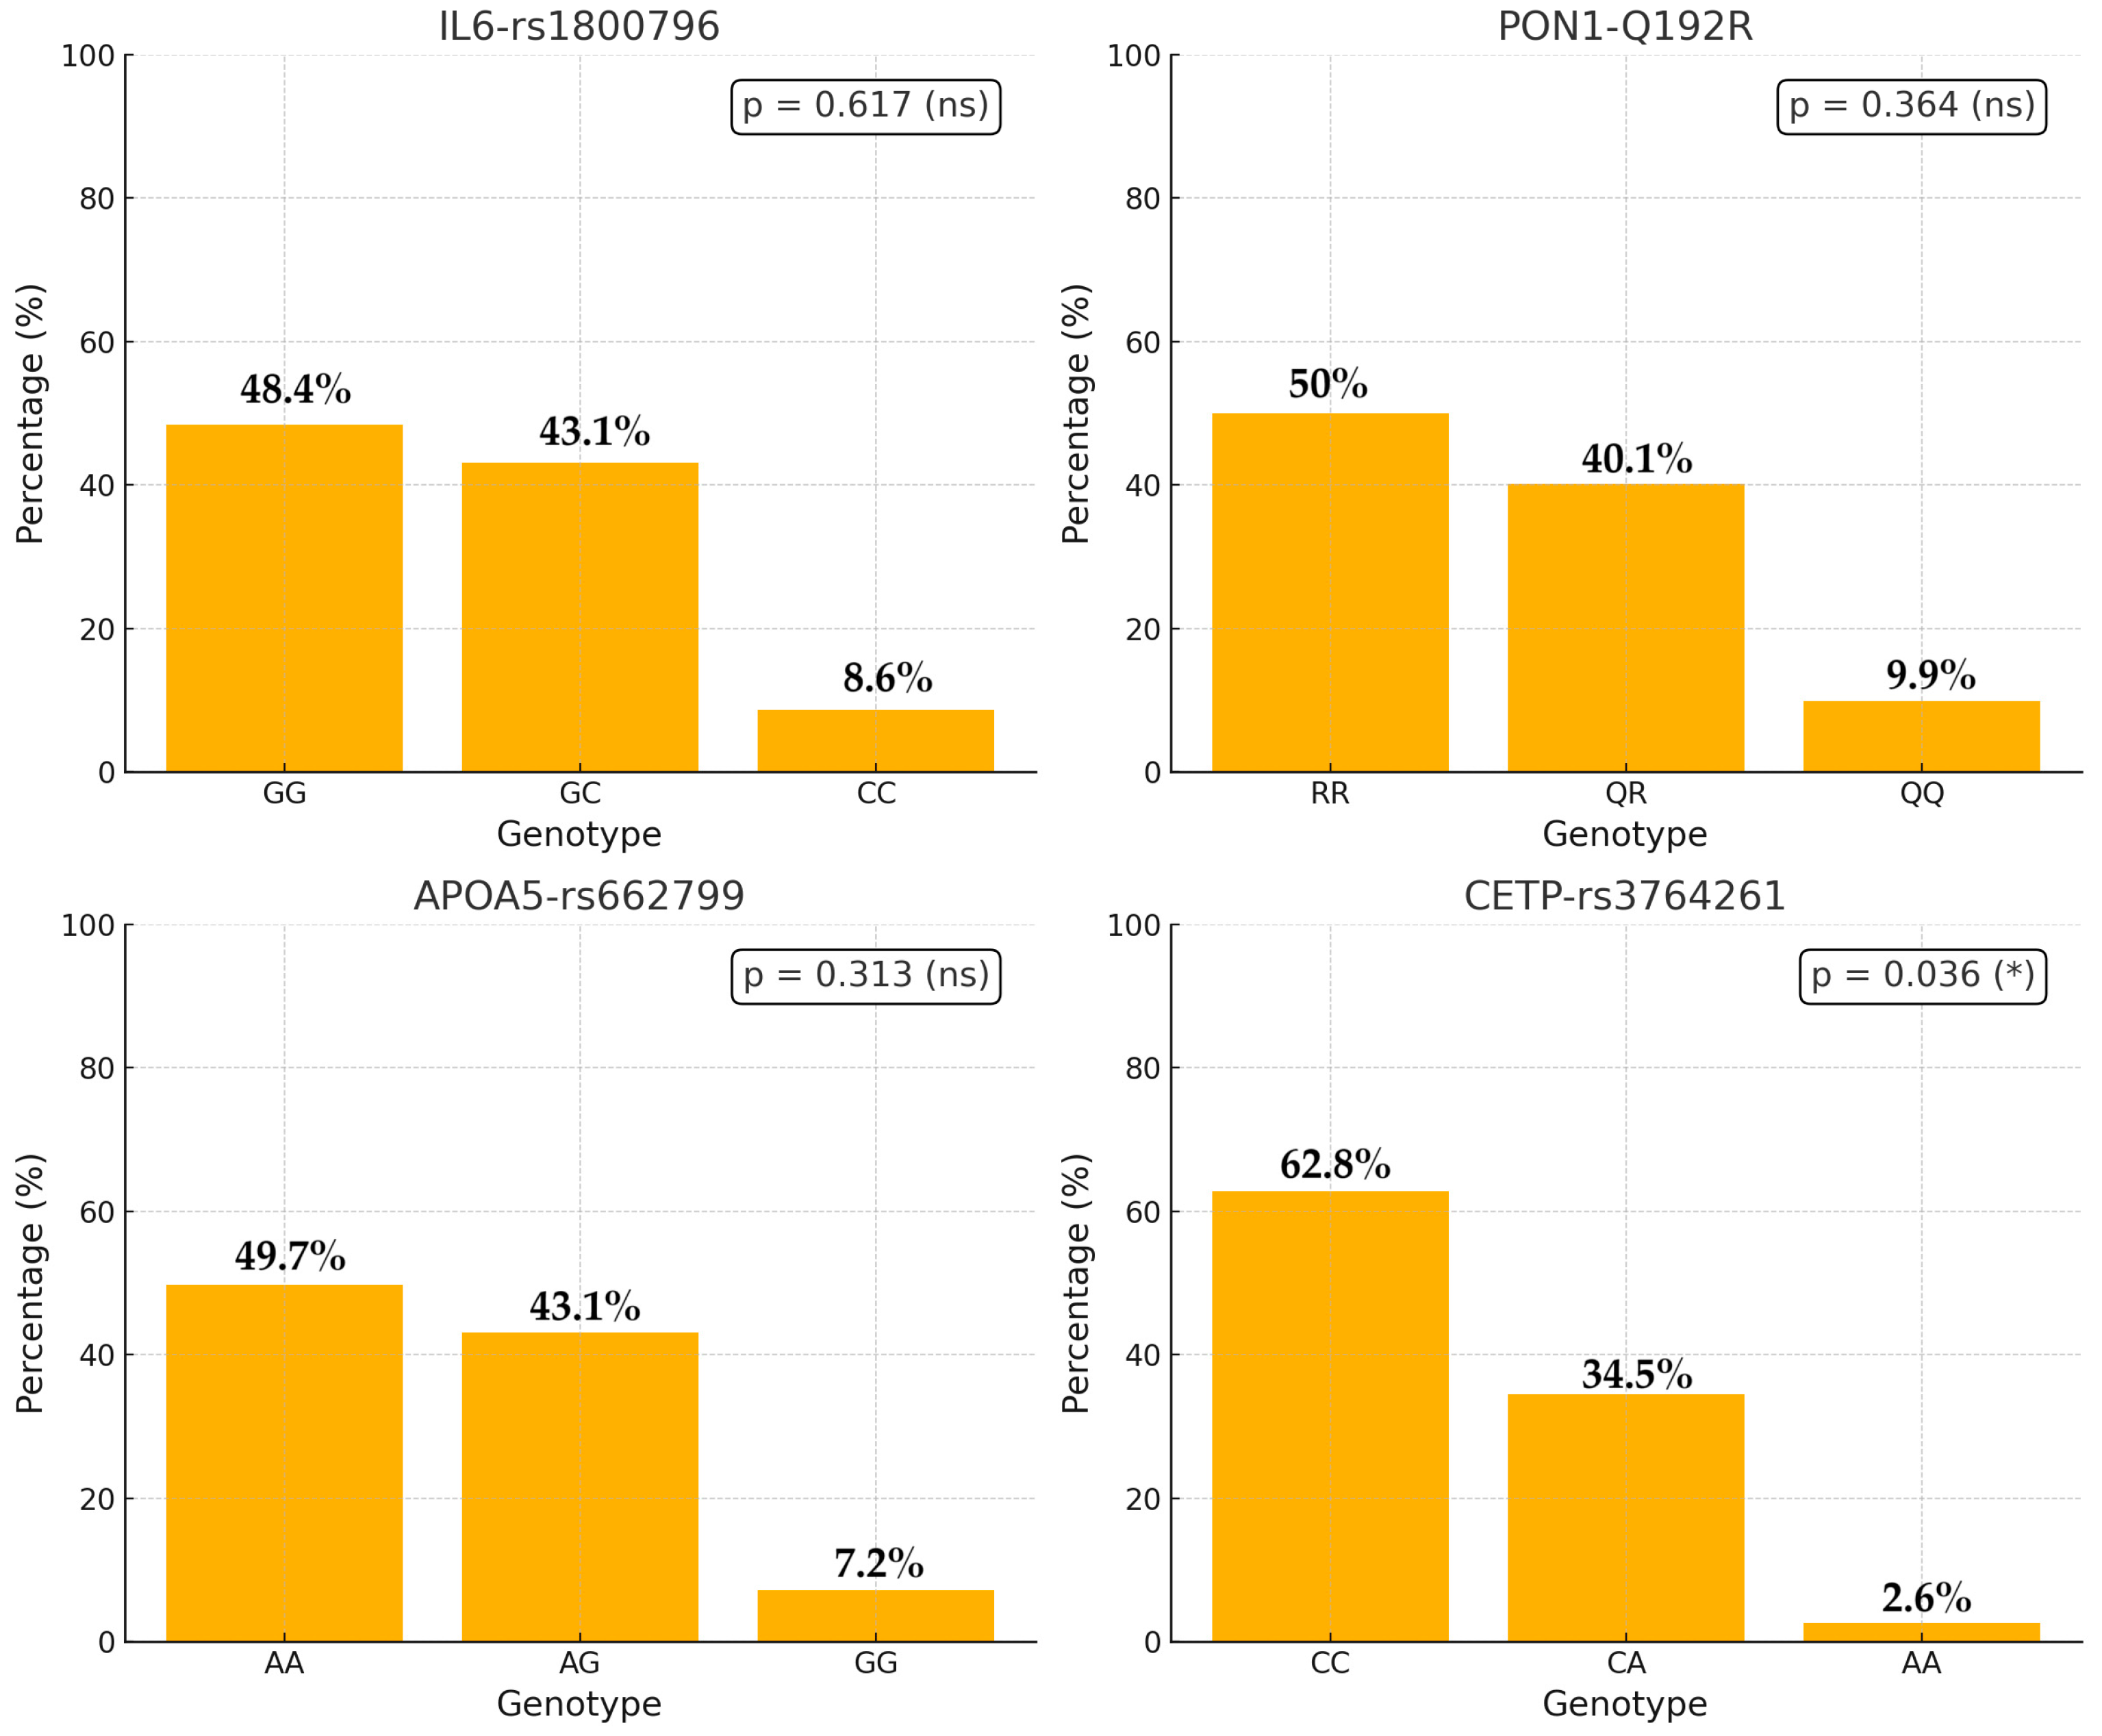
| IL6_rs 1800796 (n, %) | GG: 52 (44.8%) | GG: 95 (50.5%) | 147 (48.4%) | 0.617 | Chi-squared |
| GC: 53 (45.7%) | GC: 78 (41.5%) | 131 (43.1%) | |||
| CC: 11 (9.5%) | CC: 15 (8.0%) | 26 (8.6%) | |||
| PON1_Q192R (n, %) | RR: 64 (55.2%) | RR: 88 (46.8%) | 152 (50%) | 0.364 | Chi-squared |
| QR: 42 (36.2%) | QR: 80 (42.6%) | 122 (40.1%) | |||
| QQ: 10 (8.6%) | QQ: 20 (10.6%) | 30 (9.9%) | |||
| APOA5_rs 662799 (n, %) | AA: 64 (55.2%) | AA: 87 (46.3%) | 151 (49.7%) | 0.313 | Chi-squared |
| AG: 45 (38.8%) | AG: 86 (45.7%) | 131 (43.1%) | |||
| GG 7 (6.0%) | GG: 15 (8.0%) | 22 (7.2%) | |||
| CETP (n, %) | CC: 83 (71.6%) | CC: 108 (57.4%) | 191 (62.8%) | 0.036 | Chi-squared |
| CA: 31 (26.7%) | CA: 74 (39.4%) | 105 (34.5%) | |||
| AA: 2 (1.7%) | AA: 6 (3.2%) | 8 (2.6%) |
| SNP/Genotype | HDL Level | Male n (%) | Female n (%) | p-Value |
|---|---|---|---|---|
| IL6-rs1800796 (GG) | Low | 58 (69.9) | 13 (20.3) | <0.001 |
| High | 25 (30.1) | 51 (79.7) | ||
| IL6-rs1800796 (CC) | Low | 28 (57.1) | 22 (26.8) | <0.001 |
| High | 21 (42.9) | 60 (73.2) | ||
| IL6-rs1800796 (GC) | Low | 7 (77.8) | 3 (17.6) | 0.003 |
| High | 2 (22.2) | 14 (82.4) | ||
| PON1-Q192R (RR) | Low | 33 (58.9) | 26 (27.1) | <0.001 |
| High | 23 (41.1) | 70 (72.9) | ||
| PON1-Q192R (QQ) | Low | 54 (71.1) | 8 (17.4) | <0.001 |
| High | 22 (28.9) | 38 (82.6) | ||
| PON1-Q192R (QR) | Low | 6 (66.7) | 4 (19.0) | 0.011 |
| High | 3 (33.3) | 17 (81.0) | ||
| APOA5-rs662799 (AA) | Low | 34 (59.6) | 30 (31.9) | <0.001 |
| High | 23 (40.4) | 64 (68.1) | ||
| APOA5-rs662799 (GG) | Low | 55 (70.5) | 7 (13.2) | <0.001 |
| High | 23 (29.5) | 46 (86.8) | ||
| APOA5-rs662799 (AG) | Low | 4 (66.7) | 1 (6.2) | 0.003 |
| High | 2 (33.3) | 15 (93.8) | ||
| CETP-rs3764261 (CC) | Low | 50 (63.3) | 28 (25.0) | <0.001 |
| High | 29 (36.7) | 84 (75.0) | ||
| CETP-rs3764261 (CA) | Low | 38 (70.4) | 10 (19.6) | <0.001 |
| High | 16 (29.6) | 41 (80.4) | ||
| CETP-rs3764261 (AA) | Low | 5 (62.5) | – | <0.001 |
| High | 3 (37.5) | – |
| CETP Genotype | Standard Error | OR | Wald | 95% CI (Lower–Upper) | p-Value |
|---|---|---|---|---|---|
| CC (Reference) | - | 1 | - | - | - |
| AA | 0.748 | 1.604 | 0.399 | 0.370–6.950 | 0.528 |
| CA | 0.759 | 1.200 | 0.058 | 0.271–5.313 | 0.810 |
| CETP Genotype | Standard Error | OR | Wald | 95% CI (Lower–Upper) | p-Value |
|---|---|---|---|---|---|
| CC (Reference) | - | 1 | - | - | - |
| AA | 0.722 | 0.399 | 0.155 | 0.183–3.097 | 0.752 |
| CA | 0.737 | 0.479 | 0.998 | 0.113–2.031 | 0.479 |
| CETP Genotype | Standard Error | OR | Wald | 95% CI (Lower–Upper) | p-Value |
|---|---|---|---|---|---|
| CC (Reference) | - | 1 | - | - | - |
| AA | 0.829 | 2.306 | 1.014 | 0.454–11.717 | 0.314 |
| CA | 0.844 | 1.257 | 0.073 | 0.240–6.572 | 0.787 |
| Polymorphism | Variable | Kruskal–Wallis H | gl | p-Value |
|---|---|---|---|---|
| IL6_rs 1800796 (n, %) | Cholesterol | 0.005 | 2 | 0.997 |
| HDL | 0.804 | 2 | 0.669 | |
| VLDL | 1.017 | 2 | 0.601 | |
| PON1_Q192R (n, %) | Cholesterol | 0.129 | 2 | 0.937 |
| HDL | 0.259 | 2 | 0.879 | |
| VLDL | 2.992 | 2 | 0.224 | |
| APOA5_rs662799 (n, %) | Cholesterol | 1.641 | 2 | 0.44 |
| HDL | 2.336 | 2 | 0.311 | |
| VLDL | 11.675 | 2 | 0.003 | |
| CETP_rs3764261 (n, %) | Cholesterol | 1.141 | 2 | 0.565 |
| HDL | 0.153 | 2 | 0.927 | |
| VLDL | 3.472 | 2 | 0.176 |
| Comparison | p-Value (Mann–Whitney U) | Significant (α = 0.0167) |
|---|---|---|
| AA vs. GG | 0.07 | No |
| AA vs. AG | 0.001 | Yes |
| GG vs. AG | 0.029 | No |
Disclaimer/Publisher’s Note: The statements, opinions and data contained in all publications are solely those of the individual author(s) and contributor(s) and not of MDPI and/or the editor(s). MDPI and/or the editor(s) disclaim responsibility for any injury to people or property resulting from any ideas, methods, instructions or products referred to in the content. |
© 2025 by the authors. Licensee MDPI, Basel, Switzerland. This article is an open access article distributed under the terms and conditions of the Creative Commons Attribution (CC BY) license (https://creativecommons.org/licenses/by/4.0/).
Share and Cite
Urbano-Cano, A.L.; Álvarez-Rosero, R.E.; Liscano, Y. Association of CETP, APOA5, IL6, and PON1 Gene Variants with Dyslipidemia and Cardiovascular Risk in a Population from Cauca Department, Colombia. Genes 2025, 16, 545. https://doi.org/10.3390/genes16050545
Urbano-Cano AL, Álvarez-Rosero RE, Liscano Y. Association of CETP, APOA5, IL6, and PON1 Gene Variants with Dyslipidemia and Cardiovascular Risk in a Population from Cauca Department, Colombia. Genes. 2025; 16(5):545. https://doi.org/10.3390/genes16050545
Chicago/Turabian StyleUrbano-Cano, Astrid Lorena, Rosa Elvira Álvarez-Rosero, and Yamil Liscano. 2025. "Association of CETP, APOA5, IL6, and PON1 Gene Variants with Dyslipidemia and Cardiovascular Risk in a Population from Cauca Department, Colombia" Genes 16, no. 5: 545. https://doi.org/10.3390/genes16050545
APA StyleUrbano-Cano, A. L., Álvarez-Rosero, R. E., & Liscano, Y. (2025). Association of CETP, APOA5, IL6, and PON1 Gene Variants with Dyslipidemia and Cardiovascular Risk in a Population from Cauca Department, Colombia. Genes, 16(5), 545. https://doi.org/10.3390/genes16050545