Article

Genome-Wide Identification and Phylogenetic Characterization of the FTIP Gene Family in Maize (Zea mays)

1
Hubei Hongshan Laboratory, National Key Laboratory of Crop Genetic Improvement, Huazhong Agricultural University, Wuhan 430070, China
2
Zhejiang Academy of Agricultural Sciences, Institute of Maize and Featured Upland Crops, Hangzhou 310015, China
3
National Key Laboratory of Wheat Breeding, College of Life Sciences, Shandong Agricultural University, Taian 271018, China
*
Authors to whom correspondence should be addressed.
These authors contributed equally to this work.
Genes 2025, 16(5), 539; https://doi.org/10.3390/genes16050539
Submission received: 25 March 2025 / Revised: 22 April 2025 / Accepted: 25 April 2025 / Published: 30 April 2025
(This article belongs to the Section Plant Genetics and Genomics)

Abstract

:
The maize FT-interacting protein (FTIP) gene family represents a group of multiple C2 domain and transmembrane proteins (MCTPs), characterized by their unique structural motifs and membrane-spanning regions., plays crucial roles in intercellular communication and stress responses. Here, we systematically characterized 27 ZmFTIP genes unevenly distributed across 10 maize chromosomes. Phylogenetic analysis with rice, soybean, and Arabidopsis homologs revealed five evolutionary clades with monocot-specific conservation patterns. Promoter cis-element profiling identified hormone-responsive (ABA, JA, auxin) and stress-related motifs, corroborated by differential expression under abiotic stresses and phytohormone treatments. Notably, ZmFTIP18 and ZmFTIP25 showed sustained upregulation under cadmium exposure, while ZmFTIP13 exhibited downregulation. Synteny analysis demonstrated strong conservation with monocot FTIPs, suggesting ancient evolutionary origins. This comprehensive study provides foundational insights into ZmFTIP functional diversification and potential biotechnological applications.

1. Introduction

Plants regulate the position and developmental information of plant cell division and differentiation by transducing signals through receptor-like kinases or transmitting transcription factors [1]. This communication is essential for plant growth and development to respond to internal and external signals and is regulated by intracellular and extracellular transport pathways [2]. In order to conduct signal transduction more smoothly, plants have evolved a complex endomembrane system that effectively separates signal molecules and promotes the transport of protein and RNA macromolecules between endomembrane compartments [3].
Recent studies have found that highly conserved multi-C2 domain and transmembrane region proteins (MCTPs) are key signal molecules that mediate the transport of regulatory substances in plant cells [4]. These proteins contain 3–4 C2 domains at the N-terminus and 1– 4 transmembrane regions at the C-terminus. As a eukaryotic lipid-binding domain, the C2 domain can target the intracellular membrane [5]. In membrane transporters, different C2 domains carry unique conserved sequences and achieve specific cellular functions in a synergistic manner rather than simply superimposed [6].
In the genome of Arabidopsis thaliana, 16 MCTP genes have been identified, of which two members, QUIRKY (QKY) and FT-interacting protein 1 (AtFTIP1), have been shown to be involved in the transport of macromolecules [7,8,9]. Specifically, QKY regulates plant organ development by interacting with the leucine-rich repeat-containing receptor-like kinase STRUBBELIG (SUB) [9]. On the other hand, AtFTIP1 is anchored on the endoplasmic reticulum (ER) membrane and participates in the transport of florigen FLOWERINGLOCUST (FT) from companion cells to sieve tube cells, thereby regulating the flowering timing of Arabidopsis thaliana [8]. AtMCTP3, AtMCTP4, and AtMCTP6 control auxin response factors (ARFs) to determine lateral root development [10]. AtFTIP3 and AtFTIP4 prevent the intracellular trafficking of the key regulator SHOOTMERISTEMLESS (STM) from peripheral shoot meristem region cells to the PM and play an important role in mediating Arabidopsis shoot stem cell proliferation and differentiation [11]. In rice (Oryza sativa), 13 MCTP genes have been identified [12]; OsFTIP1, an ortholog of AtFTIP1, regulates rice flowering time by regulating the transport of rice florigen RICEFLOWERINGLOCUST1 from companion cells to sieve tubes [13]; OsFTIP7 is a factor in auxin-mediated anther dehiscence [14]. In addition, abscisic acid and jasmonic acid hormone treatment changed the transcription level of OsFTIP in rice [12].
Under drought stress conditions, the expression of OsFTIP1 is downregulated, allowing OsMFT1 to translocate into the nucleus. There, it modulates the expression of drought-resistance genes by regulating OsMYB26 (a negative regulator) and OsbZIP66 (a positive regulator) [15]. Using virus-induced gene silencing (VIGS) system to silence GhMCTP gene expression in cotton, GhMCTP7, GhMCTP12, and GhMCTP17 were found to play important roles in bud meristem development [16].
Previous studies have identified 17 members of the MCIP gene family in maize [17]. A carbohydrate partitioning defective 33 (cpd33) mutant has been identified. This gene encodes a protein containing multiple C2 domains and transmembrane regions, which results in excessive carbohydrate accumulation in leaves. Its potential function might involve facilitating the symplastic movement of sucrose within the phloem [18]. In summary, members of the maize FTIP gene family may play a role in regulating maize flowering and coping with various biotic and abiotic stresses. However, the identification, evolution, expression pattern, and function of maize FTIP gene family members are not completely clear.
In maize research, 27 FTIP family members (designated as ZmFTIPs) were characterized through genome-wide screening. Subsequent investigations encompassed multi-dimensional analyses including gene architecture profiling, physical mapping across chromosomes, evolutionary motif conservation assessments, cis-element identification in upstream regulatory sequences, and phylogenetic tree construction for subfamily classification.The expression profiles of ZmFTIP genes in different organs and under different hormone treatments and stress conditions were studied. Synteny analysis of ZmFTIPs and their homologs in rice, Brachypodium, sorghum, barley, soybean, and Arabidopsis. In addition, this study elucidated the expression patterns of ZmFTIPs in maize under various stress conditions, thereby providing theoretical foundations for the potential application of ZmFTIPs in maize improvement.

2. Materials and Methods

2.1. Bioinformatics Analysis of ZmFTIP Family Members

The protein sequences of maize FTIPs were retrieved from the maizeGDB database (Zea mays RefGen_V5). (https://www.maizegdb.org/, accessed on 5 October 2023). Moreover, 27 maize FTIP family members were initially screened using integrated BLAST 2.14.0+, PFM, and motif-based methods. The ExPasy tool (https://web.expasy.org/protparam/, accessed on 5 October 2023) was utilized to predict the physicochemical properties of the ZmFTIP family, including molecular weight, theoretical isoelectric point, hydrophilicity index, and instability index. The subcellular localization of the ZmFTIP family members was predicted using Cell-PLoc 2.0, a web-based tool available at http://www.csbio.sjtu.edu.cn/bioinf/plant-multi/, accessed on 5 October 2023 [19]. ZmFTIPs were designated according to their physical locations on the maize chromosome.

2.2. Reconstruction of the Phylogenetic Tree for ZmFTIPs in Maize

The amino acid sequences of ZmFTIPs were obtained from maize (Zea mays RefGen_V5). After blast treatment of soybeans (Wm82.a4. v6), Arabidopsis (Araport11), rice (Oryza sativa v7.0), Brachypodium (B. distachyon v3.2), barley (H. vulgare r1), poplar (P. trichocarpa v4.1), tomato (S. lycopersicum ITAG4.0), potato (S.tuberosum v6.1), wheat (T. aestivum v2.2), grape (V. vinifera v2.1), the sequences of FTIP family members were retrieved from Phytozome (https://phytozome-next.jgi.doe.gov/, accessed on 5 October 2023). The phylogenetic tree was reconstructed using the MEGA 7.0 (https://www.megasoftware.net, accessed on 5 October 2023) program using the maximum likelihood method with 1000 bootstrap replicates. Bootstrap values are indicated as percentages of major branches [20].
The conserved ZmFTIP motifs were identified and analyzed using the MEME suite (https://meme-suite.org/meme/tools/meme, accessed on 5 October 2023). Additionally, the conserved domains of the ZmFTIP family were characterized through the Batch CD Search tool available on the NCBI website (https://www.ncbi.nlm.nih.gov/Structure/bwrpsb/bwrpsb.cgi, accessed on 5 October 2023).

2.3. Plant Materials and Growth

The Zea mays genotype REFERENCE B73 (B73) was employed for this study. Maize seeds were surface-sterilized using a solution of sodium hypochlorite (100 mL NaClO supplemented with 4.2 mL of 36–38% HCl) for 4 h. The sterilized seeds were then evenly sown in clean, moist quartz sand and cultivated in a controlled growth chamber maintained at 25 °C under a photoperiod of 16 h light/8 h dark for 4 days. Uniformly developed seedlings were subsequently transplanted into a nutrient solution [21]. The nutrient solution was changed every 5 d. Maize seedlings were grown in a hydroponic device for 10 days (d), then the seedlings were treated with25 μM CdCl2, and samples were taken for measurement at 2 h (h) and 24 h, respectively. An appropriate number of roots and leaves were put into liquid nitrogen and quickly stored at −80 °C.

2.4. Cis-Regulatory Element Analysis of ZmFTIPs

For the analysis of cis-regulatory elements, a 2-kb region upstream of the transcription start site was utilized to predict cis-elements in promoter regions using the PlantCARE database (http://bioinformatics.psb.ugent.be/webtools/plantcare/html/, accessed on 5 October 2023). The distribution and composition of cis-elements in ZmFTIPs were visualized using TBtools v1.045 (https://github.com/CJ-Chen/TBtools-II/releases, accessed on 5 October 2023) [22].

2.5. RNA-Seq Database

The expression patterns of ZmFTIPs in maize under various conditions, including different organs, hormonal treatments, low phosphorus (LP), low nitrogen (LN), low zinc (LZn), heavy metal cadmium (Cd) exposure, heat stress, salt stress, drought, and cold stress, were analyzed using data from the Plant Public RNA-Seq database (https://plantrnadb.com, accessed on 5 October 2023) [23].

2.6. Synteny Analysis

The syntenic analysis between maize, including Arabidopsis thaliana, Brachypodium distachyon, Glycine max, Hordeum vulgare, Sorghum bicolor was used One Step McscanX-Super Fast in TBtools [22].

2.7. RNA Extraction, Reverse Transcription, and RT-PCR Analysis

Total RNA was extracted from the leaves and roots of maize using the Unizol Total RNA Extraction Reagent (RE703, Genesand, Beijing, China). Subsequently, the RNA was reverse-transcribed into cDNA using a reverse transcription kit (RK20429, ABclonal, Wuhan, China).
Total RNA extraction and cDNA synthesis were carried out according to the protocol described by Li et al. [24]. cDNA was subjected to qRT-PCR analysis using SYBR Green detection on a 7500 Real-Time PCR System (Thermo Fisher Scientific, Waltham, MA, USA). The qRT-PCR data were normalized using Zea mays ZmTubulin (Zm00001eb390190) as an internal control [25]. All qRT-PCR primer pairs are listed in Table S2.

3. Results

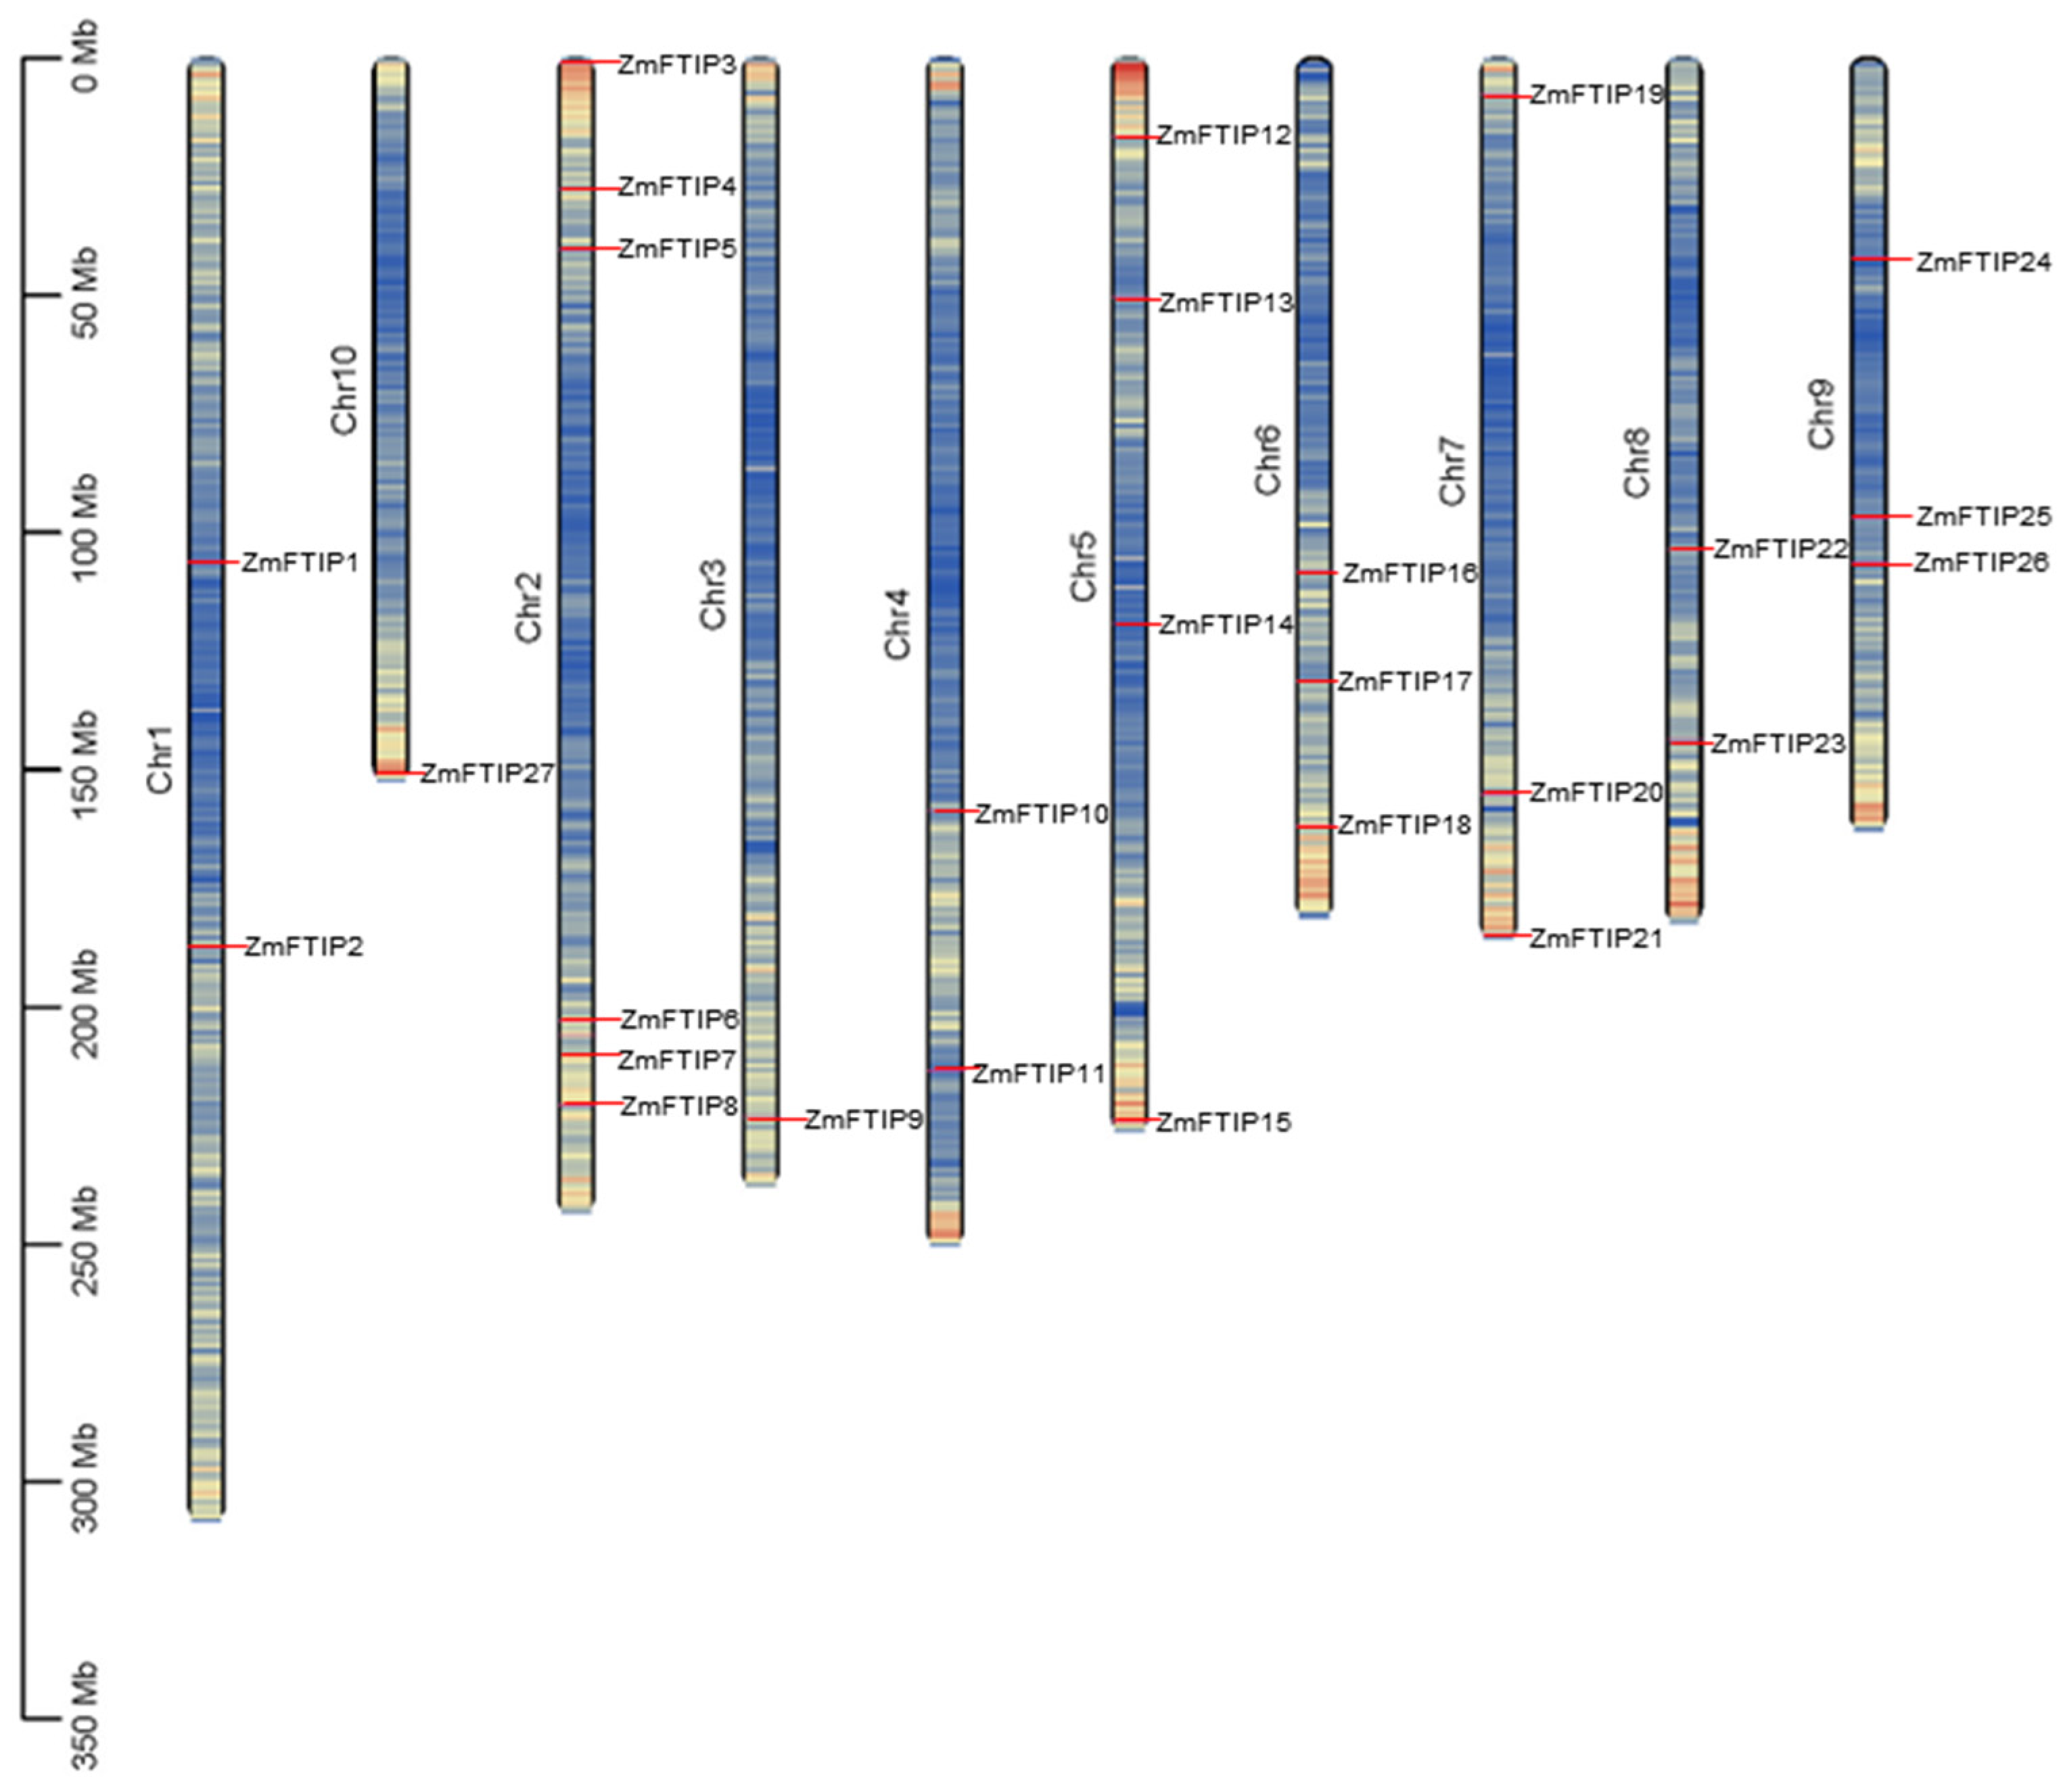
3.1. Identification of ZmFTIP Genes in Maize

In this study, the amino acid sequences of the C2 domain and the C-terminal phosphoribosyl transferase domain FTIP1, which are conserved in Arabidopsis, were used to identify analogs of the maize FTIP1 protein through AMPS and Markov hidden model (MBE). A total of 27 FTIP proteins were found throughout the entire genome of maize. Based on their position on the chromosome, they were named ZmFTIP1 to ZmFTIP27 (Table S1). Characteristics of members of the ZmFTIP protein family, including identity (ID), chromosomal location, coding sequence (CDS) and amino acid sequence length, molecular weight (MW), isoelectric point (pI) of the encoded protein, and predicted subcellular localization are summarized (Table S1). The number of amino acids in ZmFTIP proteins varies from 166 to 1132, with molecular weights ranging from 18 to 124.4 kDa. The theoretical isoelectric points (pI) of all ZmFTIP members range from 4.75 to 10.28. The hydrophilicity coefficients of ZmFTIP family members vary between −0.327 and −0.102, while the instability indices of these proteins range from 25.55 to 62.92 (Table S1).
In order to understand the distribution of ZmFTIPs on the maize genome, we located ZmFTIPs at the exact location on the maize chromosome. However, the 27 ZmFTIPs are not evenly distributed across the 10 chromosomes of maize (Figure 1). One of them, ZmFTIP1 and ZmFTIP2, is located on chromosome 1; ZmFTIP3 to ZmFTIP8 are located on chromosome 2; ZmFTIP9 is located on chromosome 3 alone; ZmFTIP10 and ZmFTIP11 are located on chromosome 4; ZmFTIP12, ZmFTIP13, ZmFTIP14, and ZmFTIP15 are located on chromosome 5; ZmFTIP16, ZmFTIP17, and ZmFTIP18 are located on chromosome 6; ZmFTIP19, ZmFTIP20, and ZmFTIP21 are located on chromosome 7; ZmFTIP22 and ZmFTIP23 are located on chromosome 8; ZmFTIP24, ZmFTIP25, and ZmFTIP26 are located on chromosome 9; and ZmFTIP27 is located on chromosome 10 (Figure 1). This suggests that the complexity and diversity of the ZmFTIPs gene family during evolution may be the result of multiple gene duplications and reconstructions. At the same time, the even distribution of members of the ZmFTIPs gene family on chromosomes may mean that they have certain independence in genetic regulation, each responsible for different physiological functions and metabolic pathways.
The subcellular localisation of ZmFTIPs was predicted using Cell-PLoc 2.0. ZmFTIP1, ZmFTIP3, ZmFTIP5, ZmFTIP6, ZmFTIP7, ZmFTIP8, ZmFTIP9, ZmFTIP10, ZmFTIP17, ZmFTIP19, ZmFTIP22, ZmFTIP24, ZmFTIP25, ZmFTIP26 were located on the cytoplasm; ZmFTIP2, ZmFTIP4, ZmFTIP7, ZmFTIP13, ZmFTIP14, ZmFTIP16, ZmFTIP18, ZmFTIP21, ZmFTIP23, ZmFTIP27 were located on the Cell membrane; ZmFTIP1 and ZmFTIP26 on the cytoplasm, or nucleus; ZmFTIP5, ZmFTIP12, ZmFTIP15, ZmFTIP24 on the chloroplast, or nucleus; ZmFTIP1 on the extra cell or mitochondrion (Table S1). The different subcellular localization of ZmFTIPs may be one of the important mechanisms for organisms to regulate protein functions, adapt to the environment, and maintain normal physiological activities.
To analyze the evolutionary relationships of different FTIP proteins, maize, Arabidopsis, rice, soybean, Brachypodium, poplar, tomato, potato, barley, wheat, and grape were selected. Phylogenetic trees were reconstructed using the maximum likelihood method (Figure 2). The gene IDs, gene names, and protein sequences are detailed in Table S3. The maize FTIP family is divided into five subfamilies (Figure 2). Specifically, ZmFTIP1, ZmFTIP2, ZmFTIP6, ZmFTIP8, ZmFTIP9, ZmFTIP13, ZmFTIP17, ZmFTIP21, and ZmFTIP25 belong to subfamily I; ZmFTIP12, ZmFTIP19, and ZmFTIP23 are grouped into subfamily II; ZmFTIP3, ZmFTIP7, ZmFTIP10, ZmFTIP20, and ZmFTIP27 are classified into subfamily III; ZmFTIP5, ZmFTIP11, ZmFTIP14, and ZmFTIP15 are categorized into subfamily IV; and ZmFTIP4, ZmFTIP16, ZmFTIP18, ZmFTIP22, and ZmFTIP26 are grouped into subfamily V (Figure 2). The distinct positions of ZmFTIP family members across various evolutionary branches suggest divergent genetic relationships among these genes, which may lead to functional differences.
To further understand the functions of ZmFTIPs, conserved motifs and domains were analyzed. ZmFTIPs members mainly contain six conserved motifs (Figure 3A). The results showed that 27 ZmFTIPs contained one conserved motif, 19 ZmFTIPs contained two conserved motifs, and 15 ZmFTIPs contained six motifs (Figure 3A).
The structural characteristics of ZmFTIP proteins have also been investigated. All ZmFTIP proteins contain a C2C domain at their C-terminus and a C2 domain at their N-terminus (Figure 3B). Sequence alignment of ZmFTIPs reveals that the PRT-C domain and the C2 domain near the C-terminus are more conserved compared to the C2 domains located closer to the N-terminus (Figure 3B).
The amino acid sequences of each motif are characterized (Figure 3C). Additionally, the structure of ZmFTIP proteins is analyzed in detail. All ZmFTIP proteins contain a PRT-C domain at their C-terminus and three or four C2 domains at their N-terminus (Figure 3C).

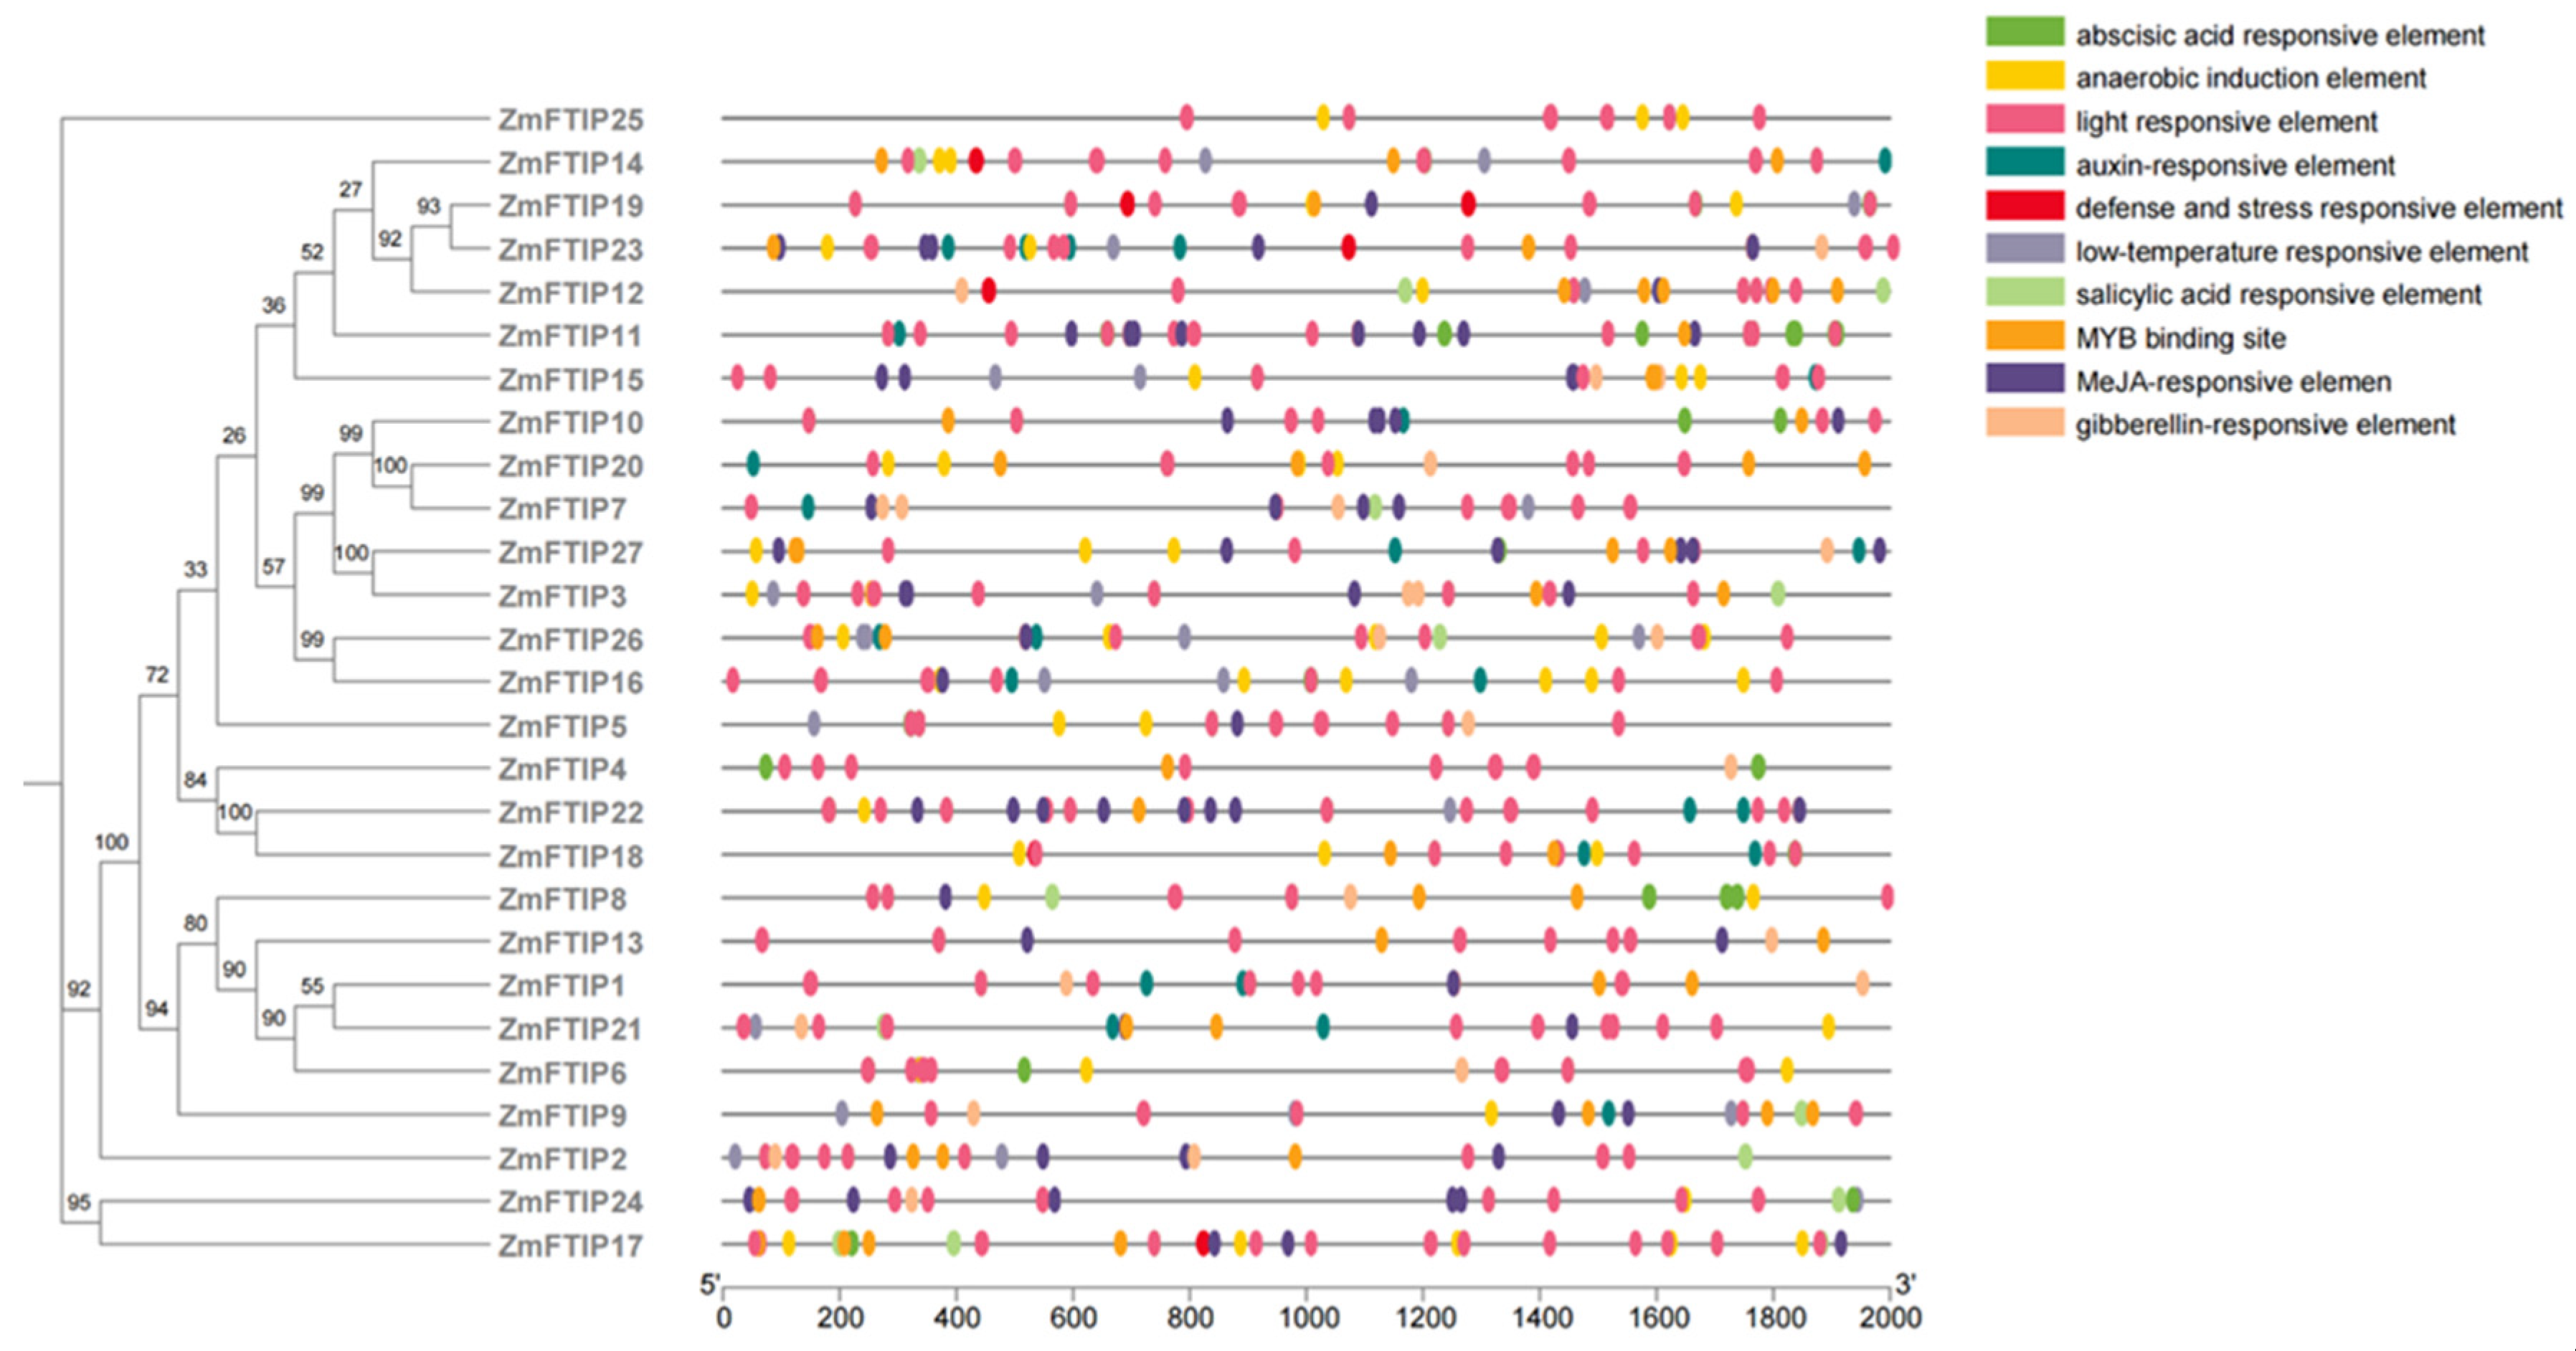
3.2. Cis-Element Analysis of the ZmFTIP Genes in Maize

Promoter activity is essential for regulating gene function [26]. To elucidate the genetic function, metabolic network, and regulatory mechanisms of ZmFTIP, we analyzed the shared cis-elements within its promoter region. The 2000-base-pair upstream sequence of ZmFTIP was designated as the putative promoter. Using PlantCARE, we further investigated the distribution and functions of cis-elements in the ZmFTIP promoter region [27]. Our analysis revealed that the ZmFTIP promoter contains plant activation response elements, including auxin response elements, gibberellin response elements, abscisic acid response elements, and jasmonic acid (JA) response elements (Figure 4).
Auxin-responsive elements such as TGA elements (AACGAC) and AuxRR core (GGTCCAT) are present in 15 ZmFTIP genes (Figure 4). In addition, other plant hormone response elements were identified in the ZmFTIPs promoter region, including gibberellin (P-box; TATC box), JA (TGACG) motifs, abscisic acid (ABRE), and salicylic acid (TCA element). At the same time, we also analyzed that the promoter of the ZmFTIPs gene family mainly contains elements that respond to light, low temperature, and defense (Figure 4). This suggests that ZmFTIPs may play a potential role in plant stress defense and hormone response.

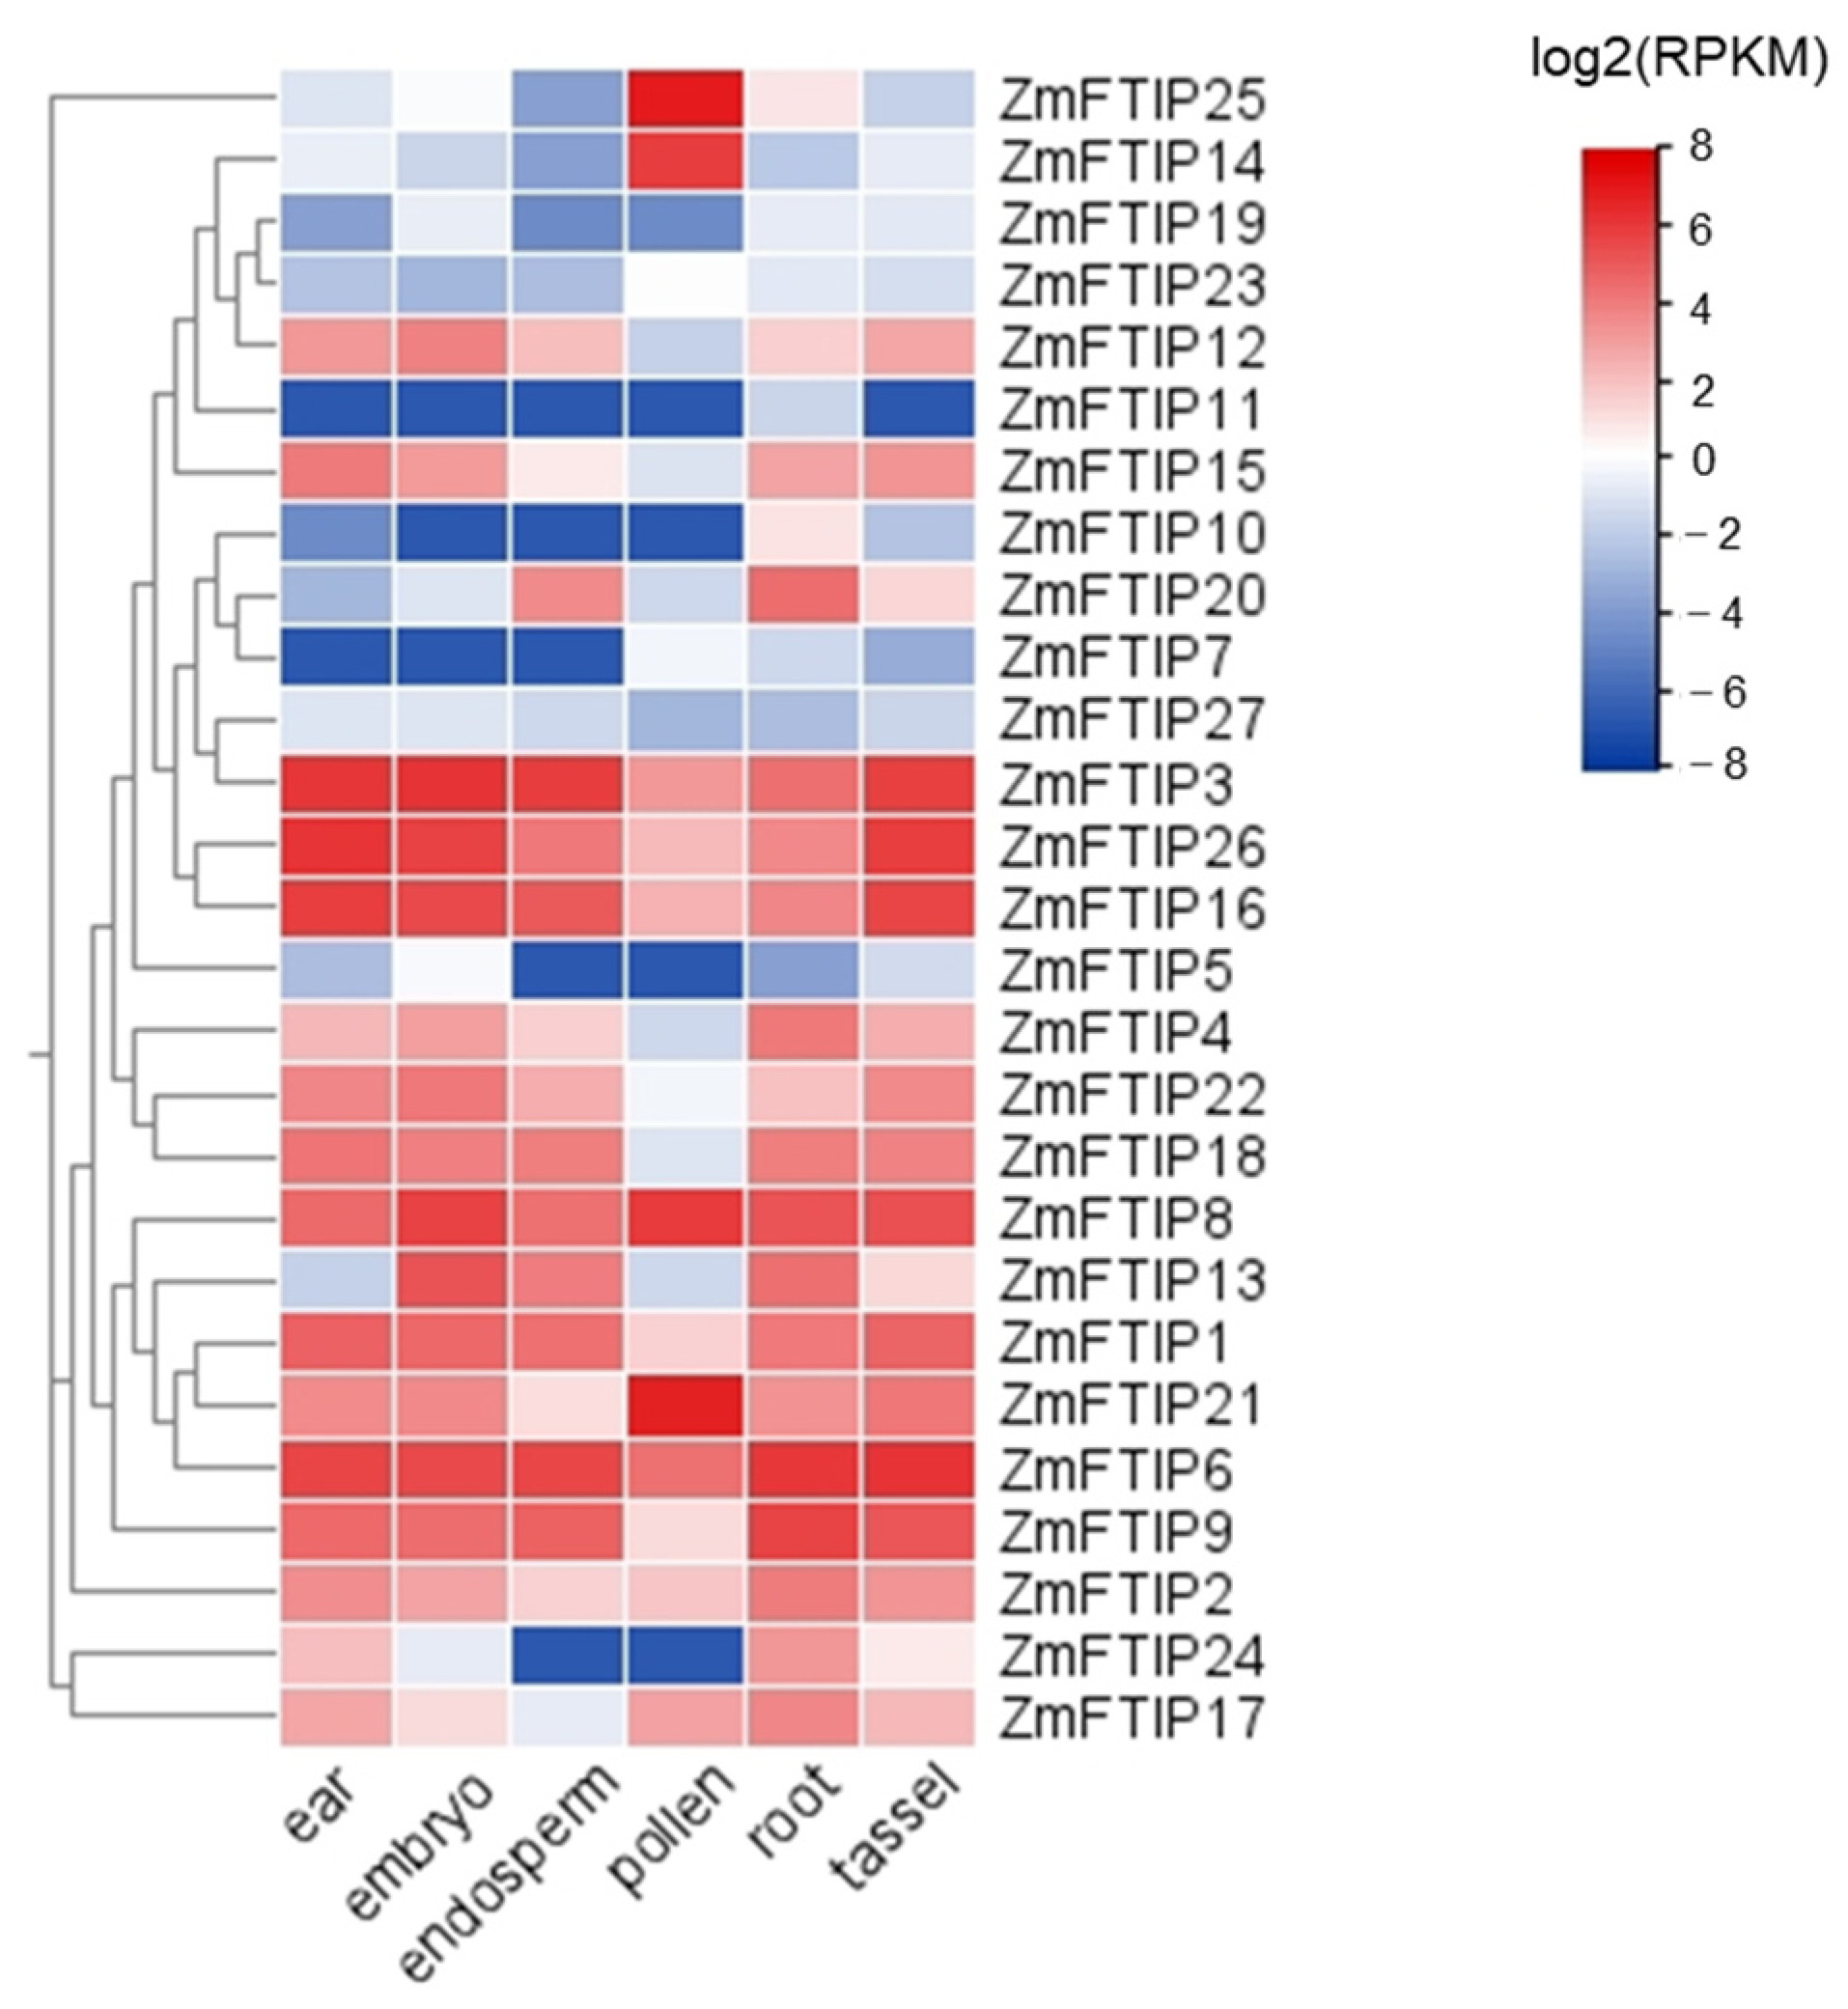
3.3. Analysis of the Expression of ZmFTIPs in Different Organs

At first, we inquired about the expression of ZmFTIPs in different organs of maize in the Plant Public RNA-Seq database (https://plantrnadb.com, accessed on 5 October 2023) [23]. As shown in Figure 5, ZmFTIPs are expressed in the female ear, embryo, endosperm, pollen, root, and male ear of maize, and the expression levels of different ZmFTIPs genes are quite different. Among them, the expression levels of ZmFTIP1, ZmFTIP2, ZmFTIP3, ZmFTIP4, ZmFTIP6, ZmFTIP8, ZmFTIP9, ZmFTIP12, ZmFTIP13, ZmFTIP16, ZmFTIP18, ZmFTIP21, ZmFTIP22, and ZmFTIP26 were higher than those of other members of ZmFTIPs gene family (Figure 5). Interestingly, the transcription level of ZmFTIP14 and ZmFTIP25 is high in pollen but low in other organs, indicating that these two genes may play a specific role in pollen development. The transcription level of ZmFTIPs is affected by sampling time and sampling environment, so further experiments are needed to analyze and prove the function of ZmFTIPs. Furthermore, research has demonstrated variations in the expression levels of ZmFTIPs across different maize organs, suggesting that individual members of the ZmFTIP family may fulfill distinct functions within specific tissue types.

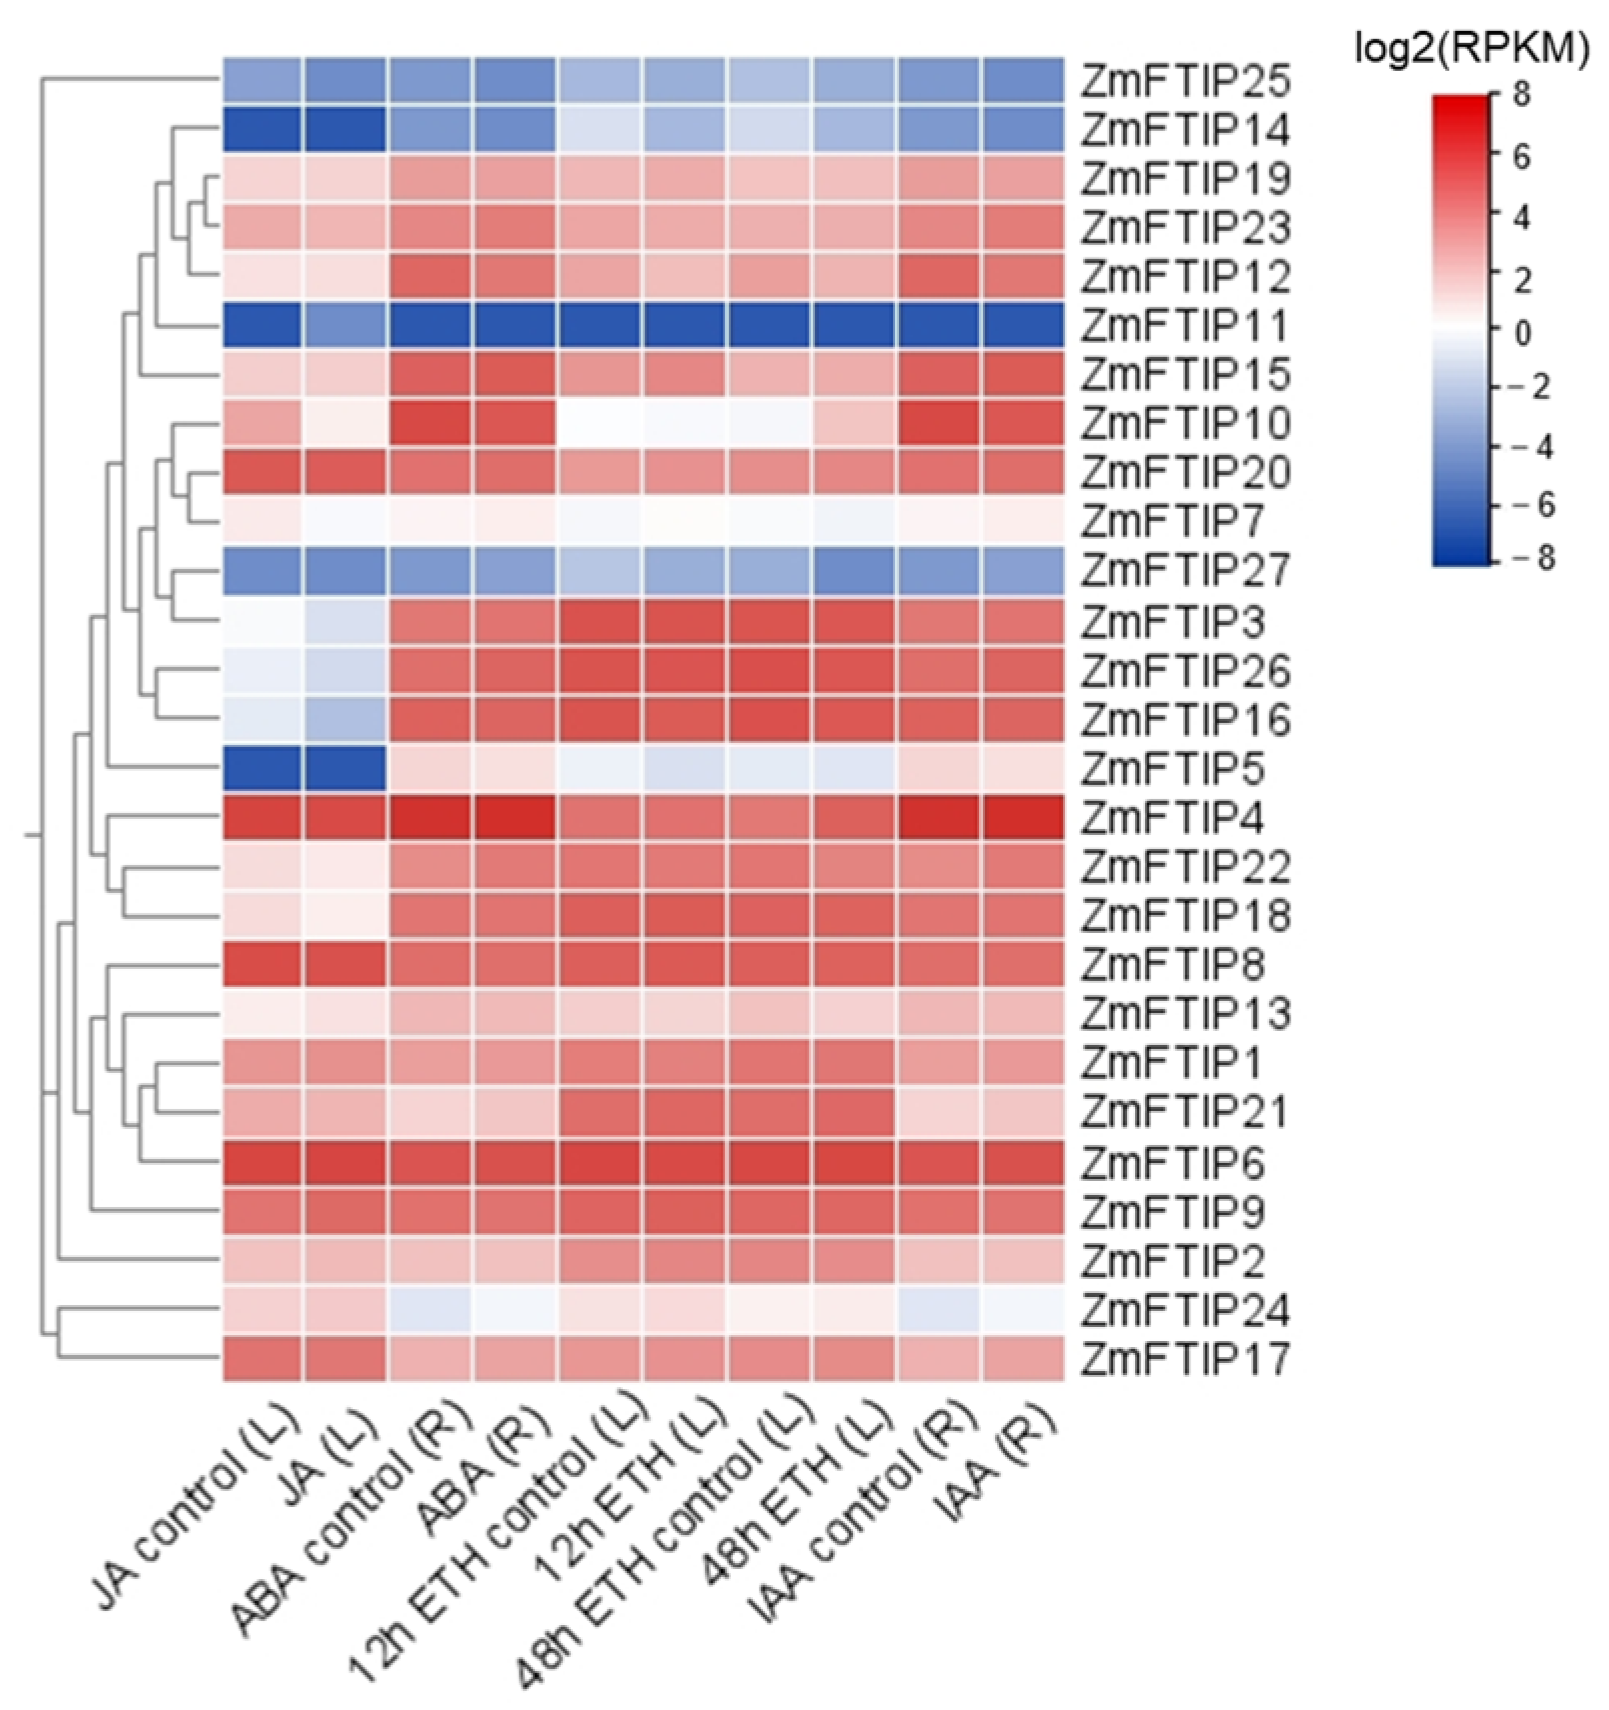
3.4. Analysis of ZmFTIPs Expression in Response to Various Hormones

To investigate whether ZmFTIPs are regulated by hormones, the expression profiles of ZmFTIPs were systematically analyzed using data obtained from the Plant Public RNA-seq Database [23]. Expression profiles of 27 ZmFTIP genes were obtained (Figure 6). The expression of ZmFTIP1, ZmFTIP17, ZmFTIP22, and ZmFTIP23 in maize roots was up-regulated by ABA treatment, while ZmFTIP10 and ZmFTIP12 were down-regulated by ABA treatment (Figure 6). JA treatment in maize leaves promoted the expression of ZmFTIP1 but inhibited the expression of ZmFTIP10 (Figure 6). The auxin analog IAA induced the up-regulation of ZmFTIP1, ZmFTIP17, ZmFTIP22, and ZmFTIP23 genes in maize roots, while the down-regulation of ZmFTIP10, ZmFTIP12, and ZmFTIP19 genes was induced by IAA treatment (Figure 6). Despite the absence of any identified cis-acting elements for cytokinin response in the promoter region of our ZmFTIPs, cytokinin treatment significantly modified the expression levels of ZmFTIPs (Figure 4 and Figure 6). After 12 h of cytokinin treatment in maize leaf cells, ZmFTIP2, ZmFTIP15, ZmFTIP17, and ZmFTIP19 genes were up-regulated, and the expression of ZmFTIP12 and ZmFTIP23 genes were down-regulated; after 48 h of cytokinin treatment, ZmFTIP12 and ZmFTIP22 genes were up-regulated (Figure 6). In addition, we did not find relevant data on gibberellin and salicylic acid-treated maize in the Plant Public RNA-seq Database. Studies have demonstrated that plant hormones, including abscisic acid and ethylene, play a significant role in modulating plants’ responses to both biotic and abiotic stresses [28,29]. Given that the expression levels of certain ZmFTIPs family members are influenced by these hormones, it is plausible to hypothesize that ZmFTIPs may contribute to the regulation of maize’s adaptive responses to external stressors.

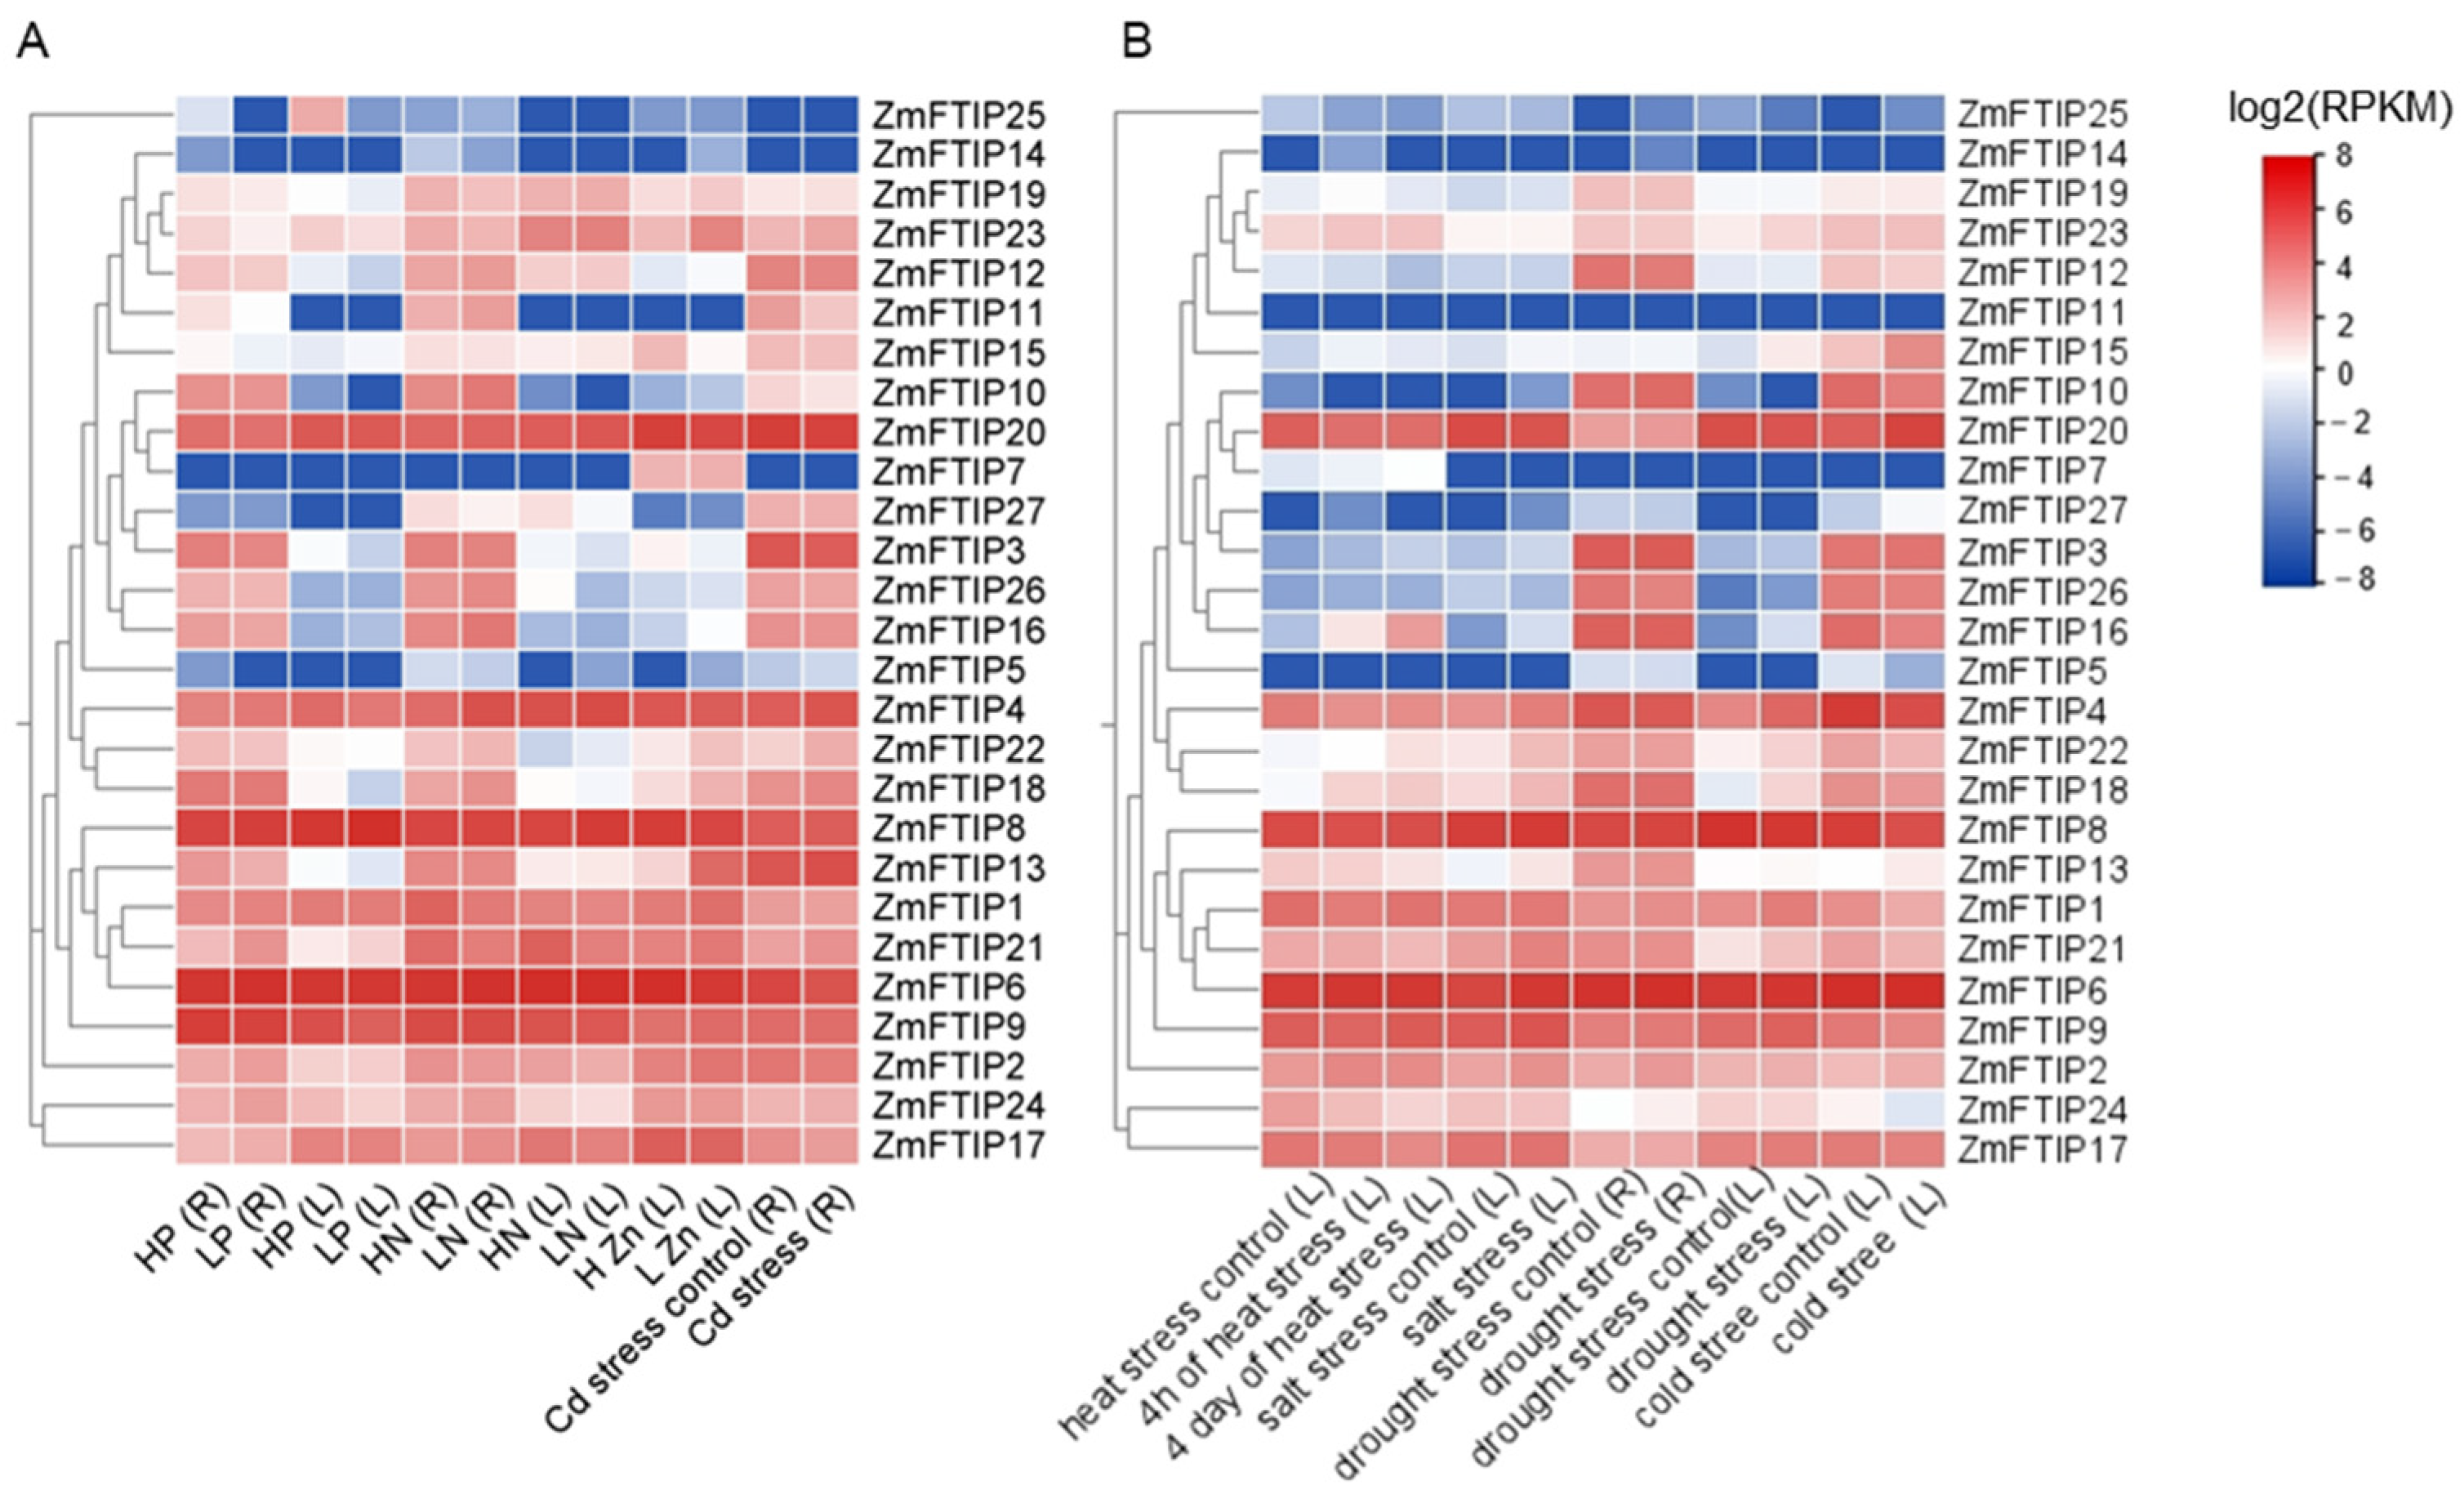
3.5. Comprehensive Analysis of ZmFTIPs Expression Profiles Under Diverse Stress Conditions

Furthermore, we identified cis-acting elements associated with defense and stress response within the promoter region of ZmFTIPs, leading us to hypothesize that ZmFTIPs may play a role in responding to nutrient deficiencies and other stress conditions. To investigate this hypothesis, we collected expression data for ZmFTIPs under low phosphorus (LP), low nitrogen (LN), low zinc (LZn), and heavy metal cadmium (Cd) stress (Figure 7A, Table S5).
Under LP stress, the expression levels of ZmFTIP1, ZmFTIP2, ZmFTIP17, ZmFTIP21, and ZmFTIP24 in maize leaves were significantly up-regulated. Conversely, the expression levels of ZmFTIP3, ZmFTIP13, and ZmFTIP16 were down-regulated. The expression levels of other ZmFTIPs remained unchanged. Additionally, in maize roots, the expression levels of ZmFTIP9 and ZmFTIP25 were also down-regulated (Figure 7A, Table S5).
In the roots of maize, LN stress up-regulated the expression of ZmFTIP4, ZmFTIP10, ZmFTIP11, ZmFTIP12, ZmFTIP16, ZmFTIP17, ZmFTIP18, ZmFTIP22, and ZmFTIP24, while it down-regulated the expression of ZmFTIP2, ZmFTIP19, and ZmFTIP23. In the leaves of maize, LN stress promoted the expression of ZmFTIP4 but led to decreased expression of ZmFTIP2, ZmFTIP21, and ZmFTIP27 (Figure 7A, Table S5).
In the leaves of maize, LZn stress significantly promoted the up-regulation of the expression levels of ZmFTIP1, ZmFTIP13, ZmFTIP18, ZmFTIP22, and ZmFTIP23. Conversely, the expression of ZmFTIP15 was notably down-regulated under LZn stress (Figure 7A).
Furthermore, we investigated the transcriptional responses of ZmFTIPs under heat, salt, drought, and cold stresses (Figure 7B, Table S5). After 4 h of heat stress, the expression levels of ZmFTIP2, ZmFTIP16, and ZmFTIP18 were significantly upregulated, whereas those of ZmFTIP4, ZmFTIP20, and ZmFTIP24 were markedly downregulated. No significant changes were observed in the expression levels of other ZmFTIPs (Figure 7B, Table S5). After 4 days of continuous heat stress, the expression levels of ZmFTIP16 and ZmFTIP18 remained upregulated, while those of ZmFTIP4, ZmFTIP13, ZmFTIP17, ZmFTIP20, ZmFTIP21, and ZmFTIP24 were consistently downregulated (Figure 7B, Table S5).
Under salt stress, in maize, the expression levels of ZmFTIP4, ZmFTIP9, ZmFTIP18, ZmFTIP21, and ZmFTIP22 were upregulated (Figure 7B, Table S5). In response to drought stress, the expression levels of ZmFTIP13, ZmFTIP20, and ZmFTIP21 were upregulated, while that of ZmFTIP26 was downregulated. Additionally, the expression levels of ZmFTIP4, ZmFTIP15, ZmFTIP18, ZmFTIP21, and ZmFTIP22 in maize leaves were upregulated, with no significant changes in other ZmFTIPs (Figure 7B, Table S5). Under cold stress, the expression levels of ZmFTIP2, ZmFTIP15, and ZmFTIP20 were upregulated, whereas those of ZmFTIP1, ZmFTIP4, ZmFTIP8, ZmFTIP9, ZmFTIP10, ZmFTIP16, ZmFTIP17, ZmFTIP18, ZmFTIP21, and ZmFTIP22 were downregulated, with no significant changes in other ZmFTIPs (Figure 7B, Table S5).
The heavy metal cadmium (Cd) is not an essential element for plants. In recent years, due to excessive Cd content in soil, it has posed a serious threat to agricultural production safety [30,31]. It is important to highlight that our findings indicate varying transcription levels of the ZmFTIPs gene family members under cadmium (Cd) stress. Under cadmium stress, the expression levels of ZmFTIP4, ZmFTIP18, ZmFTIP21, ZmFTIP22, and ZmFTIP23 were significantly up-regulated. Conversely, the expression levels of ZmFTIP11, ZmFTIP16, and ZmFTIP17 were down-regulated under low cadmium stress conditions (Figure 7A, Table S5). The transcriptional levels of ZmFTIPs in response to cadmium (Cd) stress appear to indicate a potential mechanism for regulating Cd detoxification in maize. However, further research is required to elucidate the role of ZmFTIPs in this process, particularly through genetic overexpression and gene knockout studies.

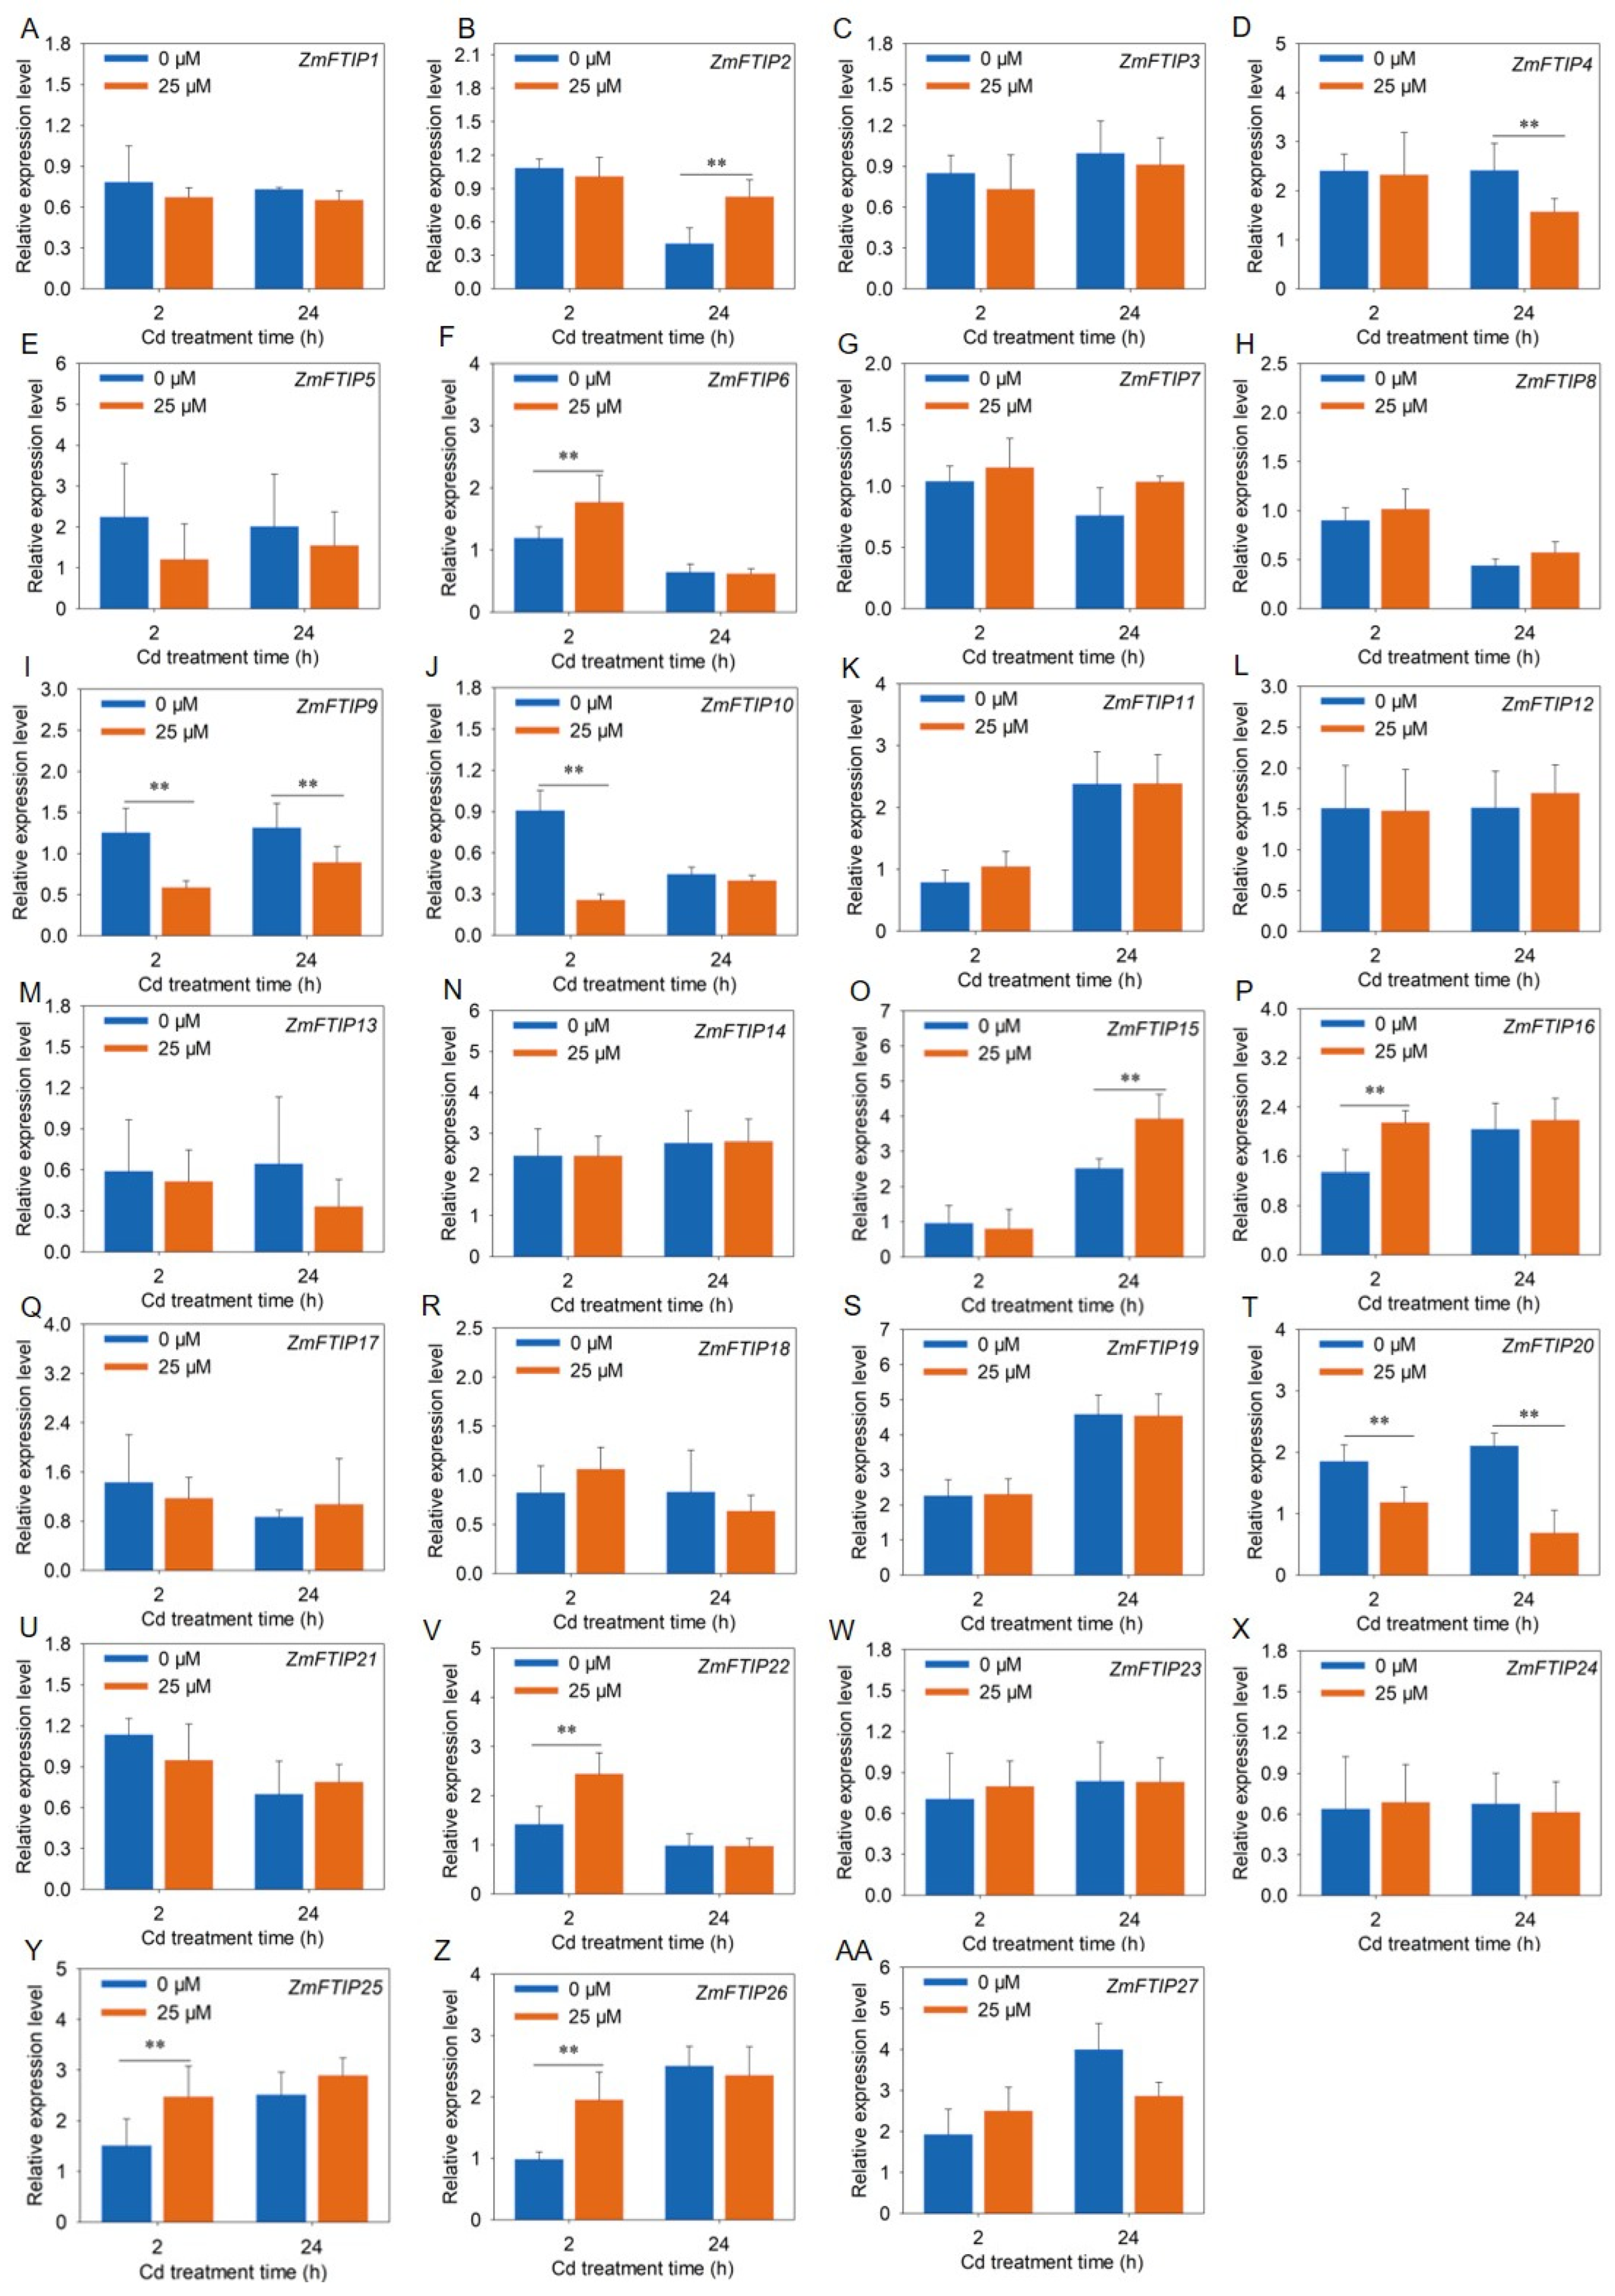
3.6. RT-PCR Analysis of the Expression of ZmFTIPs

To further validate the responsiveness of ZmFTIPs to heavy metal cadmium stress, we employed RT-PCR to assess the relative expression levels of ZmFTIPs in both roots and leaves of maize under cadmium exposure (Figure 8 and Figure 9). As illustrated in Figure 8, the transcriptional activity of ZmFTIP17, ZmFTIP18, ZmFTIP21, and ZmFTIP22 in roots markedly increased after 24 h of cadmium treatment, a trend that aligns closely with the RNA sequencing data from our prior study (Figure 7A, Table S5). Additionally, it was observed that after 2 h of cadmium exposure, the expression levels of ZmFTIP6, ZmFTIP16, ZmFTIP25, and ZmFTIP26 in roots were notably elevated compared to untreated controls (Figure 8F,P,Y,Z), whereas the expression of ZmFTIP10, ZmFTIP13, and ZmFTIP20 was significantly reduced (Figure 8J,M,T). To gain deeper insights into the expression dynamics of ZmFTIPs under prolonged cadmium exposure, we conducted an analysis of their relative expression after 24 h of cadmium treatment. The results indicated that in roots exposed to cadmium for 24 h, the expression levels of ZmFTIP4, ZmFTIP12, ZmFTIP17, ZmFTIP18, ZmFTIP21, ZmFTIP22, and ZmFTIP25 were significantly upregulated compared to untreated samples, while those of ZmFTIP9, ZmFTIP13, and ZmFTIP25 were significantly downregulated (Figure 8D,L,Q,R,U,V,Y). Notably, the expression of ZmFTIP18 and ZmFTIP25 in maize roots showed a significant increase at both 2 h and 24 h post-cadmium treatment (Figure 8R,Y), whereas the expression of ZmFTIP13 was significantly decreased at these time points (Figure 8M). These findings suggest that the expression levels of ZmFTIP13, ZmFTIP18, and ZmFTIP25 exhibit a relatively stable response to cadmium stress.
We utilized RT-PCR to evaluate the relative expression levels of ZmFTIPs in maize leaves exposed to cadmium. As shown in Figure 9, the transcriptional activity of ZmFTIP17, ZmFTIP18, ZmFTIP21, and ZmFTIP22 in leaves significantly increased after 24 h of cadmium treatment, a trend that is consistent with RNA sequencing data (Figure 9R, Q,U,V). Furthermore, we observed that the expression levels of ZmFTIP6, ZmFTIP16, ZmFTIP25, and ZmFTIP26 in leaves were markedly elevated after 2 h of cadmium exposure compared to untreated controls (Figure 9F,P,Y,Z), whereas the expression of ZmFTIP10, ZmFTIP13, and ZmFTIP20 was significantly reduced (Figure 9J,M,T). To gain deeper insights into the expression dynamics of ZmFTIPs under prolonged cadmium exposure in leaf, we conducted an analysis of their relative expression after 24 h of cadmium treatment. The results indicated that in leaf exposed to cadmium for 24 h, the expression levels of ZmFTIP4, ZmFTIP12, ZmFTIP17, ZmFTIP18, ZmFTIP21, ZmFTIP22, and ZmFTIP25 were significantly upregulated compared to untreated samples (Figure 9D,L,Q,R,U,V,Y), while those of ZmFTIP9, ZmFTIP13, and ZmFTIP25 were significantly downregulated (Figure 9I,M,N). Notably, the expression of ZmFTIP18 and ZmFTIP25 in maize roots showed a significant increase at both 2 h and 24 h post-cadmium treatment, whereas the expression of ZmFTIP13 was significantly decreased at these time points. These findings suggest that the expression levels of ZmFTIP13, ZmFTIP18, ZmFTIP20, and ZmFTIP25 exhibit a relatively stable response to cadmium stress.

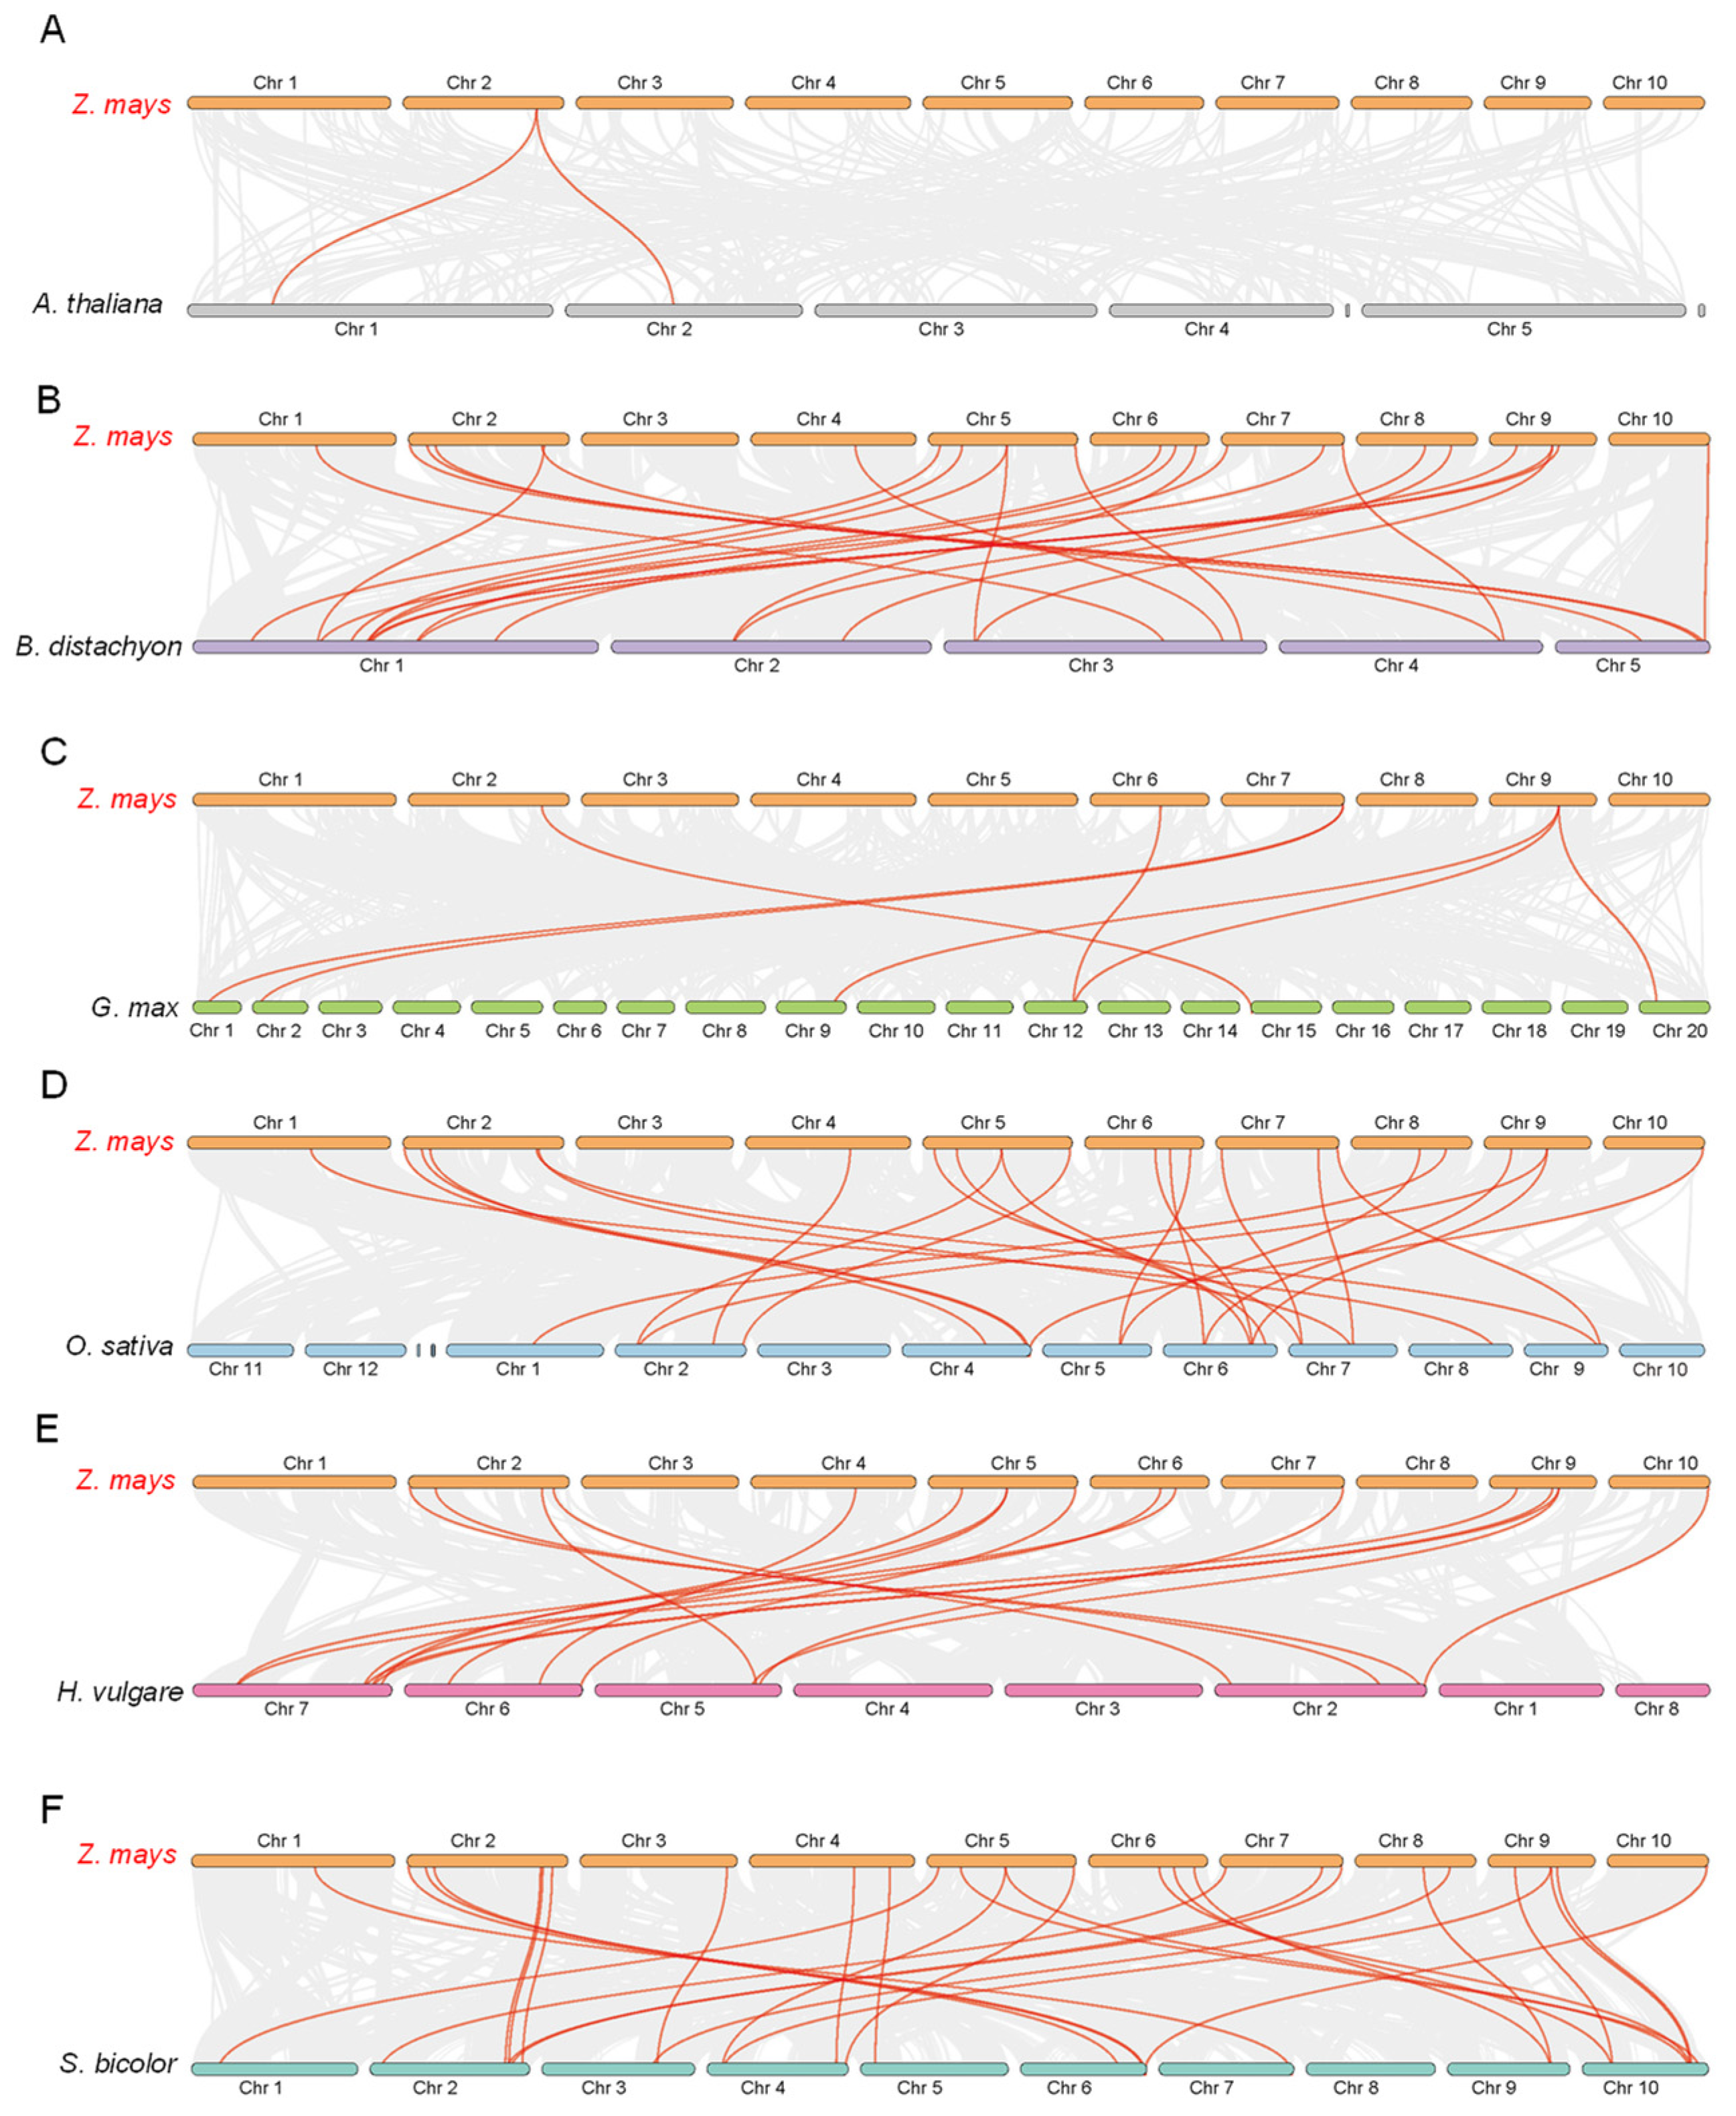
3.7. Synteny Analysis of ZmFTIPs Gene

To further explore the evolutionary relationship of FTIP proteins in crops and plants, we traced the collinear relationship between ZmFTIPs and homologs in other species. The number of homologous pairs among ZmFTIPs and among other species (Arabidopsis, Brachypodium, soybean, barley, sorghum) is 2, 24, 7, 24, 17, and 28, respectively. The results showed that there was a close genetic relationship between FTIPs and ZmFTIPs in Arabidopsis, Brachypodium japonica, soybean, barley, and sorghum (Figure 10).
ZmFTIP6, ZmFTIP7, and ZmFTIP8 on chromosome 2 constitute the most homologous gene pairs compared to other species (Figure 10). Specifically, maize shares two homologous gene pairs with Arabidopsis thaliana, two with Brachypodium distachyon, one with Glycine max, two with Oryza sativa, two with Hordeum vulgare, and three with Sorghum bicolor (Figure 10A,B,D). For example, ZmFTIP6 is collinear with Arabidopsis thaliana AT1G20080 and AT2G20990, ZFMTIP6 and KQK17666 and ZFMTIP7 and KQK16235 are collinear, ZmFTIP6 is collinear with KRH51399 of soybean, ZmFTIP6 is collinear with Os09t0538800 of rice, ZmFTIP7 is collinear with Os07t0483500, ZmFTIP6 is collinear with HORVU.MOREX.r2.5HG0415480 of barley, ZmFTIP8 is collinear with HORVU.MOREX.r2.2HG0098150 of barley, ZmFTIP6 is collinear with EER992650 in sorghum, ZmFTIP7 is collinear with EER99386, and ZmFTIP8 is collinear with KXG36798. These results suggest that these genes may play an important role in the FTIP gene family during evolution.

4. Discussion

In plants, the transport of nutrients, small molecules, and macromolecules between cells is mediated by plasmodesmata (PD), which are essential for regulating and enhancing intercellular communication [4]. Previous studies have demonstrated that the MCTP family, characterized by multiple C2 domains and transmembrane regions, plays a critical role in regulating macromolecule transport and cellular signaling [6,32]. Current research indicates that there are 16 members in Arabidopsis [11], 31 MCTPs identified in Gossypium hirsutum [33], and 13 members of the MCTP family in rice [12]. Maize, as an important grain crop with significant economic value [34,35], has limited biological information available for most of its MCTP members and those in other crop species. In this study, we identified 27 members of the ZmFTIPs distributed across 10 chromosomes (Table S1, Figure 1).
In recent years, researchers have discovered that FTIPs have a certain role in regulating plant flowering. FT-interacting protein1 (AtFTIP1) is believed to affect the transportation of macromolecules [8]; among them, AtFTIP1 and AtFTIP6 play a certain regulatory role in controlling flowering time [8,12]. OsFTIP1 plays a similar role in mediating rice flowering time under long days by affecting the transport of rice flowering locus T1, the rice counterpart of FLOWERINGLOCUST (FT), from companion cells to sieve elements [13]. Recently, it has been found that ZmMCTP3 and ZmMCTP10 in maize are closely related to AtFTIP1, which may participate in the floral transport pathway and affect the flowering process of plants, but their functions have not been verified by gene knockout or overexpression of ZmMCTP3 and ZmMCTP10 genes [17]. Therefore, whether ZmFTIPs are involved in the regulation of maize flowering remains to be further explored.
In a multi-species phylogenetic tree, genes within a subgroup typically exhibit similar functions [36]. The AtFTIP gene in Arabidopsis thaliana is divided into five subfamilies [10], the OsFTIP gene in rice is divided into six subfamilies [11], and the FTIP gene in upland cotton is divided into five subfamilies [33]. In this study, we made a phylogenetic analysis of the amino acid sequences of the FTIP family in maize and other species (Figure 2). The results showed that FTIP homologs from monocotyledonous rice, dicotyledonous Arabidopsis thaliana, and soybean were clustered in the same branch (Figure 2), indicating that the evolution of FTIP in these plants was close. AtFTIP1 of Arabidopsis thaliana plays a role in regulating flowering. Phylogenetically, it shares similarities with ZmFTIP1, ZmFTIP11, ZmFTIP18, ZmFTIP20, ZmFTIP22, and ZmFTIP25 (Figure 2). Nonetheless, additional research is warranted to ascertain whether it also plays a role in the regulation of flowering.
The majority of genes in plants belong to gene families. A gene family comprises a set of related genes that have evolved from a common ancestral gene through duplication and mutation events, resulting in genes with similar exon sequences [37]. Tandem replication is a form of gene replication that mainly occurs in the recombination region of chromosomes. In tandem replication, gene family members are usually closely arranged on the same chromosome, forming a gene cluster with similar sequence and function [37,38]. In maize, 27 ZmFTIP members are distributed on 10 chromosomes (Table S1, Figure 1). In order to know whether the ZmFTIP family is expanded by tandem and fragment duplication, the chromosome distribution and gene duplication of ZmFTIP in maize were analyzed (Figure 1 and Figure S1). Previous studies have confirmed the existence of gene tandem for FTIPs in Arabidopsis and rice [9,10,11]. Interestingly, a total of eight gene clusters and paired genes were identified on the chromosomes of 27 ZmFTIPs in maize (Figure S1), suggesting that the ZmFTIP gene family likely arose through tandem duplication and large-scale chromosomal duplication events. Most ZmFTIP genes may have originated from distinct ancestors, exhibiting high evolutionary diversity.
MCTP is a family of highly conserved proteins characterized by multiple C2 domains and transmembrane domains. Each protein contains three to four C2 domains at the N-terminus and one to four transmembrane domains at the C-terminus, functioning as key signaling molecules that mediate the transport of other regulatory factors in plant cells [8,12]. The C2 domain, one of the most common eukaryotic lipid-binding domains, serves as a docking module to target proteins to specific cell membranes through the formation of phospholipid complexes [5]. In membrane transport proteins, different C2 domains often exhibit distinct conserved sequences, suggesting that the multiple C2 domains within these proteins may function synergistically rather than being dedicated to specific cellular functions [6]. In maize, ZmFTIPs display typical features of MCTPs, possessing three to four C2 domains and one PRT-C domain (Figure 3B). Notably, the PRT-C domain and the C2 domain near the C-terminus are more conserved (Figure 3).
It has been shown that multiple C2 domain and transmembrane domain proteins (MCTP) family, the key regulatory factors of plant intercellular signal transduction, specifically act as ER-PM chains at plasmodesmata [8,12]. MCTPs are plasmodesmata proteins, which are inserted into the endoplasmic reticulum through their transmembrane regions, and their C2 domains are combined with the endoplasmic reticulum by interacting with anionic phospholipids [4,5,6]. The functional deletion mutant of mctp3/mctp4 resulted in developmental defects in plants and impaired the function and composition of plasmodesmata. In contrast, the expression of mctp4 in the yeast Dtether mutant restored the ER-PM connection [4,5,6]. OsFTIP1 is localized in the endoplasmic reticulum (ER), plasma membrane (PM), and cytoplasm in rice, playing a crucial role in the transport of RFT1 [8]. This study predicts the subcellular localization of ZmFTIP to the plasma membrane (PM), endoplasmic reticulum (ER), and cytoplasm (Table S1), suggesting that ZmFTIP may possess similar functions in these compartments. In addition, further research is required to elucidate the precise subcellular localization and functional roles of ZmFTIP proteins.
ZmFTIPs are expressed in the female ear, embryo, endosperm, pollen, root, and male ear of maize, and the expression levels of different ZmFTIP genes are quite different (Figure 5). The expression of ZmFTIP3, ZmFTIP8, and ZmFTIP16 was the highest. The expression of ZmFTIP7, ZmFTIP19, and ZmFTIP23 was the lowest in the ZmFTIP gene family (Figure 5).The differential expression patterns of ZmFTIPs across various organs highlight the diversity and specificity of their functional roles.
The distribution and types of cis-elements within promoters play a crucial role in determining the activity and function of genes. Auxin response elements such as TGA element (AACGAC) [39], AuxRR core element (GGTCCAT) [40] and gibberellin (P-box; TATCbox) and JA(TGACG) motifs [41]; Plant hormone response elements such as abscisic acid (ABRE) and salicylic acid (TCA) play an important role in gene response to various hormone regulation [42]. Interestingly, these cis-elements are common to most ZmFTIPs (Figure 4). At the same time, we found that the transcription level of some ZmFTIPs is regulated by hormone signals such as auxin, abscisic acid, and ethylene (Figure 6). These results indicate that the transcription factors related to plant hormone regulation may regulate the transcription of ZmFTIPs by binding homeopathic elements in the promoter region of ZmFTIPs.
In addition, the promoter of the ZmFTIPs gene family mainly contains cis-acting elements that respond to light, low temperature, and defense (Figure 4). These results suggest that the transcription level of ZmFTIPs may be regulated by abiotic stress. Previous studies have shown that some FTIP in C. kwangsiensis were up-regulated within 4 days under drought stress [43]. We found that the transcription level of some ZmFTIPs changed significantly under low phosphorus, low nitrogen, low zinc, cadmium stress, heat stress, salt stress, drought stress, and cold stress (Figure 7, Table S5). This indicated that ZmFTIPs might be involved in regulating the abiotic stress tolerance of maize to various nutrient stresses. Therefore, it is necessary to further predict and analyze the transcription factors that regulate the transcription of ZmFTIPs through bioinformatics and biochemical experiments.
Synteny analysis of ZmFTIPs and other FTIP-like proteins showed that we found more FTIP homologous pairs between rice and five monocot species, including maize, Brachypodium, sorghum, and barley, while there were seven homologous gene pairs between maize and soybean, and only seven homologous FTIP gene pairs between rice and Arabidopsis (Figure 10).

5. Conclusions

In this study, systematic identification and characterization of 27 ZmFTIP genes revealed their evolutionary divergence and functional diversification in maize. Phylogenetic classification into six clades highlighted monocot-specific conservation patterns, supported by synteny analysis indicating ancient evolutionary origins of MCTP genes. Promoter cis-regulatory element analysis uncovered abundant motifs linked to phytohormone signaling (ABA, JA, auxin) and stress adaptation. Expression profiling identified key stress-responsive candidates, with ZmFTIP18 and ZmFTIP25 demonstrating persistent upregulation under cadmium stress, suggesting specialized roles in heavy metal detoxification. Conversely, ZmFTIP13 downregulation implies functional divergence in stress signaling pathways. These findings establish a foundational framework for exploring ZmFTIP-mediated intercellular communication mechanisms and provide valuable genetic resources for developing stress-resilient maize cultivars through biotechnological approaches.

Supplementary Materials

The following supporting information can be downloaded at: https://www.mdpi.com/article/10.3390/genes16050539/s1, Figure S1: Syntenic analysis of FTIP genes in maize. In the genome-wide analysis of maize, collinear genes were connected by gray lines, while collinear FTIP genes were specifically highlighted using red lines; Table S1: Information of ZmFTIP family genes identified in maize genome; Table S2: Primer pairs used in this study. Table S3: The protein sequence of the plant FTIP family gene in 11 species has been analyzed; Table S4: FTIP family members screened using HMM models; Table S5: The Log(Fold Change) and p-values of maize FTIP genes under different stress.

Author Contributions

Conceptualization, Z.Z. and F.Q.; methodology, F.L.; software, G.L.; validation, F.L., J.C. and Z.W.; formal analysis, T.W.; investigation, H.D.; resources, F.L.; data curation, F.L.; writing—original draft preparation, G.L. and F.L.; writing—review and editing, Z.Z.; visualization, F.L.; supervision, F.Q.; project administration, G.L. All authors have read and agreed to the published version of the manuscript.

Funding

This research was funded by the Zhejiang Provincial Natural Science Foundation Youth Fund Project, grant number “LQN25C130001”.

Institutional Review Board Statement

Not applicable.

Informed Consent Statement

Not applicable.

Data Availability Statement

All data are reported in this manuscript.

Conflicts of Interest

The authors declare no conflicts of interest.

References

  1. Yuan, G.; Gao, H.; Yang, T. Exploring the role of the plant actin cytoskeleton: From signaling to cellular functions. Int. J. Mol. Sci. 2023, 24, 15480. [Google Scholar] [CrossRef]
  2. Song, X.; Ju, Y.; Chen, L.; Zhang, W. Strategies and tools to construct stable and efficient artificial coculture systems as biosynthetic platforms for biomass conversion. Biotechnol. Biofuels Bioprod. 2024, 17, 148. [Google Scholar] [CrossRef] [PubMed]
  3. Sampaio, M.; Neves, J.; Cardoso, T.; Pissarra, J.; Pereira, S.; Pereira, C. Coping with Abiotic Stress in Plants-An Endomembrane Trafficking Perspective. Plants. 2022, 11, 338. [Google Scholar] [CrossRef]
  4. Xuan, L.; Li, J.; Jiang, Y.; Shi, M.; Zhu, Y.; Bao, X.; Gong, Q.; Xue, H.-W.; Yu, H.; Liu, L. MCTP controls nucleocytoplasmic partitioning of AUXIN RESPONSE FACTORs during lateral root development. Dev. Cell 2024, 59, 3229–3244.e5. [Google Scholar] [CrossRef] [PubMed]
  5. Nalefski, E.A.; Falke, J.J. The C2 domain calcium-binding motif: Structural and functional diversity. Protein Sci. 1996, 5, 2375–2390. [Google Scholar] [CrossRef]
  6. Cho, W.; Stahelin, R.V. Membrane binding and subcellular targeting of C2 domains. Biochim. Biophys. Acta 2006, 1761, 838–849. [Google Scholar] [CrossRef] [PubMed]
  7. Fulton, L.; Batoux, M.; Vaddepalli, P.; Yadav, R.K.; Busch, W.; Andersen, S.U.; Jeong, S.; Lohmann, J.U.; Schneitz, K. DETORQUEO, QUIRKY, and ZERZAUST represent novel components involved in organ development mediated by the receptor-like kinase STRUBBELIG in Arabidopsis thaliana. PLoS Genet. 2009, 5, e1000355. [Google Scholar] [CrossRef]
  8. Liu, L.; Liu, C.; Hou, X.; Xi, W.; Shen, L.; Tao, Z.; Wang, Y.; Yu, H. FTIP1 is an essential regulator required for florigen transport. PLoS Biol. 2012, 10, e1001313. [Google Scholar] [CrossRef]
  9. Chen, X.; Leśniewska, B.; Boikine, R.; Yun, N.; Mody, T.A.; Vaddepalli, P.; Schneitz, K. Arabidopsis MCTP family member QUIRKY regulates the formation of the STRUBBELIG receptor kinase complex. Plant Physiol. 2023, 193, 2538–2554. [Google Scholar] [CrossRef]
  10. Brault, M.L.; Petit, J.D.; Immel, F.; Nicolas, W.J.; Glavier, M.; Brocard, L.; Gaston, A.; Fouché, M.; Hawkins, T.J.; Crowet, J.; et al. Multiple C2 domains and transmembrane region proteins (MCTPs) tether membranes at plasmodesmata. EMBO Rep. 2019, 20, e47182. [Google Scholar] [CrossRef]
  11. Liu, L.; Li, C.; Liang, Z.; Yu, H. Characterization of Multiple C2 Domain and Transmembrane Region Proteins in Arabidopsis. Plant Physiol. 2018, 176, 2119–2132. [Google Scholar] [CrossRef] [PubMed]
  12. Zhu, M.; Yan, B.; Hu, Y.; Cui, Z.; Wang, X. Genome-wide identification and phylogenetic analysis of rice FTIP gene family. Genomics. 2020, 112, 3803–3814. [Google Scholar] [CrossRef]
  13. Song, S.; Chen, Y.; Liu, L.; Wang, Y.; Bao, S.; Zhou, X.; Teo, Z.W.N.; Mao, C.; Gan, Y.; Yu, H. OsFTIP1-Mediated Regulation of Florigen Transport in Rice Is Negatively Regulated by the Ubiquitin-Like Domain Kinase OsUbDKγ4. Plant Cell 2017, 29, 491–507. [Google Scholar] [CrossRef] [PubMed]
  14. Song, S.; Chen, Y.; Liu, L.; See, Y.H.B.; Mao, C.; Gan, Y.; Yu, H. OsFTIP7 determines auxin-mediated anther dehiscence in rice. Nat. Plants 2018, 4, 495–504. [Google Scholar] [CrossRef]
  15. Chen, Y.; Shen, J.; Zhang, L.; Qi, H.; Yang, L.; Wang, H.; Wang, J.; Wang, Y.; Du, H.; Tao, Z.; et al. Nuclear translocation of OsMFT1 that is impeded by OsFTIP1 promotes drought tolerance in rice. Mol. Plant 2021, 14, 1297–1311. [Google Scholar] [CrossRef]
  16. Hu, Q.; Zeng, M.; Wang, M.; Huang, X.; Li, J.; Feng, C.; Xuan, L.; Liu, L.; Huang, G. Family-Wide Evaluation of Multiple C2 Domain and Transmembrane Region Protein in Gossypium hirsutum. Front. Plant Sci. 2021, 12, 767667. [Google Scholar] [CrossRef]
  17. Zhao, Y.; Qin, Q.; Chen, L.; Long, Y.; Song, N.; Jiang, H.; Si, W. Characterization and phylogenetic analysis of multiple C2 domain and transmembrane region proteins in maize. BMC Plant Biol. 2022, 22, 388. [Google Scholar] [CrossRef] [PubMed]
  18. Tran, T.M.; McCubbin, T.J.; Bihmidine, S.; Julius, B.T.; Baker, R.F.; Schauflinger, M.; Weil, C.; Springer, N.; Chomet, P.; Wagner, R.; et al. Maize Carbohydrate Partitioning Defective33 Encodes an MCTP Protein and Functions in Sucrose Export from Leaves. Mol. Plant 2019, 12, 1278–1293. [Google Scholar] [CrossRef]
  19. Chou, K.C.; Shen, H.B. Plant-mPLoc: A top-down strategy to augment the power for predicting plant protein subcellular localization. PLoS ONE 2010, 5, e11335. [Google Scholar] [CrossRef]
  20. Tamura, K.; Stecher, G.; Kumar, S. MEGA11: Molecular Evolutionary Genetics Analysis Version 11. Mol. Biol. Evol. 2021, 38, 3022–3027. [Google Scholar] [CrossRef]
  21. Li, F.; Mai, C.; Liu, Y.; Deng, Y.; Wu, L.; Zheng, X.; He, H.; Huang, Y.; Luo, Z.; Wang, J. Soybean PHR1-regulated low phosphorus-responsive GmRALF22 promotes phosphate uptake by stimulating the expression of GmPTs. Plant Sci. 2024, 348, 112211. [Google Scholar] [CrossRef]
  22. Chen, C.; Wu, Y.; Li, J.; Wang, X.; Zeng, Z.; Xu, J.; Liu, Y.; Feng, J.; Chen, H.; He, Y.; et al. TBtools-II: A “one for all, all for one” bioinformatics platform for biological big-data mining. Mol. Plant 2023, 16, 1733–1742. [Google Scholar] [CrossRef]
  23. Zhang, H.; Zhang, F.; Yu, Y.; Feng, L.; Jia, J.; Liu, B.; Li, B.; Guo, H.; Zhai, J. A comprehensive online database for exploring ~20,000 public Arabidopsis RNA-seq libraries. Mol. Plant 2020, 13, 1231–1233. [Google Scholar] [CrossRef] [PubMed]
  24. Li, F.; Deng, Y.; Liu, Y.; Mai, C.; Xu, Y.; Wu, J.; Zheng, X.; Liang, C.; Wang, J. Arabidopsis transcription factor WRKY45 confers cadmium tolerance via activating PCS1 and PCS2 expression. J. Hazard. Mater. 2023, 460, 132496. [Google Scholar] [CrossRef] [PubMed]
  25. Kong, D.; Pan, X.; Jing, Y.; Zhao, Y.; Duan, Y.; Yang, J.; Wang, B.; Liu, Y.; Shen, R.; Cao, Y.; et al. ZmSPL10/14/26 are required for epidermal hair cell fate specification on maize leaf. New Phytol. 2021, 230, 1533–1549. [Google Scholar] [CrossRef]
  26. Yu, Y.; Li, Q.; Yu, H.; Li, Q. Comparative Analysis of Promoter Activity in Crassostrea gigas Embryos: Implications for Bivalve Gene Editing. Mar. Biotechnol. 2024, 27, 20. [Google Scholar] [CrossRef]
  27. Lescot, M.; Déhais, P.; Thijs, G.; Marchal, K.; Moreau, Y.; Van de Peer, Y.; Rouzé, P.; Rombauts, S. PlantCARE, a database of plant cis-acting regulatory elements and a portal to tools for in silico analysis of promoter sequences. Nucleic Acids Res. 2002, 30, 325–327. [Google Scholar] [CrossRef]
  28. Kong, X.; Li, C.; Zhang, F.; Yu, Q.; Gao, S.; Zhang, M.; Tian, H.; Zhang, J.; Yuan, X.; Ding, Z. Ethylene promotes cadmium-induced root growth inhibition through EIN3 controlled XTH33 and LSU1 expression in Arabidopsis. Plant Cell Environ. 2018, 41, 2449–2462. [Google Scholar] [CrossRef] [PubMed]
  29. Yu, X.; Yang, L.; Fan, C.; Hu, J.; Zheng, Y.; Wang, Z.; Liu, Y.; Xiao, X.; Yang, L.; Lei, T.; et al. Abscisic acid (ABA) alleviates cadmium toxicity by enhancing the adsorption of cadmium to root cell walls and inducing antioxidant defense system of Cosmos bipinnatus. Ecotoxicol. Environ. Saf. 2023, 261, 115101. [Google Scholar] [CrossRef]
  30. Yang, S.; Wu, P.; Jeyakumar, P.; Wang, H.; Zheng, X.; Liu, W.; Wang, L.; Li, X.; Ru, S. Technical solutions for minimizing wheat grain cadmium: A field study in North China. Sci. Total Environ. 2022, 818, 151791. [Google Scholar] [CrossRef]
  31. Wu, X.; Chen, L.; Lin, X.; Chen, X.; Han, C.; Tian, F.; Wan, X.; Liu, Q.; He, F.; Chen, L.; et al. Integrating physiological and transcriptome analyses clarified the molecular regulation mechanism of PyWRKY48 in poplar under cadmium stress. Int. J. Biol. Macromol. 2023, 238, 124072. [Google Scholar] [CrossRef] [PubMed]
  32. Maule, A.J.; Benitez-Alfonso, Y.; Faulkner, C. Plasmodesmata-membrane tunnels with attitude. Curr. Opin. Plant Biol. 2011, 14, 683–690. [Google Scholar] [CrossRef]
  33. Hao, P.; Wang, H.; Ma, L.; Wu, A.; Chen, P.; Cheng, S.; Wei, H.; Yu, S. Genome-wide identification and characterization of multiple C2 domains and transmembrane region proteins in Gossypium hirsutum. Research Square. 2020, 21, 445. [Google Scholar] [CrossRef] [PubMed]
  34. Arshad, M.; Nawaz, R.; Ahmad, S.; Irshad, M.A.; Irfan, A.; Qayyum, M.M.N.; Almaary, K.S.; Afzaal, M.; Ahmed, Z.; Bourhia, M. Effect of daily thinning on biweekly increment of growth and yield of maize (Zea mays L.) in mountainous agroecosystem. BMC Plant Biol. 2025, 25, 428. [Google Scholar]
  35. Wang, J.; Guo, J.; Li, G.; Lu, W.; Lu, D. Effects of different fertilizer combinations on the yield and nitrogen use efficiency of summer maize in Jiangsu Province, China. Sci. Rep. 2025, 15, 12458. [Google Scholar] [CrossRef]
  36. Liu, S.; Lei, X.; Gou, W.; Xiong, C.; Min, W.; Kong, D.; Wang, X.; Liu, T.; Ling, Y.; Ma, X.; et al. Genome-wide identification, characterization and expression analysis of key gene families in RNA silencing in centipede grass. BMC Genom. 2024, 25, 1139. [Google Scholar] [CrossRef]
  37. Ezoe, A.; Seki, M. Exploring the complexity of genome size reduction in angiosperms. Plant Mol. Biol. 2024, 114, 121. [Google Scholar] [CrossRef] [PubMed]
  38. Jia, C.; Shi, Y.; Wang, H.; Zhang, Y.; Luo, F.; Li, Z.; Tian, Y.; Lu, X.; Pei, Z. Genome-wide identification and expression analysis of SMALL AUXIN UP RNA (SAUR) genes in rice (Oryza sativa). Plant Signal. Behav. 2024, 19, 2391658. [Google Scholar] [CrossRef]
  39. Peng, Y.; Guo, X.; Fan, Y.; Liu, H.; Sun, L.; Liu, D.; Li, H.; Wang, X.; Guo, H.; Lu, H. Identifying a cis-element in PtoCP1 promoter for efficiently controlling constitutive gene expression in Populus tomentosa. PeerJ 2024, 12, e18292. [Google Scholar] [CrossRef]
  40. Sghaier, N.; Ben Ayed, R.; Ben Marzoug, R.; Rebai, A. Dempster-Shafer Theory for the Prediction of Auxin-Response Elements (AuxREs) in Plant Genomes. Biomed Res. Int. 2018, 2018, 3837060. [Google Scholar] [CrossRef]
  41. Zhou, Y.; Zheng, R.; Peng, Y.; Chen, J.; Zhu, X.; Xie, K.; Su, Q.; Huang, R.; Zhan, S.; Peng, D.; et al. Bioinformatic assessment and expression profiles of the AP2/ERF superfamily in the Melastoma dodecandrum genome. Int. J. Mol. Sci. 2023, 24, 16362. [Google Scholar] [CrossRef] [PubMed]
  42. Liang, L.; Sui, X.; Xiao, J.; Tang, W.; Song, X.; Xu, Z.; Wang, D.; Xie, M.; Sun, B.; Tang, Y.; et al. ERD14 regulation by the HY5- or HY5-MED2 module mediates the cold signal transduction of asparagus bean. Plant J. 2025, 121, e17172. [Google Scholar] [CrossRef] [PubMed]
  43. Feng, X.; Zhou, L.; Sheng, A.; Lin, L.; Liu, H. Comparative transcriptome analysis on drought stress-induced floral formation of Curcuma kwangsiensis. Plant Signal. Behav. 2022, 17, 2114642. [Google Scholar] [CrossRef] [PubMed]
Figure 1. Chromosomal distribution of FTIP genes in the maize genome. The color bars represent the chromosomes, with chromosome numbers indicated on the left. ZmFTIP genes are marked to the right of the respective chromosomes. The scale bar on the left denotes the relative length of the chromosomes.
Genes 16 00539 g001
Figure 2. Phylogenetic analysis of FTIP proteins from Zea mays (Zm), Glycine max (Gm), Arabidopsis (At), rice (Os), Brachypodium distachyon (Bd), Hordeum vulgare (Hv), Populus trichocarpa (Ptr), Solanum lycopersicum (Sl), Solanum tuberosum (St), Triticum aestivum (Ta), and Vitis vinifera (Vv). The phylogenetic tree was reconstructed using MEGA 7.0 software by applying the maximum likelihood method. A bootstrap value of 1000 replicates was used to assess the robustness of the tree topology.
Genes 16 00539 g002
Figure 3. Motif and protein domain analysis of the ZmFTIP family: (A) motif composition, (B) protein domain structure, and (C) amino acid sequences of conserved motifs. The size of the letters in the motifs indicates the degree of conservation.
Genes 16 00539 g003
Figure 4. The cis-acting elements in the promoters of ZmFTIPs and their functions.
Genes 16 00539 g004
Figure 5. Expression patterns of ZmFTIPs in different maize organs. The relative expression levels of ZmFTIPs in the maize ear, embryo, endosperm, pollen, root, and tassel were obtained from published RNA-seq datasets. The color scale on the right represents the relative expression level (log2(FPKM)) of ZmFTIPs. RPKM: Reads per kilobase per million mapped reads. BioProject accession: PRJEB10406.
Genes 16 00539 g005
Figure 6. Expression patterns of ZmFTIPs in response to jasmonic acid (JA), abscisic acid (ABA), ethylene (ETH), and auxin (IAA) treatments. The relative expression levels of ZmFTIPs were extracted from published RNA-seq datasets. The color scale on the right represents the relative expression level [log2(RPKM)] of ZmFTIPs. RPKM: Reads per kilobase per million mapped reads. BioProject Accessions: JA, PRJNA380272; ABA, PRJNA546250; Auxin, PRJNA529334; Ethylene, PRJNA433298.
Genes 16 00539 g006
Figure 7. ZmFTIPs expression patterns in different stress. (A) ZmFTIPs expression patterns in low phosphorus (LP), low nitrogen (LN), low zinc (LZn), and cadmium (Cd) stress. (B) Expression patterns of ZmFTIPs in heat stress, salt stress, drought stress, and cold stress. The relative expression levels of ZmFTIPs were obtained from previously published RNA-seq datasets. The color scale on the right represents the relative expression level [log2(RPKM)] of ZmFTIPs. RPKM: Reads per kilobase/million. BioProject: LP, SRX793133; LN, SRX389606; LZn, PRJNA517889; Cd stress, PRJNA548845; heat stress, PRJNA396192; salt stress, PRJNA308155; drought stress, PRJNA284670; cold stress, PRJNA343268.
Genes 16 00539 g007
Figure 8. Analysis of expression level of ZmFTIP in maize root under cadmium stress. (AAA) Responses of ZmFTIP1ZmFTIP27 to Cd stress in maize root. The relative expression levels of ZmFTIPs were normalized against ZmTubulin (Zm00001eb390190). Maize seedlings were grown in a hydroponic device for 10 days (d), then the seedlings were treated with 25 μM CdCl2, and samples were taken for measurement at 2 h (h) and 24 h, respectively. Data are presented as means ± SE (n = 4). Student’s t-test was employed to assess the significance of differences between 25 μM CdCl2 and 0 μM CdCl2 (**, p < 0.01).
Genes 16 00539 g008
Figure 9. Analysis of the expression levels of ZmFTIPs in maize leaves under cadmium stress. (AAA) Responses of ZmFTIP1ZmFTIP27 to cadmium stress in maize roots. The relative expression levels of ZmFTIPs were normalized against ZmTubulin (Zm00001eb390190). Maize seedlings were grown in a hydroponic device for 10 days (d), then the seedlings were treated with 25 μM CdCl2, and samples were taken for measurement at 2 h (h) and 24 h, respectively. Data are presented as means ± SE (n = 4). Student’s t-test was employed to assess the significance of differences between 25 μM CdCl2 and 0 μM CdCl2 (**, p < 0.01).
Genes 16 00539 g009
Figure 10. Syntenic analysis of FTIP genes between maize and six representative plant species is presented. The gray lines at the bottom represent collinear blocks within the maize and other plant genomes, while the red lines highlight the pairs of FTIP genes. The results of the syntenic analysis between maize, including Arabidopsis thaliana, Brachypodium distachyon, Glycine max, Hordeum vulgare, Sorghum bicolor (AF).
Genes 16 00539 g010
Disclaimer/Publisher’s Note: The statements, opinions and data contained in all publications are solely those of the individual author(s) and contributor(s) and not of MDPI and/or the editor(s). MDPI and/or the editor(s) disclaim responsibility for any injury to people or property resulting from any ideas, methods, instructions or products referred to in the content.

