Article

Comparative Mitogenomics of Wonder Geckos (Sphaerodactylidae: Teratoscincus Strauch, 1863): Uncovering Evolutionary Insights into Protein-Coding Genes

1
Xinjiang Key Laboratory of Biological Resources and Genetic Engineering, College of Life Science and Technology, Xinjiang University, Urumqi 830017, China
2
Chengdu Institute of Biology, Chinese Academy of Sciences, Chengdu 610213, China
*
Author to whom correspondence should be addressed.
Genes 2025, 16(5), 531; https://doi.org/10.3390/genes16050531
Submission received: 7 April 2025 / Revised: 26 April 2025 / Accepted: 27 April 2025 / Published: 29 April 2025

Abstract

:
Background: Comparative studies of selection pressures on mitochondrial genomes and protein-coding genes (PCGs) are scarce in the genus Teratoscincus (Strauch, 1863), particularly within Sphaerodactylidae. Given their close evolutionary relationship, Teratoscincus przewalskii (Strauch, 1887) and Teratoscincus roborowskii (Bedriaga, 1906) serve as ideal models for the characterization of mitochondrial genome sand analysis of selective pressure in this genus. Methods: In this study, we employed Sanger sequencing to sequence the mitochondrial genome of T. roborowskii (Bedriaga, 1906), and utilized sliding window analysis, selection pressure analysis etc. to compared it with that of its close relative, T. przewalskii (Strauch, 1887). Results: The results contain the genome composition, Ka/Ks values, AT/GC-skew, etc. Selection pressure analysis of PCGs across Teratoscincus (Strauch, 1863) species (including those in GenBank) revealed that most genes evolve slowly, with the exception of ATP8 and ND6, which exhibited faster evolutionary rates. Notably, the ND6 of T. roborowskii (Bedriaga, 1906) demonstrated rapid non-synonymous substitution rates which may contribute to the survival and reproductive success of the species by favoring advantageous mutations. Phylogenetic analysis for the mitochondrial genomes of Sphaerodactylidae, Phyllodactylidae, and Gekkonidae confirmed the distinctiveness of Sphaerodactylidae and the two Teratoscincus (Strauch, 1863) species. Conclusions: This study has advanced the understanding of adaptive evolution in Teratoscincus (Strauch, 1863) mitochondrial genomes, expanded the mitochondrial database of Sphaerodactylidae, and provided insights into the phylogenetic relationships of the genus.

1. Introduction

The wonder gecko genus Teratoscincus (Strauch, 1863), belonging to the family Sphaerodactylidae, is native to the desert regions of southwestern and central Asia [1,2]. Initially classified within the Gekkonidae, subsequent molecular, morphological, and anatomical evidence has led to its reclassification within the Sphaerodactylidae [3,4]. The genus Teratoscincus comprises nine known species, three of which occur in China: T. roborowskii (Bedriaga, 1906), T. przewalskii (Strauch, 1887), and T. scincus (Schlegel, 1858) [1,2,5,6,7].
T. roborowskii, the Turpan wonder gecko, is endemic to China’s Turpan Basin and is nocturnal, preferring habitats with dead trees of thorny bushes [8,9,10]. Once misclassified as T. przewalskii, it has recently been established as a separate species [2]. In contrast, T. przewalskii inhabits three major desert ecosystems in northwestern China: Tarim Basin, Hami Depression, and Gobi deserts [1,2]. This nocturnal species feeds primarily on beetles and occupies arid sandy or gravelly environments [11,12].
Despite its ecological and geographic importance, research on Teratoscincus remains limited, with most studies focusing on physiology, behavior, and phylogeny rather than mitochondrial genomics [1,2,10,13]. These species have distinct ecological niches and distribution patterns; T. przewalskii occupies a wide altitudinal range across northwestern China, while T. roborowskii is restricted to the Turpan Basin. This characteristic makes them an ideal comparative model for exploring mitochondrial genome dynamics at the interspecific level, particularly in adaptation to divergent desert environments.
The mitochondrial genome (mitogenome), pivotal to energy metabolism through oxidative phosphorylation [14], serves as a key molecular marker for genetic studies due to its matrilineal inheritance, simple structure, high copy number, and rapid evolutionary rate [15]. Its applications span phylogenetic analysis, population genetics, species identification, and taxonomic classification [16,17,18]. Typically comprising twenty-two tRNAs, two rRNAs, thirteen PCGs, and a control region [19,20], mitochondrial genomes have been extensively studied across diverse animal taxa [15,18,21,22].
Despite the extensive investigation, research on mitochondrial genomes within the genus Teratoscincus and the family Sphaerodactylidae remains limited, with existing studies primarily focusing on single species characterization rather than comparative analyses [12,23,24]. Further comparative research on Teratoscincus mitochondrial genomes could provide valuable insights into their evolutionary adaptations to desert environments.
The present study has, therefore, sought to provide a new complete mitochondrial genome of T. roborowskii and to compare it with available Teratoscincus mitochondrial genomes in GenBank, focusing in particular on T. przewalskii. The analysis included a range of aspects, including genome composition, gene order, base composition, and codon usage. A non-synonymous mutation was identified in the ND6 between the two species, and further analysis was performed on Ka/Ks values, AT/GC-skew, and sources of selection pressure within the genus. Complete mitochondrial genome sequences were subjected to phylogenetic reconstruction using both maximum likelihood (ML) and Bayesian inference (BI) methods. The results of this study offer novel insights into the dynamics of selection pressure in the mitochondrial genomes of closely related species and expand the genetic resources available for Teratoscincus species.

2. Materials and Methods

2.1. Sampling and DNA Extraction

A tail-end sample of T. roborowskii (voucher number ZY01507) was collected in Toksun, Xinjiang (42.863° N, 88.633° E), China, in 2018. The sample was used for genetic analysis and preserved in 95% ethanol at −20 °C. It is currently deposited in the Chengdu Institute of Biology, Chinese Academy of Sciences. Genomic DNA was then extracted from the muscle tissue using the EasyPure Genomic DNA Kit (TransGen Biotech Co., Beijing, China) according to the manufacturer’s instructions. The integrity of the DNA was then assessed via 1% agarose gel electrophoresis.

2.2. Primer Design, PCR Amplification, and Sequencing

In order to amplify the mitochondrial genome of T. roborowskii, a set of 12 primer pairs was designed on the basis of published sequences from related species: T. keyserlingii (GenBank accession number AY753545) [1], T. roborowskii (MT107158) [25], and T. przewalskii (OL471044) [23].
PCR amplifications for target genes were performed with a volume of 25 μL, containing 12.5 μL of 2× Taq PCR Master Mix (Sangon Biotech, Shanghai, China), 0.5 μL of each specific primer pair (forward and reverse), 1 μL of template DNA (~50 ng), and 10.5 μL of sterilized ultrapure water. The PCR reactions were conducted as follows: an initial denaturation at 94 °C for 4 min, followed by 35 cycles of denaturation at 94 °C for 45 s, annealing at 48–54 °C for 35 s, extension at 72 °C for 90 s, and a final extension at 72 °C for 10 min. Assessment of the PCR products was undertaken via 1% agarose gel electrophoresis, after which the samples were sent to Sangon Biotech (Shanghai, China) for purification and sequencing. Sequencing was conducted using an ABI 3730 automated DNA sequencer (Applied Biosystems, Inc., Shanghai, China). Bidirectional sequencing was performed of all PCR products.

2.3. Assembly and Annotation

Raw sequences were proofread and assembled using BioEdit v7.2.5 [26]. The mitochondrial genome of T. roborowskii was automatically annotated using the MITOS WebServer (http://mitos.bioinf.uni-leipzig.de/index.py (22 December 2024)) [27]. Subsequently, using T. roborowskii (MT107158) as the reference genome, exact gene boundaries were further confirmed by comparing each gene with the annotated mitochondrial genomes from this species using the NCBI Blast online tool (https://blast.ncbi.nlm.nih.gov/Blast.cgi (22 December 2024)), followed by manual verification. The boundaries and length of control region (CR) were then determined based on the positions of tRNAphe and tRNAPro.

2.4. Bioinformatics Analyses

The circular, complete mitochondrial genome of T. roborowskii was mapped using the MitoAnnotator online tool (https://mitofish.aori.u-tokyo.ac.jp/annotation/input/ (22 December 2024)) [28,29]. The nucleotide composition of the complete mitochondrial sequences, protein-coding genes (PCGs), RNAs, and CRs of the two species were calculated using MEGA v7.0 [30]. The AT-skew and GC-skew were calculated using the following formulae: AT-skew = ((A% − T%)/(A% + T%)); GC-skew = ((G% − C%)/(G% + C%)).
Synonymous substitutions (Ks) and non-synonymous substitutions (Ka) in PCGs were analyzed using BioEdit v7.0 [26] and KaKs Calculator v3.0 [31]. The effective number of codons (ENC) values for PCGs were calculated using the EMBOSS Explorer online tool (https://embossgui.sourceforge.net/demo/ (22 December 2024)). GC3s (GC content of the third position of synonymous codons) was calculated using CodonW v1.4.2 (https://codonw.sourceforge.net/ (22 December 2024)). Relative synonymous codon usage (RSCU) value was calculated in PhyloSuite v1.2.3 [32]. Pi analyses were performed using sliding window analysis in DNAsp v6.0 [33] to elucidate the variations and evolution in PCGs. All figures were created and enhanced using the ggplot2 package in R Studio v23.3.1 [34].

2.5. Phylogenetic Analysis

In order to establish the phylogenetic placements of T. przewalskii and T. roborowskii, 11 mitochondrial genome sequences of all available Teratoscincus and some related taxa were downloaded from GenBank (see Supplementary Table S1). Two Gekkonidae species were selected as outgroups: Gekko gecko (HM370130), Gekko chinensis (KP666135) [35].
Sequence alignment was performed using ClustalW implemented in BioEdit v7.0 [26], with manual adjustments. The partitioning schemes for maximum likelihood (ML) analysis was determined via the automated model screening functionality of IQ-TREE v2.2.2.6 [36]. For maximum likelihood (ML) analysis, the optimal model of the thirteen PCGs is GTR + F + R3. Based on the Akaike Information Criterion (AIC), the partitioning schemes of the thirteen PCGs for Bayesian inference (BI) analysis were established via the application of PartitionFinder v2.1.1 [37]. For Bayesian inference analysis, The mitochondrial DNA dataset was partitioned into 11 evolutionary units based on gene-specific characteristics, with optimal nucleotide substitution models determined for each partition: mtDNA Cyt-b and ND1 (GTR + I + G + X), ND2 (GTR + I + G + X), COX1 (GTR + I + G + X), COX2 (GTR + I + G + X), ATP8 (GTR + I + G + X), ND4L and ATP6 (GTR + I + G + X), COX3 (GTR + I + G + X), ND3 (HKY + I + G + X), ND4 (GTR + I + G + X), ND5 (GTR + I + G + X), and ND6 (GTR + G + X). Bayesian inference was performed using MrBayes v3.2.7 [38] with two independent runs of two million generation each, sampling every 100 generations. Convergence of the MCMC runs was assessed using Tracer v1.7 [39], with diagnostic criteria set as follows: the average standard deviation of split frequencies < 0.01 and effective sample sizes (ESS) > 200 for all parameters. Thereafter posterior probabilities (PPs) were calculated from the combined samples of two independent runs, after the first 25% was discarded as burn-in. The tree topology was considered to have strong support of the PP was greater than 0.95. The ML tree was constructed using IQ-TREE v2.2.2.6 [36] with an ultra-fast bootstrap approximation of 4,000 replicates. Nodes with UFBoot support > 95% were considered to have strong support. Following this, the resulting phylogenetic trees were visualized and annotated using FigTree v1.4.4 (http://tree.bio.ed.ac.uk/software/figtree/ (22 December 2024)) and Microsoft PowerPoint 2010.

3. Results

3.1. Mitogenome Organization and Nucleotide Composition

The mitochondrial genome of T. roborowskii (16,649 bp) was sequenced and annotated, and compared with T. przewalskii (17,184 bp). The composition and the arrangement of mitochondrial genes in both species were found to be typical of most vertebrates (Figure 1, Supplementary Table S2). Each genome contained of thirteen PCGs, twenty-two tRNA genes, two rRNA genes (12S rRNA and 16S rRNA), and one non-coding region (the CR). Gene distribution analysis revealed strand asymmetry, with twenty-eight genes (including twelve PCGs, two rRNAs, and fourteen tRNAs) positioned on the heavy strand, while the remaining nine genes (ND6 and eight tRNAs) resided on the light strand. The length of the origin of light-strand replication (OL) is 27 bp in T. przewalskii and T. roborowskii (Figure 1; Supplementary Table S2).
The mitochondrial genes in both species are tightly arranged, with some genes overlapping and only a few very short intergenic regions present (Supplementary Table S2). In T. przewalskii, overlapping gene pairs include: tRNAIle-tRNAGln, tRNAGln-tRNAMet, COXI-tRNASer(ACU), ATP8-ATP6, ATP6-COXIII, ND4L-ND4, and ND5-ND6. Of these, only three overlaps (ATP8-ATP6, ATP6-COXIII, ND4L-ND4) are on the same strand. The longest sequence overlap is a 10 bp sequence shared between ATP8 and ATP6. In T. roborowskii, overlapping gene pairs are: tRNAIle-tRNAGln, tRNAGln-tRNAMet, COXI-tRNASer(CGA), ATP8-ATP6, ATP6-COXIII, ND4L-ND4, and ND5-ND6. Similar to T. przewalskii, only three pairs (ATP8-ATP6, ATP6-COXIII, ND4L-ND4) exhibit overlap on the same strand, with the most extensive overlap being 10 bp between ATP8 and ATP6.
Nucleotide composition, AT skew, and GC skew were calculated for the total mitogenomes, PCGs, rRNAs, tRNAs, and CR of both species (Table 1). The mean AT content of the two complete mitochondrial genomes is almost similar: 55.8% in T. przewalskii and 56.2% in T. roborowskii. Both mitochondrial genomes showed a marginally positive AT-skew and a slightly negative GC-skew.

3.2. PCGs and Codon Usage

The mitochondrial genomes of all Teratoscincus species that have been sequenced thus far contained 13 PCGs (ND2, COXI, COXII, ATP8, ATP6, COXIII, ND3, CYTB, ND5, ND4, ND4L, ND6, and ND1). The range in length of these genes is from 165 bp (ATP8) to 1812 bp (ND5). The total length of the PCGs is 11,367 bp in (T. przewalskii) and 11,340 bp in T. roborowskii. Twelve of these PCGs (ND2, COXI, COXII, ATP8, ATP6, COXIII, ND3, CYTB, ND5, ND4, ND4L, and ND1) are encoded on the majority (H-) strand, while ND6 is encoded on the minority (L-) strand. The start codons for the 13 PCGs in both T. przewalskii and T. roborowskii are primarily ATN (ATG, ATC, and ATA) and GTG. However, there are some differences in the usage of stop codons: the COXI in T. przewalskii uses AGG, while in T. roborowskii it uses AGA. The remaining genes typically use the standard TAN (TAG and TAA) stop codons. In addition, some genes have been observed to utilize incomplete termination codons, such as TA– and T––.
The nucleotide composition of the three codon positions (including incomplete stop codons) of the 13 PCGs was found to be consistent between T. przewalskii and T. roborowskii. The third codon position exhibited the highest AT content, with 61.1% in T. przewalskii and 61.2% in T. roborowskii. For the first and third codons, the most prevalent nucleotide was A, at 30% in T. przewalskii and 29.9% in T. roborowskii for the first position, and 38.5% in T. przewalskii and 37.8% in T. roborowskii for the third position. In the second codon position, the most prevalent nucleotide was T, with 40.1% in T. przewalskii and 40.3% in T. roborowskii. Conversely, the third codon position exhibited a significantly lower frequency G, at 5.4% in T. przewalskii and 6% in T. roborowskii. AT-skew and GC-skew analyses revealed nucleotide usage patterns across codons, indicating a higher frequency of A at the first and third codon positions, a higher frequency of T at the second position, and a higher frequency of C at all three positions (Supplementary Table S3). These patterns align with the high A + T content and apparent AT-skew observed in PCGs (Figure 2).
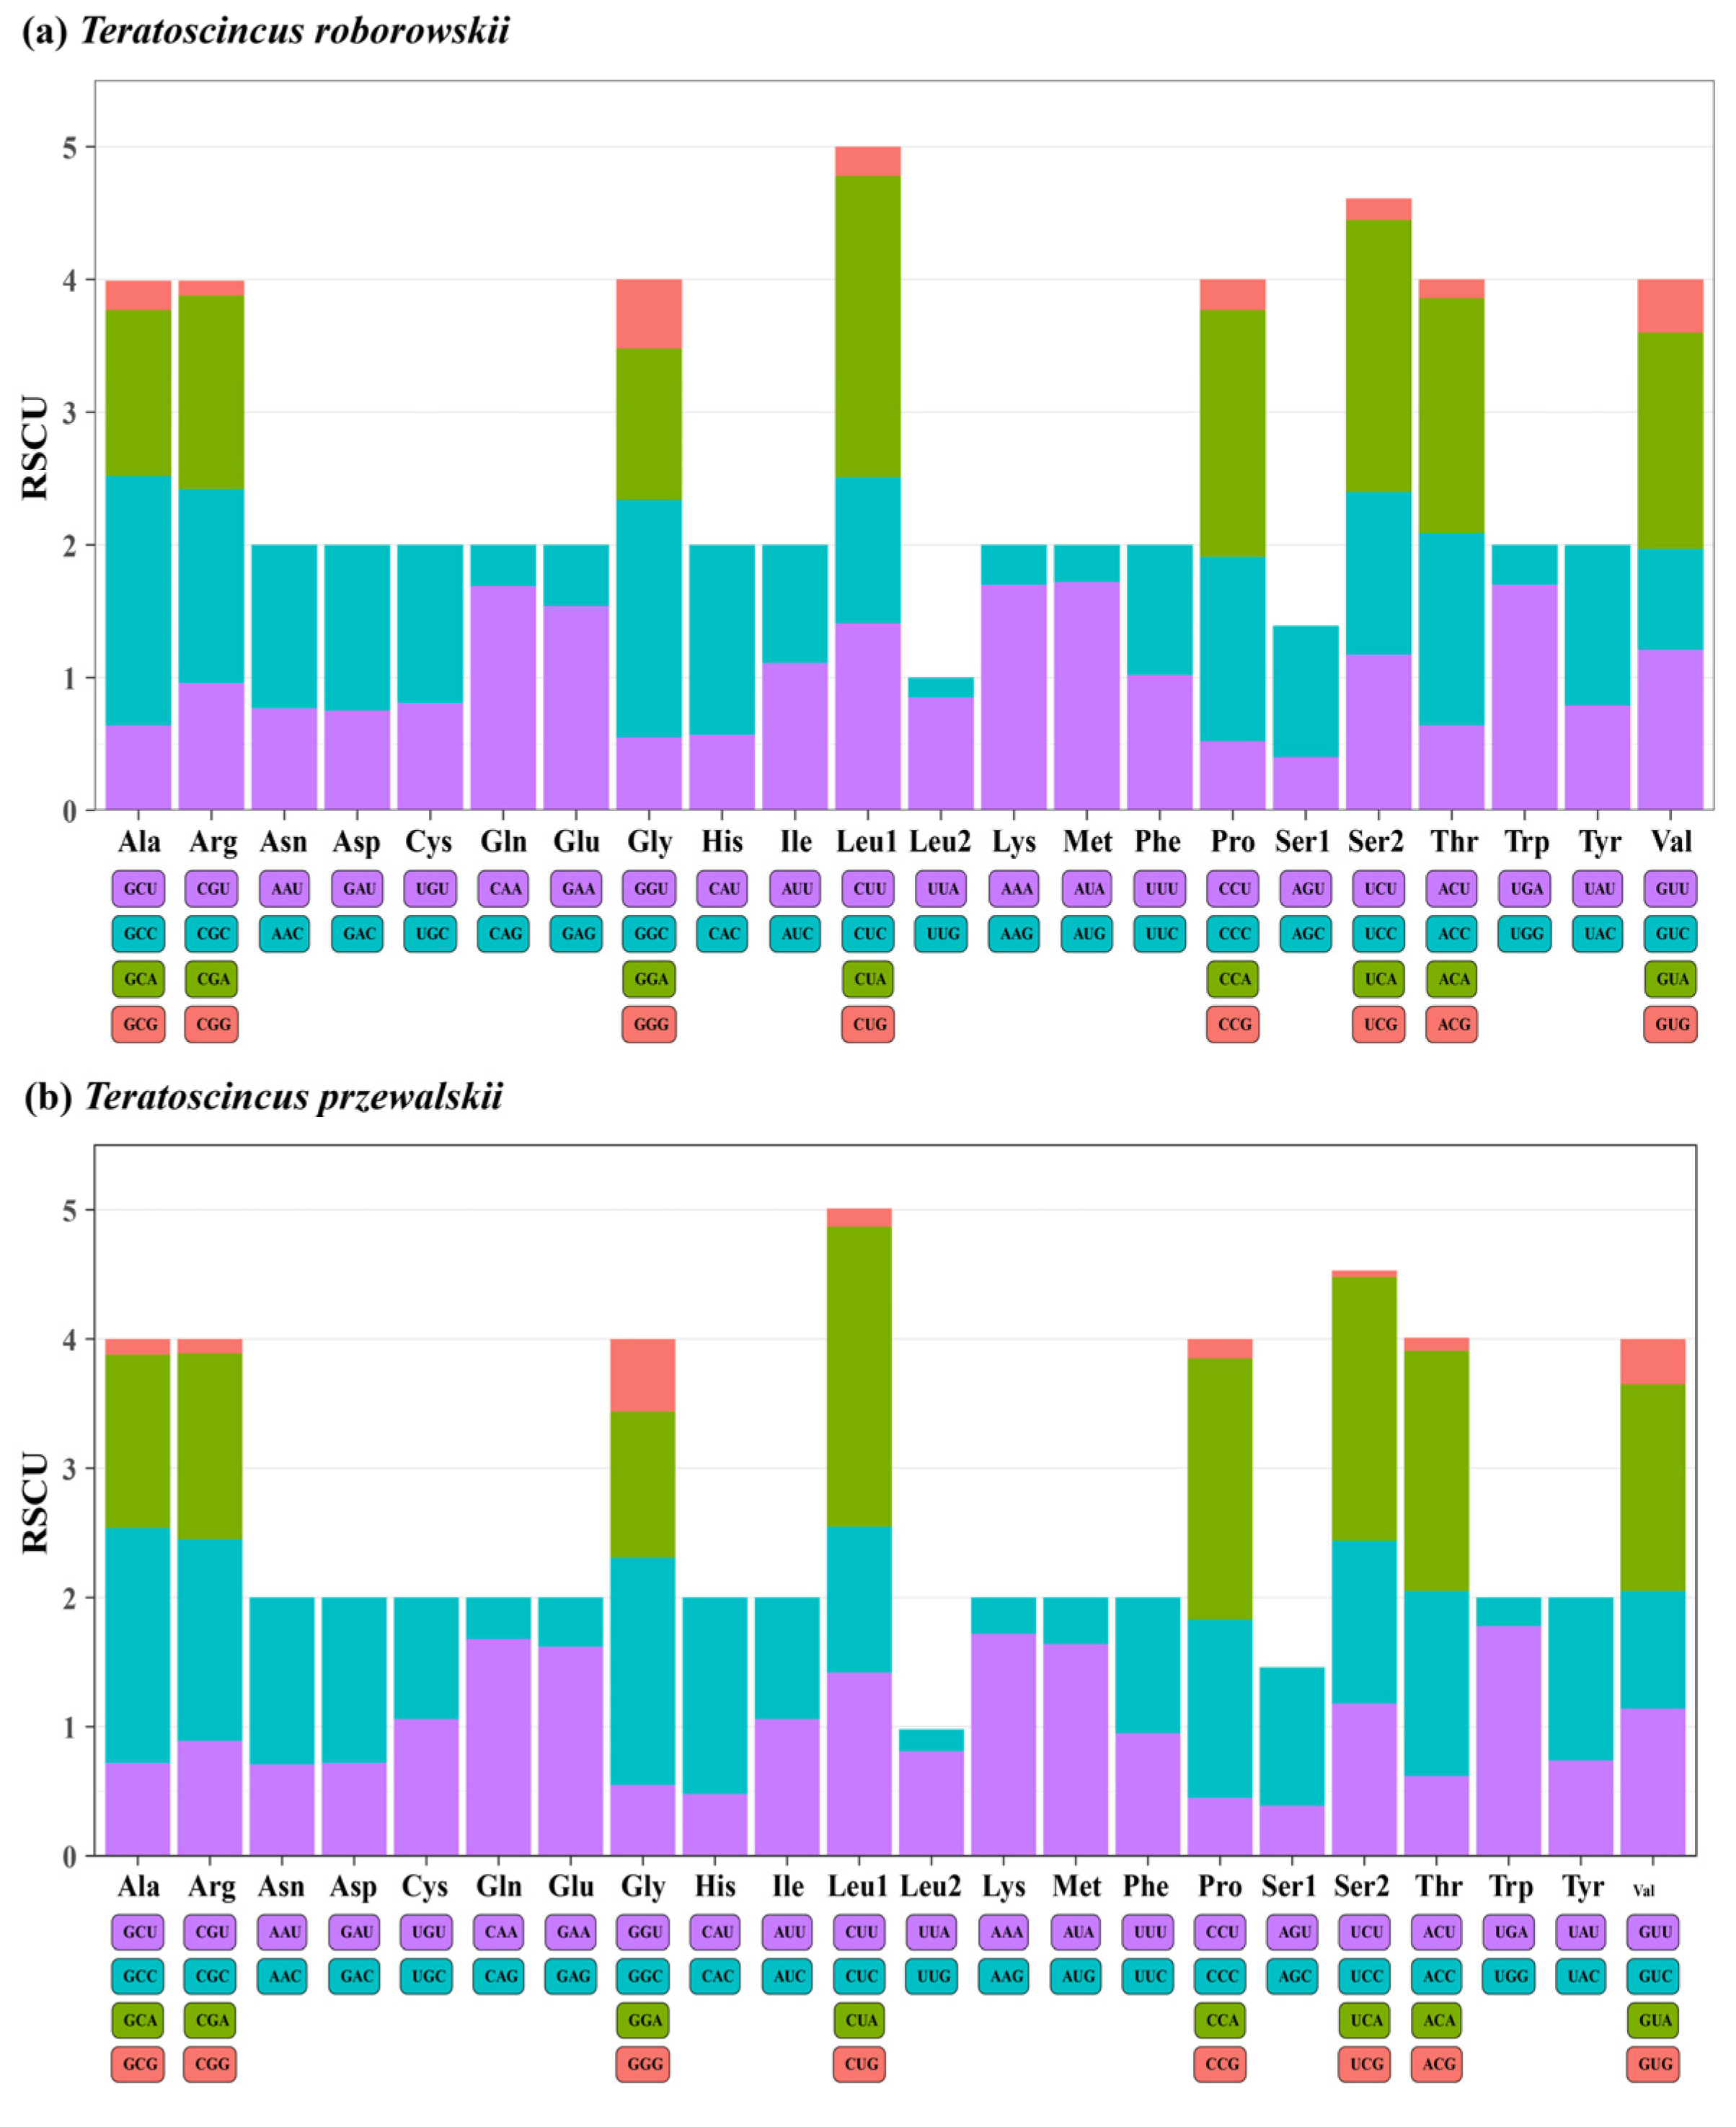
The most frequently used codon was CUA (Leu), representing 6.82% of codons in T. przewalskii and 6.64% in T. roborowskii. Other frequently used codons included ACA (Thr) at 4.79% in T. przewalskii and 4.5% in T. roborowskii, and AUA (Met) at 4.28% in T. przewalskii and 4.5% in T. roborowskii, CUU (Leu) at 4.18% in T. przewalskii and 4.13% in T. roborowskii, and AUU (Ile) at 3.99% in T. przewalskii and 4.26% in T. roborowskii. In contrast, the least commonly used codons were identified as CGG (Arg), UCG (Ser2), CCG (Pro), and AAG (Lys) (Figure 2). These results indicate a preference for codons ending with A/T (U) in the mitochondrial PCGs of Teratoscincus.
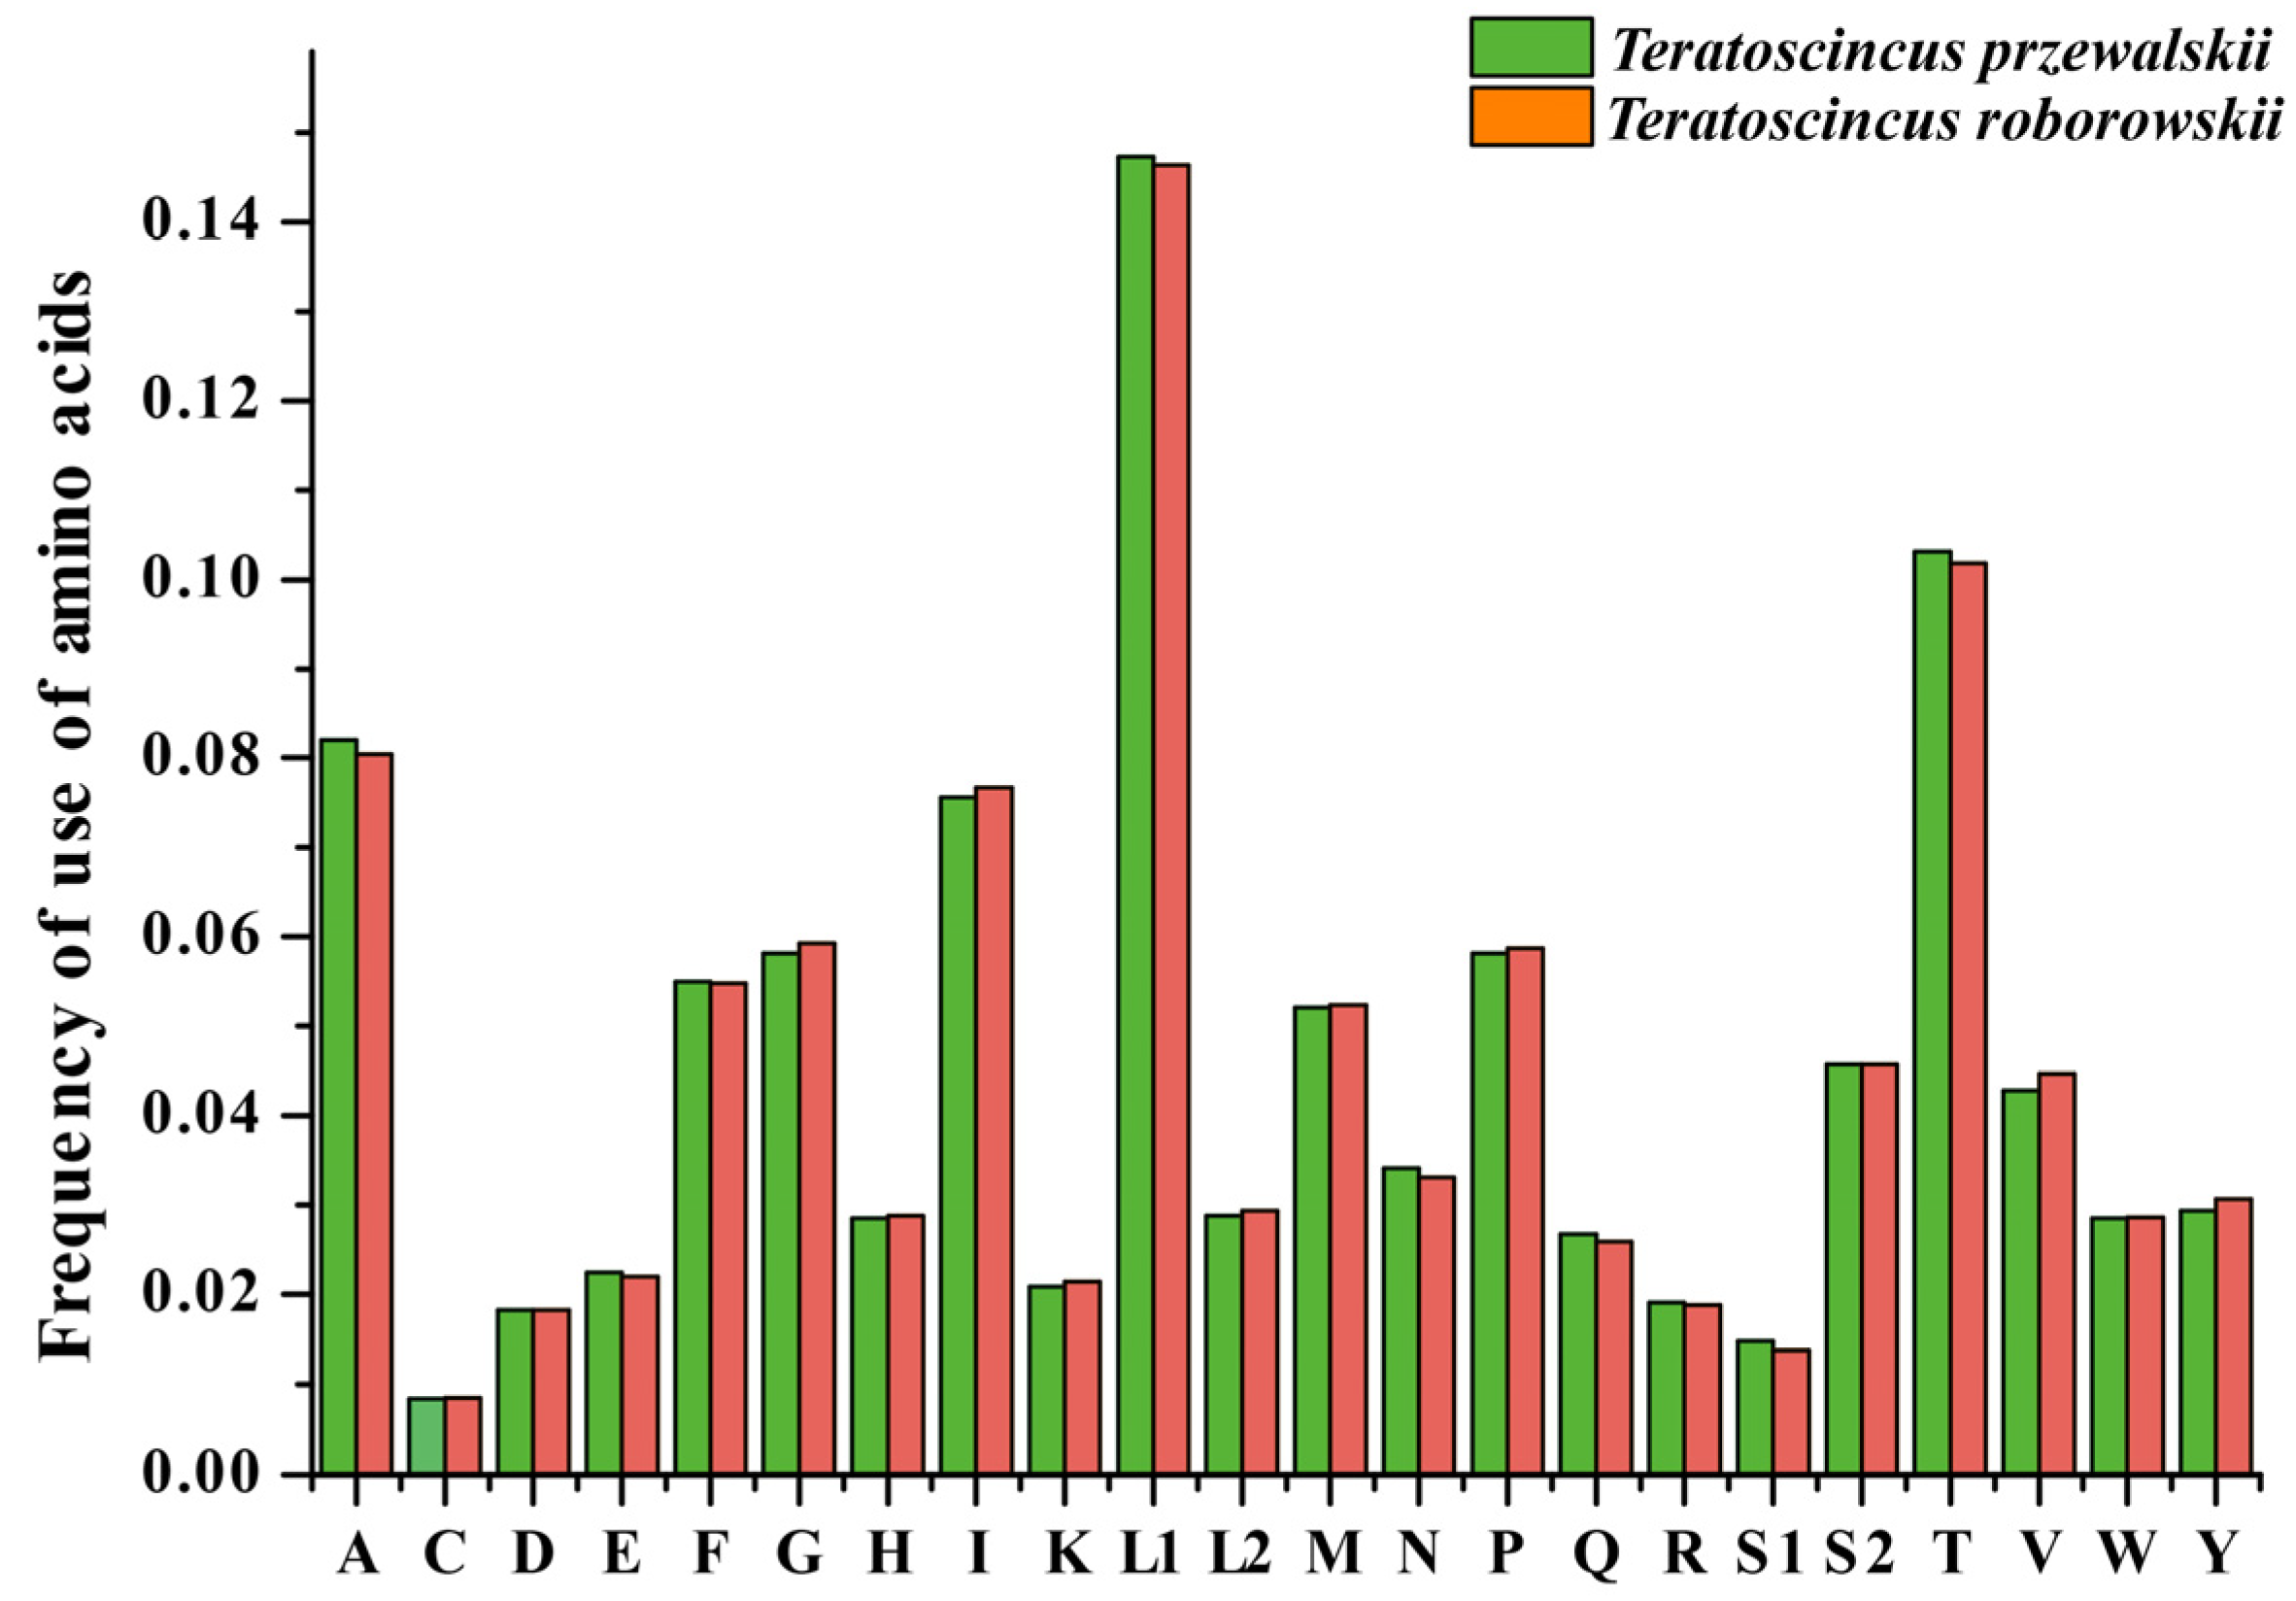
This tendency is further evidenced by the frequency of amino acid usage in these two species (see Figure 3), including Leucine (14.73% in T. przewalskii and 14.63% in T. roborowskii), Theonine (10.31% in T. przewalskii and 10.19% in T. roborowskii), Alanine (8.20% in T. przewalskii and 8.04% in T. roborowskii), and Isoleucine (7.56% in T. przewalskii and 7.67% in T. roborowskii). These findings highlight the evolutionary adaptation of Teratoscincus mitogenomes to elevated A/T content and AT-skew.

3.3. Comparative Analysis of Evolutionary Selection in Teratoscincus Species

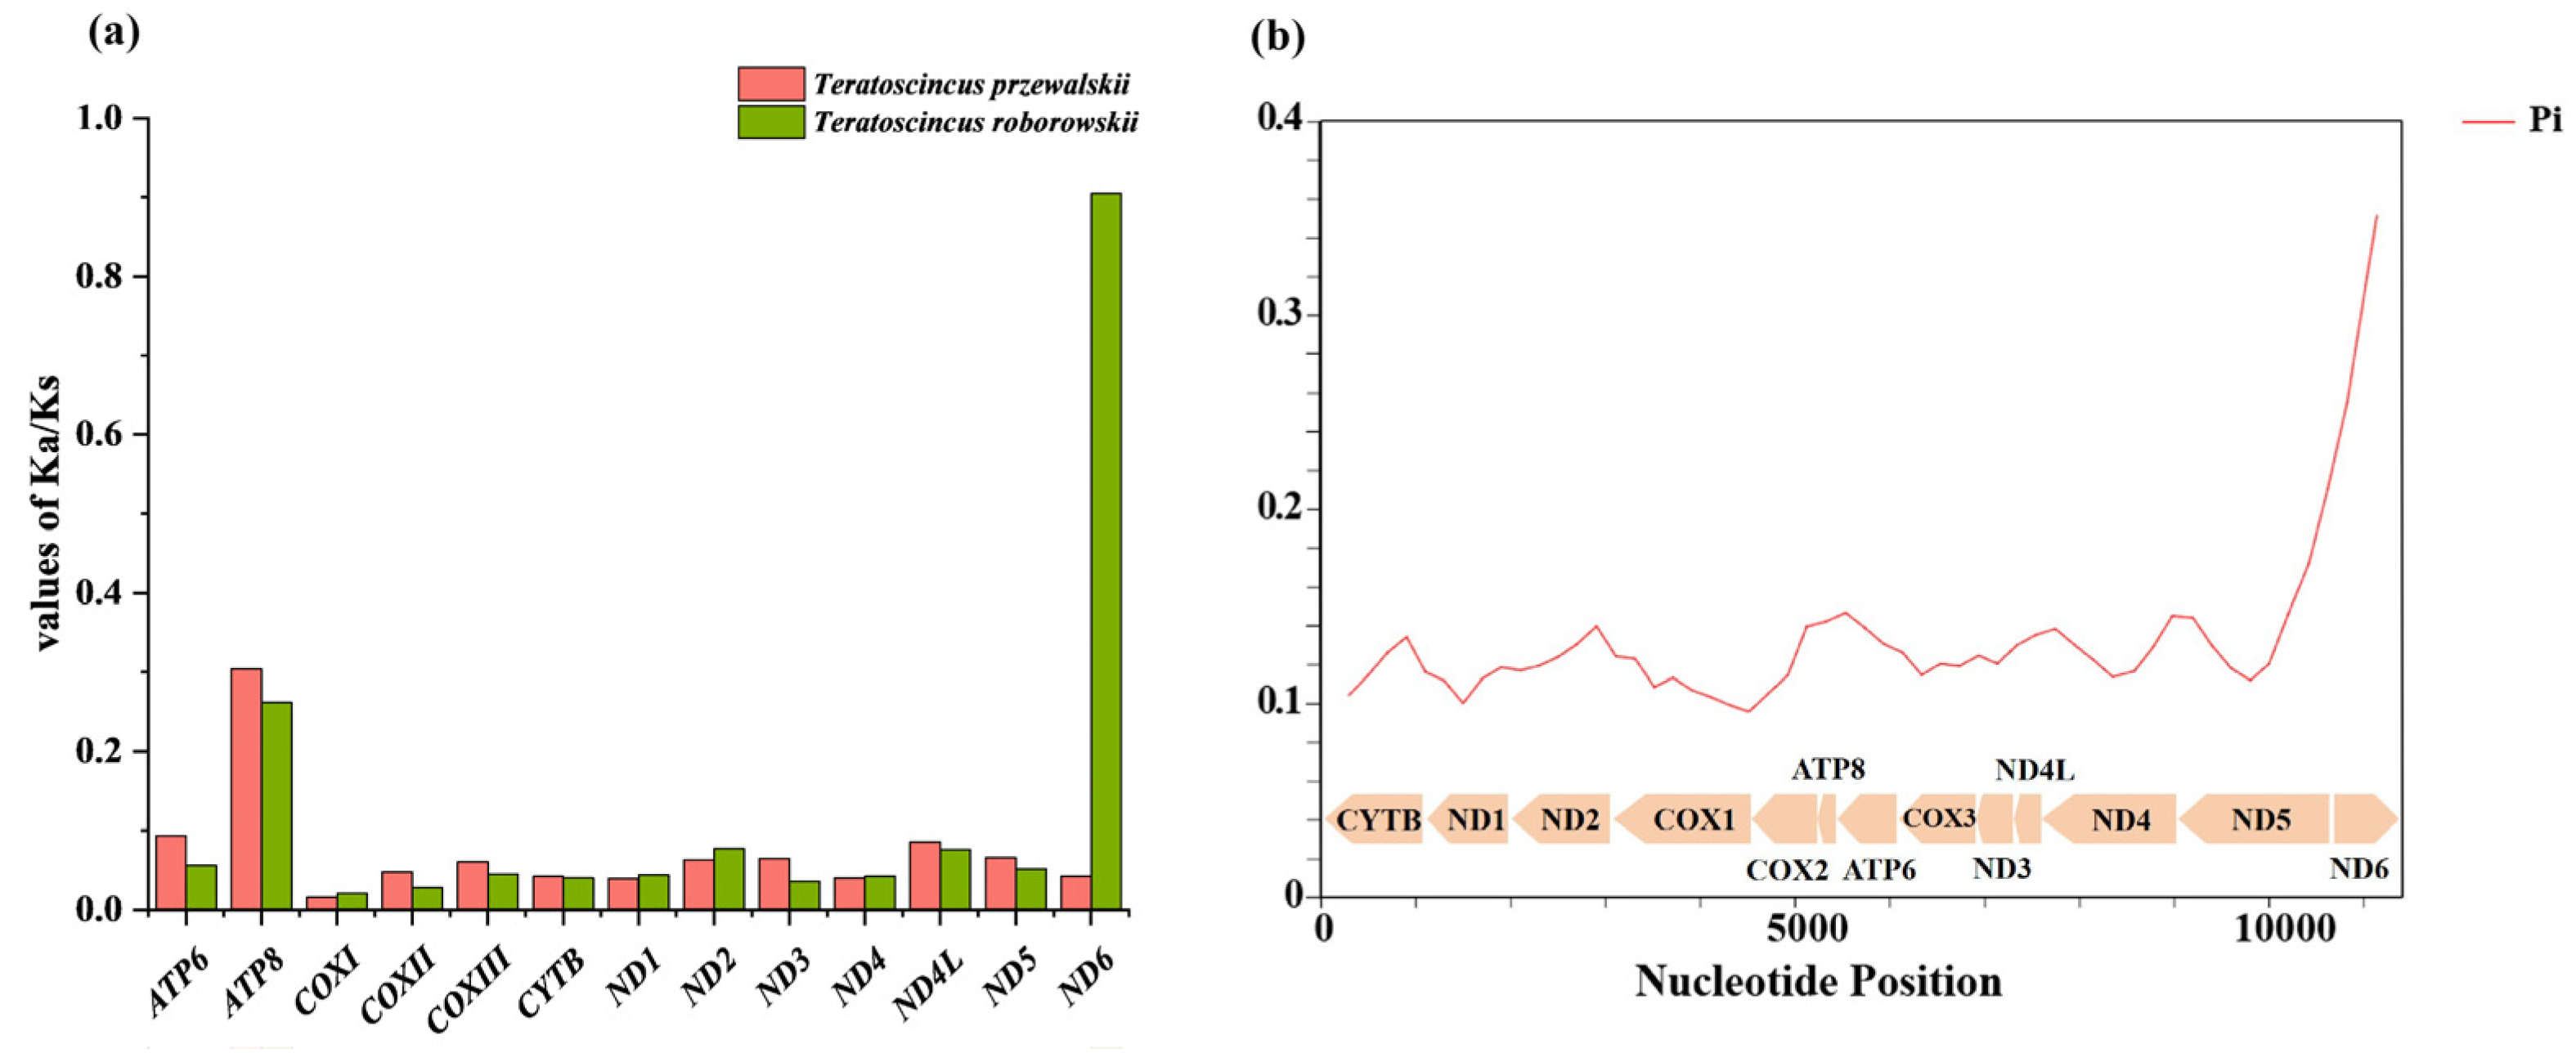
The values of Ka (the number of non-synonymous substitutions per non-synonymous site), Ks (the number of synonymous substitutions per synonymous site), and the Ka/Ks ratio were calculated for each PCG in T. przewalskii and T. roborowskii (Figure 4). The Ka/Ks ratio for all 13 PCGs was found to below 1.0, indicating that these genes are evolving under purifying selection [40]. However, a notable deviation from this pattern was observed in the Ka/Ks ratio of ND6, which exhibited a significantly different pattern between the two species. In T. roborowskii, the rates of synonymous and non-synonymous substitutions in the ND6 gene were almost identical. This finding indicates that the evolutionary rate of ND6 was faster in T. roborowskii compared to other mitochondrial PCGs. Furthermore, the presence of non-synonymous mutations in this gene suggests that they are likely to be functional alterations that may contribute to the species’ adaptation to its environment (Figure 4).
To further explore whether evolutionary selection for genetic preferences occurs in other species of Teratoscincus, a comparison was conducted of different species within the Teratoscincus (see Figure 4 and Figure 5). A sliding window analysis of nucleotide diversity (Pi) across the PCGs of the genus Teratoscincus revealed significant variation (Figure 4). The average Pi value of each gene ranged from 0.110 (ND1) to 0.309 (ND6). Specifically, ND6 had the highest Pi value of 0.309, while ATP8, ATP6, and ND5 exhibited the relatively higher Pi values of 0.144, 0.140 and 0.140, respectively. Conversely, ND1, COXI, and COXII had the lowest Pi values of 0.110, 0.111, and 0.114, respectively. These findings indicate that ND6 and ATP8 are highly variable genes, while COXI and COXII are more conserved within the genus.
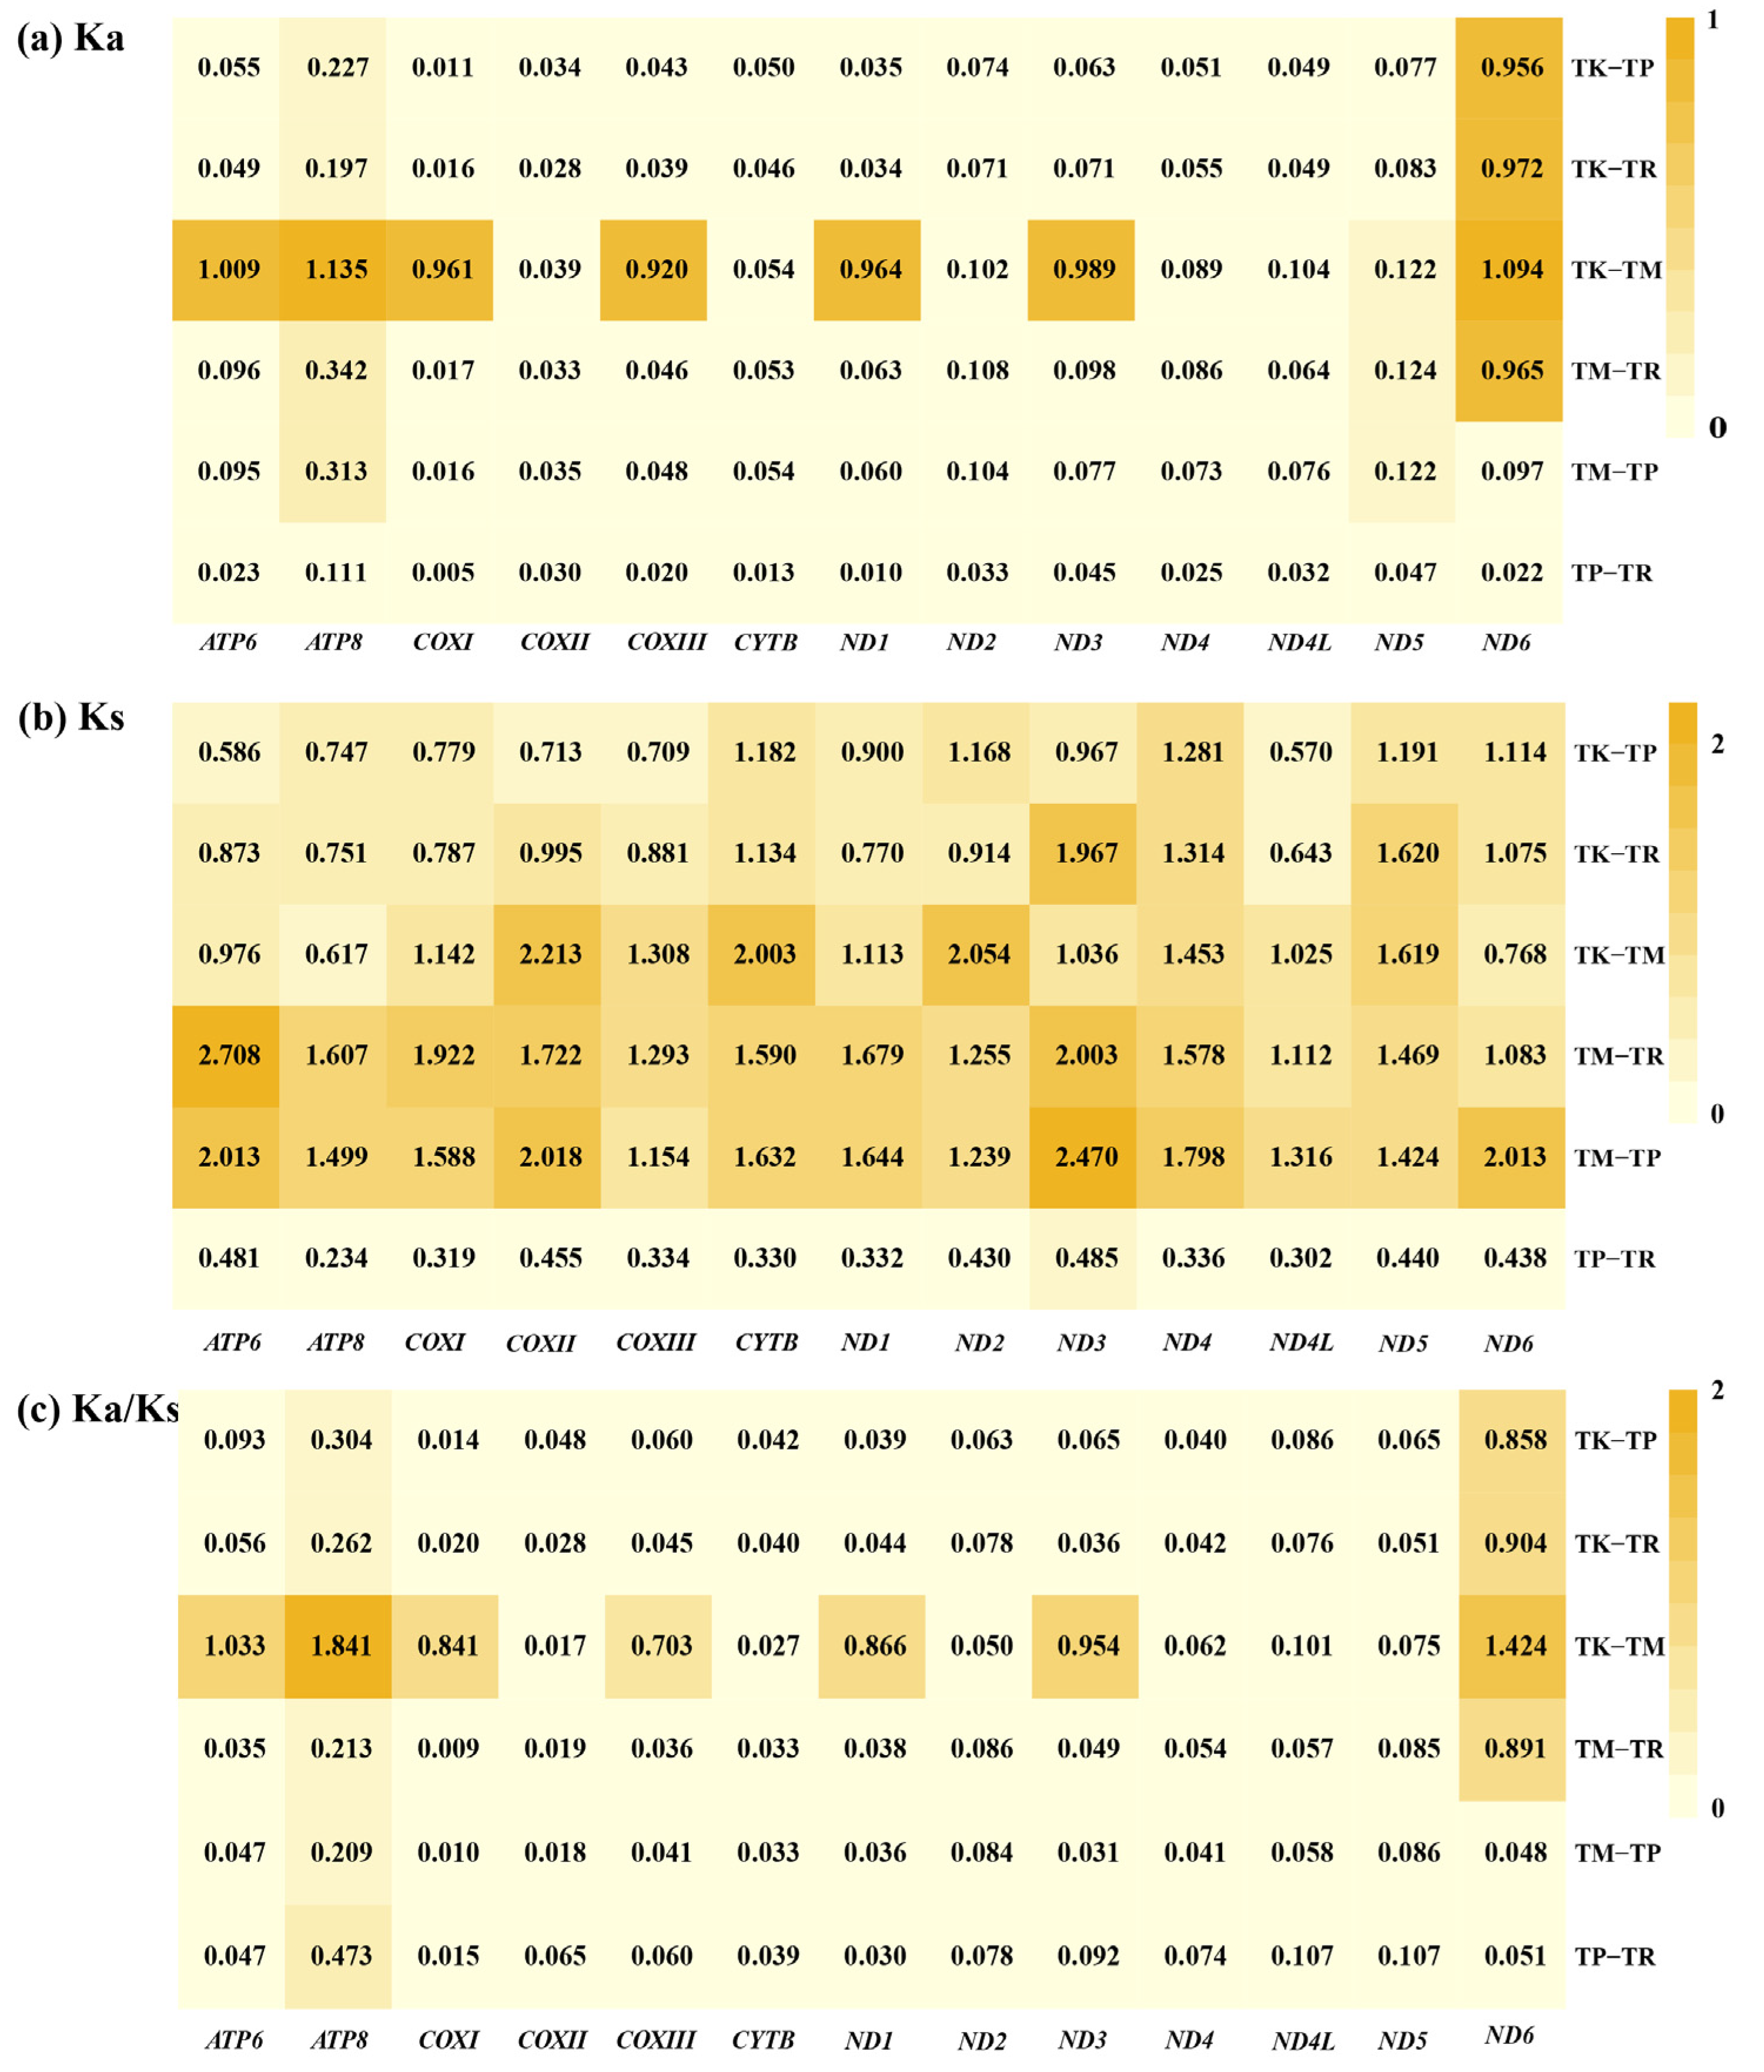
A further investigation into the Ka/Ks values of four wonder geckoes (Figure 5) revealed significant variability. T. keyserlingii and T. microlepis exhibited relatively high variability in most PCGs, likely due to their distant affinities. ATP8 and ND6 consistently showed higher Ka/Ks ratios, indicating faster evolutionary rates, while COXI and COXII exhibited lower Ka/Ks ratios, suggesting slower evolutionary rates and stronger purifying selection.
Overall, the results suggest that ATP8 and ND6 are fast-evolving genes, potentially driven by adaptive selection or relaxed constraints. In contrast, COXI and COXII exhibited slower evolutionary rates, suggesting their function is subjected to strong purifying selection, likely in order to maintain essential physiological processes. This comparative analysis highlights the diverse evolutionary dynamics within the Teratoscincus mitochondrial genome.

3.4. AT/GC-Skew Analysis in Teratoscincus Species

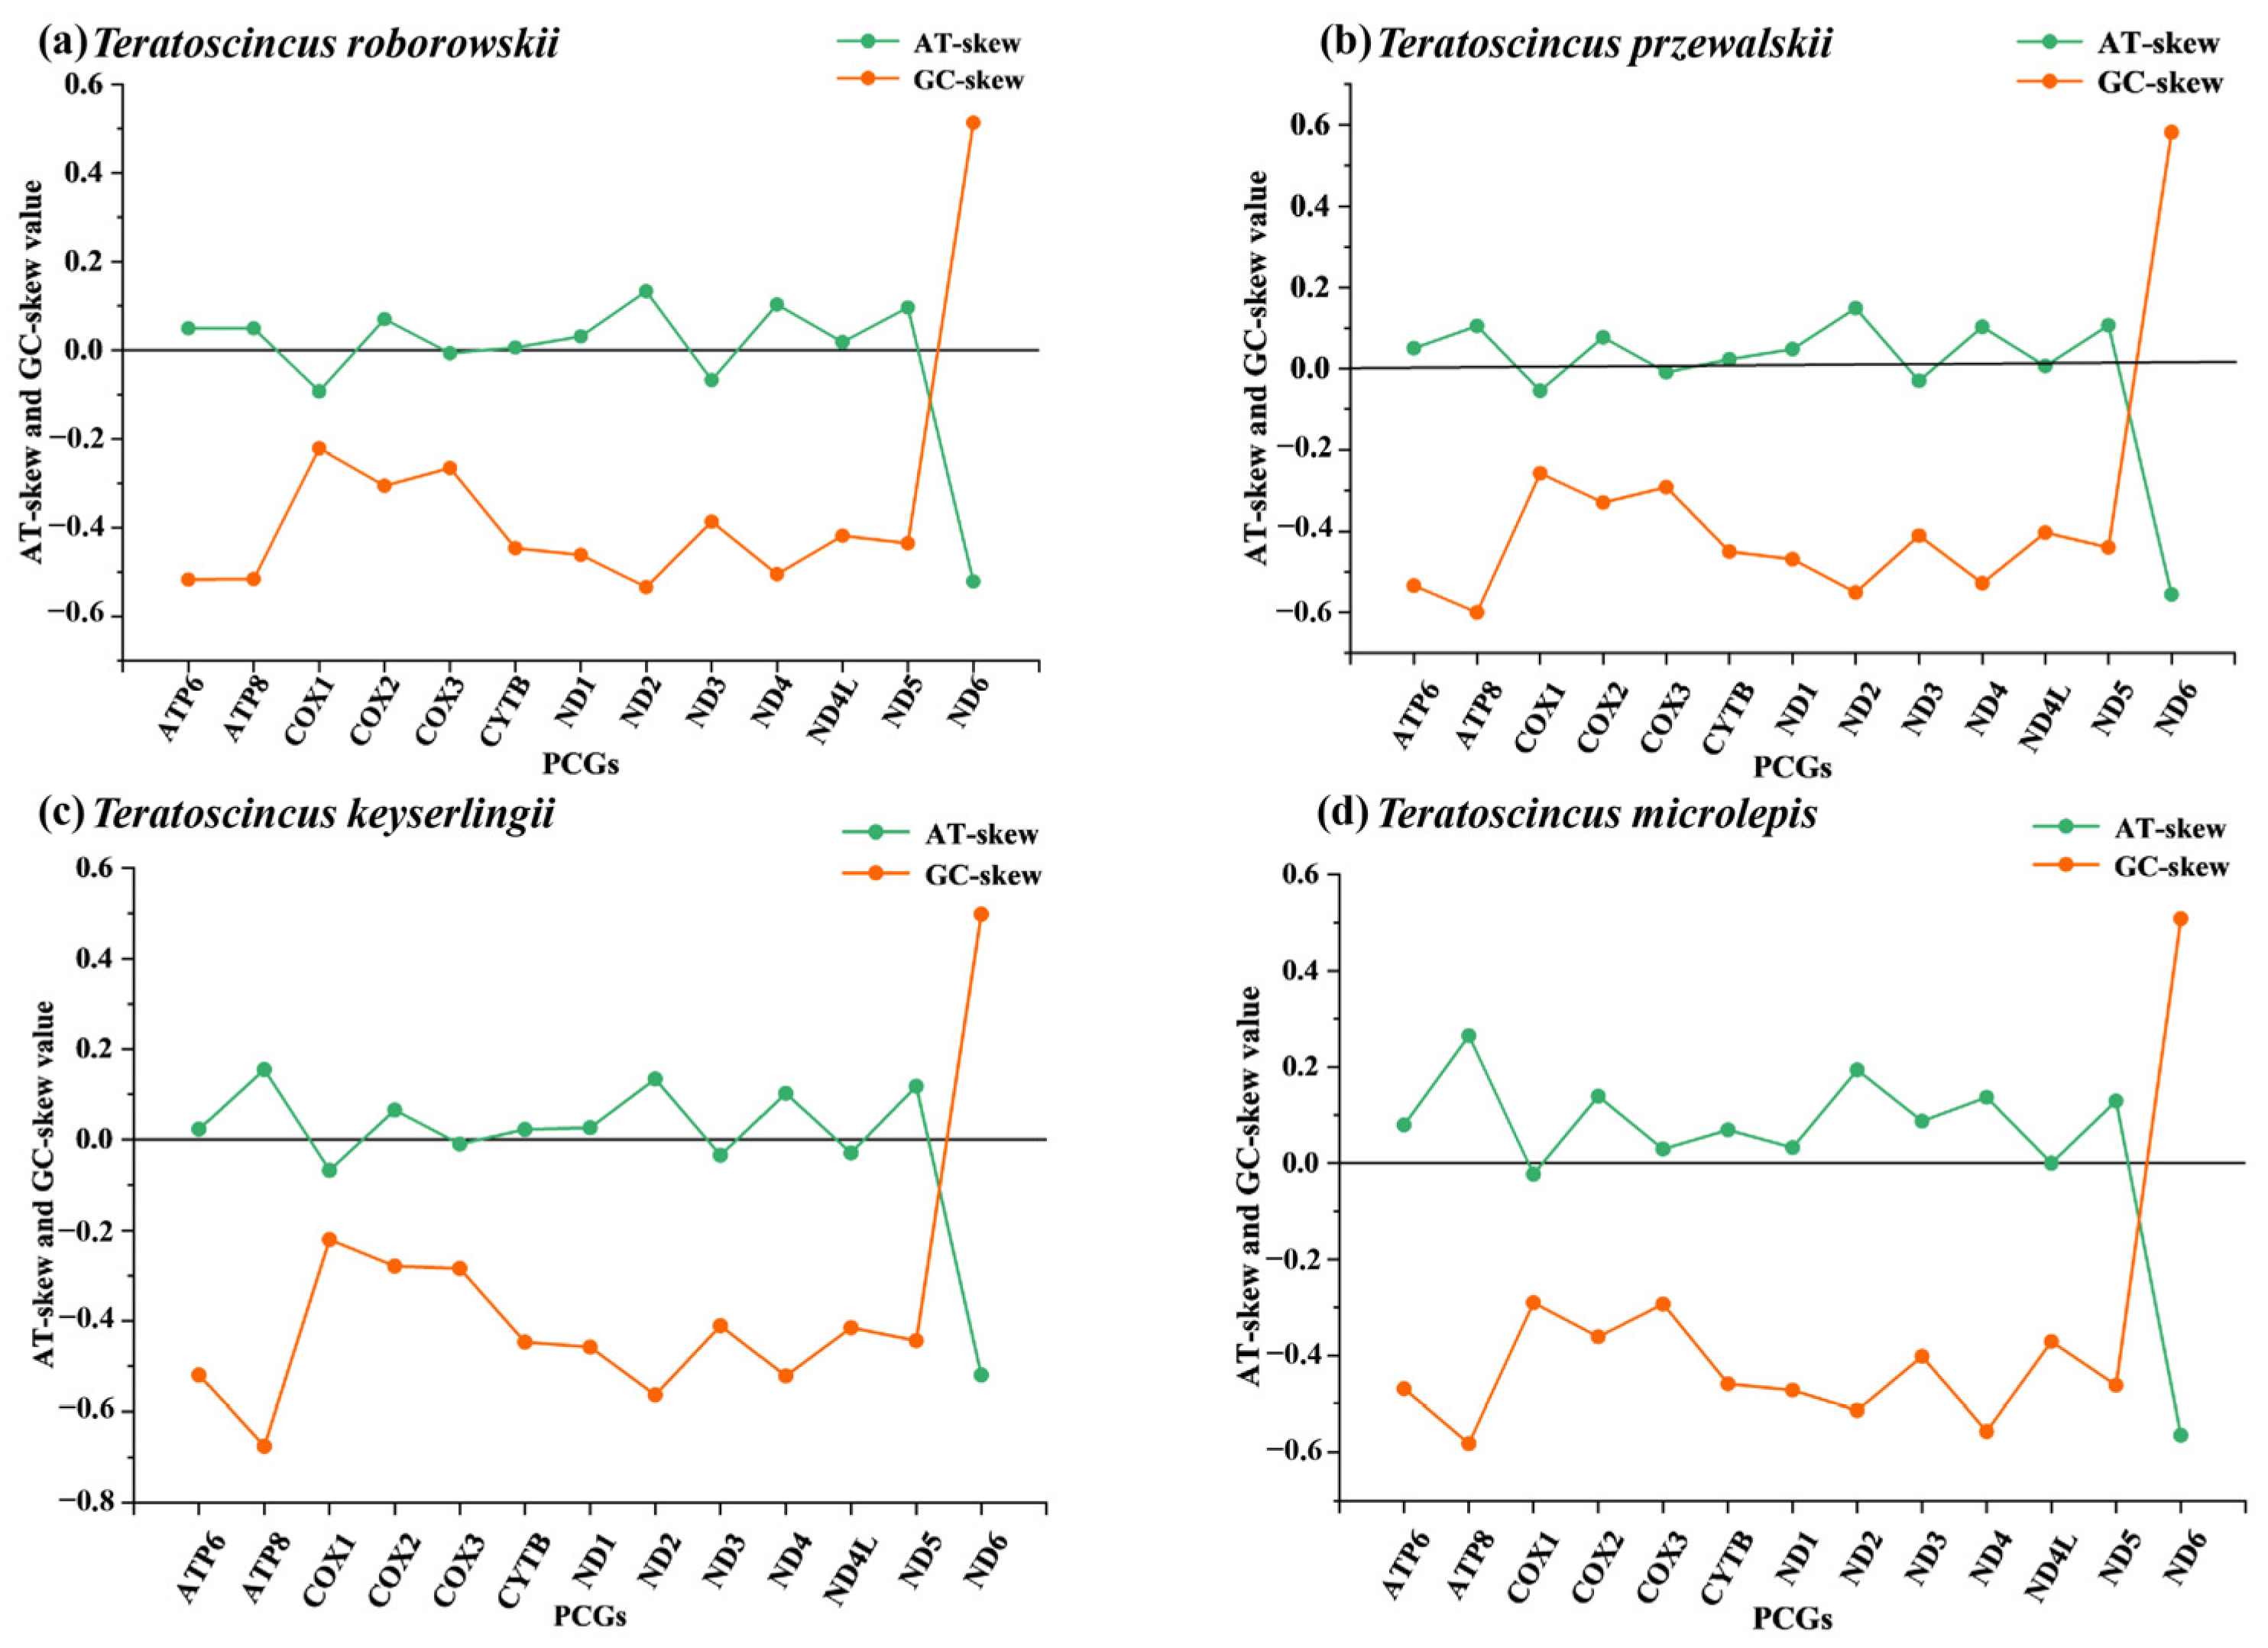
Furthermore, the AT/GC-skew of four different species within the genus Teratoscincus was analyzed (Figure 6). The results showed that most of the AT-skew and GC-skew values of the four species in the genus Teratoscincus were negative. The content of T and C in the PCGs was greater than that of A and G. The difference in content between A and T was relatively small, while the difference in content between G and C was large, indicating an obvious GC bias and a slight AT bias. Among the four species of Teratoscincus, the variation between AT-skew and GC-skew was most evident in the ND6 gene, followed by ATP8 and ND2. This substantial fluctuation in AT/GC-skew in ND6, ATP8, and ND2 is presumably associated with the selective and mutational pressures acting on these genes.

3.5. Driver of Codon Usage Bias in Teratoscincus Species

In order to further investigate the influencing factors of the codon usage bias, an analysis was conducted of the correlation between the GC content at the third codon positions of the synonymous codon and the effective number of codons (ENC). The distribution of the data points along the standard curve indicates that the codon bias is yielded by mutation. Otherwise, if the points are observed to be distributed away from the standard curve, this suggests that the codon bias is predominantly shaped by natural selection rather than mutation bias. The results obtained from the analysis of the PCGs of T. przewalskii and T. roborowskii indicated that their distribution was mostly distributed away from the standard curve. This finding suggests that the formation of codon preference in both wonder gecko species was mainly influenced by natural selection, and not only by mutation bias (see Figure 7).

3.6. Phylogenetic Relationships

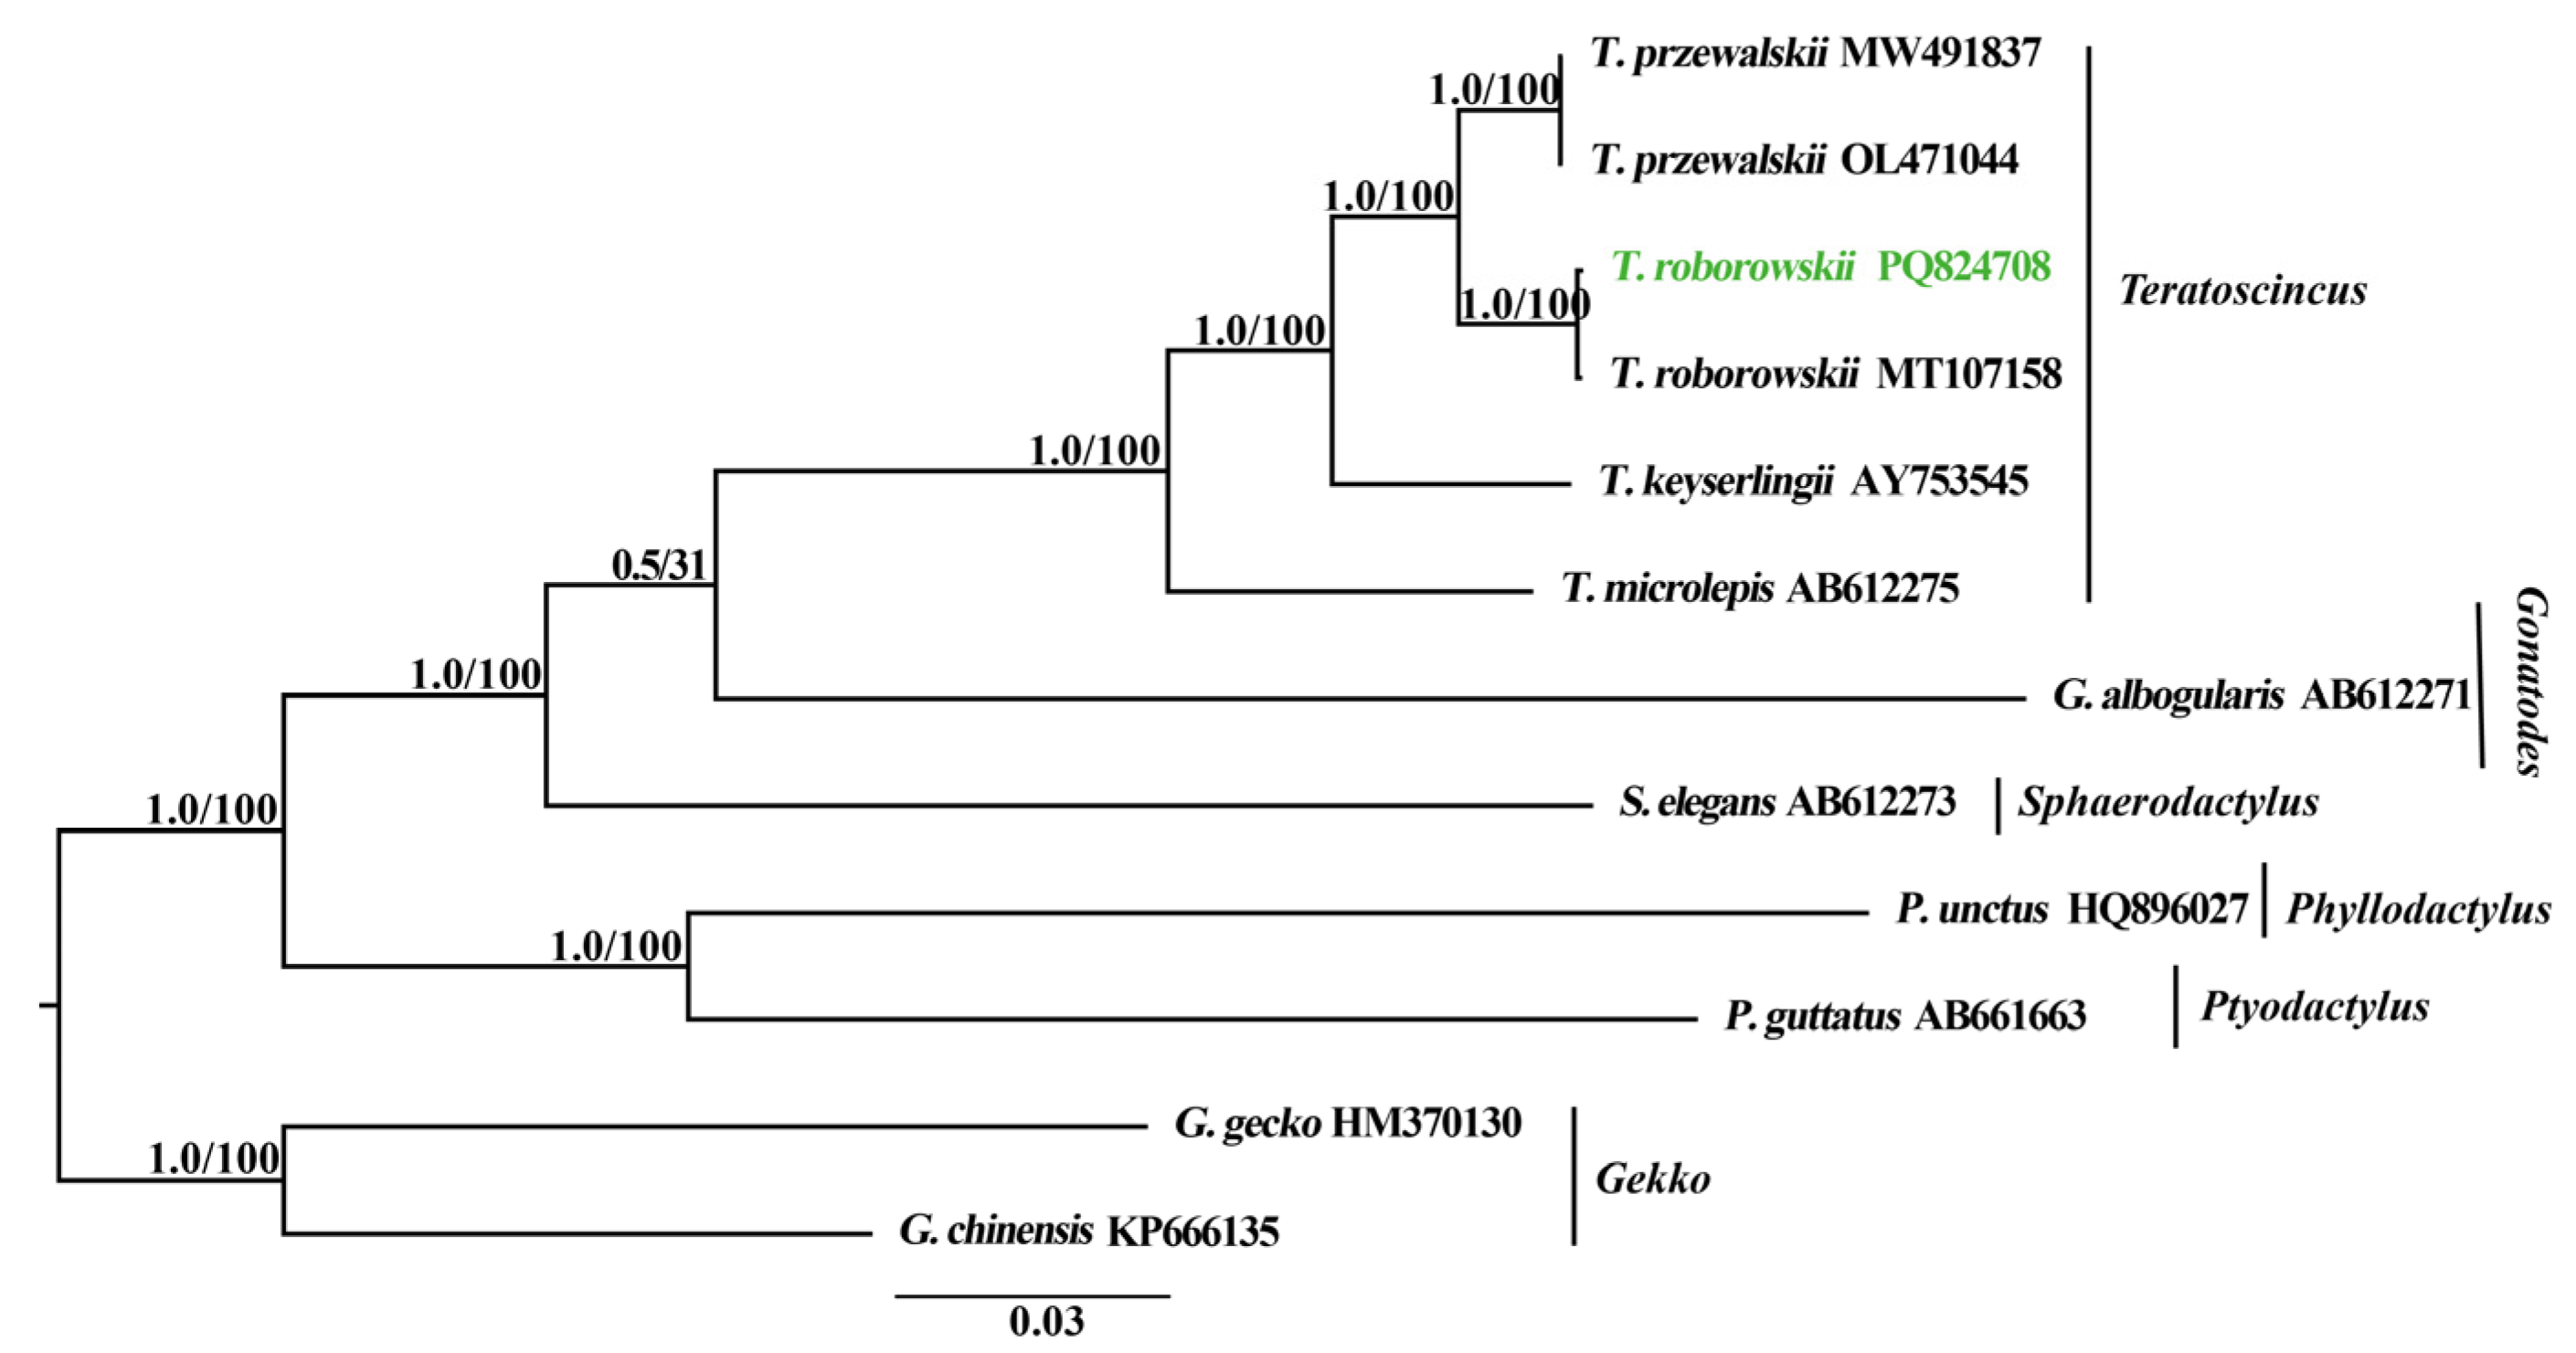
The results of the BI and ML approaches presented a consistent topological structure (Figure 8). The posterior probability (PP) values of the BI tree and the UFBoot values of the ML tree are shown in Figure 8. Consistent with previous studies [3,4], the phylogenetic tree obtained in this study confirms the monophyly of Sphaerodactylidae, Phyllodactylidae, and Gekkonidae. This result aligns with those of Pyron et al. [41], where Gekkonidae and Phyllodactylidae are sister clades, while Sphaerodactylidae is independent of this sister group. Within Sphaerodactylidae, Teratoscincus forms a distinct clade. T. przewalskii and T. roborowskii are sister species with strong support (PP = 1.0; UFBoot = 100; [1,42]). However, due to lower support value, the sister relationship between Gonatodes and Teratoscincus remains unresolved (PP < 0.95; UFBoot < 50).

4. Discussion

4.1. Mitochondrial Genome Organization and Composition

The analysis revealed that the number and order of genes in the mitochondrial genomes of T. przewalskii and T. roborowskii were consistent with the typical mitochondrial genomes of vertebrates. In accordance with the majority of vertebrates, the mitochondrial genomes of T. przewalskii and T. roborowskii comprise thirteen PCGs (ATP6, ATP8, COI-III, ND1-6, ND4L, and CYTB), two rRNAs, twenty-two tRNAs, and two non-coding regions (the control region (D-loop) and origin of replication on the light-strand (OL)). No gene rearrangement was identified, suggesting that genes within the genus Teratoscincus may exhibit a high degree of conservation. This specific mitochondrial genome feature has previously been observed in mammals, arthropods, and some reptiles [43,44,45,46,47]. Among the PCGs, the majority were encoded on the heavy strand, with the exception of ND6, which was located on the light strand. The existence of varying degrees of genetic overlap between genes of the two species has been demonstrated, enabling a limited number of base loci to carry more genetic information.
The mitochondrial genes of T. przewalskii and T. roborowskii showed a positive AT-skew and a negative GC-skew, including PCGs, tRNA, rRNA, and the CR. A similar pattern was observed in other species of the genus Teratoscincus, which exhibited a slight positive AT-skew and a strong negative GC-skew, indicating the clear bias towards the utilization of A and T in the genus Teratoscincus.
RSCU analysis of the two species also exhibited higher RSCU values ending in A/U than those ending in G/C, suggesting a bias in the utilization of A and T in relative synonymous codons. Chen et al. [48] hypothesized that this base usage preference may result from the adaptive evolution of the mitochondrial genome or a compositional preference for high A/T ratios. In addition, it has been shown that AT-bias exists to varying degrees in most reptile families [1,43]. Hassanin et al. [49] hypothesized that this preference for the composition of the A/T nucleotides may be influenced by certain selective pressures, such as mutational pressures and natural selection pressures. Furthermore, incomplete termination codons, including a single T, or an incomplete TA, have also appeared in the two species. Ojala et al. [50] demonstrated that this phenomenon of incomplete termination codons may exert crucial effects on cleavage, transcription, and polyadenylation of multiple cis- and trans-transcripts.

4.2. Selection Pressure on PCGs

The purifying selection of PCGs has been recognized as a prevalent phenomenon in most postnatal animals [51]. The present study utilized the Ka/Ks value as a metric to analyze the pressure on mitochondrial PCGs. The Ka/Ks value of PCGs was less than 1 and distinct, suggesting that most of the genes were under purifying selection, and the existence of divergent functional constraints among the genes [52]. This finding suggests that the overall evolutionary trend is to retain mutations that do not change the function of the encoded amino acid. The lowest Ka/Ks value of the COXI may be at-tributed to the presence of functional sites associated with species survival adaptations that evolve more slowly [21]. Such as Castoe et al.’s study showed that the COXI gene could be intricately linked to the broader context of convergent molecular evolution, particular in snakes and agamid lizards [53]. Conversely, the Ka/Ks value of the ND6 of T. roborowskii was considerably higher than that observed in T. przewalskii, approaching 1. This finding suggests that the rates of non-synonymous and synonymous substitutions of the ND6 in T. roborowskii were converging. It is hypothesized that differences in the selection pressures acting on the PCGs between the two species may contribute to the maintenance of non-synonymous substitutions at optimal rates. This may further facilitate moderate species differentiation and prevent the occurrence of fitness reduction due to excessive substitution [54,55].
Similarly, the pairwise mitochondrial genomes analysis of four Teratoscincus species also revealed that ND6 exhibited elevated rates of evolution, in conjunction with ATP8, which also exhibited similarly elevated rates of evolution of (Figure 6). This finding was further confirmed by the analysis of the nucleotide diversity (Pi) value of the PCGs. This suggests a high degree of mutational variation in ND6 among different species of the genus Teratoscincus, indicating that ND6 is a rapidly evolving gene. In the genus Teratoscincus, the ND6 gene likely plays a critical role in survival adaptation. This is supported by studies in toad-headed lizards (Phrynocephalus), where the ND6 gene exhibits signatures of positive selection during evolution, with selected sites mapping to functionally important structural domains. These findings suggest that ND6 may contribute to environmental adaptation mechanisms in Squamate reptiles [56]. The ND6 gene in T. roborowskii had a slower evolutionary rate compared to its counterpart in T. przewalskii (see Figure 5 and Figure 6). This finding suggests that, compared to other PCGs, ND6 experienced more relaxed selective constraints, which allowing for the accumulation of more mutations. A similar situation of selection pressure was observed in species of Ring-Necked Pheasant (Phasianus colchicus) [57], Dawkinsia filamentosa and Pethia nigrofasciata [58].

4.3. Evolutionary Dynamics of Mitochondrial Genes in Teratoscincus

The process of genetic drift and mutation are known to promote the evolution of mitochondrial genes, while purifying selection is responsible for maintaining their function [49]. AT/GC-skew is frequently considered a reliable indicator of the relative abundance of the various bases in mitochondrial DNA and of the evolutionary pressures [59]. As shown in Figure 5, ND6 and ATP8 had a greater fluctuation in AT/GC-skew values, suggests that natural selection and mutational pressure on these genes may differ significantly from those observed in other genes. Further exploration of the factors influencing codon usage bias in T. roborowskii and T. przewalskii indicated that the nucleotide bias situation in both wonder geckos was primarily influenced by natural selection [60,61]. Mitochondrial genomes are implicated in energy metabolism pathways and are subject to multiple environmental pressures in order to meet the metabolic requirements of a species in its environment. It has been demonstrated that certain environmental stresses can promote the adaptive evolution of mitochondrial genes [62]. Consequently, evolutionary selection often acts on environmentally relevant mitochondrial PCGs to enhance the likelihood of mitochondrial genome adaptation to new environments [62,63]. ND6 is located in the inner mitochondrial mem-brane and functions as the cofactor of NDH. It has been demonstrated that ND6 is in-volved in the catalysis of NADH dehydrogenase activity and also in the assembly of NADH to ubiquinone and the mitochondrial respiratory chain complex I [51,62].
T. przewalskii is a species of desert lizard and is widespread in arid desert dunes in northwestern China. In contrast, T. roborowskii is endemic to the Turpan Basin in Xinjiang [1,8], an area characterized by its extremely hot and arid environment [64]. A comparison of T. przewalskii and T. roborowskii reveals that the former exhibits a higher rate of non-synonymous substitutions in the ND6. It is hypothesized that the accelerated evolutionary rate may be attributable to more pronounced selective pressures experienced by T. roborowskii within its more distinct environmental conditions. This could drive rapid adaptation to ensure survival and reproduction. The increased rate of non-synonymous substitutions in ND6 gene may accelerate the fixation of favorable mutations and the elimination of unfavorable ones, allowing the species to adapt to these stronger selective pressures [65]. Consequently, the evolution of the mitochondrial genomes of T. przewalskii and T. roborowskii displays their differential niche adaptation strategies. ND6 gene in both T. przewalskii and T. roborowskii has undergone the various degrees of purifying selection. Consequently, ND6 gene has the potential to serve as an important genetic marker in further population genetics studies, particularly those focusing on genetic differentiation and local adaptation [66].

4.4. Phylogeny of Teratoscincus

Phylogenetic analyses based on the complete mitochondrial genomes statistically recovered the higher-level relationships among Teratoscincus (Figure 8). In this study, the outgroup, Gekkonidae, and Phyllodactylidae were identified as sister clades, with Sphaerodactylidae forming a sister group to these families. This finding is in agreement with previous molecular studies [3,41].
Within Sphaerodactylidae, Teratoscincus forms a distinct clade, with T. roborowskii and T. przewalskii identified as sister species. This outcome is not in alignment with the conclusions Yu et al. [12] and Ma et al. [25], but it is in accordance with earlier studies on their phylogenetic systematics [2,23,42]. The observed discrepancy maybe due to the limited number of mitochondrial genomes from the genus Teratoscincus employed in constructing the phylogenetic tree, a factor that may have introduced a degree of bias into the results.

5. Conclusions

In this work, the mitochondrial genome of T. roborowskii was characterized, and comparative analyses were performed within the genus Teratoscincus. Our findings reveled that genome size, genome order, intergenic overlap, base composition, and codon usage were conserved among Teratoscincus species. However, most PCGs exhibited low evolutionary rates, with ATP8 and ND6 being exceptions, displaying faster rates. Of particular note was the finding that the ND6 gene in T. roborowskii had a significantly higher evolutionary rate compared to its counterpart in T. przewalskii, suggesting the presence of stronger selection pressures in the former. Phylogenetic analyses supported the independence of Pachypodidae and Teratoscincus, and confirmed the sister-taxon relationship between T. przewalskii and T. roborowskii. These results are in alignment with the majority of previous studies, but the necessity for additional mitochondrial genomes from diverse Teratoscincus taxa is highlighted to achieve greater clarify regarding the relationships between the various taxa. These findings promote our understanding of mitochondrial genome structure and selection pressures within the genus Teratoscincus, contributing to population genetic studies and enriching the mitochondrial gene pool.

Supplementary Materials

The following supporting information can be downloaded at: https://www.mdpi.com/article/10.3390/genes16050531/s1. Table S1: Taxon information of Sphaerodactylidae, Phyllodactylidae, and Gekkonidae species analyzed in this paper with GenBank accession numbers. Table S2. Characteristics of mitochondrial genomes of T. przewalskii and T. roborowskii. Table S3. AT-skew and GC-skew of mitochondrial genomes of T. przewalskii and T. roborowskii.

Author Contributions

Conceptualization, J.L. and X.G.; Methodology, D.Z.; Software, D.Z. and R.M.; Validation, J.L. and D.Z.; Formal analysis, D.Z. and R.M.; Investigation, X.G. and J.L. Resources, X.G. and J.L.; Data curation, D.Z.; Writing—original draft preparation, D.Z.; Writing—review and editing, J.L. and X.G.; Visualization, D.Z.; Supervision, J.L. and X.G.; Project administration, J.L.; Funding acquisition, J.L. and X.G. All authors have read and agreed to the published version of the manuscript.

Funding

This research was funded by the Science and Technology Department of Xinjiang Uygur Autonomous Region (Grant No. 2021D01C063), and the National Natural Science Foundation of China (Grant No. 32460126) for J.L., and partly by the Science and Technology Department of Sichuan Province (Grant No. 2025ZNSFSC0249) for X.G.

Institutional Review Board Statement

The animal study protocol was approved by the Animal Protection and Utilization Committee of Chengdu Institute of Biology, Chinese Academy of Sciences (license number: CIB-20160767) on 8 March 2016.

Informed Consent Statement

Not applicable.

Data Availability Statement

The data supporting the results of this study can be found in the manuscript. The sequences generated during this study have been deposited in GenBank (https://www.ncbi.nlm.nih.gov/genbank/ (accessed on 2 April 2025)) under accession numberPQ824708.

Acknowledgments

We would like to express our gratitude to Yongfei He for his assistance in the fieldwork, specifically with regard to the collection of samples.

Conflicts of Interest

The authors declare no conflicts of interest. The funders had no role in the design of the study; in the collection, analyses, or interpretation of data; in the writing of the manuscript; or in the decision to publish the results.

References

  1. Macey, J.R.; Wang, Y.; Ananjeva, N.B.; Larson, A.; Papenfuss, T.J. Vicariant patterns of fragmentation among gekkonid lizards of the genus Teratoscincus produced by the Indian collision: A molecular phylogenetic perspective and an area cladogram for Central Asia. Mol. Phylogenet. Evol. 1999, 12, 320–332. [Google Scholar] [CrossRef]
  2. Macey, J.R.; Fong, J.J.; Kuehl, J.V.; Shafiei, S.; Ananjeva, N.B.; Papenfuss, T.J.; Boore, J.L. The complete mitochondrial genome of a gecko and the phylogenetic position of the Middle Eastern Teratoscincus keyserlingii. Mol. Phylogenet. Evol. 2005, 36, 188–193. [Google Scholar] [CrossRef]
  3. Gamble, T.; Bauer, A.M.; Greenbaum, E.; Jackman, T.R. Evidence for Gondwanan vicariance in an ancient clade of gecko lizards. J. Biogeogr. 2008, 35, 88–104. [Google Scholar] [CrossRef]
  4. Sindaco, R.; Jeremcenko, V.K. The Reptiles of the Western Palearctic. Annotated Checklist and Distributional Atlas of the Turtles, Crocodiles, Amphisbaenians and Lizards of Europe, North Africa, Middle East and Central Asia; Edizioni Belvedere: Latina, Italy, 2008. [Google Scholar]
  5. Akbarpour, M.; Shafiei, S.; Sehhatisabet, M.E.; Damadi, E. A new species of frog-eyed gecko, genus Teratoscincus Strauch, 1863 (Squamata: Sphaerodactylidae), from southeastern Iran. Zool. Middle East 2017, 63, 296–302. [Google Scholar] [CrossRef]
  6. Wang, G.; Fan, Y.; Zhi, R.X.; Ar, L.P.; Li, S.Z.; Chen, X.R. A new species of Teratoscincus from Xinjiang China (Lacertilia: Gekkonidae). J. August 1st Agric. Coll. 1989, 4, 10–13, (In Chinese with English abstract). [Google Scholar]
  7. Uetz, P.; Freed, P.; Hosek, J. The Reptile Database. Available online: http://www.reptile-database.org (accessed on 20 December 2024).
  8. Shi, L.; Zhou, Y.H.; Yuan, H. On the dividing of the zoogeographical region of reptiles of Xinjiang Uygur Autonomous Region. Sichuan J. Zool. 2002, 21, 152–157. [Google Scholar]
  9. Li, H.M.; She, Y.; Hou, L.X.; Zhang, Y.; Guo, D.N.; Qin, X.M. The complete mitochondrial genome of Teratoscincus roborowskii (Squamata: Gekkonidae). Mitochondrial DNA Part A 2016, 27, 1916–1917. [Google Scholar] [CrossRef] [PubMed]
  10. Song, Y.C.; Liu, Y.; Lin, Y.Y.; Liang, T.; Shi, L. Burrow characteristics and microhabitat Use of the Turpan Wonder Gecko Teratoscincus roborowskii (Squamata, Gekkonidae). Stud. Asian Amphib. Reptiles 2017, 18, 61–69. [Google Scholar]
  11. Semenov, D.V.; Borkin, L.J. On the ecology of Przewalsky’s Gecko (Teratoscincus przewalskii) in the Transaltai Gobi, Mongolia. Asiat. Herpetol. Res. 1992, 4, 99–112. [Google Scholar]
  12. Yu, H.; Liu, Y.; Liu, Y.; Yang, J.; Li, S.; Bi, J.; Zhang, R. Complete mitochondrial genome of Teratoscincus przewalskii (Reptilia, Squamata, Sphaerodactylidae) and phylogenetic analysis. Mitochondrial DNA Part B 2021, 6, 3166–3168. [Google Scholar] [CrossRef]
  13. Seligmann, H.; Anderson, S.C.; Autumn, K.; Bouskila, A.; Saf, R.; Tuniyev, B.S.; Werner, Y.L. Analysis of the locomotor activity of a nocturnal desert lizard (Reptilia: Gekkonidae: Teratoscincus scincus) under varying moonlight. Zoology 2007, 110, 104–117. [Google Scholar] [CrossRef] [PubMed]
  14. Wang, X.; Zhou, S.; Wu, X.; Wei, Q.; Shang, Y.; Sun, G.; Mei, X.; Dong, Y.; Sha, W.; Zhang, H. High-altitude adaptation in vertebrates as revealed by mitochondrial genome analyses. Ecol. Evol. 2021, 11, 15077–15084. [Google Scholar] [CrossRef] [PubMed]
  15. Wang, S.H.; Hu, S.Y.; Li, M.; Liu, M.; Sun, H.; Zhao, J.R.; Chen, W.T.; Yuan, M.L. Comparative mitogenomic analyses of darkling beetles (Coleoptera: Tenebrionidae) provide evolutionary insights into tRNA-like sequences. Genes 2023, 14, 1738. [Google Scholar] [CrossRef]
  16. Rehman, A.; Huo, Q.B.; Du, Y.Z. The first complete mitochondrial Genome of genus Isocapnia (Plecoptera: Capniidae) and phylogenetic assignment of superfamily Nemouroidea. Genes 2023, 14, 965. [Google Scholar] [CrossRef]
  17. Cameron, S.L. Insect mitochondrial genomics: Implications for evolution and phylogeny. Annu. Rev. Entomol. 2014, 59, 95–117. [Google Scholar] [CrossRef]
  18. Wang, I.C.; Lin, H.D.; Liang, C.M.; Huang, C.C.; Wang, R.D.; Yang, J.Q.; Wang, W.K. Complete mitochondrial genome of the freshwater fish Onychostoma lepturum (Teleostei, Cyprinidae): Genome characterization and phylogenetic analysis. Zookeys 2020, 1005, 57–72. [Google Scholar] [CrossRef]
  19. Boore, J.L. Animal mitochondrial genomes. Nucleic Acids Res. 1999, 27, 1767–1780. [Google Scholar] [CrossRef] [PubMed]
  20. Böhme, M.U.; Fritzsch, G.; Tippmann, A.; Schlegel, M.; Berendonk, T.U. The complete mitochondrial genome of the green lizard Lacerta viridis viridis (Reptilia: Lacertidae) and its phylogenetic position within squamate reptiles. Gene 2007, 394, 69–77. [Google Scholar] [CrossRef]
  21. Tian, L.; Yang, W.; Si, C.; Guo, X.; Zhang, B. Complete mitogenome analysis of five leafhopper species of Idiocerini (Hemiptera: Cicadellidae). Genes 2022, 13, 2000. [Google Scholar] [CrossRef]
  22. Shan, W.; Tursun, M.; Zhou, S.; Zhang, Y.; Dai, H. Complete mitochondrial genome sequence of Lepus yarkandensis Günther, 1875 (Lagomorpha, Leporidae): Characterization and phylogenetic analysis. Zookeys 2021, 1012, 135–150. [Google Scholar] [CrossRef]
  23. Li, J.; Guo, X.G. A complete mitogenome of the Przewalski’s Wonder Gecko (Teratoscincus przewalskii) from the Junggar Basin in Northwest China with its phylogenetic implications. Mitochondrial DNA Part B 2023, 8, 398–401. [Google Scholar] [CrossRef] [PubMed]
  24. Tarroso, P.; Simó-Riudalbas, M.; Carranza, S. The complete mitochondrial genome of Pristurusru pestrisrupestris. Mitochondrial DNA Part B 2017, 2, 802–803. [Google Scholar] [CrossRef] [PubMed]
  25. Ma, J.L.; Dai, X.Y.; Xu, X.D.; Guan, J.Y.; Zhang, Y.P.; Zhang, J.Y.; Yu, D.N. The complete mitochondrial genome of Teratoscincus roborowskii (Squamata: Gekkonidae) and its phylogeny. Mitochondrial DNA Part B 2020, 5, 1575–1577. [Google Scholar] [CrossRef]
  26. Hall, T.A. BioEdit: A user-friendly biological sequence alignment editor and analysis program for Windows 95/98/NT. Nucleic Acids Symp. Ser. 1999, 41, 95–98. [Google Scholar]
  27. Bernt, M.; Donath, A.; Jühling, F.; Externbrink, F.; Florentz, C.; Fritzsch, G.; Pütz, J.; Middendorf, M.; Stadler, P.F. MITOS: Improved de novo metazoan mitochondrial genome annotation. Mol. Phylogenet. Evol. 2013, 69, 313–319. [Google Scholar] [CrossRef] [PubMed]
  28. Iwasaki, W.; Fukunaga, T.; Isagozawa, R.; Yamada, K.; Maeda, Y.; Sato, T.P.; Sado, T.; Mabuchi, K.; Takeshima, H.; Miya, M.; et al. MitoFish and MitoAnnotator: A mitochondrial genome database of fish with an accurate and automatic annotation pipeline. Mol. Biol. Evol. 2013, 30, 2531–2540. [Google Scholar] [CrossRef]
  29. Zhu, T.; Sato, Y.; Sado, T.; Miya, M.; Iwasaki, W. MitoFish, MitoAnnotator, and MiFishpipeline: Updates in ten years. Mol. Biol. Evol. 2023, 40, msad035. [Google Scholar] [CrossRef]
  30. Kumar, S.; Stecher, G.; Tamura, K. MEGA7: Molecular evolutionary genetics analysis version 7.0 for bigger datasets. Mol. Biol. Evol. 2016, 33, 1870–1874. [Google Scholar] [CrossRef]
  31. Zhang, Z. KaKs_Calculator 3.0: Calculating selective pressure on coding and non-coding sequences. Genom. Proteom. Bioinform. 2022, 20, 536–540. [Google Scholar] [CrossRef]
  32. Zhang, D.; Gao, F.; Jakovlić, I.; Zou, H.; Zhang, J.; Li, W.X.; Wang, G.T. PhyloSuite: An integrated and scalable desktop platform for streamlined molecular sequence data management and evolutionary phylogenetics studies. Mol. Ecol. Resour. 2020, 20, 348–355. [Google Scholar] [CrossRef]
  33. Rozas, J.; Ferrer-Mata, A.; Sánchez-DelBarrio, J.C.; Guirao-Rico, S.; Librado, P.; Ramos-Onsins, S.E.; Sánchez-Gracia, A. DnaSP 6: DNA sequence polymorphism analysis of large data sets. Mol. Biol. Evol. 2017, 34, 3299–3302. [Google Scholar] [CrossRef]
  34. Racine, J.S. RStudio: A platform-independent IDE for R and Sweave. J. Appl. Econom. 2012, 27, 167–172. [Google Scholar]
  35. Hao, S.; Ping, J.; Zhang, Y. Complete mitochondrial genome of Gekko chinensis (Squamata, Gekkonidae). Mitochondrial DNA Part A 2016, 27, 4226–4227. [Google Scholar] [CrossRef] [PubMed]
  36. Minh, B.Q.; Schmidt, H.A.; Chernomor, O.; Schrempf, D.; Woodhams, M.D.; Haeseler, A.; Lanfear, R. IQ-TREE 2: New models and efficient methods for phylogenetic inference in the genomic era. Mol. Biol. Evol. 2020, 37, 1530–1534. [Google Scholar] [CrossRef]
  37. Lanfear, R.; Frandsen, P.B.; Wright, A.M.; Senfeld, T.; Calcott, B. PartitionFinder 2: New methods for selecting partitioned models of evolution for molecular and morphological phylogenetic analyses. Mol. Biol. Evol. 2017, 34, 772–773. [Google Scholar] [CrossRef]
  38. Huelsenbeck, J.P.; Ronquist, F. MrBayes: Bayesian inference of phylogenetic trees. Bioinformatics 2001, 17, 754–755. [Google Scholar] [CrossRef] [PubMed]
  39. Rambaut, A.; Drummond, A.J.; Xie, D.; Baele, G.; Suchard, M.A. Posterior summarization in Bayesian phylogenetics using Tracer 1.7. Syst. Biol. 2018, 67, 901–904. [Google Scholar] [CrossRef]
  40. Yang, Z.; Bielawski, J.P. Statistical methods for detecting molecular adaptation. Trends Ecol. Evol. 2000, 15, 496–503. [Google Scholar] [CrossRef]
  41. Pyron, R.A.; Burbrink, F.T.; Wiens, J.J. A phylogeny and revised classification of Squamata, including 4161 species of lizards and snakes. BMC Ecol. Evol. 2013, 13, 93. [Google Scholar] [CrossRef]
  42. Tamar, K.; Els, J.; Kornilios, P.; Soorae, P.; Tarroso, P.; Thanou, E.; Pereira, J.; Shah, J.N.; Elhassan, E.E.M.; Aguhob, J.C.; et al. The demise of a wonder: Evolutionary history and conservation assessments of the Wonder Gecko Teratoscincus keyserlingii (Gekkota, Sphaerodactylidae) in Arabia. PLoS ONE 2021, 16, e0244150. [Google Scholar] [CrossRef]
  43. Macey, J.R.; Larson, A.; Ananjeva, N.B.; Fang, Z.; Papenfuss, T.J. Two novel gene orders and the role of light-strand replication in rearrangement of the vertebrate mitochondrial genome. Mol. Biol. Evol. 1997, 14, 91–104. [Google Scholar] [CrossRef] [PubMed]
  44. Wu, N.; Liu, J.; Wang, S.; Guo, X. Comparative analysis of mitochondrial genomes in two subspecies of the sunwatcher toadheaded agama (Phrynocephalus helioscopus): Prevalent intraspecific gene rearrangements in Phrynocephalus. Genes 2022, 13, 203. [Google Scholar] [CrossRef] [PubMed]
  45. Lavrov, D.V.; Boore, J.L.; Brown, W.M. Complete mtDNA sequences of two millipedes suggest a new model for mitochondrial gene rearrangements: Duplication and nonrandom loss. Mol. Biol. Evol. 2002, 19, 163–169. [Google Scholar] [CrossRef]
  46. Pääbo, S.; Thomas, W.K.; Whitfield, K.M.; Kumazawa, Y.; Wilson, A.C. Rearrangements of mitochondrial transfer RNA genes in marsupials. J. Mol. Evol. 1991, 33, 426–430. [Google Scholar] [CrossRef]
  47. Okajima, Y.; Kumazawa, Y. Mitochondrial genomes of acrodont lizards: Timing of gene rearrangements and phylogenetic and biogeographic implications. BMC Evol. Biol. 2010, 10, 141. [Google Scholar] [CrossRef]
  48. Chen, M.; Liu, J.; Chen, D.; Guo, X. Complete mitochondrial genome of a blue-tailed skink Plestiodoncapito (Reptilia, Squamata, Scincidae) and comparison with other Scincidae lizards. Genetica 2020, 148, 229–241. [Google Scholar] [CrossRef]
  49. Hassanin, A.; Leger, N.; Deutsch, J. Evidence for multiple reversals of asymmetric mutational constraints during the evolution of the mitochondrial genome of Metazoa, and consequences for phylogenetic inferences. Syst. Biol. 2005, 54, 277–298. [Google Scholar] [CrossRef] [PubMed]
  50. Ojala, D.; Montoya, J.; Attardi, G. tRNA punctuation model of RNA procession in human mitochondria. Nature 1981, 290, 470–474. [Google Scholar] [CrossRef]
  51. Castellana, S.; Vicario, S.; Saccone, C. Evolutionary patterns of the mitochondrial genome in Metazoa: Exploring the role of mutation and selection in mitochondrial protein coding genes. Genome Biol. Evol. 2011, 3, 1067–1079. [Google Scholar] [CrossRef]
  52. Muse, S.V. Examining rates and patterns of nucleotide substitution in plants. Plant Mol. Biol. 2000, 42, 25–43. [Google Scholar] [CrossRef]
  53. Castoe, T.A.; de Koning, A.J.; Kim, H.M.; Gu, W.; Noonan, B.P.; Naylor, G.; Jiang, Z.J.; Parkinson, C.L.; Pollock, D.D. Evidence for an ancient adaptive episode of convergent molecular evolution. Proc. Natl. Acad. Sci. USA 2009, 106, 8986–8991. [Google Scholar] [CrossRef]
  54. Yang, Z.; Nielsen, R. Codon-substitution models for detecting molecular adaptation at individual sites along specific lineages. Mol. Biol. Evol. 2002, 19, 908–917. [Google Scholar] [CrossRef] [PubMed]
  55. Gharib, W.H.; Robinson-Rechavi, M. The branch-site test of positive selection is surprisingly robust but lacks power under synonymous substitution saturation and variation in GC. Mol. Biol. Evol. 2013, 30, 1675–1686. [Google Scholar] [CrossRef]
  56. Jin, Y.; Wo, Y.; Tong, H.; Song, S.; Zhang, L.; Brown, R.P. Evolutionary analysis of mitochondrially encoded proteins of toad-headed lizards, Phrynocephalus, along an altitudinal gradient. BMC Genom. 2018, 19, 185. [Google Scholar] [CrossRef] [PubMed]
  57. Mei, Q.; Deng, Y.; Zhao, D.; Jiang, D.; Liao, Y.; Yu, X.; Liu, P.; Jiang, L. Characterization of the Complete Mitogenome of the Ring-Necked Pheasant Phasianus colchicus (Galliformes: Phasianidae) and Systematic Implications for Phasianinae Phylogenetics. Genes 2024, 15, 1569. [Google Scholar] [CrossRef] [PubMed]
  58. Sun, C.H.; Lu, C.H. Comparative Analysis and Phylogenetic Study of Dawkinsia filamentosa and Pethia nigrofasciata Mitochondrial Genomes. Int. J. Mol. Sci. 2024, 25, 3004. [Google Scholar] [CrossRef]
  59. Jeffares, D.C.; Tomiczek, B.; Sojo, V.; Reis, M. A beginners guide to estimating the non-synonymous to synonymous rate ratio of all protein-coding genes in a genome. Parasite Genom. Protoc. 2015, 1201, 65–90. [Google Scholar]
  60. Roy, A.; Mukhopadhyay, S.; Sarkar, I.; Sen, A. Comparative investigation of the various determinants that influence the codon and amino acid usage patterns in the genus Bifidobacterium. World J. Microbiol. Biotechnol. 2015, 31, 959–981. [Google Scholar] [CrossRef]
  61. Smith, R.D. Enhanced effective codon numbers to understand codon usage bias. Biosystems 2022, 220, 104734. [Google Scholar] [CrossRef]
  62. Xu, X.D.; Guan, J.Y.; Zhang, Z.Y.; Cao, Y.R.; Cai, Y.Y.; Storey, K.B.; Yu, D.N.; Zhang, J.Y. Insight into the phylogenetic relationships among three subfamilies within Heptageniidae (Insecta: Ephemeroptera) along with low-temperature selection pressure analyses using mitogenomes. Insects 2021, 12, 656. [Google Scholar] [CrossRef]
  63. Ballard, J.W.; Melvin, R.G.; Katewa, S.D.; Maas, K. Mitochondrial DNA variation is associated with measurable differences in life-history traits and mitochondrial metabolism in Drosophila simulans. Evolution 2007, 61, 1735–1747. [Google Scholar] [CrossRef] [PubMed]
  64. Domrös, M.; Peng, G.; Zhang, S. The characteristics of the desert climate at Turpan, China. Erdkunde 1992, 46, 217–233. [Google Scholar] [CrossRef]
  65. Wei, Q.; Wang, X.; Dong, Y.; Shang, Y.; Sun, G.; Wu, X.; Zhao, X.; Sha, W.; Yang, G.; Zhang, H. Analysis of the Complete Mitochondrial Genome of Pteronura brasiliensis and Lontra canadensis. Animals 2023, 13, 3165. [Google Scholar] [CrossRef] [PubMed]
  66. Wang, J.; He, W.; Huang, H.; Ou, D.; Wang, L.; Li, J.; Lou, S. A comprehensive analysis of the Fowleria variegata (Valenciennes, 1832) mitochondrial genome and its phylogenetic implications within the family Apogonidae. Genes 2023, 14, 1612. [Google Scholar] [CrossRef]
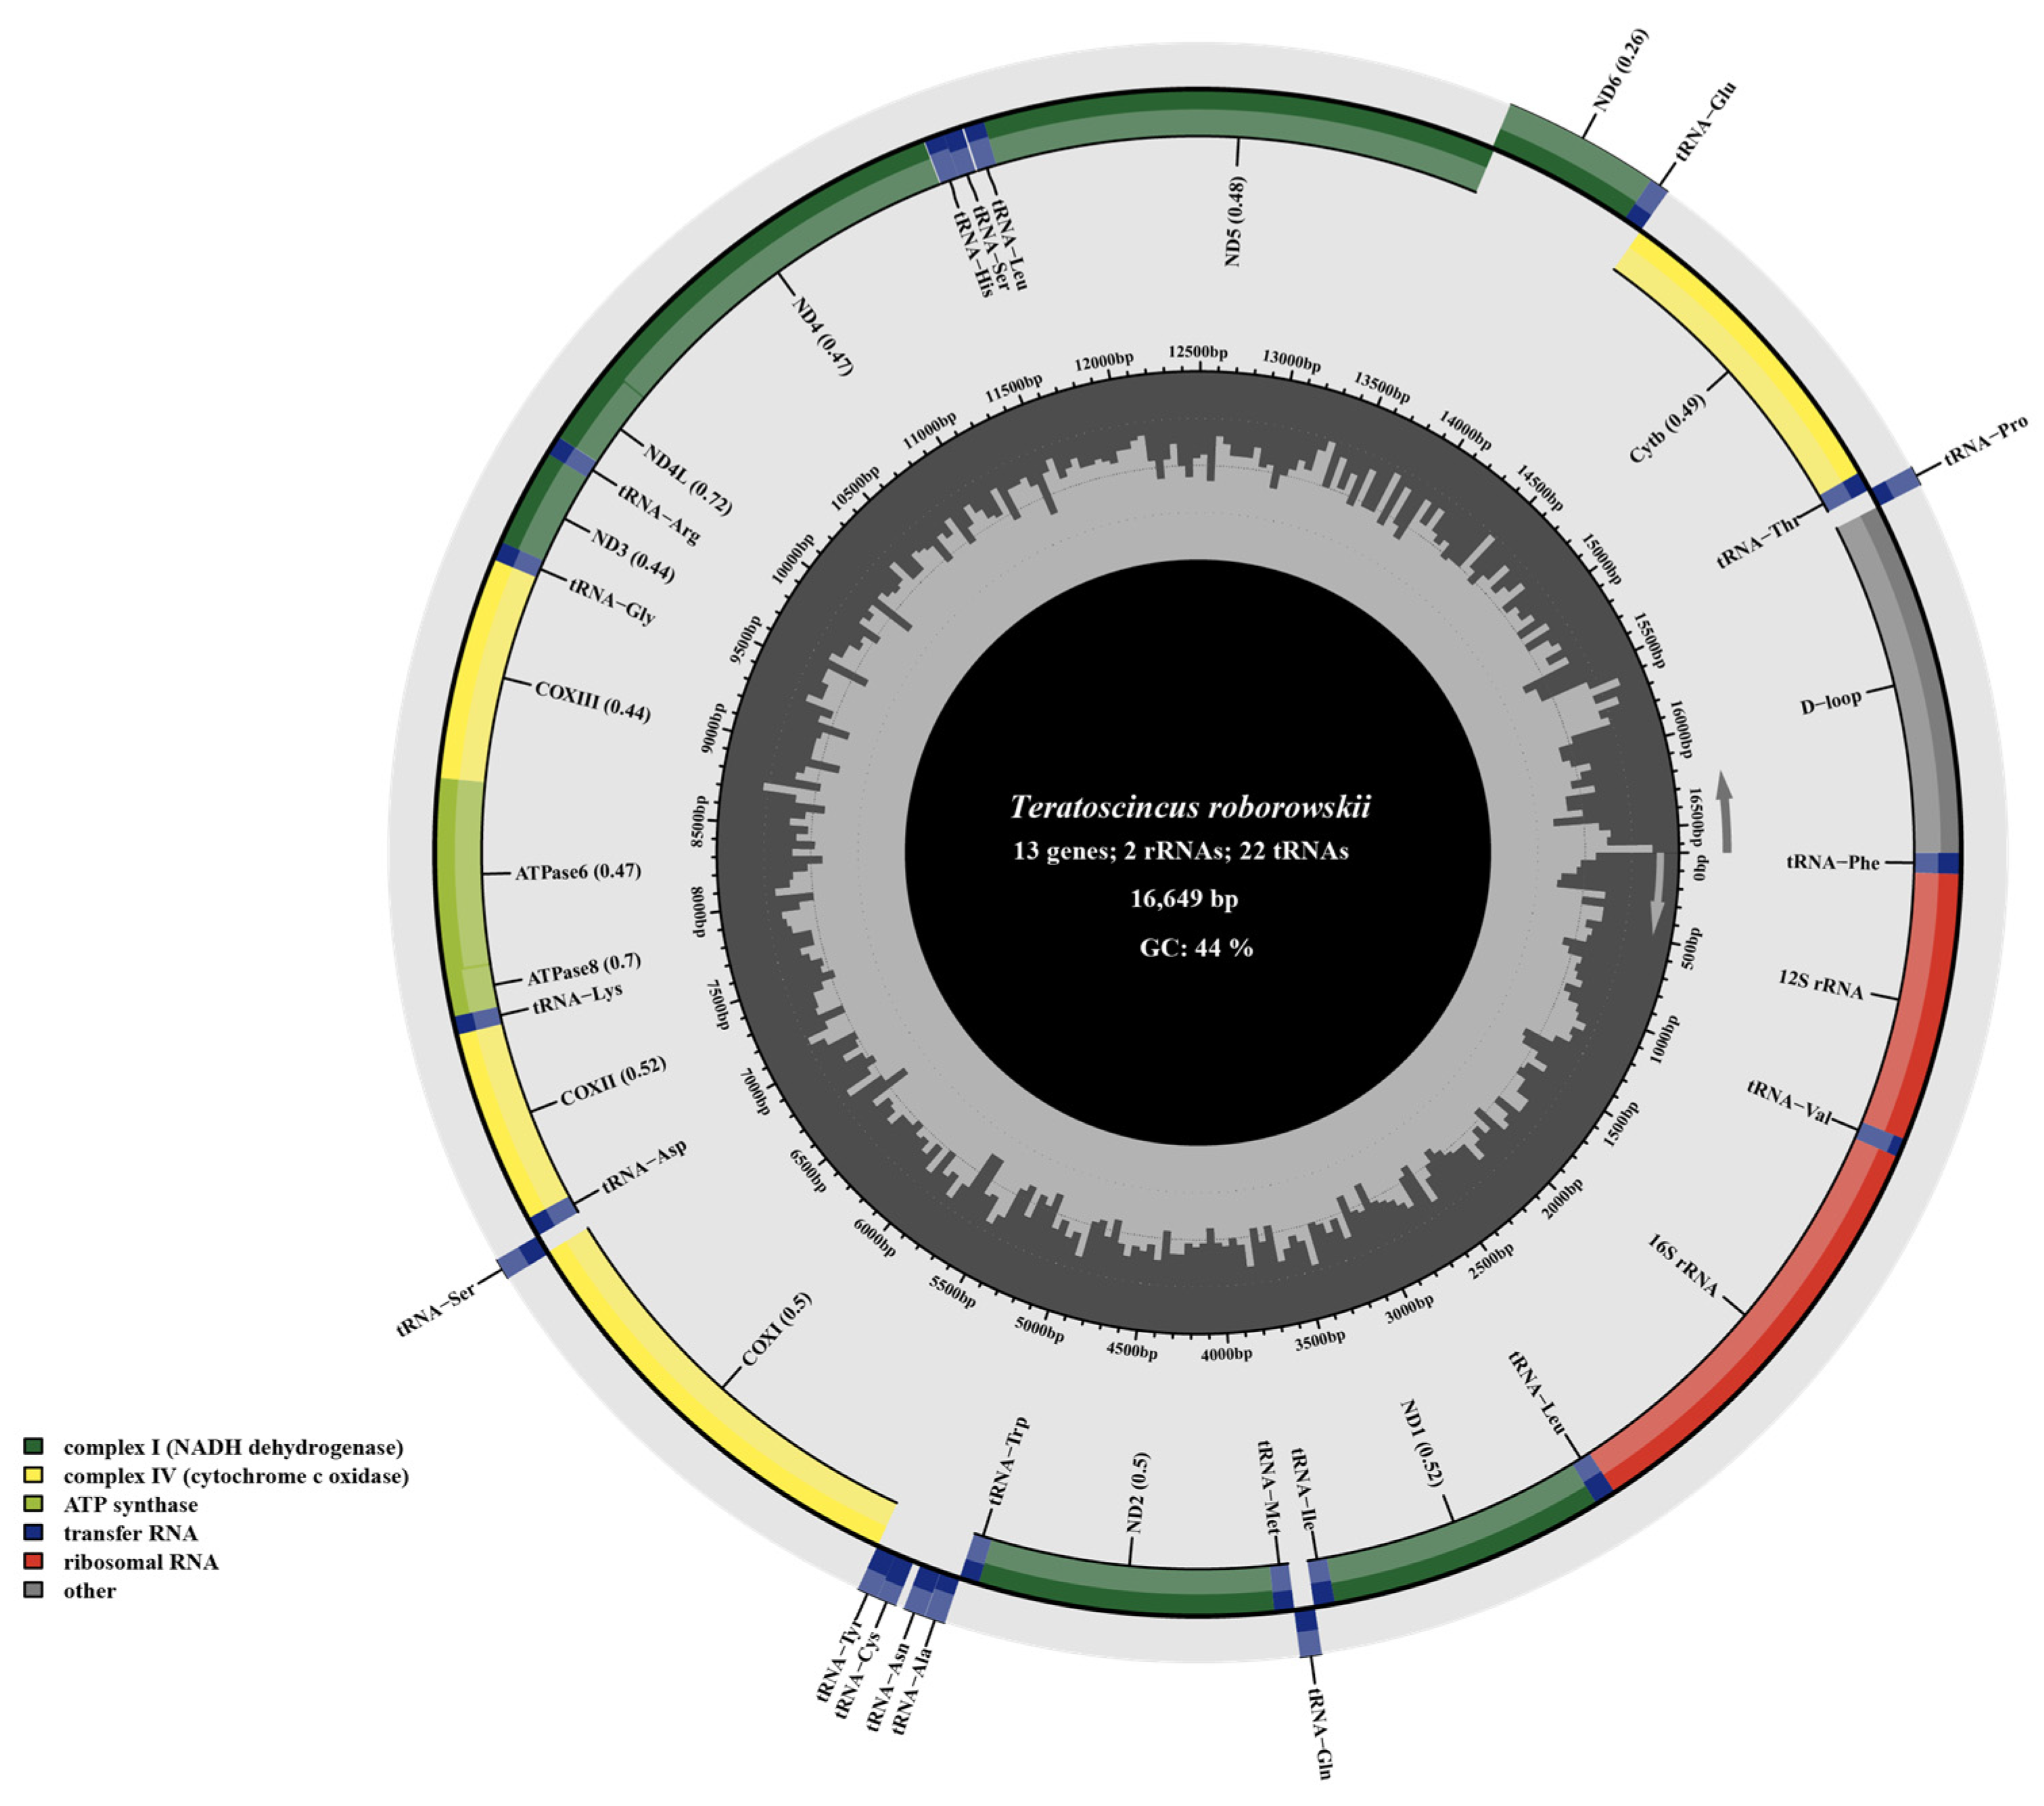
Figure 1. Mitochondrial genome map of T. roborowskii illustrates arrangement of genes encoded by both strands. Genes encoded by the H-strand are shown on the outside, while those encoded by the L-strand are indicated on the inside, with arrows showing their transcription direction. tRNAs, depicted in blue, are labelled according to three-letter amino acid codes. Innermost circle visualizes GC content across the mitochondrial genome, calculated every 5 bp. Darker lines represent regions with higher GC percentage.
Genes 16 00531 g001
Figure 2. Base composition and relative synonymous codon usage (RSCU) values of T. przewalskii (b) and T. roborowskii (a).
Genes 16 00531 g002
Figure 3. Frequency of use of amino acids in mitochondrial PCGs of T. przewalskii and T. roborowskii.
Genes 16 00531 g003
Figure 4. Variation in mitochondrial genes and evolutionary characteristics of Teratoscincus. (a) Ka/Ks values of mitochondrial gene sequences within T. przewalskii and T. roborowskii, revealing its evolutionary characteristics. (b) Sliding window analysis within Teratoscincus, revealing the nucleotide diversity (Pi). Arrow direction to the left indicates that the gene is located in the heavy chain, while arrow direction to the right indicates that the gene is located in the light chain.
Genes 16 00531 g004
Figure 5. Ka/Ks values for each protein-coding gene (PCG) in pairwise mitochondrial genomes of four wonder geckoes. Abbreviations used are as follows: TP: T. przewalskii; TR: T. roborowskii; TK: T. keyserlingii; TM: T. microlepis. Ka values of PCGs of four wonder geckoes (a), Ks values of PCGs of four wonder geckoes (b), Ka/Ks values of PCGs of four wonder geckoes (c).
Genes 16 00531 g005
Figure 6. AT-skew and GC-skew values for four species. (a) T. roborowskii, (b) T. przewalskii, (c) T. keyserlingii, (d) T. microlepis.
Genes 16 00531 g006
Figure 7. ENC plots for codon preferences in T. przewalskii (a) and T. roborowskii (b).
Genes 16 00531 g007
Figure 8. Phylogenetic trees inferred from Bayesian inference (BI) and maximum likelihood (ML) approaches on complete mitochondrial genomes of eight individuals of Sphaerodactylidae and two species of Phyllodactylidae, with two species in Gekkonidae used as outgroups for rooting the tree. Node numbers indicate a posterior probability/UFBoot values. GenBank accession number for the published sequence of each taxon is appended. The taxon highlighted in green represents the individual of T. roborowskii that has been sequenced and analyzed in this study.
Genes 16 00531 g008
Table 1. Characterization of base composition of mitochondrial genomes of T. przewalskii and T. roborowskii.
RegionSize (bp)A + T
Content (%)
G + C
Content (%)
AT-SkewGC-Skew
TPTRTPTRTPTRTPTRTPTR
Whole genome17,1841664955.856.244.243.80.1030.0890.3710.356
PCGs11,3671134056.456.543.643.50.0260.0120.3800.366
rRNA genes2493250354.254.645.745.40.2400.2240.2250.207
tRNA genes1531153156.356.243.743.80.0580.060.0010.004
CR1774124754.156.845.943.20.0830.0670.3150.343
Disclaimer/Publisher’s Note: The statements, opinions and data contained in all publications are solely those of the individual author(s) and contributor(s) and not of MDPI and/or the editor(s). MDPI and/or the editor(s) disclaim responsibility for any injury to people or property resulting from any ideas, methods, instructions or products referred to in the content.