Article

A Knockout of the OsGAPDHC6 Gene Encoding a Cytosolic Glyceraldehyde-3-Phosphate Dehydrogenase Reacts Sensitively to Abiotic Stress in Rice

1
Division of Horticultural Biotechnology, Hankyong National University, Anseong 17579, Republic of Korea
2
Department of Bio-Environmental Chemistry, College of Agriculture and Life Sciences, Chungnam National University, Daejeon 34134, Republic of Korea
3
Institute of Genetic Engineering, Hankyong National University, Anseong 17579, Republic of Korea
*
Authors to whom correspondence should be addressed.
These authors contributed equally to this work.
Genes 2025, 16(4), 436; https://doi.org/10.3390/genes16040436
Submission received: 11 March 2025 / Revised: 1 April 2025 / Accepted: 3 April 2025 / Published: 6 April 2025
(This article belongs to the Section Plant Genetics and Genomics)

Abstract

:
Background/Objectives: The glyceraldehyde-3-phosphate dehydrogenase (GAPDH) enzyme, encoded by OsGAPDHC6, plays a crucial role in glycolysis while participating in various physiological and stress response pathways. Methods: In this study, the expression levels of the OsGAPDHC1 and OsGAPDHC6 genes were investigated over time by treating various abiotic stresses (ABA, PEG, NaCl, heat, and cold) in rice seedlings. Results: As a result, the expression levels of both genes in the ABA-treated group increased continuously for 0–6 h and then de-creased sharply from 12 h onwards. The mutational induction of the GAPDHC6 gene by the CRISPR/Cas9 system generated a stop codon through a 1 bp insertion into protein production. The knockout (KO) lines showed differences in seed length, seed width, and seed thickness compared to wild-type (WT) varieties. In addition, KO lines showed a lower germination rate, germination ability, and germination index of seeds under salt treatment compared to WT, and leaf damage due to 3,3′-diaminobenzidine (DAB) staining was very high due to malondialdehyde (MDA) accumulation. The KO line was lower regarding the expression level of stress-related genes compared to WT. Conclusions: Therefore, the OsGAPDHC6 gene is evaluated as a gene that can increase salt resistance in rice as it actively responds to salt stress in the early stages of growth, occurring from seed germination to just before the tilling stage.

1. Introduction

Abiotic stresses such as salt, cold, heavy metals, drought, and heat negatively affect growth and development in all crops, significantly reducing yields. Exposure to various abiotic stresses during crop growth causes disturbances in the plant’s metabolic processes, disrupting the plant′s morphology and physiological mechanisms, leading to lower crop productivity [1]. Several researchers have shown that abiotic stress affects three important plant stages: the pre-anthesis phase, which occurs before the flowering stage; the terminal phase, which occurs after the flowering stage; and the period of vegetative development [2]. Temperature plays a decisive role in the growth, development, and yield of plants [3]. Plants inhibit cell elongation by interrupting water flow from the xylem to adjacent kidney cells due to drought stress caused by high temperatures. Also, drought stress decreases in leaf area, plant height, and crop development due to decreased cell elongation, low mitosis, and diastolic disorders [4]. Cold stress reduces plant development and crop efficiency, resulting in yield loss. When crops are subjected to cold stress, cells and tissues become dehydrated and cause the water crystallization of cells. Therefore, at low temperatures, electrolyte leakage and water stress increase due to moisture-active pore obstruction, reduced membrane conductivity, and increased moisture viscosity, which slows down metabolism and increases oxidative stress, consuming energy and releasing free radicals [5,6]. Strigolactone, which has recently been in the spotlight, is a plant hormone involved in plant growth and development, and studies are underway on its role in plant adaptation to various abiotic stresses [7]. However, more information is still required to understand its roles in plant adaptation towards different abiotic stresses. Therefore, the metabolism of cells undergoing abiotic stress is impaired by changes in respiratory rate, and abnormal metabolites are produced by abnormal anaerobic respiration, depending on the intensity of the stress. Cell damage and metabolic changes result in reduced plant development, abnormal fruit ripening, internal discoloration (vascular browning), increased susceptibility to spoilage, and even plant mortality [8]. Salinity is one of the major abiotic stressors causing water stress in plants. This situation makes it difficult for roots to absorb water from the soil, and high-salt conditions reduce soil moisture potential. Salinity usually occurs in semi-arid and dry areas where plants experience higher rates of evaporation and evaporation throughout the year than precipitation. High salt concentrations can lead to ion toxicity and osmotic stress. It has been reported that under normal conditions, plant cells experience a higher level of osmotic stress compared to soil, and this high osmotic pressure is used to collect water and essential nutrients from soil and store them in root cells. However, for salt stress, the osmotic solution of soil exceeds the osmotic pressure of plant cells. This is because the presence of salt in the soil limits the plant′s ability to absorb water and minerals (Ca2+ and K+). In addition, the migration of Cl and Na+ ions within plant cells causes damage to cell membranes and cytoplasmic metabolism. Salinity negatively affects cytoplasmic metabolism, cell development, and membrane function, and also increases ROS production. All changes affect the quality and quantity of crop production. These effects include changes to seed germination, growth impairment, and damage at the plant developmental stage due to the combined effects of greater osmotic potential and specific ion toxicity [9].
Rice (Oryza sativa L.) is a globally important food crop and is a salt-sensitive crop whose grain yield decreases by more than 50% due to salt stress [10,11,12,13,14]. The exact mechanism of salt stress in rice is not yet known, but in Zea mays, it is known that the excessive accumulation of salt ions (Na+ and Cl) in leaves causes damage [15]. Glyceraldehyde-3-phosphate dehydrogenase (GAPDH) is a key enzyme in the glycolytic and gluconeogenic sugar metabolic pathways and plays a central role in cellular carbon metabolism [16]. GAPDH, which encodes glyceraldehyde-3-phosphate dehydrogenase, has been commonly used as a protein model to analyze protein structures and enzymatic mechanisms, and is employed as a housekeeping gene for the relative quantification of gene expression. However, it has recently been shown to also be involved in diverse processes in mammals, such as membrane fusion, microtubule bundling, nuclear RNA export, DNA repair, phosphatase activity, transcriptional regulation, signaling cascades, and cell death [17,18,19]. In higher plants, there are three isoforms of phosphorylated GAPDH that exist in specific locations and have separate nuclei—chloroplastic glyceraldehyde 3-phosphate dehydrogenase (GAPDHA/B), plastid glyceraldehyde 3-phosphate dehydrogenase (GAPCp), cytosolic glyceraldehyde 3-phosphate dehydrogenase (GAPDHC)—and non-phosphorylated GAPDH. It is categorized as glyceraldehyde 3-phosphate dehydrogenase (NP-GAPDH) [12]. Early studies on the function and role of plant GAPDH genes were related to chloroplast isoform identification and photosynthesis [20,21]. Recently, research on stress response has been conducted in model crops such as Arabidopsis and corn. In Arabidopsis, AtGAPC-1 directly reacts with hydrogen peroxide (H2O2) to mediate reactive oxygen species (ROS) signaling [22], and GAPC-1 has been shown to be essential for the maintenance of cellular ATP levels, carbohydrate metabolism, and normal fertility in Arabidopsis [23]. Additionally, GAPDHC is upregulated in response to various stresses, such as anaerobic stress in maize (Z. mays) and soybean (Glycine max) [24,25], heat, anaerobic stress, or increased sucrose levels in Arabidopsis [26,27,28], and dehydration or ABA in Craterostigma plantagineum [29]. Recently, studies on the function and role of the GAPDH gene have been actively conducted in rice, a monocotyledonous model crop. GAPDHC in rice plays an important role in plant growth, development, and stress response [21,30], and the overexpression of the OsGAPC3 gene can improve salinity tolerance in rice [16]. In a previous study, eight OsGAPDH genes were divided into four subgroups (I, cytosolic GAPDH; II, non-phosphorylated GAPDH; III, chloroplastic GAPDHB subunit; IV, chloroplastic GAPDHA subunit), and a knockout (KO) of OsGAPDHC7, which showed high expression levels in each rice organ, confirmed that OsGAPDHC7 could affect energy metabolism and amino acid accumulation [31]. The functions and roles of other GAPDH genes in rice have not yet been revealed and need to be studied more systematically and clearly. In this study, we isolated genes encoding putative GAPC proteins in the rice genome and conducted gene expression profiling in various organs and leaf tissues exposed to various abiotic stresses. Additionally, we selected the OsGAPDHC6 gene to generate knockout mutant lines using the CRISPR/Cas9 system. The knockout lines of the OsGAPDHC6 gene exhibited a heightened sensitivity to salt stress compared to wild-type plants. Our results suggest that OsGAPDHC6 plays an important role in elucidating the molecular mechanisms of salt stress through its relationship with H2O2 levels.

2. Materials and Methods

2.1. Plant Material

Dongjin (O. sativa L. ssp. japonica) was used for transgenic plant development and as a control. Seedlings were transplanted at 30 × 15 cm spacing in the greenhouse facility of Hankyung National University and grown. The expression levels of OsGAPDHC1 and OsGAPDHC6 were investigated in the seeds of the Dongjin cultivar and in the roots, leaves, and stems 3 weeks after sowing. Abiotic stresses, including 100 μM ABA, 20% PEG6000 drought, 200 mM NaCl, 48 °C heating, and 4 °C cold, were transferred to MS liquid medium and treated for 0, 3, 6, 12, and 24 h, respectively. For all samples obtained from the abiotic stress treatment, the expression patterns of the OsGAPDHC1 and OsGAPDHC6 genes were monitored. All experiments included three biological replicates.

2.2. Phylogenetic Analysis

Phylogenetic analysis was performed based on the estimated evolutionary divergence between OsGAPDH genes in rice. All information was retrieved using databases such as RAP-DB, NCBI (https://blast.ncbi.nlm.nih.gov/Blast.cgi, accessed on 12 August 2022), and Gramene. Multiple alignment analysis of predicted full-length protein sequences was performed using CLUSTALX (https://www.genome.jp/tools-bin/clustalw, accessed on 12 August 2022). Phylogenetic tree construction was performed using MEGA 4.0 by the neighbor-joining (NJ) method [32].

2.3. Gene Editing by CRISPR/Cas9 System

OsGAPDHC1 and OsGAPDHC6 genomic DNA sequences were obtained from the NCBI database (https://blast.ncbi.nlm.nih.gov, accessed on 12 August 2022). Target sites were designed in the exon regions of OsGAPDHC1 and OsGAPDHC6, respectively, adjacent to the protospacer-adjacent motif (PAM) using the CRISPR RGEN tool developed at Hanyang University (http://www.rgenome.net/, accessed 2 September 2022) [33] (Supplementary Figure S2, Supplementary Table S1). The four selected sgRNAs were synthesized by Bioneer Co., Ltd. (Daejeon, Republic of Korea), and the annealed oligonucleotide pairs were cloned into the pBOsC plant transformation vector via Aar I digestion. The recombinant vector was transformed into rice embryogenic callus using Agrobacterium tumefaciens strain EHA105 as previously described [34]. All transgenic callus lines were subcultured several times and maintained on the 2N6 medium (Supplementary Figure S2) as previously described [35], and the selection of transgenic plants was performed in a medium containing 6 mg/L phosphinothricin and 400 mg/L carbenicillin. Regenerated plants were transferred to pots in the greenhouse.

2.4. Detection of Mutation Type

Total DNA extraction was performed by sampling 100 mg of leaves and using the DNA Quick Plant Kit (Inclone, Jeonju, Republic of Korea). The selection of T-DNA insertion transgenic plants was performed using bar gene-specific primers (Bar-F 5′-CGTCAACCACTACATCGAGA-3′) and (Bar-R 5′-AAGTCCAGCTGCCAGAAA-3′), and PCR conditions were arranged according to a previously reported method [31]. To identify target site mutations, PCR reactions were applied to MiniSeq paired-end read sequencing (Illumina, San Diego, CA, USA) and analyzed using Cas-Analyzer (http://www.rgenome.net/cas-analyzer/#!, accessed 6 April 2023) [36,37].

2.5. ABA and Salt Stress Sensitivity Assay in Transgenic Rice Plants

For seed germination assays, 15 seeds of each transgenic rice line (T1) and the WT control were sterilized and submerged in a solution of water, 200 mM NaCl, and 100 μM ABA in the dark at 28 °C. The solution was replaced every 2 days to maintain the concentrations of NaCl and ABA and the amount of distilled water, respectively. The germinated seeds were measured daily, and embryo emergence was used as an indicator of germination. The germination percentage, germination ability, and germination index were measured as previously reported [38]. The root length and shoot length of the seedlings were measured on the 10th day.

2.6. DAB Stainning ROS Determination of H2O2 Content in Rice Leaves

To measure tissue H2O2 levels and visualize the extent of damage due to heat stress, leaf disks were soaked in 3,3′-diaminobenzidine (DAB) solution (1 mg/mL, pH 3.8) at 25 °C for 24 h under continuous illumination [39]. Monitoring was performed at 0, 3, 12, and 24 h. The analysis of H2O2, proline, and malondialdehyde (MDA) contents was performed according to previously reported methods [40]. Chlorophyll was extracted from plant tissues using a 2:3 (v/v) acetone/hexane mixture, and absorbance was measured at 663 and 645 nm using a spectrophotometer [41].

2.7. qRT-PCR Analysis

Total RNA was isolated from rice plant tissues using the RNeasy plant mini kit (Qiagen, Seoul, Republic of Korea, www.qiagen.com), and reverse transcription was performed using a kit provided by GenDEPOT (Houston, TX, USA). Quantitative RT-PCR was performed using the AccuPower® RT-PCR PreMix & Master Mix kit provided by Bioneer (Daejeon, Republic of Korea). The actin gene was used as an internal control for expression analysis performed using the Bio-Rad real-time fluorescence quantitative PCR instrument. Relative gene expression was calculated using the following formula: relative expression = 2−ΔΔCT. Primer sequences for RT-PCR analysis are listed in Supplementary Table S3.

2.8. Statistical Analysis

Significant differences between mean values (p < 0.05) were evaluated using one-way ANOVA followed by Bonferroni’s test. Statistical analyses were performed using R statistical software (version 4.4.3).

3. Results

3.1. Structural and Expression Analysis of OsGAPDHC01 and OsGAPDHC6 Genes

The OsGAPDHC1 (LOC_Os02g07490) and OsGAPDHC6 (LOC_Os06g45590) used in this study belonged to the cytosolic GAPDH group and were located very close in phylogenetic tree analysis [31]. In this study, the phylogenetic analysis of OsGAPDHC genes showed that OsGAPDHC1 and OsGAPDHC6 were located very closely, with values of 0.087 and 0.082, respectively (Supplemental Figure S1A). In addition, multiple alignment and gene structure analysis of the amino acid sequences of OsGAPDHC1 and OsGAPDHC6 showed that the NAD-binding domain and C-terminal domain were well conserved (Supplemental Figures S1B and S2A,B). qRT-PCR analysis was performed to determine the expression levels of OsGAPDHC1 and OsGAPDHC6 in the organs of rice plants (Figure 1). The expression levels of OsGAPDHC1 and OsGAPDHC6 were very high in seeds and lowest in leaves. In general, OsGAPDCH1 showed higher expression levels than OsGAPDHC6, but the level of OsGAPDHC6 was higher in seeds. Therefore, OsGAPDHC1 and OsGAPDHC6 had different expression levels compared to our previously reported organ-specific expression levels [31]. The expression levels of both genes were higher in the early germination stage compared to the reproductive stage (Figure 1).

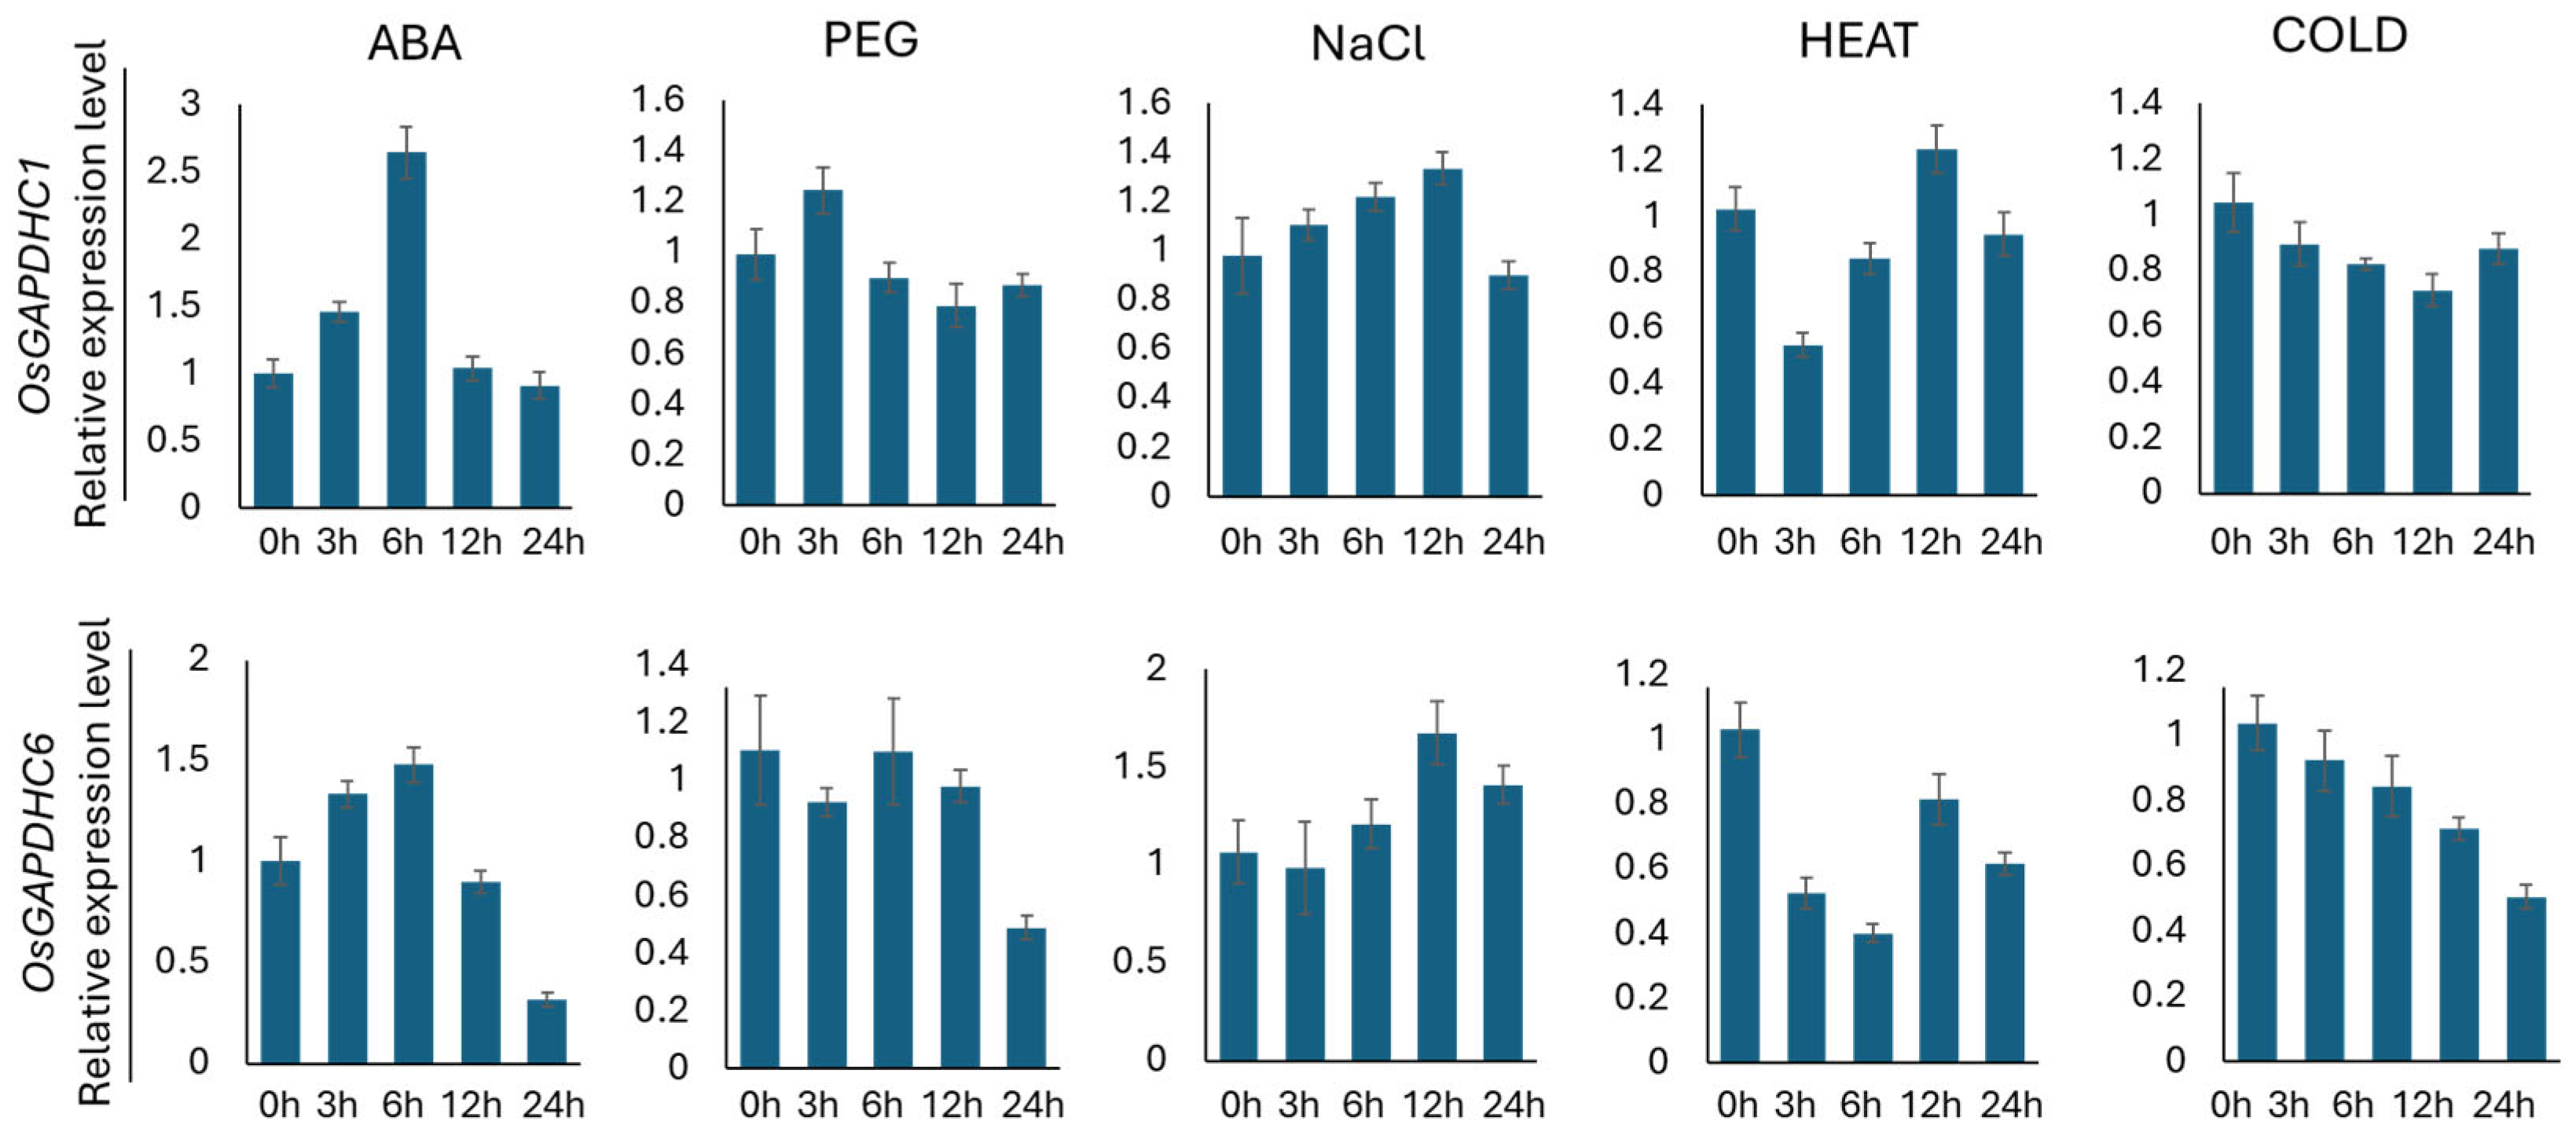
3.2. Analysis of Expression Levels of OsGAPDHC1 and OsGAPDHC6 Under Abiotic Stress

In this study, the expression levels of OsGAPDHC1 and OsGAPDHC6 genes were examined over time by treating various abiotic stresses (ABA, PEG, NaCl, heat, and cold) during rice seedlings. The expression levels of OsGAPDHC1 and OsGAPDHC6 were confirmed by qRT-PCR analysis, with sampling conducted for each stress treatment (Figure 2). As a result, the two gene expression patterns in the ABA- and NaCl-treated groups showed a constant pattern. In the ABA treatment group, the expression levels of OsGAPDHC1 and OsGAPDHC6 increased constantly from 0 h to 6 h but decreased sharply from 12 h onwards. In the NaCl treatment group, it was confirmed that the expression levels of OsGAPDHC1 and OsGAPDHC6 increased constantly from 0 h to 12 h but decreased to 24 h (Figure 2). In addition, the expression levels of both genes also differed over time in other abiotic stress treatments.

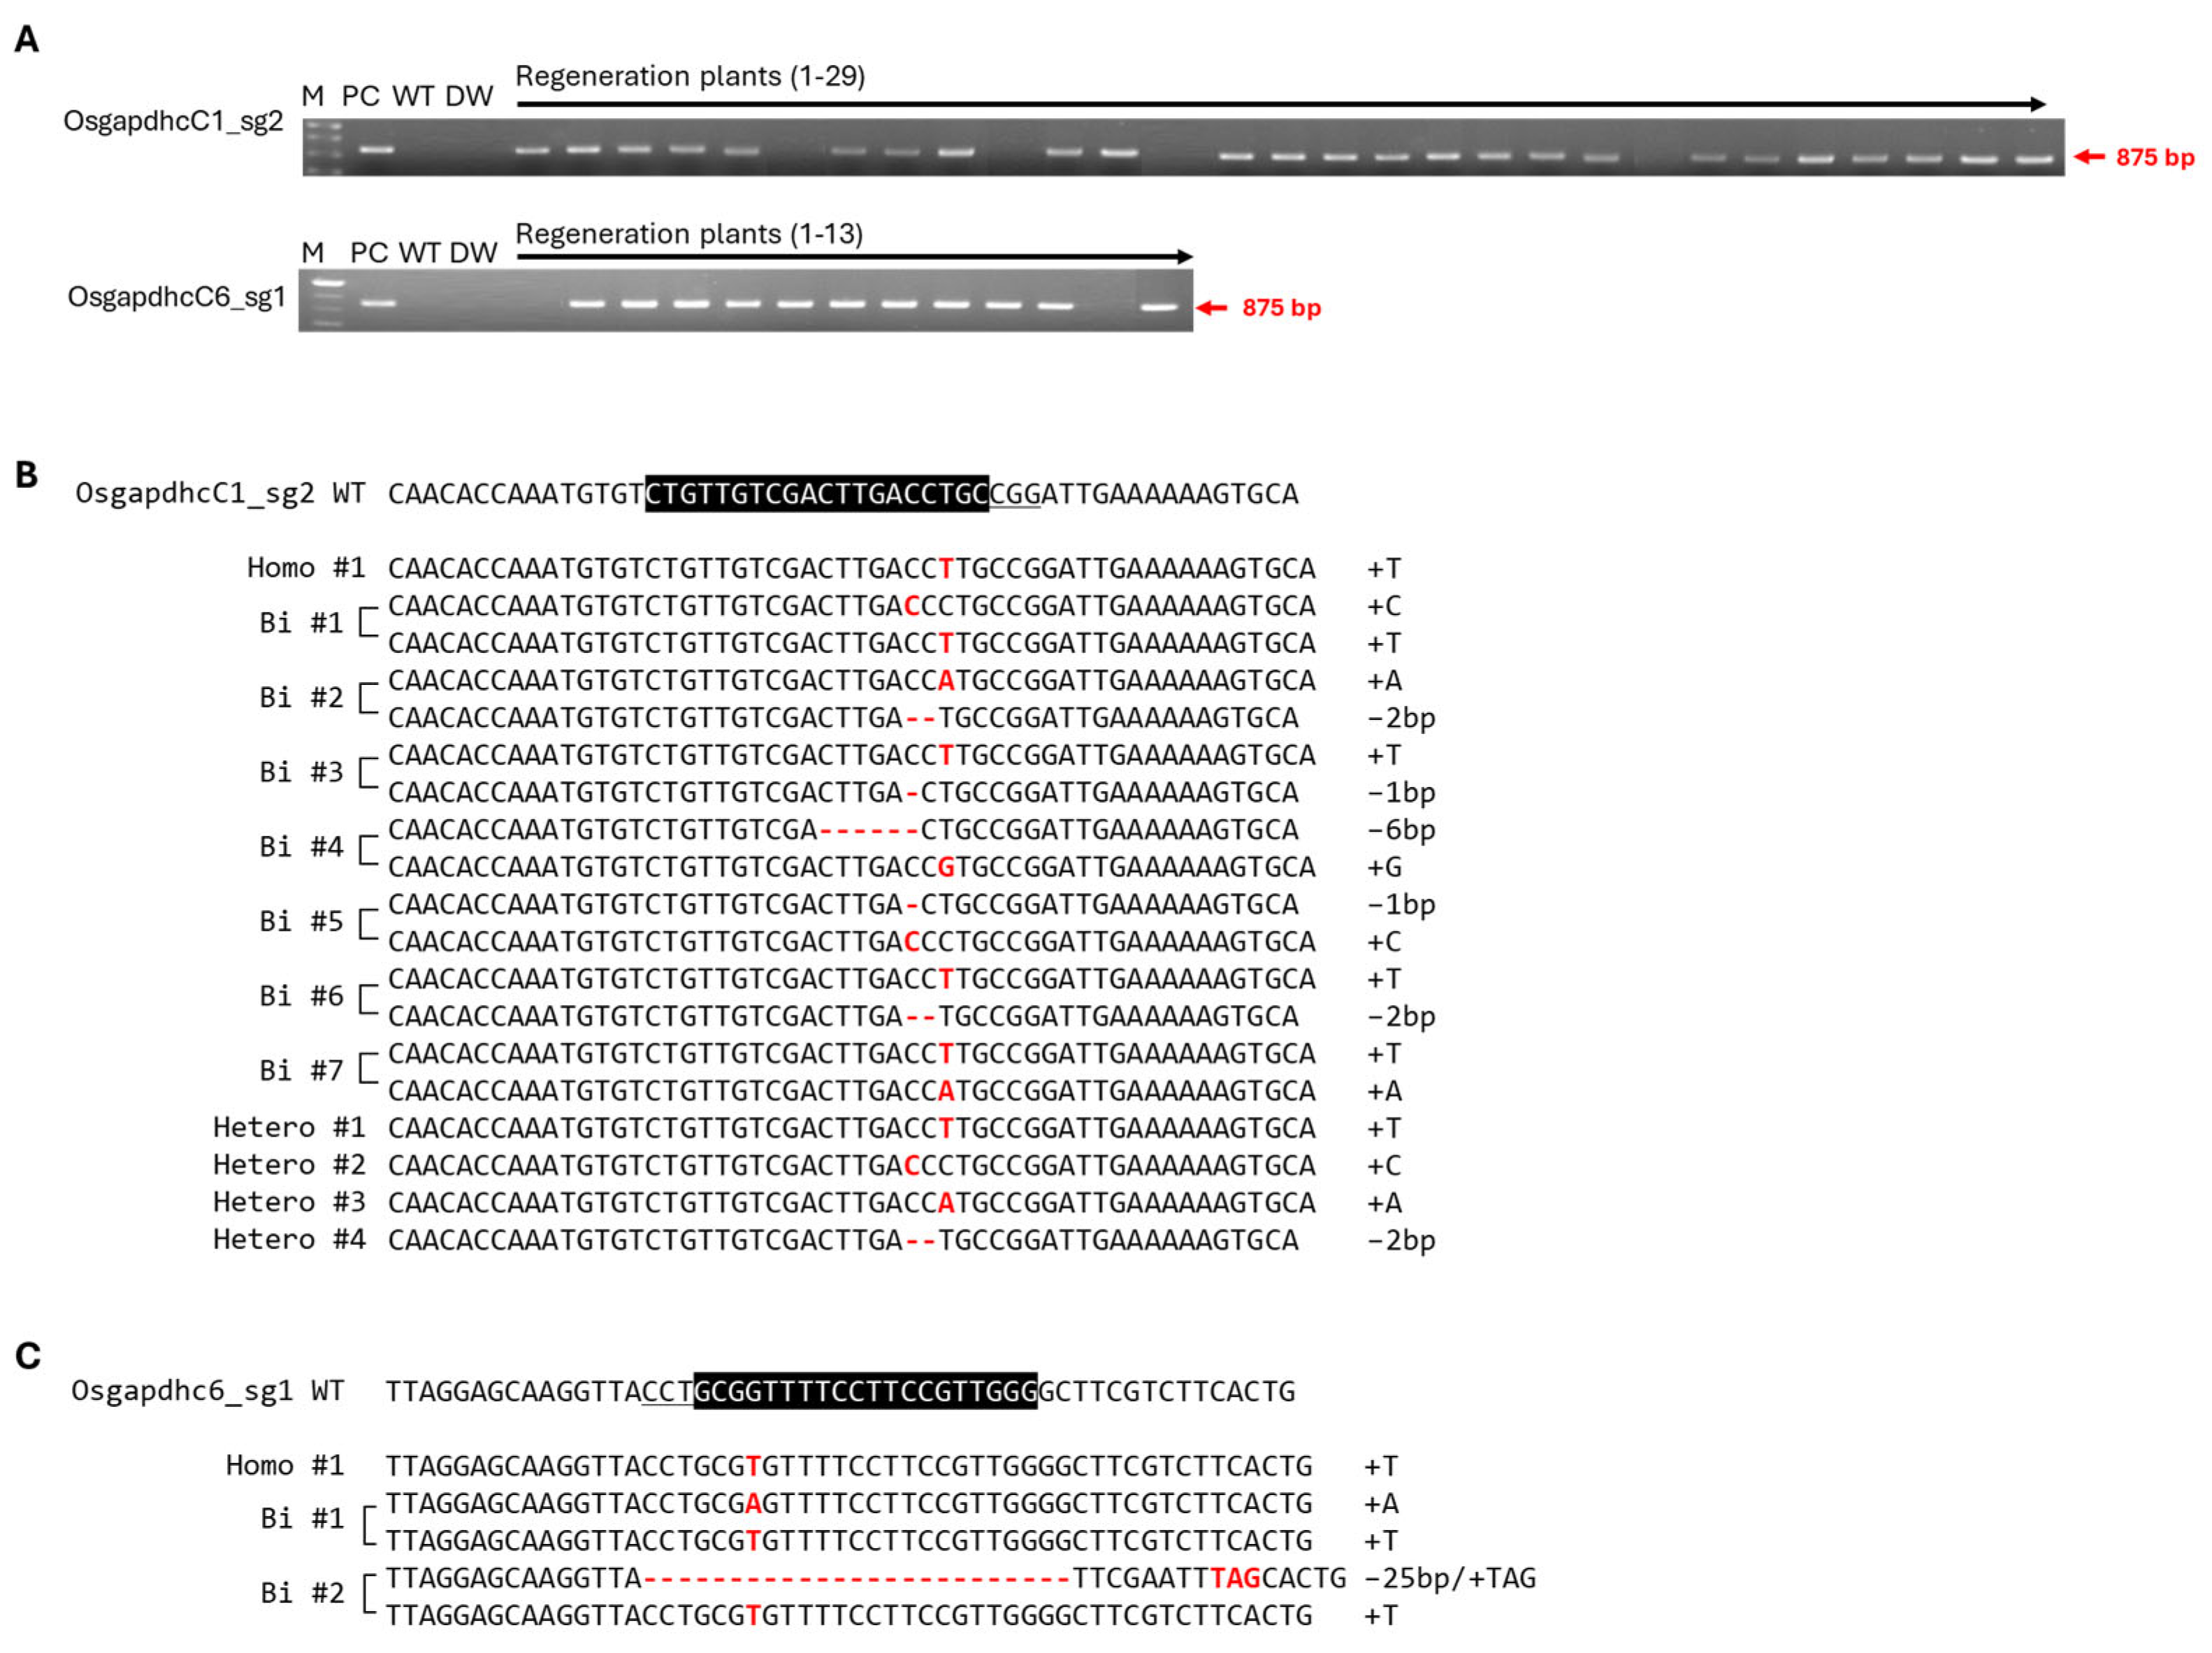
3.3. Generating Gene-Edited Mutants Using the CRISPR/Cas9 System

Because OsGAPDHC1 and OsGAPDHC6 responded to ABA and NaCl during seed germination under stress conditions, they were expected to be involved in the response mechanisms to both stresses. Therefore, in this study, the gene-edited plants were generated by using the CRISPR/Cas9 system to assess the role and function of the two genes (Supplementary Figure S2). OsGAPDHC1 (Os02g07490) and OsGAPDHC6 (Os06g45590) consisted of 14 exons and 13 intron regions. The sgRNA of the CRISPR/Cas9 system was designed in the 5th and 11th exon regions of OsGAPDHC1 and the 2nd and 6th exon regions of OsGAPDHC6. Each sgRNA was designed by selecting the NAD-binding domain. The C-terminal domain was the target site (Supplementary Figure S2, Supplementary Table S1). The pBOsC vector, constructed by introducing sgRNA, was transferred into the rice genome by Agrobacterium cv EHA105 (Supplementary Figure S2). PCR analysis was performed with primers of the bar gene region present in Ti-plasmid using the regenerated plants. As a result, transgenic plants containing Ti-plasmid were selected, and gene-edited plants were selected by deep-sequencing analysis (Figure 3, Supplementary Table S2). As a result, various base mutations of homo, bi-allelic, and hetero were generated, and homo and bi-allelic types of gene-edited individuals were selected for each gene. The homo #1 (T insertion) selected from OsGAPDHC1_sg2 was marked as gapdhc 1-1, the bi #2 (A insertion/2 bp deletion) was marked as gapdhc 1-2, the homo #1 (T insertion) selected from OsGAPDHC6_sg1 was marked as gapdhc 6-1, and the bi #1 (A/T insertion) was marked as gapdhc 6-2 (Figure 3B,C).

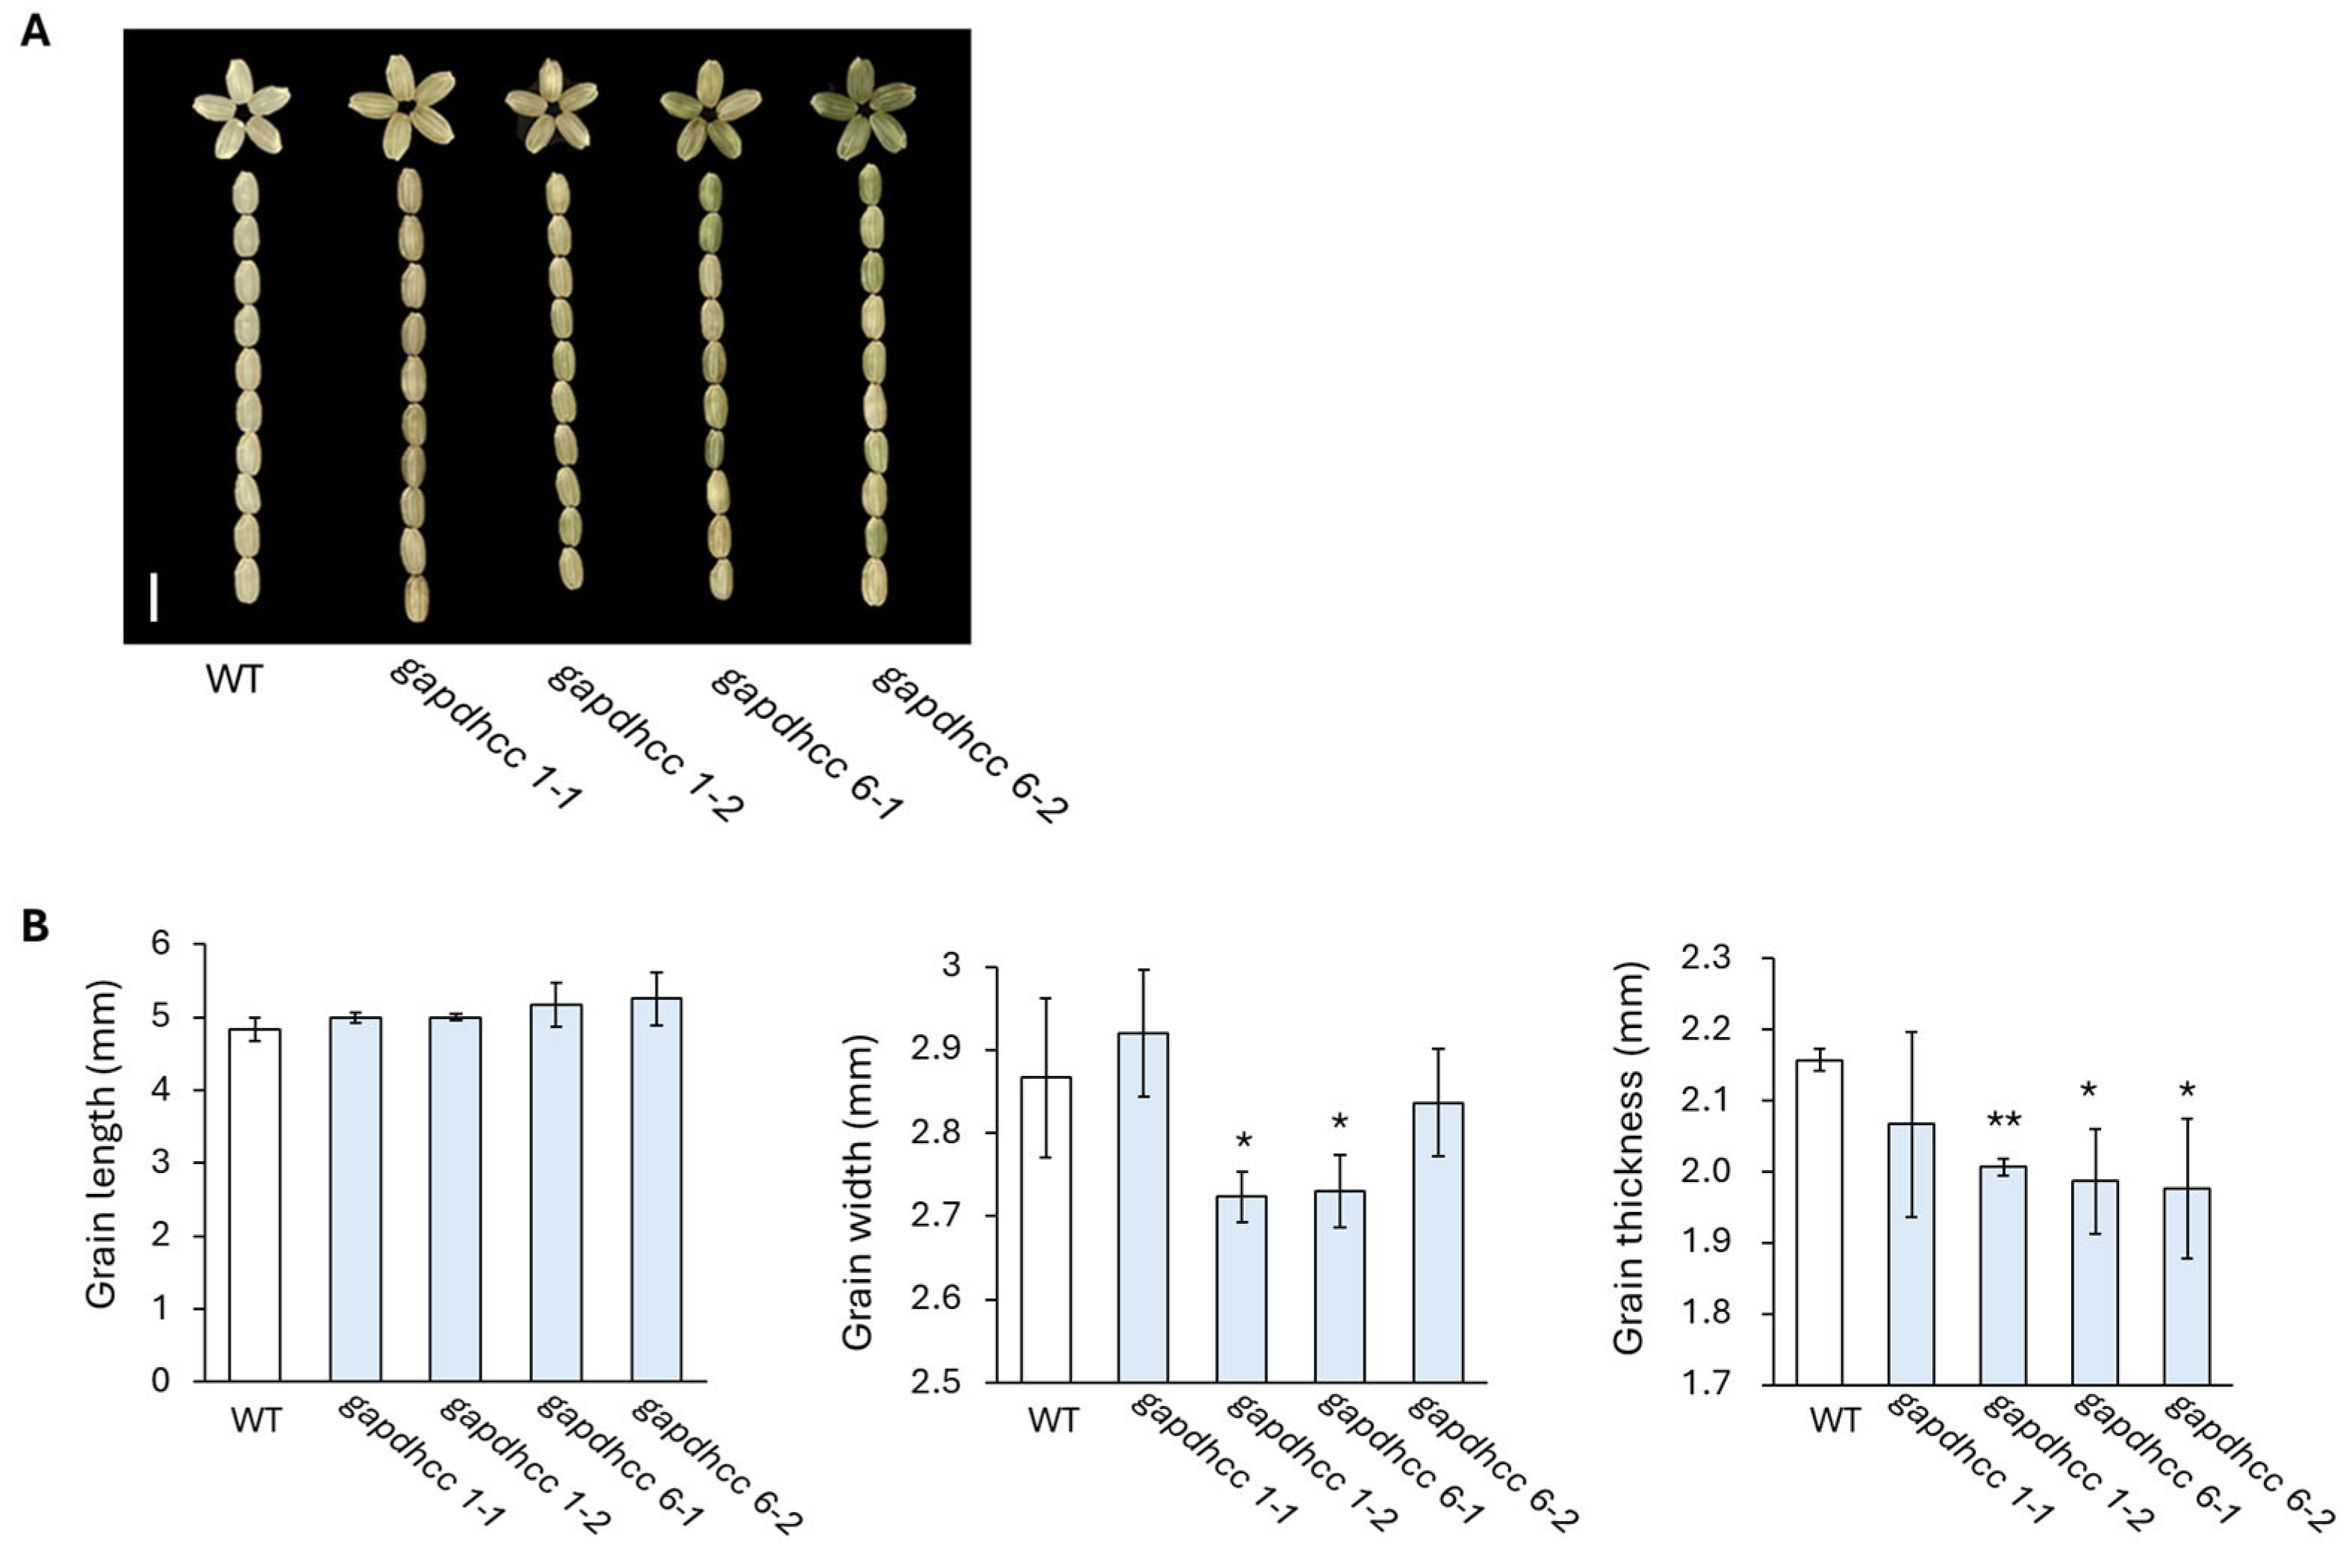
3.4. Characteristic of Derived Seeds from Gene-Edited Lines

T1 seeds were harvested from four lines (gapdhc 1-1, gapdhc 1-2, gapdhc 6-1, and gapdhc 6-2) edited with the homo and bi-allelic selected in this experiment. In our experiment, the expression levels of OsGAPDHC1 and OsGAPDHC6 genes within the seeds were significantly different (Figure 1). Therefore, when examining the phenotypes of KO mutant seeds, we found that they showed large differences in grain length, grain width, and grain thickness in each KO line (Figure 4). Specifically, the thickness of the seeds tended to decrease in all lines, and the width of the seeds decreased, except for in the gapdhc 1-1 line (Figure 4B).

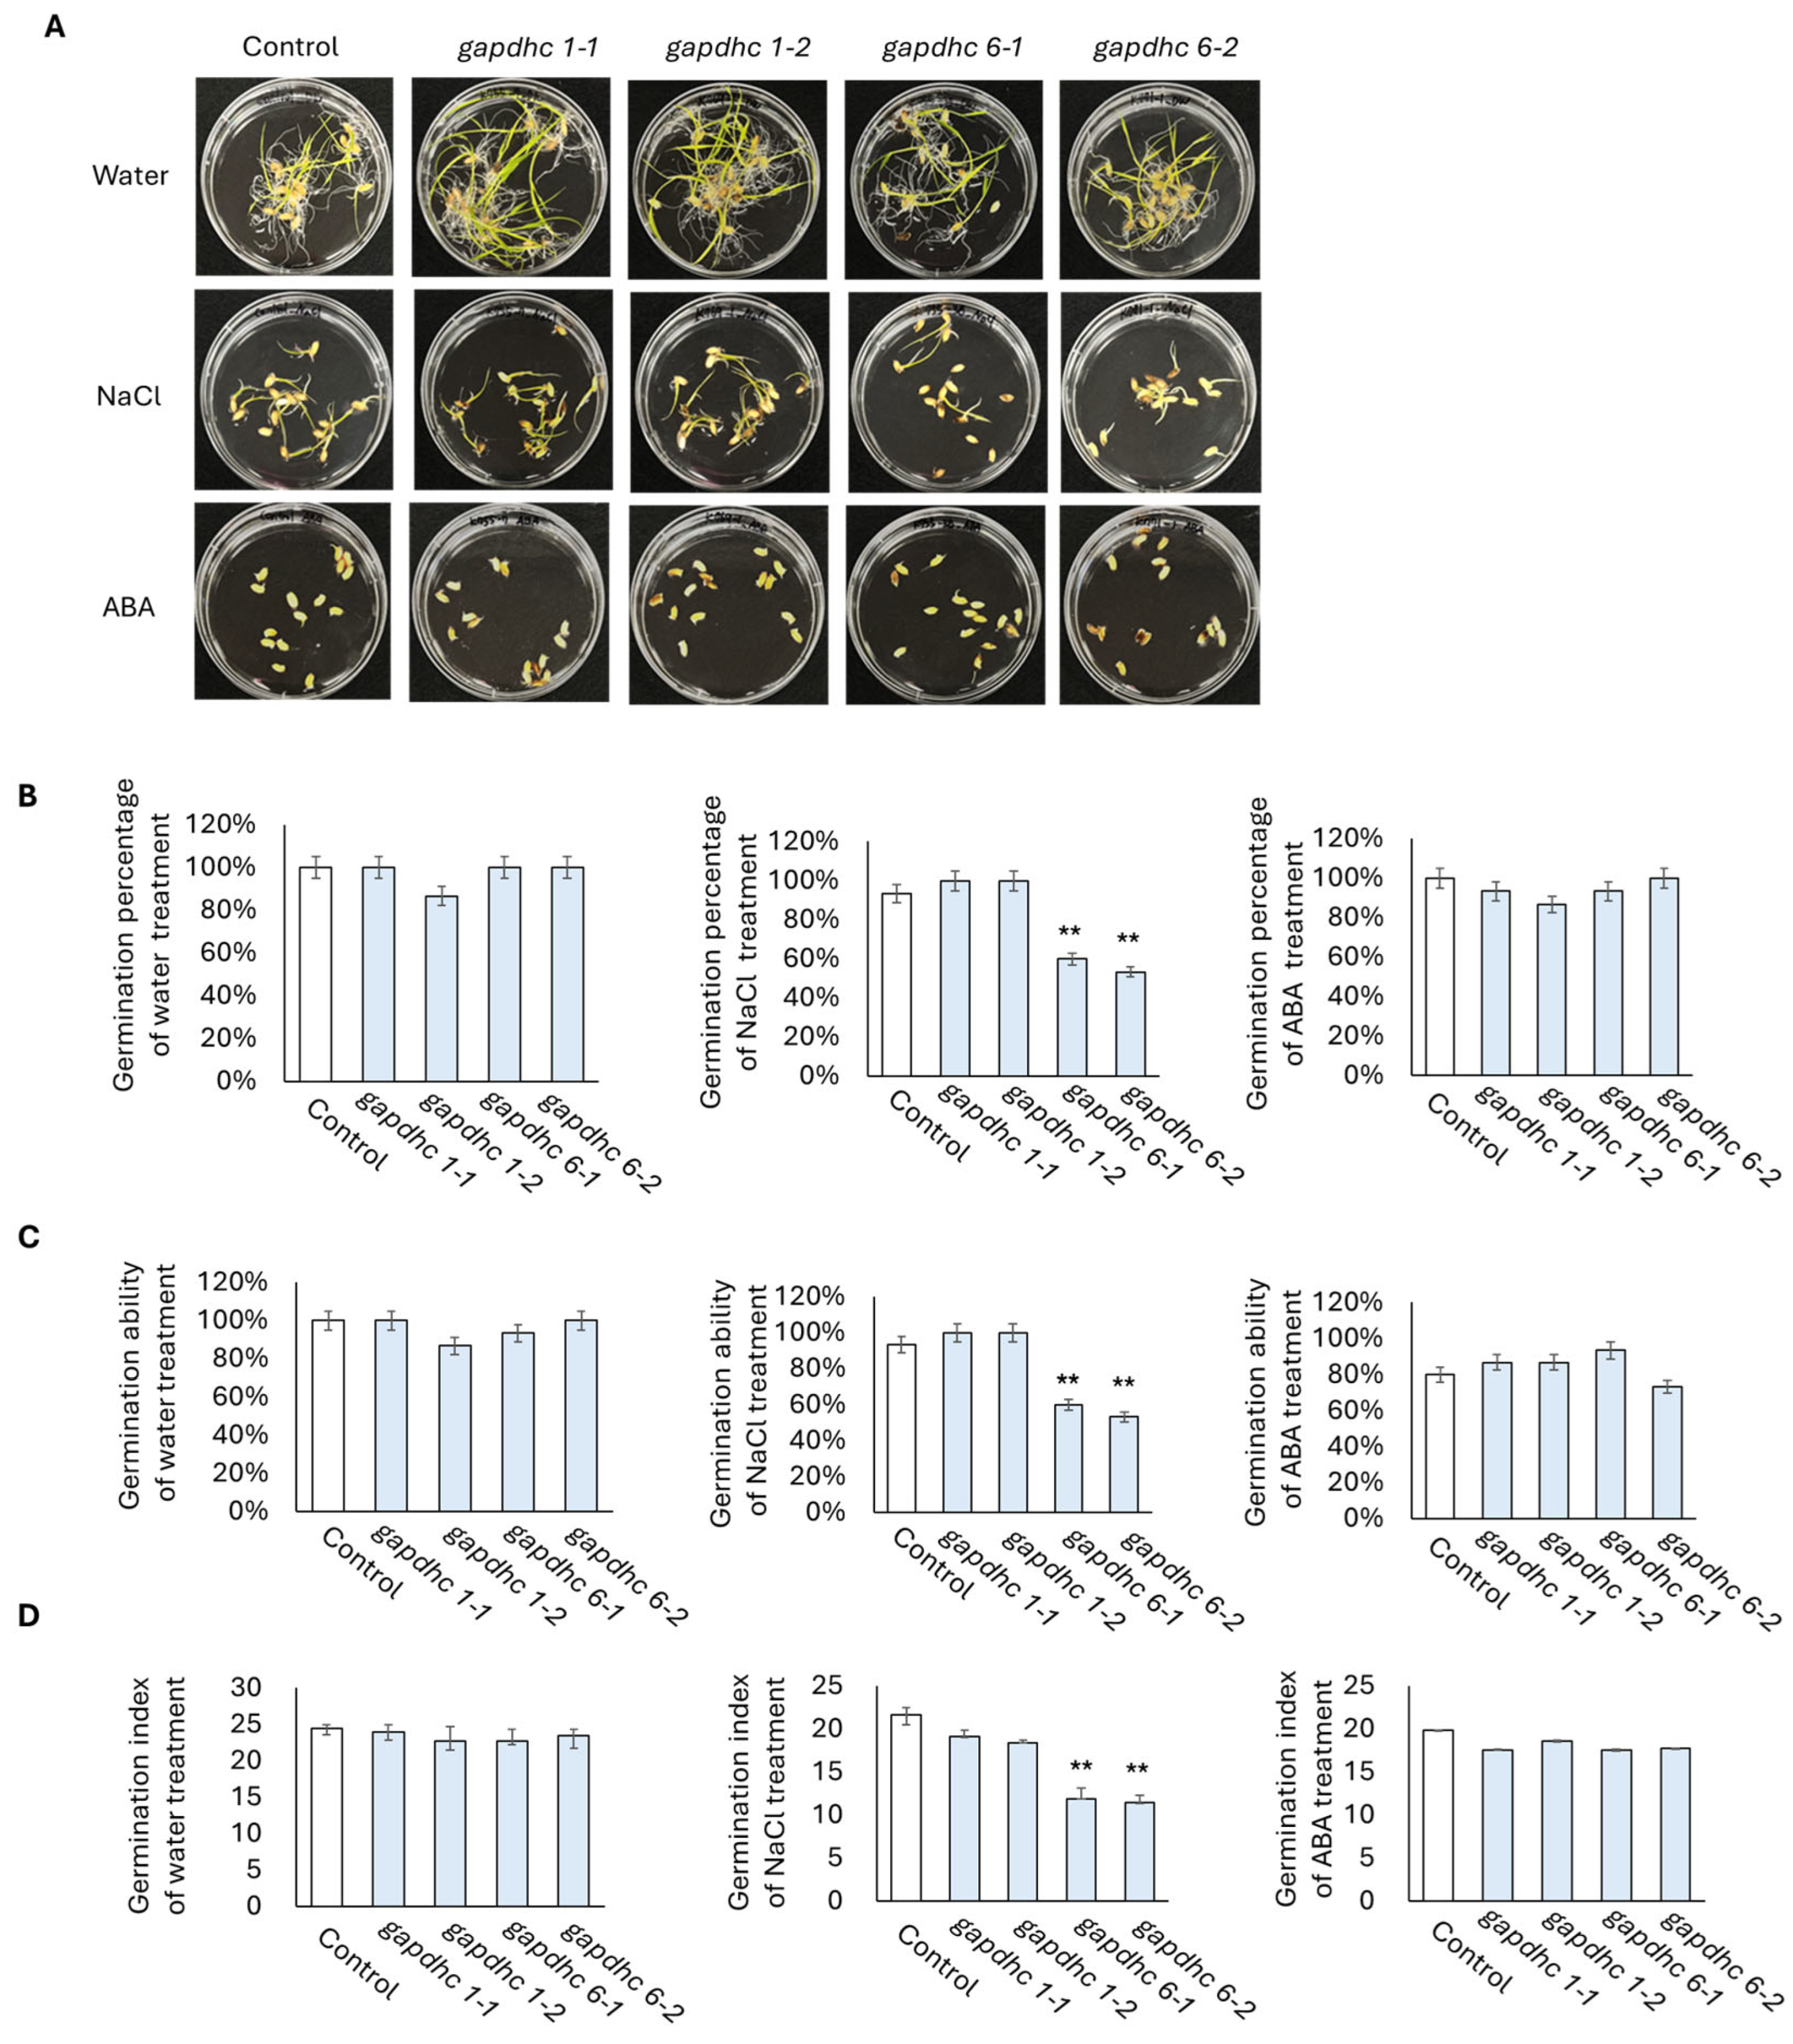
3.5. Response to Salt Stress in KO Lines Generated from GAPDHC6 Gene

Seed germination experiments were conducted on each of the four selected KO lines using a solution containing water, 200 mM NaCl, and 100 μM ABA. The germination rate, germination power, and germination index were examined daily for 10 days from the start date, and finally, the shots and roots lengths were examined. The germination rate, germination ability, and germination index of all the lines examined in the water and ABA treatment showed almost similar results. However, in the NaCl treatment, the germination rate, germination ability, and germination index of the gapdhc 6-1 and gapdhc 6-2 lines were very low compared to the WT (Figure 5). In addition, in the shoot and root lengths of the gapdhc 6-1 and gapdhc 6-2 lines of the NaCl treatment, significant differences were confirmed compared to the control, gapdhc 1-1, and gapdhc 1-2 lines (Figure 6). Therefore, the gapdhc 6-1 and gapdhc 6-2 lines showed a sensitive response to salt.

3.6. Expression Level of Stress Response Related Genes in KO Mutant Lines

In the germination experiment, the gapdhc 6-1, gapdhc 6-2, and WT plants were transferred tp pots and then the recovery process was carried out through water treatment for 15 days. The leaves of each seedling were sampled to examine the dynamics of stress reactants. The DAB staining of leaf disks of the gapdhc 6-1 and gapdhc 6-2 lines showed a marked difference at 3, 12, and 24 h compared to the WT. Therefore, the leaves of the gapdhc 6-1 and gapdhc 6-2 lines showed a sensitive reaction following NaCl treatment, considering that NaCl treatment easily led to cell death and a darker color was observed (Figure 7A). In addition, the ROS substance content in each leaf was measured, and the gapdhc 6-1 and gapdhc 6-2 lines accumulated very high levels of H2O2 and MDA compared to the WT (Figure 7B). The proline content of gapdhc 6-1 and gapdhc 6-2 lines was lower than that of WT, and the chlorophyll content was also slightly reduced. Therefore, we analyzed the expression levels of nine stress-responsive genes in gapdhc 6-1 and gapdhc 6-2 lines using qRT-PCR analysis. As a result, the gene expression levels of OsGLY, OsEFA27, OsBES1, OsERD1, and OsLea3 were decreased in gapdhc 6-1 and gapdhc 6-2 lines compared to WT. On the other hand, the expression level of OsRD22 was higher in the mutant lines than in WT (Figure 8).

4. Discussion

Rice is susceptible to various environmental stresses that significantly affect its productivity and quality. Among these stresses, salt stress is considered one of the major serious factors limiting crop production and plant growth in agriculture. In this study, we generated plants that were gene-edited with OsGAPDHC1 and OsGAPDHC6 using the CRISPR/Cas9 system, and selected KO lines were evaluated to assess responses to salt stress by examining seeds germination, gene expression levels, and ROS accumulation under salt stress. In the phylogenetic tree analysis, OsGAPDHC1 and OsGAPDHC6 were selected because they were very close to the cytosolic GAPDHC group, and their NAD+ binding domain and C-terminal domain were well conserved (Supplementary Figure S1). Expression levels of the OsGAPDHC1 and OsGAPDHC6 genes in rice were very high in seeds, but this differed from previously reported results [42]. In rice and Arabidopsis, GAPDHC was involved in seed development and energy metabolism, affecting seed size and oil content [42,43,44]. The change in the size of the T1 seed of the gapdhc6 mutant generated through the CRISPR/Cas9 system was consistent with the results of these previous studies (Figure 4). In addition, these changes in seed size are thought to be related to the high expression levels of OsGAPDHC1 and OsGAPDHC6 in the seeds (Figure 1). Thus, in rice, GAPDH may be involved in plant growth and development, and it may also play an important role in stress responses [32,45,46]. Rice is known to be particularly vulnerable to salt stress at the seedling stage [47] and highly susceptible at the reproductive stage [48]. However, the early vegetative growth stage of rice from seed germination to first-stage tiller development is known to be relatively salt-resistant [42,49]. When the expression level of OsGAPDHC genes in WT rice seedlings was analyzed under various abiotic stresses, the expression of OsGAPDHC1 and OsGAPDHC6 appeared to be related to salt (Figure 2). Furthermore, in germination experiments, gapdhc6 mutant lines were more sensitive to NaCl than WT, showing a lower germination rate, germination ability, and germination index, as well as reduced shoot and root length (Figure 5 and Figure 6). Salt stress can cause cell membrane damage, decreased CO2 uptake due to stomatal closure, decreased hydrolytic enzyme activity, and increased lipid peroxidation levels, which can stimulate the formation of ROS such as hydrogen peroxide [42,46]. The osgapdhc6 mutant line accumulated about 3 times more hydrogen peroxide in leaves than the WT. In addition, the leaves of the osgapdhc6 mutant line accumulated MDA 3.5 times more than the WT, and the leaf damage by DAB staining was also high (Figure 7). MDA is used as an indicator of oxidative damage that occurs during peroxidation due to stress-induced damage to lipid membranes [50]. Therefore, these results suggest that the osgapdhc6 mutant line was more affected by lipid peroxidation than the WT, resulting in greater damage to cell membrane integrity. Proline is generally known to act as a physiologically compatible solute, and its presence increases as needed to maintain favorable osmotic potential between cells and the surrounding environment [51]. Proline that accumulates in plants under salt stress can contribute to root growth [52], but the proline concentration of the osgapdhc6 mutant line was reduced by about half compared to the WT, and the root length was also the shortest (Figure 6B and Figure 7). Therefore, these results suggest that the knockout of OsGAPDHC6 gene is sensitive to salt stress and can affect plant growth by causing oxidative stress. The OsGAPDHC6 gene may interact with genes related to stress response to contribute to salt tolerance. In the osgapdhc6 mutant lines, the relative expression levels of OsGly, OsEFA27, OsBES1, OsERD1, and OsLea3 genes were significantly lower than those in the WT. The overexpression of OsGly I in rice enhanced tolerance to NaCl, ZnCl2, and mannitol [53], and overexpressed transgenic rice cultivars showed increased GLYI activity and enhanced salt stress tolerance, whereas the CRISPR/Cas9 knockout transgenic rice cultivars showed decreased GLYI activity and increased sensitivity to NaCl stress treatment [54]. EFA27 was identified as an ABA-responsive gene in rice seedlings [55], and in Arabidopsis, BES1 RNA interference (BES1-RNAi) lines were more sensitive to salt stress [47]. The overexpression of BRI1-EMS-Suppressor 1 (BES1) in Arabidopsis resulted in lower MDA, higher proline content, enhanced antioxidant enzyme activities, and higher expression levels of salt-responsive genes under salt stress [56]. Transgenic Arabidopsis plants overexpressing the BjERD4 gene exhibited enhanced tolerance to dehydration and salt stress, whereas the knockdown lines were more sensitive than wild-type plants under similar stress conditions [57]. The knockout of the Lea3 gene significantly increased the sensitivity of cotton plants to salt and drought stress, which was due to the loss of its strong interaction with glyceraldehyde-3-phosphate dehydrogenase A [58]. The overexpression of OsLEA3-2 improved growth performance compared to the control under salt and osmotic stress conditions [59]. These results were consistent with our experimental results. However, the OsRD22 gene showed a high expression level (Figure 8), which is inconsistent with the study result showing that the overexpression of the RD22 gene contributes to salt tolerance in tobacco plants [60]. The overexpression of OsDREB2A results in significant tolerance to osmotic, salt, and dehydration stress under stress conditions [61], and T2 and T3 transgenic lines overexpressing OsDREB2A have improved survival rates under severe drought and salt stress conditions compared to non-transgenic rice plants or rice plants transformed with empty vector controls [62], but our results are similar to those of WT varieties. Nevertheless, the decrease in the expression levels of OsGly, OsEFA27, OsBES1, OsERD1, and OsLea3 genes related to stress and response is suggested to be sufficient to determine the presence of salt-sensitivity. Therefore, the results of these experiments indicate that OsGAPDHC6 can increase salt tolerance by participating in the expression of stress-responsive genes in the early growth stages, from seed germination to just before first-stage tiller development.

Supplementary Materials

The following supporting information can be downloaded at https://www.mdpi.com/article/10.3390/genes16040436/s1, Supplementary Figure S1: Phylogenetic analysis of OsGAPDHC and multiple sequence alignment of OsGAPDHC1 and OsGAPDHC6 amino acids. (A) Phylogenetic analysis of GAPDHC in rice. (B) Multiple sequence alignment of amino acid sequences encoding OsGAPDHC6 and OsGAPDHC1 proteins. Identical, conserve residues in all aligned sequences are indicated by asterisks (*); Supplementary Figure S2: Development of OsGADPHC1 and OsGAPDHC6 transgenic plants using the CRISPR/Cas9 system. (A) Schematic diagram of OsGADPHCC1 gene map and sgRNA design. (B) Schematic diagram of OsGAPDHCC6 gene map and sgRNA design. Red triangles and white dotted lines indicate the positions of sgRNA. (C) OsGADPHCC1::sgRNA transformation and production of regenerated rice plants using Agrobacterium-mediated transformation. (D) OsGAPDHCC6::sgRNA transformation and production of regenerated rice plants using Agrobacterium-mediated transformation; Supplementary Table S1: sgRNA designed in this study; Supplementary Table S2: Transgenic plant production and gene editing rates; Supplementary Table S3: The primers list used in this study.

Author Contributions

Methodology, J.-Y.K., Y.-J.L., J.G., H.-J.L. and J.-H.K.; formal analysis, J.-Y.K. and Y.-J.L.; investigation, J.-Y.K., Y.-J.L., H.-M.L., Y.-S.J. and K.-S.N.; writing—original draft preparation, J.-Y.K. and Y.-J.L.; writing—review and editing, K.-K.K. and Y.-J.J.; supervision. K.-K.K. and Y.-J.J. All authors have read and agreed to the published version of the manuscript.

Funding

This work was supported by a grant from the New Breeding Technologies Development Program (Project No. RS-2024-00322378), Rural Development Administration, and basic science research program through the National Research Foundation of Korea (NRF) funded by the ministry education [2022R1A2C1092904], Republic of Korea.

Institutional Review Board Statement

Not applicable.

Informed Consent Statement

Not applicable.

Data Availability Statement

The original contributions presented in the study are included in the article/Supplementary Materials, further inquiries can be directed to the corresponding authors.

Conflicts of Interest

The authors declare no conflicts of interest.

References

  1. Qin, H.; Li, Y.; Huang, R. Advances and challenges in the breeding of salt-tolerant rice. Int. J. Mol. Sci. 2020, 21, 8385. [Google Scholar] [CrossRef] [PubMed]
  2. Shavrukov, Y.; Kurishbayev, A.; Jatayev, S.; Shvidchenko, V.; Zotova, L.; Koekemoer, F.; de Groot, S.; Soole, K.; Langridge, P. Early flowering as a drought escape mechanism in plants: How can it aid wheat production? Front. Plant Sci. 2017, 8, 1950. [Google Scholar] [CrossRef] [PubMed]
  3. Fahad, S.; Bajwa, A.A.; Nazir, U.; Anjum, S.A.; Farooq, A.; Zohaib, A.; Sadia, S.; Nasim, W.; Adkins, S.; Saud, S.; et al. Crop production under drought and heat stress: Plant responses and management options. Front. Plant Sci. 2017, 8, 1147. [Google Scholar] [CrossRef] [PubMed]
  4. Browse, J.; Xin, Z. Temperature sensing and cold acclimation. Curr. Opin. Plant Biol. 2001, 4, 241–246. [Google Scholar] [CrossRef]
  5. Devasirvatham, V.; Tan, D.K.Y. Impact of high temperature and drought stresses on chickpea production. Agronomy 2018, 8, 145. [Google Scholar] [CrossRef]
  6. Ali, A.; Shah, T.; Haider, G.; Awan, M.I.; Gohar, M.; Munsif, F.; Ahmad, I. Strigolactone-mediated oxidative stress alleviation in Brassica rapa through upregulating antioxidant system under water deficit conditions. J. Plant Growth Regul. 2023, 42, 4675–4687. [Google Scholar] [CrossRef]
  7. Khan, M.K.; Pandey, A.; Hamurcu, M.; Vyhnánek, T.; Zargar, S.M.; Kahraman, A.; Topal, A.; Gezgin, S. Exploring strigolactones for inducing abiotic stress tolerance in plants. Czech J. Genet. Plant Breed. 2024, 60, 55–69. [Google Scholar] [CrossRef]
  8. Takahashi, Y.; Sipp, D.; Enomoto, H. Tissue interactions in neural crest cell development and disease. Science 2013, 341, 860–863. [Google Scholar] [CrossRef]
  9. Flora, S.J.S.; Mittal, M.; Mehta, A. Heavy metal induced oxidative stress & its possible reversal by chelation therapy. Indian J. Med. Res. 2008, 128, 501–523. [Google Scholar]
  10. Zhang, X.-H.; Rao, X.-L.; Shi, H.-T.; Li, R.-J.; Lu, Y.-T. Overexpression of a cytosolic glyceraldehyde-3-phosphate dehydrogenase gene OsGAPC3 confers salt tolerance in rice. Plant Cell Tissue Organ Cult. (PCTOC) 2011, 107, 1–11. [Google Scholar] [CrossRef]
  11. Li, P.; Chen, Y.-H.; Lu, J.; Zhang, C.-Q.; Liu, Q.-Q.; Li, Q.-F. Genes and their molecular functions determining seed structure, components, and quality of rice. Rice 2022, 15, 18. [Google Scholar] [CrossRef] [PubMed]
  12. Hasan, M.; Rahman, A.; Corpas, F.J.; Rahman, M.; Jahan, M.S.; Liu, X.; Ghimire, S.; Alabdallah, N.M.; Wassem, M.; Alharbi, B.M.; et al. Salt stress tolerance in rice (Oryza sativa L.): A proteomic overview of recent advances and future prospects. Plant Stress 2024, 11, 100307. [Google Scholar] [CrossRef]
  13. Zheng, C.; Liu, C.; Liu, L.; Tan, Y.; Sheng, X.; Yu, D.; Sun, Z.; Sun, X.; Chen, J.; Yuan, D.; et al. Effect of salinity stress on rice yield and grain quality: A meta-analysis. Eur. J. Agron. 2023, 144, 126765. [Google Scholar] [CrossRef]
  14. Djaman, K.; Mel, V.; Boye, A.; Diop, L.; Manneh, B.; El-Namaky, R.; Koudahe, K.; Futakuchi, K. Rice genotype and fertilizer management for improving rice productivity under saline soil conditions. Paddy Water Environ. 2020, 18, 43–57. [Google Scholar] [CrossRef]
  15. Nishizawa, Y.; Mochizuki, S.; Koiwai, H.; Kondo, K.; Kishimoto, K.; Katoh, E.; Minami, E. Rice ubiquitin ligase EL5 prevents root meristematic cell death under high nitrogen conditions and interacts with a cytosolic GAPDH. Plant Signal. Behav. 2015, 10, e990801. [Google Scholar] [CrossRef]
  16. Peng, B.; Liu, Y.; Sun, X.; Zhao, Q.; Qiu, J.; Tian, X.; Peng, J.; Zhang, Z.; Wang, Y.; Huang, Y.; et al. The OsGAPC3 mutation significantly affects grain quality traits and improves the nutritional quality of rice. Front. Plant Sci. 2024, 15, 1470316. [Google Scholar] [CrossRef]
  17. Tossounian, M.-A.; Zhang, B.; Gout, I. The writers, readers, and erasers in redox regulation of GAPDH. Antioxidants 2020, 9, 1288. [Google Scholar] [CrossRef]
  18. Kosova, A.A.; Khodyreva, S.N.; Lavrik, O.I. Role of glyceraldehyde-3-phosphate dehydrogenase (GAPDH) in DNA repair. Biochemistry 2017, 82, 643–654. [Google Scholar] [CrossRef]
  19. Hyslop, P.A.; Chaney, M.O. Mechanism of GAPDH redox signaling by H2O2 activation of a two−cysteine switch. Int. J. Mol. Sci. 2022, 23, 4604. [Google Scholar] [CrossRef]
  20. Simkin, A.J.; Alqurashi, M.; Lopez-Calcagno, P.E.; Headland, L.R.; Raines, C.A. Glyceraldehyde-3-phosphate dehydrogenase subunits A and B are essential to maintain photosynthetic efficiency. Plant Physiol. 2023, 192, 2989–3000. [Google Scholar] [CrossRef]
  21. Ishiyama, K.; Sugawara, M.; Suzuki, Y.; Kondo, E.; Takegahara-Tamakawa, Y.; Yoon, D.-K.; Suganami, M.; Wada, S.; Miyake, C.; Makino, A. Overproduction of chloroplast glyceraldehyde-3-phosphate dehydrogenase improves photosynthesis slightly under elevated [CO2] conditions in rice. Plant Cell Physiol. 2021, 62, 156–165. [Google Scholar] [CrossRef]
  22. Hancock, J.T.; Henson, D.; Nyirenda, M.; Desikan, R.; Harrison, J.; Lewis, M.; Hughes, J.; Neill, S.J. Proteomic identification of glyceraldehyde 3-phosphate dehydrogenase as an inhibitory target of hydrogen peroxide in Arabidopsis. Plant Physiol. Biochem. 2005, 43, 828–835. [Google Scholar] [CrossRef] [PubMed]
  23. Rius, S.P.; Casati, P.; Iglesias, A.A.; Gomez-Casati, D.F. Characterization of Arabidopsis lines deficient in GAPC-1, a cytosolic NAD-dependent glyceraldehyde-3-phosphate dehydrogenase. Plant Physiol. 2008, 148, 1655–1667. [Google Scholar] [CrossRef] [PubMed]
  24. Zhao, Y.; Li, X.; Wang, F.; Zhao, X.; Gao, Y.; Zhao, C.; He, L.; Li, Z.; Xu, J. Glycerol-3-phosphate dehydrogenase (GPDH) gene family in Zea mays L.: Identification, subcellular localization, and transcriptional responses to abiotic stresses. PLoS ONE 2018, 13, e0200357. [Google Scholar] [CrossRef]
  25. Zhao, X.; Wang, J.; Xia, N.; Qu, Y.; Zhan, Y.; Teng, W.; Li, H.; Li, W.; Li, Y.; Zhao, X.; et al. Genome-wide identification and analysis of glyceraldehyde-3-phosphate dehydrogenase family reveals the role of GmGAPDH14 to improve salt tolerance in soybean (Glycine max L.). Front. Plant Sci. 2023, 14, 1193044. [Google Scholar] [CrossRef]
  26. Guo, L.; Devaiah, S.P.; Narasimhan, R.; Pan, X.; Zhang, Y.; Zhang, W.; Wang, X. Cytosolic glyceraldehyde-3-phosphate dehydrogenases interact with phospholipase Dδ to transduce hydrogen peroxide signals in the Arabidopsis response to stress. Plant Cell 2012, 24, 2200–2212. [Google Scholar] [CrossRef]
  27. Kim, S.-C.; Guo, L.; Wang, X. Nuclear moonlighting of cytosolic glyceraldehyde-3-phosphate dehydrogenase regulates Arabidopsis response to heat stress. Nat. Commun. 2020, 11, 3439. [Google Scholar] [CrossRef]
  28. Yang, Y.; Kwon, H.B.; Peng, H.P.; Shih, M.C. Stress responses and metabolic regulation of glyceraldehyde-3-phosphate dehydrogenase genes in Arabidopsis. Plant Physiol. 1993, 101, 209–216. [Google Scholar] [CrossRef]
  29. Velasco, R.; Salamini, F.; Bartels, D. Dehydration and ABA increase mRNA levels and enzyme activity of cytosolic GAPDH in the resurrection plant Craterostigma plantagineum. Plant Mol. Biol. 1994, 26, 541–546. [Google Scholar] [CrossRef]
  30. Cao, Y.; Hong, J.; Wang, H.; Lin, M.; Cai, Y.; Liao, L.; Li, X.; Han, Y. Beyond Glycolysis: Multifunctional Roles of Glyceralde-hyde-3-phosphate dehydrogenases (GAPDHs) in Plants. Hortic. Res. 2025, uhaf070. [Google Scholar]
  31. Kim, J.-Y.; Lee, Y.-J.; Lee, H.-J.; Go, J.-Y.; Lee, H.-M.; Park, J.-S.; Cho, Y.-G.; Jung, Y.-J.; Kang, K.-K. Knockout of OsGAPDHC7 Gene Encoding Cytosolic Glyceraldehyde-3-Phosphate Dehydrogenase Affects Energy Metabolism in Rice Seeds. Int. J. Mol. Sci. 2024, 25, 12470. [Google Scholar] [CrossRef] [PubMed]
  32. Kumar, S.; Stecher, G.; Tamura, K. MEGA7: Molecular evolutionary genetics analysis version 7.0 for bigger datasets. Mol. Biol. Evol. 2016, 33, 1870–1874. [Google Scholar] [CrossRef] [PubMed]
  33. Park, J.; Bae, S.; Kim, J.-S. Cas-Designer: A web-based tool for choice of CRISPR-Cas9 target sites. Bioinformatics 2015, 31, 4014–4016. [Google Scholar] [CrossRef] [PubMed]
  34. Nishimura, A.; Aichi, I.; Matsuoka, M. A protocol for Agrobacterium-mediated transformation in rice. Nat. Protoc. 2006, 1, 2796–2802. [Google Scholar] [CrossRef]
  35. Jung, Y.J.; Bae, S.; Lee, G.-J.; Seo, P.J.; Cho, Y.-G.; Kang, K.K. A novel method for high-frequency genome editing in rice, using the CRISPR/Cas9 system. J. Plant Biotechnol. 2017, 44, 89–96. [Google Scholar] [CrossRef]
  36. Jung, Y.J.; Lee, H.J.; Bae, S.; Kim, J.H.; Kim, D.H.; Kim, H.K.; Nam, K.H.; Nogoy, F.M.; Cho, Y.-G.; Kang, K.K. Acquisition of seed dormancy breaking in rice (Oryza sativa L.) via CRISPR/Cas9-targeted mutagenesis of OsVP1 gene. Plant Biotechnol. Rep. 2019, 13, 511–520. [Google Scholar] [CrossRef]
  37. Park, J.; Lim, K.; Kim, J.-S.; Bae, S. Cas-analyzer: An online tool for assessing genome editing results using NGS data. Bioinformatics 2016, 33, 286–288. [Google Scholar] [CrossRef]
  38. Yu, J.; Zhao, W.; Tong, W.; He, Q.; Yoon, M.-Y.; Li, F.-P.; Choi, B.; Heo, E.-B.; Kim, K.-W.; Park, Y.-J. A genome-wide association study reveals candidate genes related to salt tolerance in rice (Oryza sativa) at the germination stage. Int. J. Mol. Sci. 2018, 19, 3145. [Google Scholar] [CrossRef]
  39. Kang, L.; Kim, H.S.; Kwon, Y.S.; Ke, Q.; Ji, C.Y.; Park, S.-C.; Lee, H.-S.; Deng, X.; Kwak, S.-S. IbOr regulates photosynthesis under heat stress by stabilizing IbPsbP in sweetpotato. Front. Plant Sci. 2017, 8, 989. [Google Scholar] [CrossRef]
  40. Jung, Y.J.; Go, J.Y.; Lee, H.J.; Park, J.S.; Kim, J.Y.; Lee, Y.J.; Ahn, M.-J.; Kim, M.-S.; Cho, Y.-G.; Kwak, S.-S.; et al. Overexpression of Orange Gene (OsOr-R115H) Enhances Heat Tolerance and Defense-Related Gene Expression in Rice (Oryza sativa L.). Genes 2021, 12, 1891. [Google Scholar] [CrossRef]
  41. Meza, S.L.R.; Egea, I.; Massaretto, I.L.; Morales, B.; Purgatto, E.; Egea-Fernández, J.M.; Bolarin, M.C.; Flores, F.B. Traditional tomato varieties improve fruit quality without affecting fruit yield under moderate salt stress. Front. Plant Sci. 2020, 11, 587754. [Google Scholar] [CrossRef]
  42. Zeng, L.; Shannon, M.C. Effects of salinity on grain yield and yield components of rice at different seeding densities. Agron. J. 2000, 92, 418–423. [Google Scholar] [CrossRef]
  43. Guo, L.; Ma, F.; Wei, F.; Fanella, B.; Allen, D.K.; Wang, X. Cytosolic phosphorylating glyceraldehyde-3-phosphate dehydrogenases affect Arabidopsis cellular metabolism and promote seed oil accumulation. Plant Cell 2014, 26, 3023–3035. [Google Scholar] [CrossRef] [PubMed]
  44. Piattoni, C.V.; Ferrero, D.M.L.; Dellaferrera, I.; Vegetti, A.; Iglesias, A.Á. Cytosolic glyceraldehyde-3-phosphate dehydrogenase is phosphorylated during seed development. Front. Plant Sci. 2017, 8, 522. [Google Scholar] [CrossRef]
  45. Kappachery, S.; Sasi, S.; Alyammahi, O.; Alyassi, A.; Venkatesh, J.; Gururani, M.A. Overexpression of cytoplasmic Solanum tuberosum Glyceraldehyde 3-phosphate dehydrogenase (GAPDH) gene improves PSII efficiency and alleviates salinity stress in Arabidopsis. J. Plant Interact. 2021, 16, 398–410. [Google Scholar]
  46. Kim, S.C.; Yao, S.; Zhang, Q.; Wang, X. Phospholipase Dδ and phosphatidic acid mediate heat-induced nuclear localization of glyceraldehyde-3-phosphate dehydrogenase in Arabidopsis. Plant J. 2022, 112, 786–799. [Google Scholar]
  47. Feng, L.; Li, Y.; Zhou, Y.-L.; Meng, G.-H.; Ji, Z.-L.; Lin, W.-H.; He, J.-X. Integrative transcriptomic and proteomic analyses reveal a positive role of BES1 in salt tolerance in Arabidopsis. Front. Plant Sci. 2023, 14, 1034393. [Google Scholar] [CrossRef]
  48. Khatun, S.; Flowers, T.J. Effects of salinity on seed set in rice. Plant Cell Environ. 1995, 18, 61–67. [Google Scholar] [CrossRef]
  49. Khan, M.S.A.; Hamid, A.; Karim, M.A. Effect of sodium chloride on germination and seedling characters of different types of rice (Oryza sativa L.). J. Agron. Crop Sci. 1997, 179, 163–169. [Google Scholar] [CrossRef]
  50. Jain, M.; Mathur, G.; Koul, S.; Sarin, N. Ameliorative effects of proline on salt stress-induced lipid peroxidation in cell lines of groundnut (Arachis hypogaea L.). Plant Cell Rep. 2001, 20, 463–468. [Google Scholar] [CrossRef]
  51. Pollard, A.; Jones, R.G.W. Enzyme activities in concentrated solutions of glycinebetaine and other solutes. Planta 1979, 144, 291–298. [Google Scholar] [CrossRef] [PubMed]
  52. Lin, C.C.; Kao, C.H. Proline accumulation is associated with inhibition of rice seedling root growth caused by NaCl. Plant Sci. 1996, 114, 121–128. [Google Scholar] [CrossRef]
  53. Zeng, Z.; Xiong, F.; Yu, X.; Gong, X.; Luo, J.; Jiang, Y.; Kuang, H.; Gao, B.; Niu, X.; Liu, Y. Overexpression of a glyoxalase gene, OsGly I, improves abiotic stress tolerance and grain yield in rice (Oryza sativa L.). Plant Physiol. Biochem. 2016, 109, 62–71. [Google Scholar] [CrossRef] [PubMed]
  54. Liu, S.; Liu, W.; Lai, J.; Liu, Q.; Zhang, W.; Chen, Z.; Gao, J.; Song, S.; Liu, J.; Xiao, Y. OsGLYI3, a glyoxalase gene expressed in rice seed, contributes to seed longevity and salt stress tolerance. Plant Physiol. Biochem. 2022, 183, 85–95. [Google Scholar] [CrossRef]
  55. Frandsen, G.; Müller-Uri, F.; Nielsen, M.; Mundy, J.; Skriver, K. Novel Plant Ca2+-binding Protein Expressed in Response to Abscisic Acid and Osmotic Stress. J. Biol. Chem. 1996, 271, 343–348. [Google Scholar] [CrossRef]
  56. Cao, X.; Ma, W.; Zeng, F.; Cheng, Y.; Ma, Z.; Mao, J.; Chen, B. Grape BES1 transcription factor gene VvBES1-3 confers salt tolerance in transgenic Arabidopsis. Gene 2022, 854, 147059. [Google Scholar] [CrossRef]
  57. Rai, A.N.; Tamirisa, S.; Rao, K.V.; Kumar, V.; Suprasanna, P. RETRACTED ARTICLE: Brassica RNA binding protein ERD4 is involved in conferring salt, drought tolerance and enhancing plant growth in Arabidopsis. Plant Mol. Biol. 2015, 90, 375–387. [Google Scholar] [CrossRef]
  58. Shiraku, M.L.; Magwanga, R.O.; Zhang, Y.; Hou, Y.; Kirungu, J.N.; Mehari, T.G.; Xu, Y.; Wang, Y.; Wang, K.; Cai, X.; et al. Late embryogenesis abundant gene LEA3 (Gh_A08G0694) enhances drought and salt stress tolerance in cotton. Int. J. Biol. Macromol. 2022, 207, 700–714. [Google Scholar] [CrossRef]
  59. Duan, J.; Cai, W. OsLEA3-2, an abiotic stress induced gene of rice plays a key role in salt and drought tolerance. PLoS ONE 2012, 7, e45117. [Google Scholar] [CrossRef]
  60. Jamoussi, R.J.; Elabbassi, M.M.; BEN Jouira, H.; Hanana, M.; Zoghlami, N.; Ghorbel, A.; Mliki, A. Physiological responses of transgenic tobacco plants expressing the dehydration-responsive RD22 gene of Vitis vinifera to salt stress. Turk. J. Bot. 2014, 38, 268–280. [Google Scholar] [CrossRef]
  61. Mallikarjuna, G.; Mallikarjuna, K.; Reddy, M.K.; Kaul, T. Expression of OsDREB2A transcription factor confers enhanced dehydration and salt stress tolerance in rice (Oryza sativa L.). Biotechnol. Lett. 2011, 33, 1689–1697. [Google Scholar] [CrossRef] [PubMed]
  62. Cui, M.; Zhang, W.; Zhang, Q.; Xu, Z.; Zhu, Z.; Duan, F.; Wu, R. Induced over-expression of the transcription factor OsDREB2A improves drought tolerance in rice. Plant Physiol. Biochem. 2011, 49, 1384–1391. [Google Scholar] [CrossRef] [PubMed]
Figure 1. Expression levels of OsGAPDHC1 and OsGAPDHC6 in rice organs from seed germination to first tillering using qRT-PCR. Error bars represent standard deviation calculated from three repetitions (mean ± SD, n = 3).
Genes 16 00436 g001
Figure 2. The analysis of the expression levels of OsGAPHDC1 and OsGAPHDC6 gene in seeds under abiotic stress (ABA, PEG, NaCl, heat, cold) conditions. The values 0 h, 3 h, 6 h, 12 h, and 24 h represent the treatment time for each abiotic stress. The 0 h samples of each abiotic stress condition were used as standards. Error bars represent the standard deviation calculated from three repetitions (mean ± SD, n = 3).
Genes 16 00436 g002
Figure 3. Selection of transgenic plants and gene-edited plants using deep-sequencing analysis. (A) Amplification of bar region and determination of T-DNA insertion by PCR analysis. M, 100 bp marker; PC, positive control; WT, wild type; DW, negative control. (B,C) Plants gene-edited using deep-sequencing analysis. The part highlighted in black represents sgRNA, and the underlined letters represent the PAM (NGG) region. Red letters indicate inserted bases, and dashes indicate deleted bases.
Genes 16 00436 g003
Figure 4. Phenotype analysis of seeds in T1 generation. (A) Seeds of WT and T1 mutants. Bar = 0.5 cm. (B) Measurements of seed length, width, and thickness of WT and T1 mutant lines. Error bars represent standard deviation in ten replicates (mean ± SD, n = 10). Asterisks indicate differences between WT and mutants (0.5 < * p, 0.05 < ** p < 0.5).
Genes 16 00436 g004
Figure 5. Germination experiments of KO mutant lines under water, salt, and ABA conditions. (A) Seeds of WT and T1 mutant lines were germinated for 10 days under conditions of water, NaCl (200 mM), and ABA (100 μM). (B) Germination rate. Measured on the 10th day after seed soaking. (C) Germination ability. The number of germinated seeds was measured on the 4th day of seed soaking. (D) Germination index. The number of germinated seeds per day was recorded. Error bars represent standard deviation in three replicates (mean ± SD, n = 3). Asterisks indicate differences between WT and mutants (0.05 < ** p < 0.5).
Genes 16 00436 g005
Figure 6. Measurement of shoot and root length growth of KO mutant lines under water, salt, and ABA conditions. (A) Measurement of shoot and root lengths of WT and KO mutant lines undergoing water treatment. (B) Measurement of shoot and root lengths of WT and KO mutant lines undergoing 200 mM NaCl treatment. (C) Measurement of shoot and root lengths of WT and KO mutant lines undergoing 100 μM ABA treatment. “°” represents a distributed individual value.
Genes 16 00436 g006
Figure 7. Analysis of ROS and antioxidant accumulation in leaves of WT and gapdhc6 mutants. (A) Cell death analysis using DAB staining. (B) Evaluation of ROS and antioxidant contents. Error bars represent standard deviation in three replicates (mean ± SD, n = 3). Asterisks indicate differences between WT and mutants (0.5 < * p, 0.05 < ** p < 0.5, *** p < 0.05).
Genes 16 00436 g007
Figure 8. Relative expression levels of salt stress response genes in leaves of WT and gapdhc6 mutants. Error bars represent standard deviation in three replicates (mean ± SD, n = 3). Asterisks indicate differences between WT and mutants (0.5 < * p, 0.05 < ** p < 0.5, *** p < 0.05).
Genes 16 00436 g008
Disclaimer/Publisher’s Note: The statements, opinions and data contained in all publications are solely those of the individual author(s) and contributor(s) and not of MDPI and/or the editor(s). MDPI and/or the editor(s) disclaim responsibility for any injury to people or property resulting from any ideas, methods, instructions or products referred to in the content.

