Abstract
Background: Plant anthocyanins are a secondary metabolite widely distributed in the roots, stems, leaves, flowers, and fruits of plants, and their synthesis is significantly affected by light intensity. To investigate the synthesis of anthocyanins in Aglaonema commutatum’s leaves under different light intensities is essential. Methods: Using the commonly colored leaf A. commutatum variety ‘Emerald’ as the control group, and the red-leaf varieties ‘Red Ruyi’, ‘Angel’, and ‘Gilly Red’ as the experimental material, three light intensities were set: 254~368 μmol·m−2·s−1 (CK), 588~678 μmol·m−2·s−1 (T1), and 1125~1267 μmol·m−2·s−1 (T2). Results: The changes in anthocyanin content and anthocyanin-related gene expression in the leaves of A. commutatum with different leaf colors under different light intensities were studied. The results show that the anthocyanin content of A. commutatum leaves had a different trend compared to A. commutatum with increasing light intensity, and the appropriate light intensity could significantly promote anthocyanin synthesis after a certain time, and vice-versa. The anthocyanin content of CK and the T1 treatment was 1.14–3.72 times that of the T2 treatment; the photosensitive genes PHYB, CRY, and UVR8 were correlated with the anthocyanin synthesis of ‘Angel’ and ‘Gilly Red’. The anthocyanin structural genes PAL, DFR, and ANS were correlated with the anthocyanin synthesis of ‘Red Ruyi’, ‘Angel’, and ‘Gilly Red’. The anthocyanin transcription factor bHLH was strongly correlated with the anthocyanin synthesis of ‘Angel’. Conclusions: As a byproduct from A. commutatum leaves with ornamental value and potential economic value, this study was helpful to understand the potential mechanism of A. commutatum’s leaves where light intensity regulates anthocyanin synthesis and accumulation.
1. Introduction
Collectively known in the family Araceae, A. commutatum is a perennial evergreen flowering plant native to tropical Asian countries, including India, Thailand, Vietnam, Philippines, Malaysia, and Indonesia. Because of their bright and varied leaves and easy cultivation and management, they can be used as an excellent leaf viewing and fresh-cut ornamental plant, especially A. commutatum’s new variety with red leaves, which is becoming increasingly popular in the market. The content and proportion of pigment in the leaves are important factors in A. commutatum. Chlorophyll, carotenoids, and anthocyanin are the key factors determining A. commutatum’s leaf color, of which anthocyanin is the main pigment that shows red, purple, or blue [1].
As the main natural pigment, anthocyanins are flavonoids with special molecular structure and strong water solubility [2]. According to their molecular structure, anthocyanins can be divided into six classes: malva pigment, petunidin ligand, anthocyanidin, peonidin, delphinidin, and anthocyanins. Anthocyanins maintain a wide range of colors in plants, are the main color substances, and play an essential role in plants under stresses such as drought, low temperature, ultraviolet radiation, and pathogen infection [2,3,4,5]. In daily life, anthocyanins can be used as antioxidants to prevent cardiovascular disease, cancer, and some chronic diseases, and are also widely used in the food, medicine, and cosmetics industries [6]. The anthocyanin biosynthesis pathway is mainly divided into three stages. First, the precursor phenylalanine synthesizes 4-acyl-CoA via PAL (phenylalanine ammonlyase), C4H (trans-cinnamate 4-monooxygenase), and 4CL (4-coumaric acid CoA Ligase 2) [7]. Second, 4-acyl-CoA and malonyl CoA are catalyzed by CHS (chalcone synthetase) to synthesize tetrahydroxyl chalcone, which is then isomerized by CHI (chalcone isomerization) to form the colorless compound trihydroxyl dihydroflavone, which is then catalyzed by F3H (dihydroflavone-3 hydroxylase) to synthesize dihydroflavones and dihydroflavonol [8]. Finally, DFR (dihydroflavonol-4-reductase) catalyzes the reduction of flavanones and dihydroflavonols to produce different colorless anthocyanins. These colorless anthocyanins are catalyzed by ANS (anthocyanin synthetase) to produce colored anthocyanins and UFGT (UDP-glucose-flavonoid 3-o-glucosyltransferase) to bind colored anthocyanins to glycosides, converting them to colored anthocyanins [9].
Light is one of the key environmental factors affecting the color of many plants. Light intensity, light quality, and the photoperiod affect the biosynthesis of anthocyanins, among which light intensity has the most significant effect. The expression of anthocyanin synthetase genes (CHS, CHI, DFR, F3H, LDOX, F3′5′H) and regulatory genes (VvMYB30, VvbHLH79, VvbHLH121) can be changed by the shading treatment in grape (V. vifera L.) to reduce the anthocyanin content. It was also found that the expression of structural genes (LDOX, CHS, F3H, DFR, CHI, UFGT) and regulatory genes (MybA1) were down-regulated under strong light, resulting in the decrease in the anthocyanin content [10,11]. The molecular mechanism of regulating anthocyanin biosynthesis by light intensity has been studied in many horticultural crops, such as blueberry [12] and pepper [13]. Therefore, studying the mechanism of influence of light intensity on anthocyanin synthesis is an important basis for improving anthocyanins in plants.
In A. commutatum, 26 anthocyanin biosynthesis structural genes and four key regulatory transcription factors were identified by transcriptome analysis, and it was further revealed that transcription factors (AcMYB1 and AcbHLH1) interact with anthocyanin biosynthesis structural genes to regulate anthocyanin biosynthesis in A. commutatum [1,14]. However, the mechanism by which light intensity regulates anthocyanin biosynthesis from the leaves of A. commutatum has not been reported. Light intensity was taken as the investigation starting point, and the red-leaf rough-rib grass varieties A. commutatum ‘Red Ruyi’, ‘Angel’, and ‘Gilly Red’ and the evergreen-leaf A. commutatum variety ‘Emerald’ were used as the test materials. Taking into consideration the effect of different light intensities on the anthocyanin content and gene expression from A. commutatum leaves, the relationship between different light intensities and anthocyanin biosynthesis in A. commutatum leaves was investigated, so as to understand the environmental factors that affect A. commutatum leaf color change. We hope to provide a reference for the scientific conservation and management of A. commutatum.
2. Materials and Methods
2.1. Overview of the Test Site
The test site is located in the Baiyun campus, Zhongkai University of Agricultural and Engineering, Baiyun district, Guangzhou, with an altitude of 30 m, east longitude 113°26′, and north latitude 23°22′. It has a subtropical monsoon climate with a maximum temperature of 38 °C, a minimum temperature of 3 °C, and an annual average temperature of 22 °C. The annual effective accumulated temperature of ≥10 °C is 8000 °C, the annual precipitation is 1695.90 mm, the annual average relative humidity is 77%, the annual average sunshine duration is 1800 h, the frost-free period is as long as 11 and a half months, and the total solar radiation is 4500 MJ/m2.
2.2. Test Materials
We procured, from Xilin Horticulture Co., LTD., Guangzhou, China, A. commutatum as a disease-free and robust plant. Four varieties of A. commutatum aged 1.5 years old that were growing well and had basically the same growth (plant height of 30~40 cm) were selected, including A. commutatum with red leaves—A. commutatum ‘Red Ruyi’ (abbreviated as ‘Red Ruyi’), A. commutatum ‘Angel’ (abbreviated as ‘Angel’), and A. commutatum ‘Gilly Red’ (abbreviated as ‘Gilly Red’)—and a constant-colored leaf variety: A. commutatum ‘Emerald’ (abbreviated as ‘Emerald’). Samples were taken from 3 to 4 healthy mature leaves of A. commutatum ‘Emerald’ (from the tip of the plant).
2.3. Experimental Design
According to the actual situation of the pre-test and the cultivation of A. commutatum, three kinds of light intensity settings were set as follows: CK (heavy shade, 254–368 μmol·m−2·s−1), T1 (medium shade, 588–678 μmol·m−2·s−1), and T2 (natural light, 1125–1267 μmol·m−2·s−1). A LI-6800 portable photosynthesis system (LI-6800, LI-COR, Lincoln, NE, USA) was used to monitor the range of light intensity. A completely randomized block design was used, with 5 replicates per treatment and 1 replicate per 10 POTS per variety.
2.4. Sample Collection
According to the experimental protocol, A. commutatum plants with homogeneous growth should be selected for sample collection at different times after treatment. The 3 to 4 samples taken from healthy mature leaves of A. commutatum plants of the same size from the tip downward were randomly selected from each group; the leaf size was at a medium level on the whole plant and each biological cycle was repeated three times at each stage. The sample was placed in a foil-wrapped spiral tip bottom centrifuge tube, stored in liquid nitrogen, and returned to the laboratory for storage in a −80 °C ultra-low temperature refrigerator.
2.5. Measurement of Leaf Patch Area
At 0 d and 75 d, for the four varieties A. commutatum, a whiteboard was placed behind the fully grown functional leaf of A. commutatum and measurements were taken, and the green and white/red patch areas were determined by ImageJ 1.8.0 analysis.
2.6. Determination of Anthocyanin Content Index
The extraction method with 1% hydrochloric acid methanol was used. Three to four healthy samples from mature leaves with different leaf colors were taken from the tip of A. commutatum plants under each of the three light intensities. Leaf samples were accurately weighted (0.1 g) and put into a test tube containing 5 mL 1% hydrochloric acid and methanol (hydrochloric acid: methanol = 1:999,129 (v/v)) to extract the anthocyanins. After 24 h in the dark at 4 °C, the supernatant was collected and a UV-VIS spectrophotometer (TU-1810; Beijing Beifen Ruili Analytical Instrument Co., Ltd., Beijing, China) was used at 530 nm and 657 nm colorimetric wavelength.
2.7. Quantitative RT-qPCR
After 75 days of growth under different light conditions, the samples were subjected to RT-PCR experiments. The RT-qPCR method was conducted under the guidance of Taylor et al. [15]. Total RNA was isolated via an RNA extraction kit (Tsingke Bio Inc., Beijing, China). The concentration of each RNA sample was assessed using a ultramicrospectrophotometer (Aosheng, Nano-500, Hangzhou, China), and the integrity of the RNA was verified via gel electrophoresis. One microgram of isolated RNA was subsequently used to obtain first-strand cDNA via reverse transcription using the PrimeScript™ RT Kit with gDNA Eraser (Takara Bio Inc., Beijing, China). qRT-PCR analysis was performed using a fluorescence quantitative instrument (BIO RED CFX Connect Real-Time System, Shanghai, China). A two-step PCR amplification program was employed, including initial denaturation at 95 °C for 5 min, followed by 40 cycles of denaturation at 95 °C for 10 s and annealing at 60 °C for 30 s. Three biological replicates were performed for each program.
Fluorescent quantitative primers were validated by HieffTMqPCRSYBRGreenMasterMix (NoRox) (Yeasen, Shanghai, China). According to the full-length CDS sequence of the key synthetases in the anthocyanin biosynthesis pathway obtained by the transcriptome sequencing of A. commutatum, three anthocyanin structural genes, anthocyanin regulatory genes, and photosensitive genes were selected. The Primer Premier 5 software was used to design the specific primers, and the A. commutatum gene Actin was used as an internal reference. The primer sequences used are shown in Table 1 (all primers in this experiment were synthesized by Ruqi Biotechnology Co., Ltd. Guangzhou, China). The results were analyzed for relative quantification using the 2−∆∆Ct method [16]. Origin 2022b was used for statistical mapping.

Table 1.
Fluorescent quantitative PCR primers.
2.8. Data Processing
Excel 2019 and Origin 2022b software were used to organize the data and plot the experimental data. A one-way ANOVA was performed for all data by using the SPSS 26.0 software (SPSS Inc., Chicago, IL, USA) and the Duncan method (p < 0.05).
3. Results
3.1. Effect of Light Intensity on Leaf Patch Area from A. commutatum
Leaf states of each A. commutatum variety at 0 d and 75 d are shown in Figure 1 and Figure 2. As can be seen from Table 2, the effect of different light intensities on the area proportion of the four A. commutatum color patches was not significant. At 75 days of treatment, ‘Emerald’ and ‘Gilly Red’ tend to increase first as the light intensity increases, while ‘Red Ruyi’ and ‘Angel’ tend to decrease and then increase as the light intensity increases. The value of ‘Emerald’ T2 decreased by 3.80% compared to that of CK, and increased by 4.20% compared to that on 0 d; ‘Red Ruyi’ T2 increased by 2.00% compared to CK in the same period. The value of ‘Angel’ T2 increased by 18.60% compared to that of CK; and ‘Gilly Red’ T2 decreased by 11.76% compared to CK.
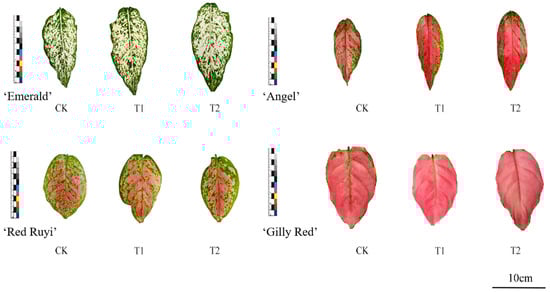
Figure 1.
Leaf diagram of A. commutatum (0 d).
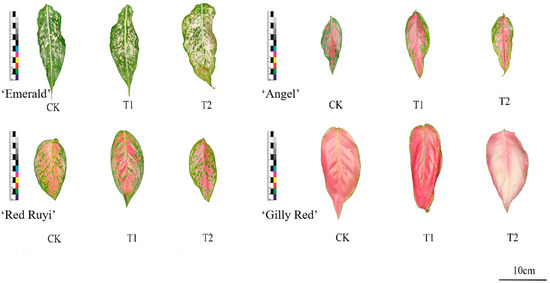
Figure 2.
Leaf diagram of A. commutatum (75 d).
Table 2.
Effect of light intensity on the proportion of leaf patch areas.
When the area of white/red blocks was treated for 75 days, ‘Emerald’ and ‘Gilly Red’ showed an upward trend with the increase in light intensity, while ‘Red Ruyi’ and ‘Angel’ showed an upward trend and then a downward trend with the increase in light intensity. The value of ‘Emerald’ T2 increased by 4.20% compared to that of CK, and decreased by 3.80% compared to 0d. ‘Red Ruyi’ T2 decreased by 1.90% compared to CK. The value of ‘Angel’ T2 decreased by 14.00% compared to that of CK; and ‘Gilly Red’ T2 increased by 2.40% compared to CK in the same period. There was no significant difference between the effect of different light intensities on A. commutatum leaf patch color, possibly due to the treatment time being too short.
3.2. Effect of Light Intensity on Anthocyanin Content from A. commutatum Leaves
From the extraction of anthocyanins from A. commutatum leaves, it was found that the change trend of anthocyanins from the four different leaf colors of A. commutatum was different according to the light intensity treatment (Table 3). The anthocyanin content of ‘Emerald’ was the lowest among the four A. commutatum varieties, and the three A. commutatum treatment groups showed a tendency to increase and then decrease with time, and there was no significant difference between 15 d and 75 d under the three different light intensity treatments. But the anthocyanin content of the red-leaf A. commutatum variety showed different change trends with time according to the different light intensities: ‘Red Ruyi’ CK increases–decreases–increases, reaching the maximum value at 75 d, with an increase of 73.26% compared to 0 d. T1 decreased and then increased, and T2 increased and reached the maximum value at 75 d and 30 d, respectively, increasing by 15.05% and 50.19% compared to CK. ‘Angel’ CK presented a decreasing trend and then an increasing trend, reaching the lowest value at 30 d, decreasing by 69.00% compared to 0 d. T1 and T2 presented a decreasing trend with the passing of time, reaching the minimum value at 60 d and 75 d, respectively, decreasing by 21.09% and 71.12% compared to 0 d. The ‘Gilly Red’ CK presents an ascending and then descending trend, reaching the highest value at day 30 with an increase of 43.39% compared to day 0. T1 and T2 presented a descending–ascending–descending trend. T1 reached the maximum value at day 60 with an increase of 48.53% compared to CK in the same period; T2 reached the minimum value at day 75, with a decrease of 62.24% compared to CK in the same period.
Table 3.
Effect of light intensities on the anthocyanins of A. commutatum (pigment unit).
The anthocyanin content of the red-leaf A. commutatum variety was significantly different during the whole process, and the anthocyanin content of CK A. commutatum and T1 A. commutatum was higher than that of T2, suggesting that bright light accelerates the consumption of anthocyanins from A. commutatum leaves, inhibiting anthocyanin biosynthesis and accumulation. The variety with the most obvious increase in anthocyanins was ‘Red Ruyi’. The anthocyanin content of the ‘Red Ruyi’, ‘Angel’, and ‘Gilly Red’ groups all began to differ significantly at 30 d, suggesting that the effect of different light intensities on A. commutatum leaves takes some time.
3.3. Effect of Light Intensity on the Expression of PHYB, CRY, and UVR8 Photosensitive Genes from A. commutatum Leaf
The change trend of photosensitive gene expression from the leaves of the four different A. commutatum varieties under different light intensity treatments was different to some extent (Figure 3). The relative expressions of ‘Emerald’ CRY and UVR8 genes were significantly different with the increase in light intensity, and the relative expression of CRY genes in T1 and T2 was increased by 161.00% and 139.00% compared to that in CK, while UVR8 gene expression in T1 and T2 was increased by 87.60% and 147.00% compared to that in CK. The relative expressions of PHYB and CRY genes in ‘Red Ruyi’ increased and then decreased with the increase in light intensity. The relative expressions of PHYB and CRY genes increased 36.00% under the T1 treatment compared to CK, while CRY genes decreased 59.73 and 44.09% under the T1 and T2 treatments compared to CK. The relative expression of the ‘Angel’ PHYB gene showed a significant difference with the increase in light intensity, the relative expression of T2 increased 168.00% compared to CK, CRY and UVR8 genes increased and then decreased with the increase in light intensity, and the relative expression of T1 increased 97.00% and 177.00% compared to CK. Compared to CK, the relative expression of CRY in T2 decreased by 69.63%. The expression level of the ‘Gilly Red’ CRY gene increased and then decreased with the increase in light intensity, with a significant difference between treatments. The relative expression level of T1 increased by 337.00% and that of T2 increased by 232.00% compared to that of CK.
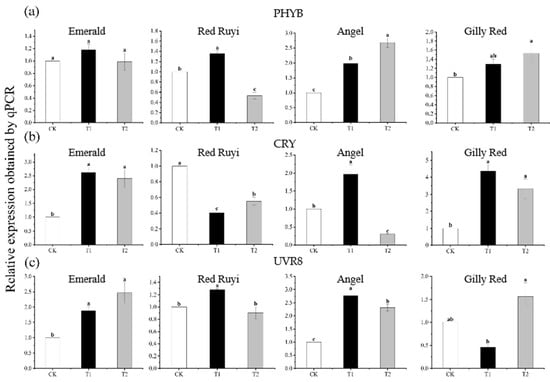
Figure 3.
Effect of different light intensities on the expression of photosensitive genes in 3 cultivars of A. commutatum. After 75 days of growth under different light conditions, the samples were subjected to RT-PCR experiments. (a) is the expression of PHYB, (b) is the expression of CRY, (c) is the expression of UVR8. Note: Different lowercase letters indicate significant difference between varieties and treatments (p < 0.05).
3.4. Effect of Light Intensity on Expression of PAL, DFR, and ANS of Leaf Anthocyanin Structural Genes from A. commutatum
The expression of anthocyanin structural genes from A. commutatum differs to different degrees with different light intensities (Figure 4), among which the relative expressions of ‘Emerald’ PAL, DFR, and ANS genes increased and then decreased with the increase in light intensity, and PAL expression was the highest in T1. The lowest relative expressions of DFR and ANS in T2 increased by 633.00% and decreased by 83.58% and 64.28% compared to CK, respectively. The relative expression level of the ‘Red Ruyi’ PAL gene increased and then decreased with the increase in light intensity, and there was a significant difference between treatments. The relative expression level of T1 was the highest, which increased by 187.00% compared to CK. The relative expression level of the ‘Angel’ PAL gene increased and then decreased with the increase in light intensity, and there was a significant difference between treatments. Compared to CK, the relative expression levels of T1 and T2 increased by 552.00% and 460.00%, respectively, and the relative expression levels of the DFR and ANS genes increased significantly with the increase in light intensity. Compared to CK, the relative expression level in T2 increased by 178.21% and 275.26%. The relative expression levels of the ‘Gilly Red’ PAL, DFR, and ANS genes were significantly different with the increase in light intensity, and the relative expression levels in T2 increased by 141.00%, 102.00%, and 88.76% compared to CK.
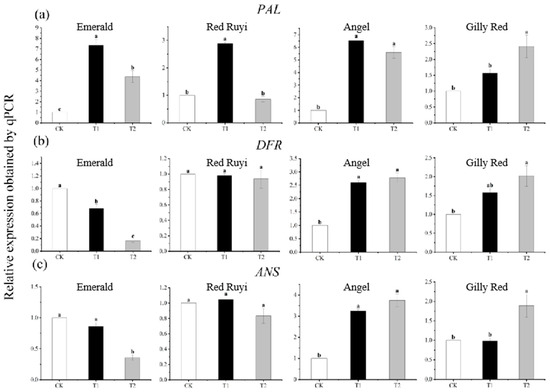
Figure 4.
Expression of three anthocyanin structural genes (PAL, DFR, ANS). (a) is the expression of PAL, (b) is the expression of DFR, (c) is the expression of ANS. Note: Different lowercase letters indicate significant difference between varieties and treatments (p < 0.05). After 75 days of growth under different light conditions, the samples were subjected to RT-PCR experiments.
3.5. Effect of Light Intensity on the Expression of MYB, bHLH, and WDR from Leaf Anthocyanin Regulatory Genes of A. commutatum
The expression of anthocyanin structural genes was also regulated by transcription factors, and there was a significant difference in the expression of A. commutatum regulatory genes after different light intensity treatments (Figure 5). The relative expression levels of the ‘Emerald’, ‘Red Ruyi’, and ‘Angel’ MYB genes increased and then decreased with the increase in light intensity, with significant differences among treatments, and the highest expression levels were found in T1, which increased by 165.32%, 94.16%, and 154.00% compared to CK, respectively. The relative expression of the bHLH gene decreased with the increase in light intensity in ‘Red Ruyi’, decreased by 46.13% compared to CK in ‘Gilly Red’, and increased by 27.14% compared to CK in ‘Gilly Red’. In ‘Angel’, the relative expression of the WDR gene increased with the increase in light intensity, and in T2, it increased by 121.54% compared to that in CK, while in ‘Red Ruyi’, the trend was opposite and the amplitude decreased, and in T2, it decreased by 37.41% compared to that in CK.
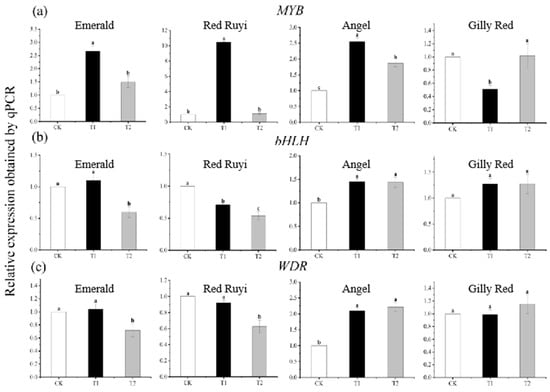
Figure 5.
Expression of three transcription factors (MYB, bHLH, WDR). (a) is the expression of MYB, (b) is the expression of bHLH, (c) is the expression of WDR. Note: Different lowercase letters indicate significant difference between varieties and treatments (p < 0.05). After 75 days of growth under different light conditions, the samples were subjected to RT-PCR experiments.
3.6. Correlation Between Anthocyanin Content from A. commutatum Leaves and Photoreceptor Genes, Anthocyanin Structural Genes, and Anthocyanin Regulatory Genes
There are different correlations between the anthocyanin content of the four kinds of A. commutatum leaves and the genes involved in anthocyanin synthesis (Figure 6). The relative expressions of the three photoreceptor genes of ‘Emerald’ increased with the increase in light intensity, inducing PAL and MYB gene synthesis, while decreasing the relative expressions of DFR, ANS, bHLH, and WDR genes. There was no significant correlation between ‘Emerald’ anthocyanin synthesis and photoreceptor genes, and between anthocyanin structural genes and regulatory genes. With the increase in light intensity, the relative expression levels of the ‘Red Ruyi’ PHYB, UVR8, ANS, PAL, DFR, and MYB genes increased, but decreased the relative expression levels of the bHLH, WDR, and CRY genes increased. Three anthocyanin structure genes, PAL, DFR and ANS, were strongly correlated with anthocyanin synthesis in ‘Red Ruyi’. With the increase in light intensity, the relative expression levels of ‘Angel’ PHYB, UVR8, ANS, PAL, MYB, bHLH, and WDR increased, while the relative expression levels of CRY decreased. The anthocyanin synthesis of ‘Angel’ was related to the expression of the photosensitive gene UVR8, structural gene PAL, and regulatory gene bHLH. With the increase in light intensity, the relative expression levels of three kinds of photosensitive genes, anthocyanin structural genes, and regulatory genes in ‘Gilly Red’ increased, and anthocyanin synthesis in ‘Gilly Red’ was related to the expression of the photic gene PHYB and the expression of three kinds of structural genes, PAL, DFR, and ANS.
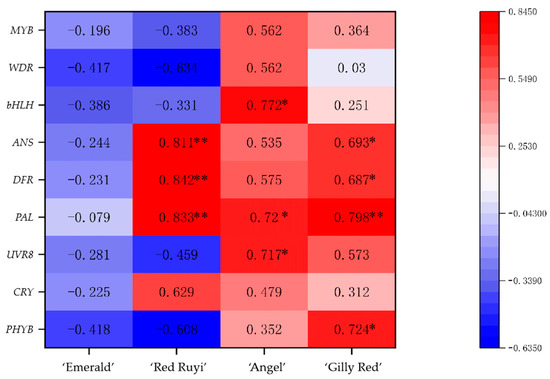
Figure 6.
Association of anthocyanin content with photoreceptor genes, anthocyanin structural genes, and anthocyanin regulatory genes in A. commutatum. Note: “*” shows significant correlation at the p < 0.05 probability level, “**” shows significant correlation at the p < 0.01 probability level.
4. Discussion
4.1. Effect of Light Intensity on Anthocyanin Content in Plants
Various studies have shown that anthocyanin accumulation is affected by environmental factors, especially light intensity [17]. In general, a higher light intensity is required to induce anthocyanin synthesis, and the anthocyanin content in plant leaves is related to the light level. The leaf color change in red-leaf plants can be quantitatively compared from the content of anthocyanins. Shading changes the light intensity of the local environment, thus affecting the content and proportion of chlorophyll, carotenoids, and anthocyanins, then affecting the color of the leaves of color-leaf plants. In grapes, anthocyanin accumulation was increased by strong light, but inhibited by shade [17]. In this study, the anthocyanin content of A. commutatum leaf increased and then decreased with the increase in light intensity. Of the four kinds of A. commutatum, the anthocyanin content of A. commutatum ‘Emerald’ leaves was the lowest, and there was no significant difference between the three different treatments of light intensity. From red-leaf A. commutatum ‘Red Ruyi’, ‘Angel’, and ‘Gilly Red’, the highest anthocyanin content was from T1 A. commutatum ‘Red Ruyi’, ‘Angel’, and ‘Gilly Red’, then from CK A. commutatum, and T2 was the lowest. That is, the biosynthesis and accumulation of anthocyanins from red-leaf A. commutatum varieties at low light was relatively large, whereas the bright light consumes anthocyanin storage. It is inferred that the positive regulation of anthocyanin content of commutatum leaves is in the range of from 588 to 678 μmol·m−2·s−1.
4.2. Effects of Photoreceptors on Plants
Light is an important source of energy for plants, but also, as an environmental signal throughout the whole life cycle of plants, it can affect the shape of plants and adaptability to the environment. Light signals can be divided into light intensity, light quality, photoperiod, and direction of light, perceived by different photoreceptors. At present, there are at least four kinds of photoreceptors in the plant kingdom according to their absorption spectra: red light/far-red light receptor phytochrome (PHY), blue light receptor CRYptochrome (CRY), phototropic protein (PHOT), and UV-B receptor UVR8 (UV Resistance locus 8) [18]. Phytochrome (PHY) mainly absorbs red light/far-red light (wavelength 600~750 nm). As a class of well-studied photoreceptors in higher plants, phytochromes can sense red/far-red light, and studies have also shown that they can promote anthocyanin accumulation [19]. In this study, the anthocyanin content from the leaves of A. commutatum ‘Angel’ and ‘Gilly Red’ was positively correlated with PHYB as the light intensity increased. Cryptochrome (CRY), or blue/UV-A receptor, is a receptor that senses light in the blue and near-ultraviolet (330–390 nm) regions; it can regulate the growth and development of plants [20]. Phototropin (PHOT) mainly absorbs blue light/UV-A (380–500 nm) [21]. UVR8 (UV Resistance Locus 8), as a specific photoreceptor of UV-B, mainly absorbs light in the UV-B region (wavelength ranging from 282 to 320 nm), and it can rapidly respond to the stimulation of UV-B light. And it regulates the growth and development of plants by regulating DNA repair, inhibiting growth, and regulating photosynthesis. In addition, UVR8 receptors can also regulate the photoprotective mechanism of plants, thereby protecting plants from excessive UV radiation damage [21]. Studies have shown that UVR8 receptors are found in lychees, apples, and in the ripening process of fruits in plants such as Solanum melongena [22]. ‘Emerald’ displayed an attenuated responsiveness to light intensity variations (UVR8 upregulation in Figure 3c failed to activate downstream anthocyanin biosynthesis pathways), whereas red-leaf cultivars exhibited stronger coupling between light signal transduction and anthocyanin synthesis. This discrepancy may stem from genetic background differences (e.g., regulatory element variations). The quantitative PCR relative expression levels of the PHYB, CRY, and UVR8 genes from A. commutatum of different varieties were analyzed under different light intensities, and the results show that the expression of A. commutatum was different. With the increase in light intensity, the relative expressions of the ‘Angel’ and ‘Gilly Red’ PHYB genes in T2 were increased by 168.00% and 52.00% compared to those of CK, respectively. The increase in light intensity decreased the expression of the ‘Red Ruyi’ CRY gene and induced the expression of the ‘Emerald’ and ‘Gilly Red’ CRY genes to increase by 161.00% and 337.00%, respectively, in T1 compared to CK. The increase in light intensity induced the expression of the ‘Angel’ UVR8 gene in T1 to increase by 177.00% compared to CK, and the expression of the ‘Emerald’ and ‘Gilly Red’ UVR8 gene in T2 increased by 147.00% and 56.60% compared to that of CK, respectively.
4.3. Expression of Genes Related to Anthocyanin Synthesis in Plants
Anthocyanin synthesis, transport, and accumulation are affected by various genes in the synthetic pathway. Ahn et al. found that the production of red leaves in the red variety of Zoysia japonica Steud. was caused by the increased expression of DFR and ANS, and was also specifically and synergistically regulated by a variety of transcription factors [23]. At present, the three most studied and important types of transcription factors in the anthocyanin synthesis pathway are the MYB transcription factor family, bHLH transcription factor family, and WDR transcription factor family [24]. Anthocyanin biosynthesis requires the coordinated regulation of multiple gene categories (structural genes, light signaling components, and transcription factors). While certain genes (e.g., PAL, MYB) exhibited elevated expression in ‘Emerald’ (Figure 4a and Figure 5a), the downstream critical structural genes (DFR and ANS) showed a significantly lower expression compared to those of the red-leaf cultivars (Figure 4b,c). This bottleneck likely disrupts anthocyanin biosynthesis, ultimately maintaining the green-leaf phenotype. In this experiment, analysis of the gene expression related to the anthocyanin synthesis pathway showed that light was affected by the expressions of PAL, DFR, and ANS and regulatory genes MYB, bHLH, and WDR involved in the four structural genes of A. commutatum leaf anthocyanin synthesis. Studies have shown that the apple MdMYB1 transcription factor is a light-induced R2R3-MYB transcription factor, and light induces the expression of MdMYB1, thereby inducing anthocyanin synthesis [25]. In addition, relevant studies have revealed the key regulatory role of a second transcription factor, bHLH, which was highly correlated with the transcription factor MYB. During the ripening process of Garcinia Mangstana L. fruit from green to purple, the transcription factor Gm MYB10 changed the most, and Gm MYB10 and AtbHLH2 were transferred into tobacco, which effectively activated the GmDFR and AtDFR promoters [26]. In Chrysanthemum morifolium ramat, Xiang et al. found that CmMYB6 and CmbHLH2 formed a binary complex through physical interaction, which regulated the expression of CmDFR during the biosynthesis of chrysanthemum anthocyanins [27]. Studies have confirmed that the MYB transcription factor alone or the combination of WD40 gene TTG1, bHLH, and MYB transcription complex can regulate the anthocyanin biosynthesis pathway [28,29]. In this study, the relative expression levels of the leaf anthocyanin structural genes and regulatory genes from A. commutatum at different light intensities were analyzed. Previous studies have also found that AcMYB1 and AcbHLH1 interact with A. commutatum to regulate the biosynthesis of anthocyanins [14]. It can be inferred that there is a certain relationship between the structural genes of A. commutatum leaves and the regulatory genes.
5. Conclusions
The anthocyanin content of A. commutatum leaves decreased significantly under high light. Light intensity affects anthocyanin synthesis by regulating structural genes from the A. commutatum leaf anthocyanin synthesis pathway and regulatory gene expression. Differential expressions of genes involved in anthocyanin biosynthesis were analyzed by qRT-PCR. The correlation analysis showed that light-sensitive genes, structural genes, and anthocyanin regulatory genes of the A. commutatum leaves of three red-leaf varieties are significantly affected by the anthocyanin content. This study provides reference for the scientific conservation and management of A. commutatum cultivation, and is also helpful to understand the effect of light environment on anthocyanin synthesis and accumulation in A. commutatum leaves.
Author Contributions
Conceptualization, X.Z., C.W. and J.H.; methodology, X.Z. and C.W.; software, X.Z. and C.W.; validation, C.W.; formal analysis, X.Z.; investigation, C.W.; resources, J.H.; data curation, X.Z.; writing—original draft preparation, X.Z. and J.H. and C.W.; writing—review and editing, X.Z. and J.H.; visualization, X.Z. and C.W.; supervision, J.H.; project administration, J.H.; funding acquisition, J.H.; All authors have read and agreed to the published version of the manuscript.
Funding
Guangzhou Science and Technology Plan Project (202002020028, L32020207), Guangdong Science and Technology Plan Project (Yue Ke Nong Zi [2024] No. 200, No. KTP20240709, B124202E6), 2024 Guangdong Graduate Innovation Education Innovation Plan Project (2024SFKC-053), and 2022 School level Graduate Education Reform Research Special Project (Zhongyan Zi [2022] No. 11).
Data Availability Statement
The raw data supporting the conclusions of this article will be made available by the authors upon request.
Conflicts of Interest
The authors declare no conflicts of interest.
References
- Li, J.; Wu, K.; Li, L.; Ma, G.; Fang, L.; Zeng, S. Transcriptomic Analysis Reveals Biosynthesis Genes and Transcription Factors Related to Leaf Anthocyanin Biosynthesis in Aglaonema commutatum. BMC Genom. 2023, 24, 28. [Google Scholar] [CrossRef]
- Tanaka, Y.; Sasaki, N.; Ohmiya, A. Biosynthesis of Plant Pigments: Anthocyanins, Betalains and Carotenoids. Plant J. 2008, 54, 733–749. [Google Scholar] [CrossRef]
- He, J.; Giusti, M.M. Anthocyanins: Natural Colorants with Health-Promoting Properties. Annu. Rev. Food Sci. Technol. 2010, 1, 163–187. [Google Scholar] [CrossRef] [PubMed]
- Li, P.; Li, Y.; Zhang, F.; Zhang, G.; Jiang, X.; Yu, H.; Hou, B. The Arabidopsis UDP-glycosyltransferases UGT79B2 and UGT79B3, Contribute to Cold, Salt and Drought Stress Tolerance via Modulating Anthocyanin Accumulation. Plant J. 2017, 89, 85–103. [Google Scholar] [CrossRef] [PubMed]
- Sivankalyani, V.; Feygenberg, O.; Diskin, S.; Wright, B.; Alkan, N. Increased Anthocyanin and Flavonoids in Mango Fruit Peel Are Associated with Cold and Pathogen Resistance. Postharvest Biol. Technol. 2016, 111, 132–139. [Google Scholar] [CrossRef]
- Martin, C.; Butelli, E.; Petroni, K.; Tonelli, C. How Can Research on Plants Contribute to Promoting Human Health? Plant Cell 2011, 23, 1685–1699. [Google Scholar] [CrossRef]
- Zhang, Y.; Chu, G.; Hu, Z.; Gao, Q.; Cui, B.; Tian, S.; Wang, B.; Chen, G. Genetically Engineered Anthocyanin Pathway for High Health-Promoting Pigment Production in Eggplant. Mol. Breed. 2016, 36, 54. [Google Scholar] [CrossRef]
- Zorenc, Z.; Veberic, R.; Koron, D.; Miosic, S.; Hutabarat, O.S.; Halbwirth, H.; Mikulic-Petkovsek, M. Polyphenol Metabolism in Differently Colored Cultivars of Red Currant (Ribes rubrum L.) through Fruit Ripening. Planta 2017, 246, 217–226. [Google Scholar] [CrossRef]
- Hichri, I.; Barrieu, F.; Bogs, J.; Kappel, C.; Delrot, S.; Lauvergeat, V. Recent Advances in the Transcriptional Regulation of the Flavonoid Biosynthetic Pathway. J. Exp. Bot. 2011, 62, 2465–2483. [Google Scholar] [CrossRef]
- Ma, Z.-H.; Li, W.-F.; Mao, J.; Li, W.; Zuo, C.-W.; Zhao, X.; Dawuda, M.M.; Shi, X.-Y.; Chen, B.-H. Synthesis of Light-Inducible and Light-Independent Anthocyanins Regulated by Specific Genes in Grape ‘Marselan’ (V. vinifera L.). PeerJ 2019, 7, e6521. [Google Scholar] [CrossRef]
- Azuma, A. Genetic and Environmental Impacts on the Biosynthesis of Anthocyanins in Grapes. Hortic. J. 2018, 87, 1–17. [Google Scholar] [CrossRef]
- Guo, X.; Shakeel, M.; Wang, D.; Qu, C.; Yang, S.; Ahmad, S.; Song, Z. Metabolome and Transcriptome Profiling Unveil the Mechanisms of Light-Induced Anthocyanin Synthesis in Rabbiteye Blueberry (Vaccinium ashei: Reade). BMC Plant Biol. 2022, 22, 223. [Google Scholar] [CrossRef]
- Shen, Y.; Mao, L.; Zhou, Y.; Sun, Y.; Liu, Z.; Liang, C. Integrated Transcriptome and Metabolome Analysis Revealed the Molecular Mechanism of Anthocyanin Synthesis in Purple Leaf Pepper (Capsicum annuum L.) under Different Light Intensities. Horticulturae 2023, 9, 814. [Google Scholar] [CrossRef]
- Li, J.; Wu, K.; Li, L.; Ma, G.; Fang, L.; Zeng, S. AcMYB1 Interacts with AcbHLH1 to Regulate Anthocyanin Biosynthesis in Aglaonema commutatum. Front. Plant Sci. 2022, 13, 886313. [Google Scholar] [CrossRef]
- Taylor, S.C.; Nadeau, K.; Abbasi, M.; Lachance, C.; Nguyen, M.; Fenrich, J. The Ultimate qPCR Experiment: Producing Publication Quality, Reproducible Data the First Time. Trends Biotechnol. 2019, 37, 761–774. [Google Scholar] [CrossRef]
- Livak, K.J.; Schmittgen, T.D. Analysis of Relative Gene Expression Data Using Real-Time Quantitative PCR and the 2−ΔΔCT Method. Methods 2001, 25, 402–408. [Google Scholar] [CrossRef]
- Blancquaert, E.H.; Oberholster, A.; Ricardo-da-Silva, J.M.; Deloire, A.J. Effects of Abiotic Factors on Phenolic Compounds in the Grape Berry—A Review. S. Afr. J. Enol. Vitic. 2018, 40, 1–14. [Google Scholar] [CrossRef]
- Gao, Q.; Hu, S.; Wang, X.; Han, F.; Luo, H.; Liu, Z.; Kang, C. The Red/Far-Red Light Photoreceptor FvePhyB Regulates Tissue Elongation and Anthocyanin Accumulation in Woodland Strawberry. Hortic. Res. 2023, 10, uhad232. [Google Scholar] [CrossRef]
- Smith, H. Phytochrome Transgenics: Functional, Ecological and Biotechnological Applications. Semin. Cell Biol. 1994, 5, 315–325. [Google Scholar] [CrossRef]
- Lin, C.; Shalitin, D. Cryptochrome Structure and Signal Transduction. Annu. Rev. Plant Biol. 2003, 54, 469–496. [Google Scholar] [CrossRef]
- Gyula, P.; Schäfer, E.; Nagy, F. Light Perception and Signalling in Higher Plants. Curr. Opin. Plant Biol. 2003, 6, 446–452. [Google Scholar] [CrossRef] [PubMed]
- Tossi, V.E.; Regalado, J.J.; Iannicelli, J.; Laino, L.E.; Burrieza, H.P.; Escandón, A.S.; Pitta-Álvarez, S.I. Beyond Arabidopsis: Differential UV-B Response Mediated by UVR8 in Diverse Species. Front. Plant Sci. 2019, 10, 780. [Google Scholar] [CrossRef]
- Ahn, J.H.; Kim, J.-S.; Kim, S.; Soh, H.Y.; Shin, H.; Jang, H.; Ryu, J.H.; Kim, A.; Yun, K.-Y.; Kim, S.; et al. De Novo Transcriptome Analysis to Identify Anthocyanin Biosynthesis Genes Responsible for Tissue-Specific Pigmentation in Zoysiagrass (Zoysia japonica Steud.). PLoS ONE 2015, 10, e0124497. [Google Scholar] [CrossRef]
- Shi, Q.; Li, X.; Du, J.; Li, X. Anthocyanin Synthesis and the Expression Patterns of bHLH Transcription Factor Family during Development of the Chinese Jujube Fruit (Ziziphus jujuba Mill.). Forests 2019, 10, 346. [Google Scholar] [CrossRef]
- Takos, A.M.; Jaffé, F.W.; Jacob, S.R.; Bogs, J.; Robinson, S.P.; Walker, A.R. Light-Induced Expression of a MYB Gene Regulates Anthocyanin Biosynthesis in Red Apples. Plant Physiol. 2006, 142, 1216–1232. [Google Scholar] [CrossRef]
- Palapol, Y.; Ketsa, S.; Lin-Wang, K.; Ferguson, I.B.; Allan, A.C. A MYB Transcription Factor Regulates Anthocyanin Biosynthesis in Mangosteen (Garcinia mangostana L.) Fruit during Ripening. Planta 2009, 229, 1323–1334. [Google Scholar] [CrossRef]
- Xiang, L.; Liu, X.; Li, X.; Yin, X.; Grierson, D.; Li, F.; Chen, K. A Novel bHLH Transcription Factor Involved in Regulating Anthocyanin Biosynthesis in Chrysanthemums (Chrysanthemum morifolium Ramat.). PLoS ONE 2015, 10, e0143892. [Google Scholar] [CrossRef]
- Qiu, Z.; Wang, X.; Gao, J.; Guo, Y.; Huang, Z.; Du, Y. The Tomato Hoffman’s Anthocyaninless Gene Encodes a bHLH Transcription Factor Involved in Anthocyanin Biosynthesis That Is Developmentally Regulated and Induced by Low Temperatures. PLoS ONE 2016, 11, e0151067. [Google Scholar] [CrossRef]
- Gonzalez, A.; Zhao, M.; Leavitt, J.M.; Lloyd, A.M. Regulation of the Anthocyanin Biosynthetic Pathway by the TTG1/bHLH/Myb Transcriptional Complex in Arabidopsis Seedlings. Plant J. 2008, 53, 814–827. [Google Scholar] [CrossRef]
Disclaimer/Publisher’s Note: The statements, opinions and data contained in all publications are solely those of the individual author(s) and contributor(s) and not of MDPI and/or the editor(s). MDPI and/or the editor(s) disclaim responsibility for any injury to people or property resulting from any ideas, methods, instructions or products referred to in the content. |
© 2025 by the authors. Licensee MDPI, Basel, Switzerland. This article is an open access article distributed under the terms and conditions of the Creative Commons Attribution (CC BY) license (https://creativecommons.org/licenses/by/4.0/).