Article

Characterization of Metabolites and Transcriptome of Pepper Accessions from Four Southern Provinces of China

1
State Key Laboratory of Vegetable Biobreeding, Institute of Vegetables and Flowers, Chinese Academy of Agricultural Sciences, Beijing 100081, China
2
College of Plant Science and Technology, Beijing University of Agriculture, Beijing 100096, China
3
Guizhou Pepper Research Institute, Guiyang 550006, China
*
Author to whom correspondence should be addressed.
Genes 2025, 16(2), 137; https://doi.org/10.3390/genes16020137
Submission received: 22 December 2024 / Revised: 20 January 2025 / Accepted: 22 January 2025 / Published: 24 January 2025
(This article belongs to the Section Plant Genetics and Genomics)

Abstract

:
Background/Objectives: Pepper (Capsicum annuum L.) is a widely grown vegetable and spice crop worldwide. This study aims to reveal the differences of metabolites among pepper accessions from different regions and explore candidate genes related to metabolites of pepper. Methods: The metabolome and transcriptome of 36 pepper accessions were determined by widely targeted metabolomics analysis and RNA sequencing technology, and the differential metabolites and differential genes among C. annuum from four important pepper production and consumption provinces of China, Hunan, Guizhou, Yunnan and Sichuan, were analyzed. Results: Flavonoids are the main characteristic metabolites that distinguish pepper accessions from Yun_Gui_Chuan Group and Hunan Group. The aglycones of characteristic flavonoids in each group are different; in Yun_Gui_Chuan Group mainly are luteolin, quercetin, chrysoeriol and isorhamnetin; in Hunan Group mainly are apigenin. Transcriptome data showed that two genes related to flavonoid 3′-monooxygenase differed significantly between the two groups of chili peppers, and we speculated that they may be the core enzymes regulating their flavonoid profile. And an SNP mutation located in gene Cgla06g001871 showed a strong correlation with pepper accessions from Yun_Gui_Chuan Group, which can be used as a DNA marker to identify pepper accessions from Yun_Gui_Chuan Group, and provide strong support for regional specialty variety conservation. In addition, we also analyzed the metabolites related to the taste and nutrition of pepper accessions in the four provinces, and the results showed that the sugar content of pepper accessions from Guizhou was low and the capsaicinoids content of pepper accessions from Sichuan was low, while no significant difference was found in acid and vitamin contents among pepper accessions from the four provinces. Conclusions: The metabolome and transcriptome of 36 pepper accessions from four important pepper production and consumption provinces of China were determined, and the characteristic metabolites and expressed genes of pepper accessions from each province were analyzed.

1. Introduction

Pepper (Capsicum spp.), which primarily originated in the Central and South American regions [1,2], belongs to the genus Capsicum within the Solanaceae Juss. family. It is cultivated and consumed globally as both a fresh vegetable and flavoring spice. Pepper is not only an important vegetable but also a major spice crop globally, possessing crucial economic and social value along with its culinary value that has been recognized for centuries [3]. According to the report of the Food and Agriculture Organization of the United Nations (FAO) (https://www.fao.org), the global area granted to chili pepper cultivation in 2022 is 3,666,300 hectares, yielding a total production of 41,881,800 metric tons and an overall output value of 46,281 million U.S. dollars, highlighting its considerable economic and social importance. In the 21st century, the global planting area and production of peppers have increased consistently, and China’s pepper industry has also entered a phase of rapid growth.
Pepper is intensely cherished by people due to its nutritious quality and spicy flavor, and the number of individuals who appreciate eating pepper continues to grow, resulting in a steady increase in the scale of pepper cultivation. It has been cultivated for more than 6000 years. It is traditionally believed that Columbus brought chili peppers from South America to Europe in 1493 and then to Asia, Africa and Oceania [4,5]. Pepper was widely distributed around the world during the sixteenth and seventeenth centuries [6], and it was introduced to China during Ming Period [7], where it was rapidly distributed throughout the nation.
As a popular vegetable and seasoning crop, pepper is numerous sources of nutrients including vitamins and flavonoids [8] with a wide range of taste flavors ranging from sweet to spicy [9], also displaying vigorous colors including green, yellow, red, white and purple [10]. Flavonoids are important secondary metabolites found in pepper fruits, generally with C6-C3-C6 as the basic carbon framework, capable of combining with sugars in the organism to form glycosides or carbonyl glycosides, and only a few exist in the free form. They can be divided into the following categories: anthocyanins, flavonoids, flavanones, flavanols, isoflavones, chalcones, dihydrochalcones and flavonoid glycosides [11], and they possess anticancer, anti-inflammatory, antioxidant and immune-enhancing properties [12,13,14,15]. This has led to an increasing focus on research concerning the quality and breeding of chili peppers [16]. Sugar and organic acids play crucial roles as metabolites in pepper fruits, and they are linked to factors like material composition and the stage of fruit ripening [17]. In comparison to tomatoes and eggplants, the pepper has the highest average level of total sugars and organic acids, with the primary sugars identified as fructose and glucose and citric acid being the predominant organic acids [18]. Capsaicinoids are secondary metabolites particularly found in pepper fruits, responsible for their distinctive spiciness and possessing numerous established health benefits and industrial uses [19]. L-ascorbic acid (vitamin C), serving various functions including nutrition, medical treatment and health care, is crucial for sustaining normal physiological functions and health in human, contributing to improving immune function, anti-oxidation, anti-aging and cancer prevention [20,21].
Regarding the differences of plant metabolites in different regions, there were some studies on crops such as quinoa [22] and rice [23]. But fewer studies on peppers and the differences in metabolites of different phenotypes [24] and varieties [25] were mainly studied in peppers. Plant domestication is a complex and lengthy process that involves human selection, cultivation and improvement of wild plants to meet specific needs [26]. In this process, environmental factors play a crucial role. Different geographical environments and climatic conditions have profound effects on the growth, reproduction and adaptability of plants [27,28,29,30]. Environmental factors such as temperature, light, moisture, soil type and biodiversity have an impact on plant growth and development [31,32,33,34]. These environmental factors play a role in screening and shaping the process of plant domestication. For example, in arid regions, plants may adapt to their environment by evolving deeper root systems or more drought-tolerant physiological mechanisms [35].
Hunan [36], Yunnan [37], Guizhou [38] and Sichuan [39] are leading provinces in China regarding production and consumption of peppers. Previous researchers have analyzed the development of different tissues [40], the differences in carotenoid [41] and capsianoside metabolites [42] through metabolome analysis and transcriptome analysis in peppers. Metabolome and transcriptome analyses were conducted on pepper varieties from these four provinces to investigate the unique metabolites and expressed genes of pepper accessions originating from various regions, providing a foundation for the identification of different pepper accessions.

2. Materials and Methods

2.1. Materials

Thirty-six pepper accessions (Table S1) including 10 accessions from Hunan, 8 accessions from Guizhou, 6 accessions from Sichuan and 12 accessions from Yunnan provinces were planted in a greenhouse, located in Beijing at 40°10′ N latitude and 116°52′ E longitude in the spring of 2021, and the plants were cultivated and managed uniformly. Fruit samples were collected at the break stage and mature stage, respectively. At each stage, 3–10 fruits were collected each accession, depending on the fruit size. The stalks and seeds were removed and stored in a −80 °C refrigerator after being rapidly frozen in liquid nitrogen for at least 30 s until determination.

2.2. Widely Targeted Metabolomics Analysis

Two replicates were made for each accession. Fruit samples of peppers at the mature stage were taken out from an ultra-low temperature (−80 °C) refrigerator, freeze-dried, ground into powder, accurately weighed to 0.1 g of powder, added to 1 mL of 70% aqueous methanol (containing 1 ug/mL 2-chlorophenylalanine as the internal standard), vortexed for 1 min and extracted at 4 °C for 303 min, with vortexing three times during the extraction process. After that, it was centrifuged at 12,000 r/min at 4 °C for 10 min. The supernatant was transferred to an injection vial for liquid chromatography–mass spectrometry/mass spectrometry (LC–MS/MS) analysis. The main instruments used for the tests were as follows: an ultra-high performance liquid chromatograph model Shim pack UFLC SHIMADZU CBM30A from Shimadzu, a tandem mass spectrometer (MS/MS) and a QTRAP ® 4500+ (https://sciex.com/). The analytical conditions of liquid chromatography were as follows: (1) chromatographic column (Waters ACQUITY UPLC HSS T3 C18 1.8 µm, 92.1 mm × 100 mm); (2) ultra-pure water (containing 0.1% formic acid) for phase A and acetonitrile (containing 0.1% formic acid) for phase B; (3) elution gradient: the eluent was a mixture of water and acetonitrile, and the volume ratio of water and acetonitrile was 95:5 at 0 min, 5:95 at 10 min and 5:95 at 11 min and 11.1 min. The volume ratio of water and acetonitrile was 95:5 at 0 min, water and acetonitrile at 10 min, water and acetonitrile at 11 min, water and acetonitrile at 11.1 min and water and acetonitrile at 15.0 min. (4) The flow rate was set at 0.4 mL per minute, and the column temperature was set at 40 degrees Celsius, and the injection volume of each sample was 2 microliters. The key parameters for the mass spectrometry analysis were set as follows: the temperature of the electrospray ionization source was maintained at 550 degrees Celsius; the positive and negative mass spectrometry voltages were set to 5500 volts and 4500 volts, respectively; and the pressure of the ionization source gas I was controlled to be 55 psi, that of the ionization source gas II was set to be 60 psi, and the pressure of the curtain gas was set to be 25 psi. Also, the collision activated ionization parameter was set to a high level. In a triple quadrupole (Qtrap) instrument, each ion pair was carefully scanned and detected by precisely modulating the collision energy and optimizing the clustering potential [43]. The metabolites were accurately analyzed qualitatively based on the retention time of the detected substances, the information of the parent ion pairs and the secondary spectral data compared with the self-constructed target standard database. Quantitative analysis of metabolites was performed by integrating the ion chromatography peaks under the peak area and correcting the integrals to eliminate possible bias between samples [44].
In MetaboAnalyst 6.0 (https://www.metaboanalyst.ca), the metabolomic data were subjected to sum normalization, logarithmic transformation (with base 10) and auto scaling to make the metabolomics data approximately conform to a normal distribution, and the obtained data were statistically analyzed [45]. Differences in metabolites of pepper accessions from the four provinces were investigated using unsupervised principal component analysis (PCA). The Fold Change (FC) and false discovery rate (FDR) of metabolites were obtained from volcano plot analysis, and the variable importance in the projection (VIP) values obtained by supervised orthogonal partial least squares discriminant analysis (oPLS-DA) were used to mine differential metabolites. Supervised partial least squares discriminant analysis (PLS-DA) was used to describe the differences in the metabolic profiles of the three source provinces in Yunnan, Guizhou and Sichuan. The screening criteria [46] for metabolites with differential expression were as follows: (1) FC > 1.5 or FC < 0.75; (2) FDR p < 0.05; and (3) VIP > 1.5.

2.3. RNA-Seq and Resequencing

Pepper fruit samples at the break stage were used for high-throughput transcriptome sequencing at Beijing Genomics Institute (BGI, Shenzhen, China), and the sequencing and analysis process was performed according to the standard protocols of BGI RNA-seq [47,48,49]. The transcriptome sequencing data ranged from 7.1 Gb to 36.8 Gb with a mean value of 17.3 Gb. Clean reads were estimated for the relative expression of transcripts per kilobase of exon model per million mapped reads (TPM). The mRNA-seq data were mapped to the PM1533 Anu7 genome (not published) using Hisat2 software (version 2.1.0) and Samtools software (version 1.9) using default parameters, and the identified genes were annotated through the Arabidopsis Genome Resource Database (https://www.arabidopsis.org). The selection criteria for differential genes are the same as for differential metabolites: (1) FC > 1.5 or FC < 0.75; (2) FDR p< 0.05; and (3) VIP > 1.5.
The genome resequencing data are the data from our previous published article [50]. Thirty-six accessions resequencing data studied in this research were used for drawing an NJ tree by phylip software and then beautified in ITOL (https://itol.embl.de/).

2.4. Stastatistical Analysis

The statistical analyses were performed by the SPSS 26.0 statistical package (IBM, Armonk, NY, USA). Continuous variables that followed a normal distribution are presented as the mean ± standard deviation, while those that did not follow a normal distribution are presented as the median and inter-quartile range; categorical variables are represented as number (%). For comparing multiple groups, p values were calculated using one-way ANOVA for continuous variables or the chi-square test for categorical variables. A p value of less than 0.05 was statistically significant for all comparisons. The R ggplot2 package in R 4.4.1 was used to create the boxplot [51].

3. Results

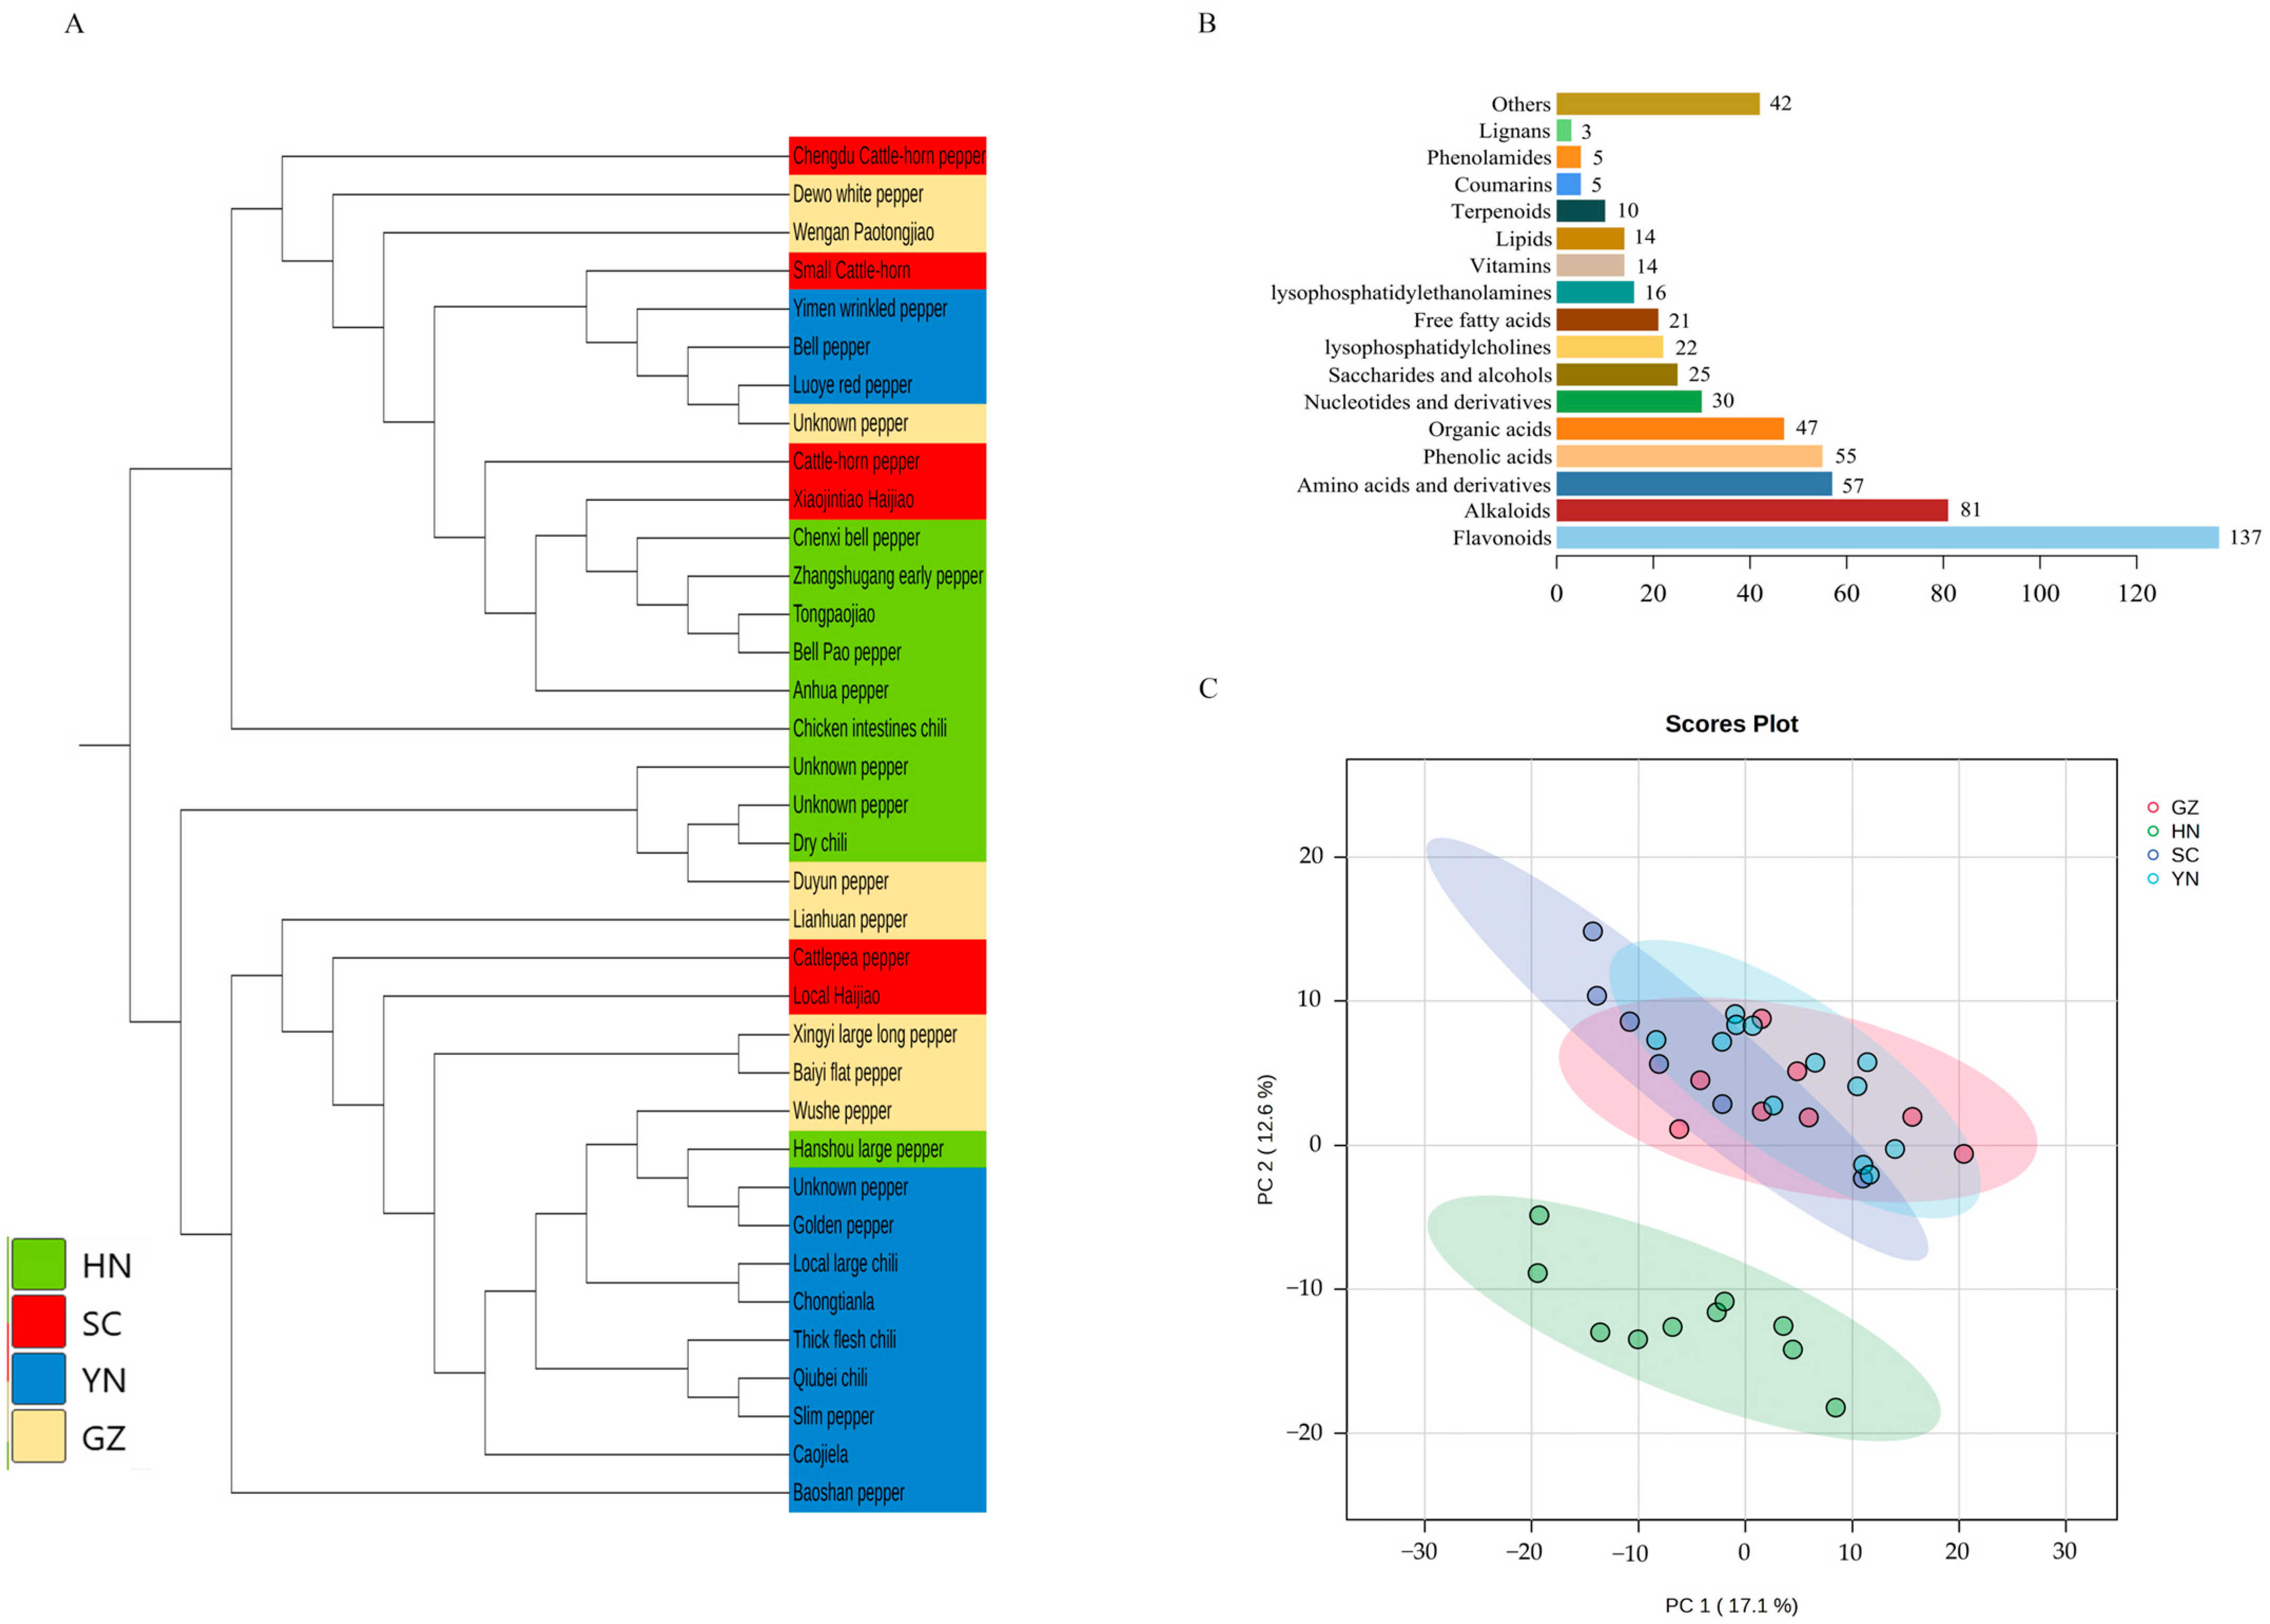
3.1. Genome, Transcriptome and Metabolome Analyses

The resequencing data were obtained from our previous study [50], and the neighbor joining tree was constructed with 36 accessions (Figure 1A). Although the domestication of C. annuum was chaotic, the results showed that pepper accessions from different provinces were roughly clustered together, especially the accessions from Hunan and Yunnan.
The transcriptome data were aligned with the reference genome PM1533 Anu7 at rates ranging from 57.52% to 72.92%, with an average alignment rate of 67.96%, and a total of 36,010 expressed genes were identified in 36 accessions.
A total of 622 metabolites were detected, and 584 metabolites (Table S2) were obtained by excluding metabolites with coefficients of variation (CV) greater than 30% in the quality control (QC) samples by referring to the method of Tang [52]. The classification of 584 metabolites was visualized, which contained 137 flavonoids, 81 alkaloids, 57 amino acids and derivatives, 55 phenolic acids, 47 organic acids, 30 nucleotides and derivatives, 25 saccharides and alcohols, 22 Lys phosphatidylcholines, 21 free fatty acids, 16 Lys phosphatidylethanolamines, 14 vitamins, 14 lipids, 10 terpenoids, five coumarins, five phenol amides, three lignans and 42 other metabolites (Figure 1B, Table S2).

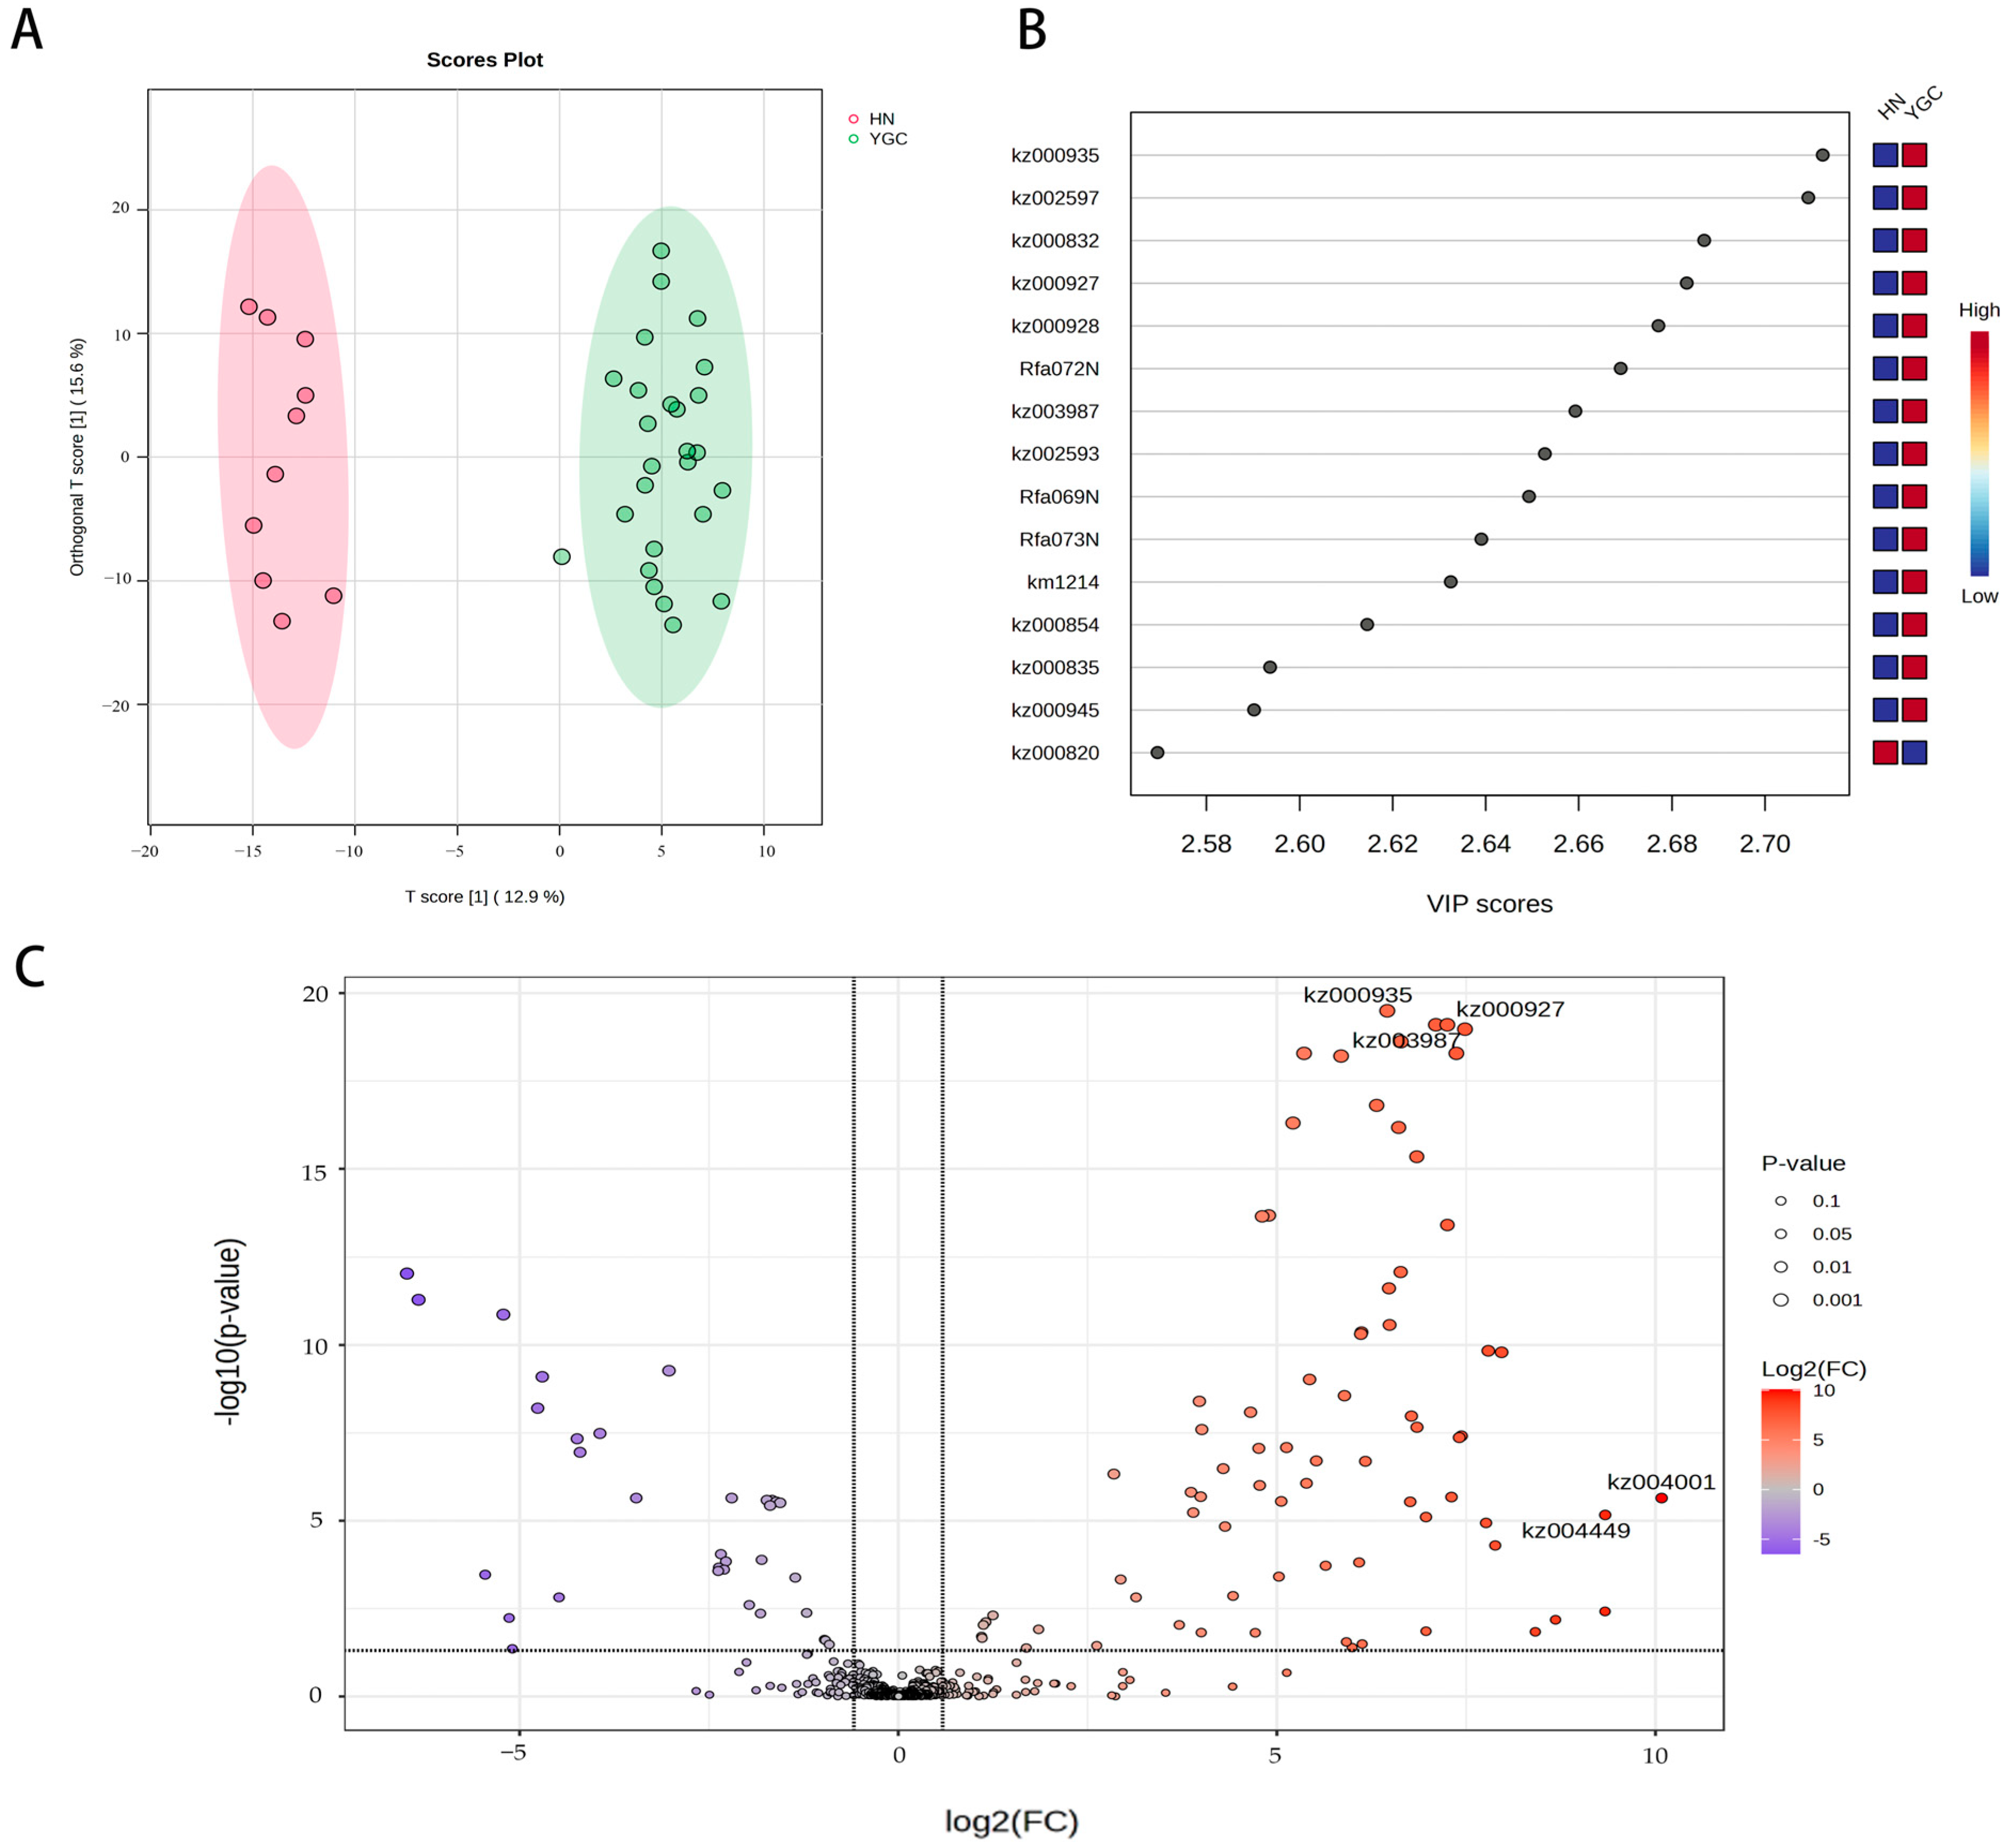
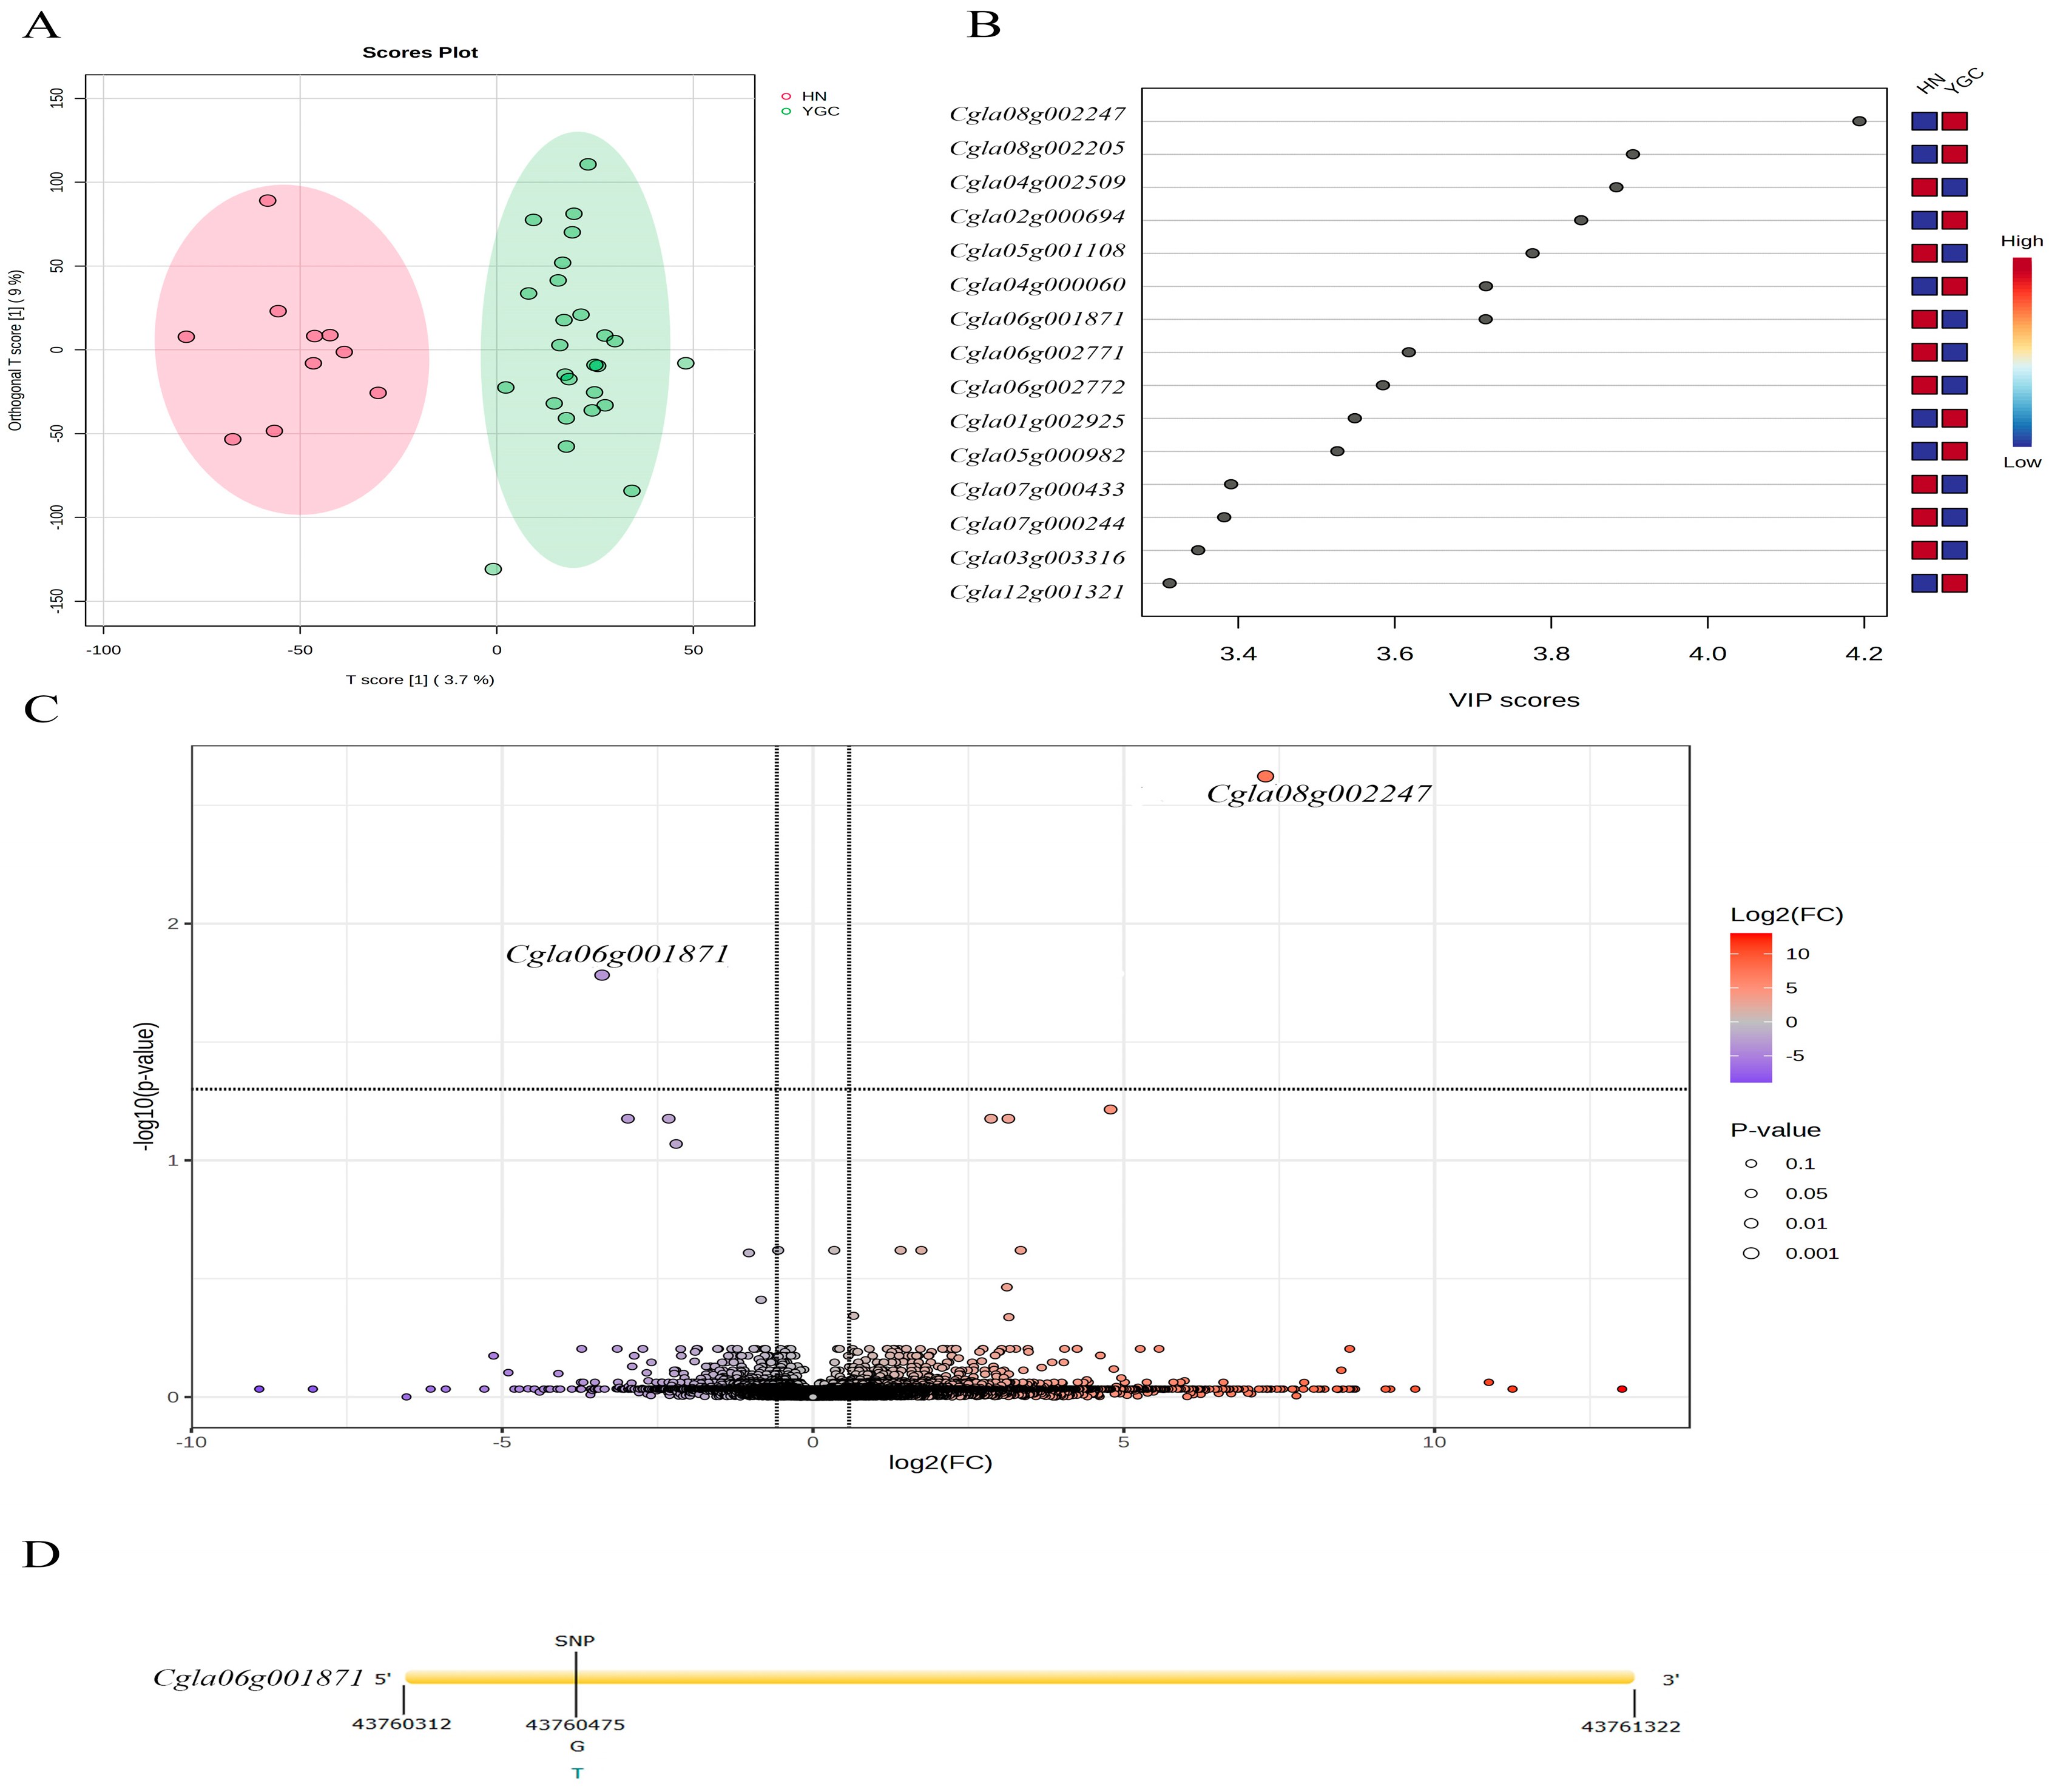
3.2. Characteristic Differential Metabolites and Expressed Genes of Pepper Accessions from Hunan Group and Yun_Gui_Chuan Group

According to PCA, oPLS-DA and FC of metabolites content analyses, flavonoids were the main metabolites that distinguish pepper accessions from Hunan province and Yunnan, Guizhou and Sichuan provinces.
The PCA analysis based on the standardized data of metabolites showed that under the condition of no grouping supervision, 36 accessions were clearly divided into two clusters on PC2 (Figure 1C), the cluster whose accessions are from Hunan province was named Hunan Group, and the other cluster whose accessions are from Yunnan, Guizhou and Sichuan provinces was named Yun_Gui_Chuan Group. The main contributing annotated metabolites were kaempferol-C-glucoside-C-glucoside, C-hexosyl-luteolin C-pentoside, luteolin-6,8-di-C-glucoside, Chrysoeriol 6-C-glucoside (isoscoparin), chrysoeriol 8-C-hexoside, luteolin-6-C-glucoside (isoorientin), luteolin 6-C-hexoside-8-C-pentoside, luteolin-6-C-2-glucuronylglucoside, 6-C-hexosyl chrysoeriol O-hexoside, apigenin O-hexosyl-O-pentoside and luteolin-O-Malonyl-O-hexoside-O-pentoside in PC 2. Orthogonal partial least squares discriminant analysis (oPLS-DA) of metabolites of Hunan Group and Yun_Gui_Chuan Group showed that the two groups were separated on component 1 (Figure 2A), and R2 and Q2 were greater than 0.85 due to cross validation. There were 89 metabolites with the VIP value greater than 1.5 in component 1, and the top 15 metabolites with the highest VIP values are shown in Figure 2B and Table S3, of which 14 flavonoids were higher in pepper accessions from Yun_Gui_Chuan Group and one metabolite, apigenin O-hexosyl-O-pentoside, was higher in pepper accessions from Hunan Group.
According to FC > 1.5 or FC < 0.75, FDR adjusted p < 0.05, 75 metabolites contents were higher in pepper accessions from Yun_Gui_Chuan Group and 33 metabolites contents were higher in pepper accessions from Hunan Group (Figure 2C; Table S4). The 75 differential metabolites with higher content in Yun_Gui_Chuan Group were mainly flavonoids, including two anthocyanins, 17 flavanones, 35 flavonols, 12 flavonoid carbonosides, one flavanol and one isoflavone, and also one alkaloid, one amino acid derivative, two Lys phosphatidylcholine (LPC) and two Lys phosphatidylethanolamine (LPE). The 33 metabolites, which were more in pepper accessions from Hunan Group, were also mainly flavonoids, including eight flavanones, 10 flavonols, nine flavonoid carbocosides and two isoflavones, and also four phenolic acids.
Kaempferol-C-glucoside-C-glucoside, C-hexosyl-luteolin C-pentoside, luteolin-6,8-di-C-glucoside, isoscoparin, chrysoeriol 8-C-hexoside, luteolin-6-C-glucoside (isoorientin), luteolin 6-C-hexoside-8-C-pentoside, luteolin-6-C-2-glucuronyl glucoside, luteolin-O-Malonyl-O-hexoside-O-pentoside and apigenin O-hexosyl-O-pentoside were the common differential metabolites according to the analyses of PCA, oPLS-DA and FC, and they are all flavonoids (Table 1). The content of apigenin O-hexosyl-O-pentoside, which is among the common differential metabolites, is higher in accessions from Hunan Group, so apigenin O-hexosyl-O-pentoside is considered the characteristic metabolite in pepper accessions from Hunan Group. And the content of the rest 14 of the common differential metabolites are higher in pepper accessions from Yun_Gui_Chuan Group, so these 14 flavonoids are considered the characteristic metabolites in Yun_Gui_Chuan Group.
Although the differential metabolites between accessions from Hunan Group and Yun_Gui_Chuan Group are mostly flavonoids, the aglycone of the differential flavonoids are different. The flavonoids with more content in pepper accessions from Yun_Gui_Chuan Group are mainly luteolin, quercetin, chrysoeriol and isorhamnetin; while flavonoid with more contents in pepper accessions from Hunan Group is apigenin. In the flavonoid biosynthesis processes, the luteolin and chrysoeriol, which were more abundant in Yun_Gui_Chuan Group, are located in the downstream of apigenin, which is more abundant in Hunan Group.
Orthogonal partial least squares discriminant analysis (oPLS-DA) of the transcriptomic data of pepper accessions from Hunan Group and Yun_Gui_Chuan Group showed that in the horizontal axis, Hunan Group pepper accessions were distinguished from Yun_Gui_Chuan Group pepper accessions (Figure 3A). The fifteen differential expressed genes with the highest VIP values were shown in Figure 3B and Table 2, and the expression of Cgla08g002247, Cgla08g002205, Cgla02g000694, Cgla04g000060, Cgla01g002925, Cgla05g000982 and Cgla12g001321 was higher in the pepper accessions from Yun_Gui_Chuan Group, and the expression of Cgla04g002509, Cgla05g001108, Cgla06g001871, Cgla06g002771, Cgla06g002772, Cgla07g000433, Cgla07g000244 and Cgla03g003316 was higher in the pepper accessions from Hunan Group. According to criteria of FC > 1.5 or FC < 0.75, and FDR adjusted p <0.05, a significant downregulated gene Cgla06g001871 and an upregulated gene Cgla08g002247 were obtained (Figure 3C), which were also with the higher VIP value in the OPLS-DA analysis. We annotated the function of pepper genes by homologous alignment with Arabidopsis thaliana genes (Table 2). Cgla06g001871 encodes the Phorbol-ester/DAG-type domain-containing protein, which is related to signal transduction. An SNP was identified at the position 43760475 bp on chromosome 6 in the gene Cgla06g001871, and the base change from G to T, resulting in the amino acid changes from arginine to leucine. In the 36 accessions, 24 accessions had this mutation within gene Cgla06g001871, and among the 24 accessions, only one is from Hunan province, and the rest are from Yunnan, Guizhou and Sichuan provinces. So, the SNP at the position 43760475 bp on chromosome 6 can serve as a marker to distinguish pepper accessions from Hunan and Yunnan Guizhou Sichuan regions, and even expand to pepper accession from other areas.
Due to flavonoids being important metabolites that distinguish peppers from different regions, we also focused on the genes related to flavonoid biosynthesis in peppers. Flavonoid 3′-monooxygenase is the core enzyme regulating the aglycone of flavonoid. The gene encoding flavonoid 3′-monooxygenase corresponds to the gene AT5G07990 in Arabidopsis, and the corresponding homologous genes in peppers are Cgla01g001199 and Cgla04g001393 with VIP values greater than 1.5 in the oPLS-DA results, indicating that Cgla01g001199 and Cgla04g001393 may regulate flavonoid biosynthesis in peppers, maybe particular related to flavonoids with significant differences in content between the peppers from Hunan and Yun_Gui_Chuan Groups, such as luteolin-6,8-di-C-glucoside, Chrysoeriol 6-C-glucoside (isoscoparin), luteolin-6-C-glucoside (isoorientin), luteolin 6-C-hexoside-8-C-pentoside, luteolin-6-C-2-glucuronylglucoside, luteolin-O-Malonyl-O-hexoside-O-pentoside and apigenin O-hexosyl-O-pentoside.

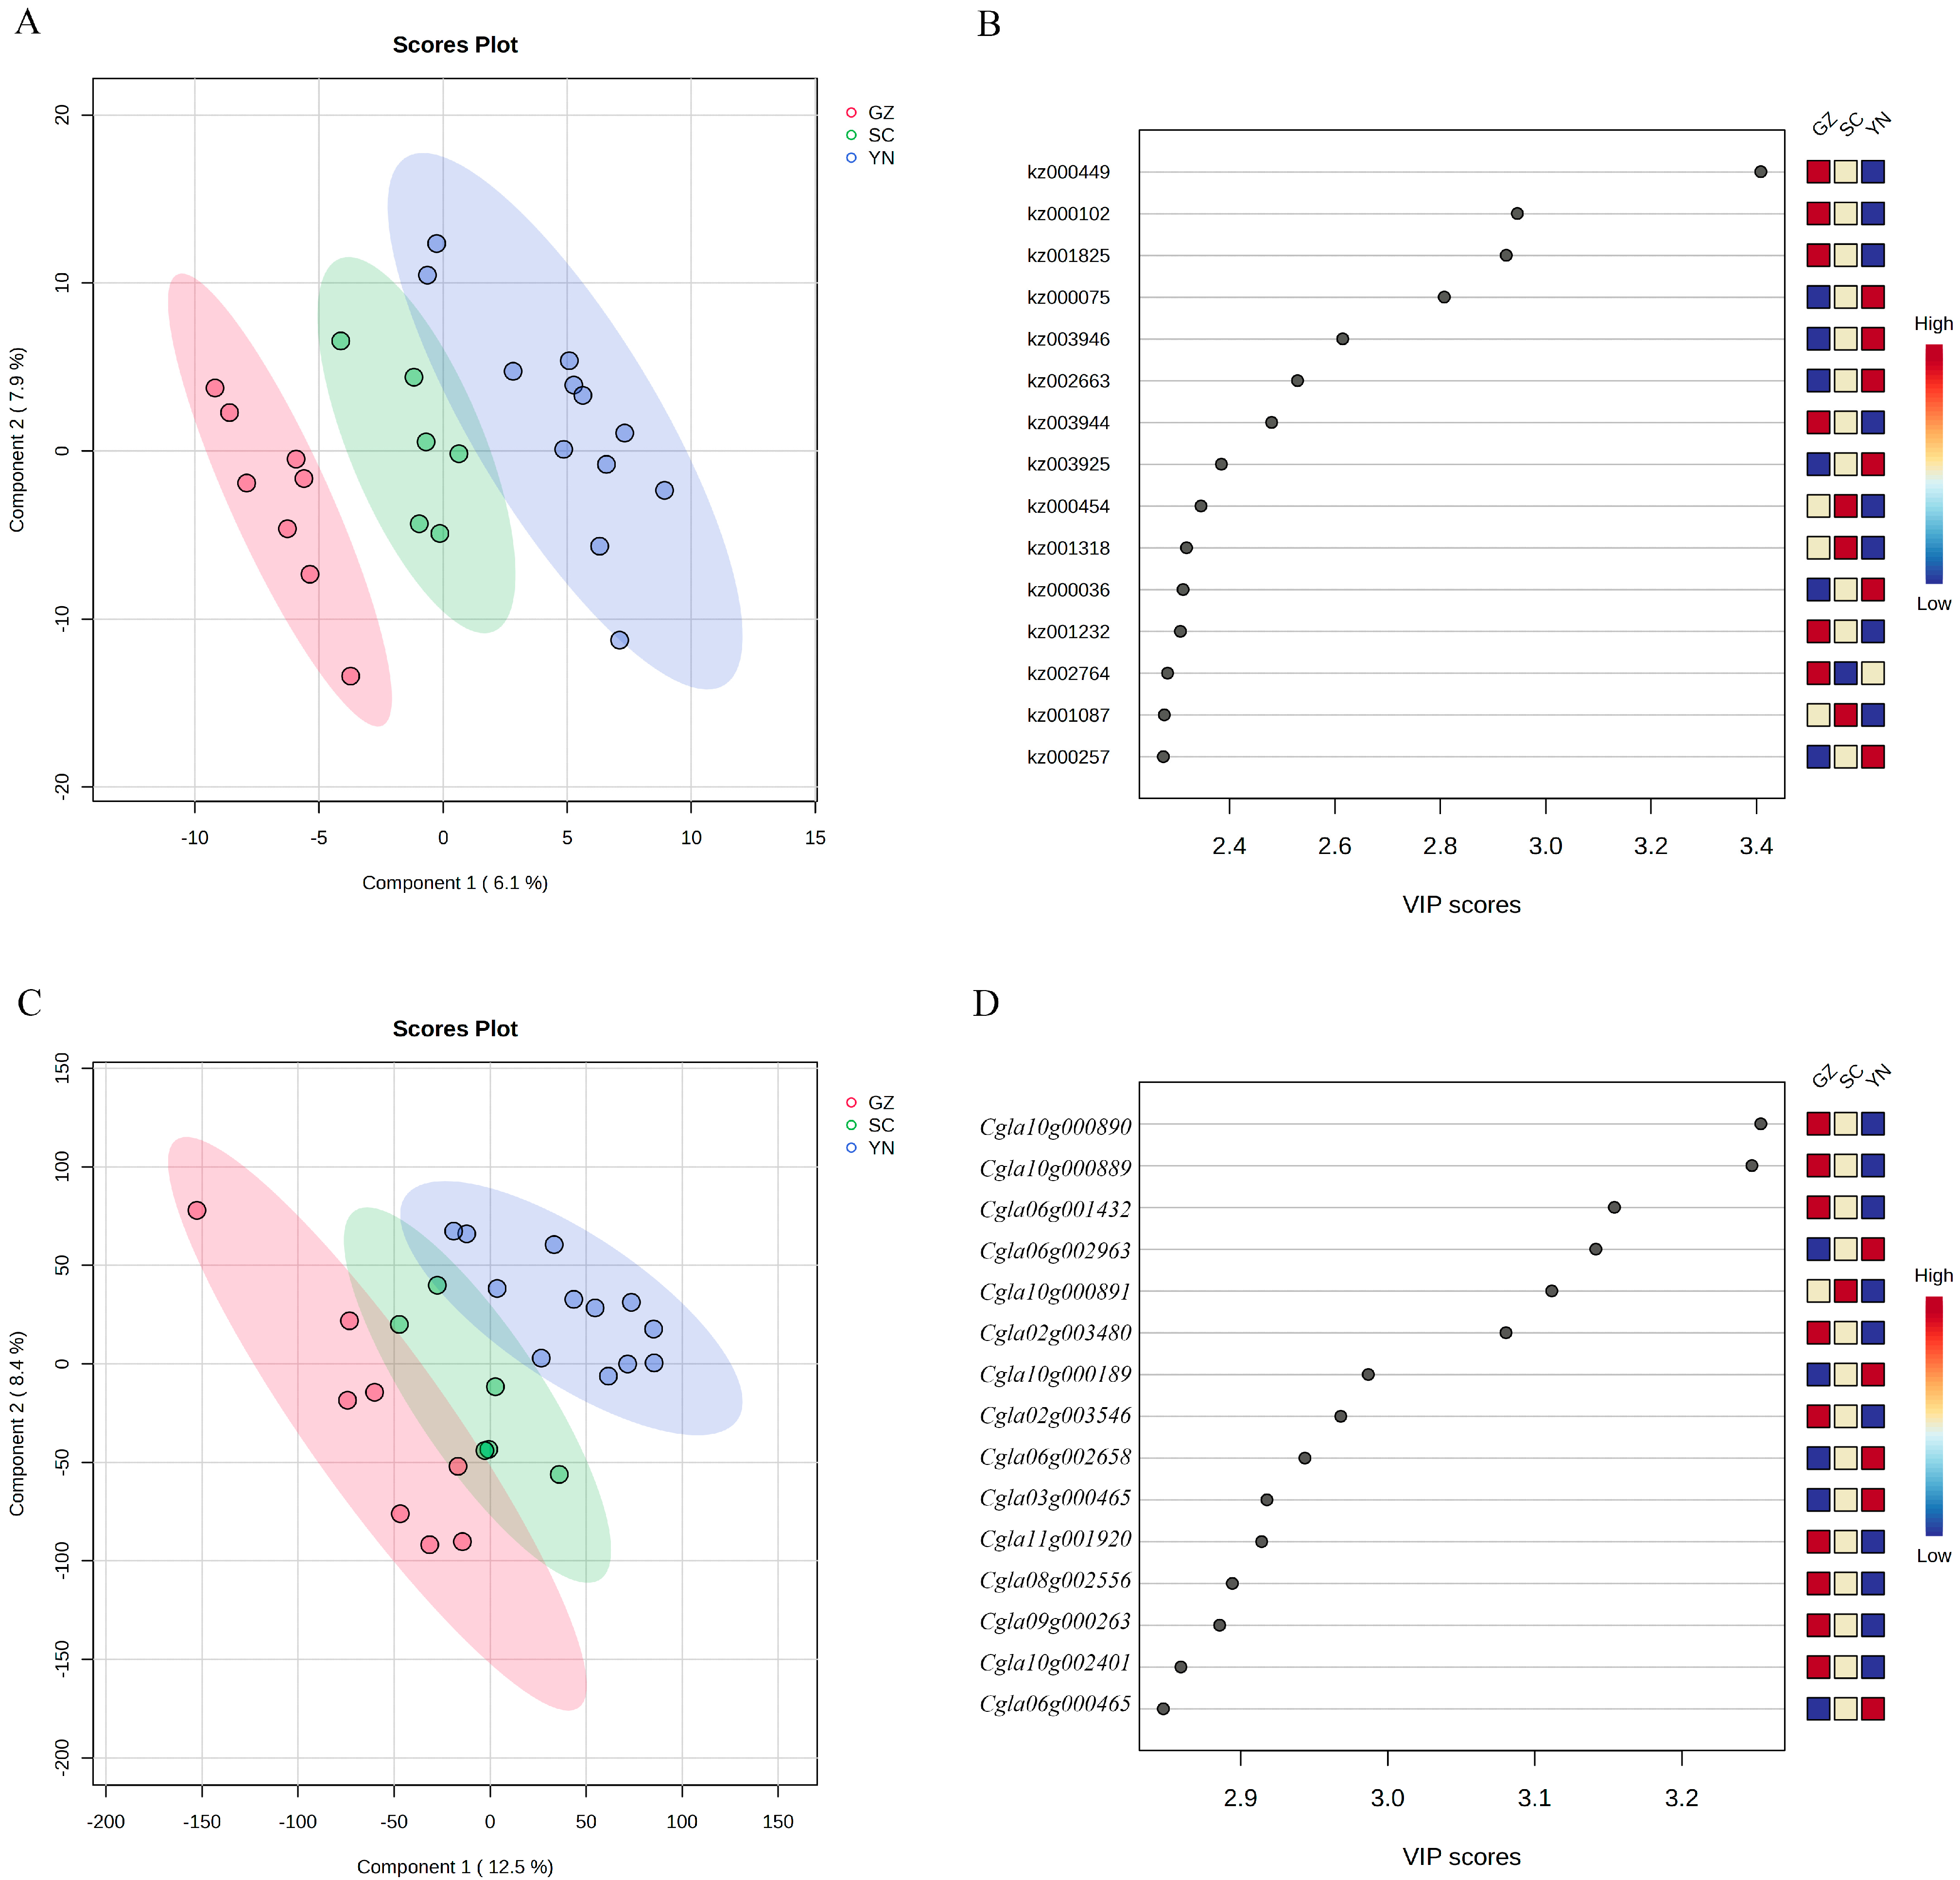
3.3. Characteristic Differential Metabolites and Expressed Genes in Pepepr Accessions from Yunnan, Guizhou and Sichuan Provinces

Although the pepper accessions from Yunnan, Guizhou and Sichuan were very similar in metabolites and transcriptome analysis when compared to pepper accessions from Hunan, we further analyzed the differences in metabolites and transcriptome among pepper accessions from Yunnan, Guizhou and Sichuan. PLS-DA analysis of the metabolites data of pepper accessions from the three provinces showed that pepper accessions from the same province gathered together (Figure 4A), and the accessions from the three provinces can be separated at the horizontal axis. The 15 metabolites with the highest VIP value were four alkaloids, one anthocyanin, four phenolic acids, two organic acids, one saccharide, one terpenoid and two free fatty acids, among which six metabolites (p-Coumaroyl agmatine, Cyanidin 3-Sambubioside, 9-HpOTrE, 13-HOTrE(r), p-coumaroyl malic acid and Nordihydrocapsiate contents are the highest in pepper accessions from Guizhou province, three metabolites (Fer-agmatine, Quinic acid and Maslinic acid) contents are the highest in pepper accessions from Sichuan province, and six metabolites (Caffeic aldehyde, Dihydrocaffeoylglucose, Abscisic acid, N’-p-Coumaroyl agmatine-glucoside, N-(4′-O-glycosyl)-p-coumaroyl agmatine and Ribulose-5-phosphate) contents are the highest in pepper accessions from Yunnan province (Figure 4B; Table 3). Notably, the content of two kinds of free fatty acids, 9-hydroperoxenoic acid (9-HPOTrE) and 13-HOTrE (r), are the highest in pepper accessions from Guizhou province. Free fatty acids play an important role in the flavor formation of many foods, acting directly as the flavor compound and contributing to the formation of the flavor. In addition, the contents of one alkaloid and two phenolic acids are the highest in pepper accessions from Guizhou province. The contents of two alkaloids, two phenolic acids, one organic acid and one saccharide are the highest in pepper accessions from Yunnan province. The contents of one alkaloid, one organic acid and one terpenoid are the highest in pepper accessions from Sichuan province.
The PLS-DA of genes expression data showed that, at the horizontal axis, accessions from the three provinces of Yunnan, Guizhou and Sichuan were separated, and pepper accessions from the same province gathered together (Figure 4C). According to the VIP value, we found that among the 15 genes with the highest VIP value, there were nine genes, Cgla10g000890, Cgla10g000889, Cgla06g001432, Cgla02g003480, Cgla02g003546, Cgla11g001920, Cgla08g002556, Cgla09g000263 and Cgla10g002401, expressed highest in pepper accessions from Guizhou province, one gene Cgla10g000891 expressed highest in pepper accessions from Sichuan province, and five genes, Cgla06g002963, Cgla10g000189, Cgla06g000465, Cgla06g002658 and Cgla03g000465 expressed highest in pepper accessions from Yunnan province (Figure 4D, Table 4).

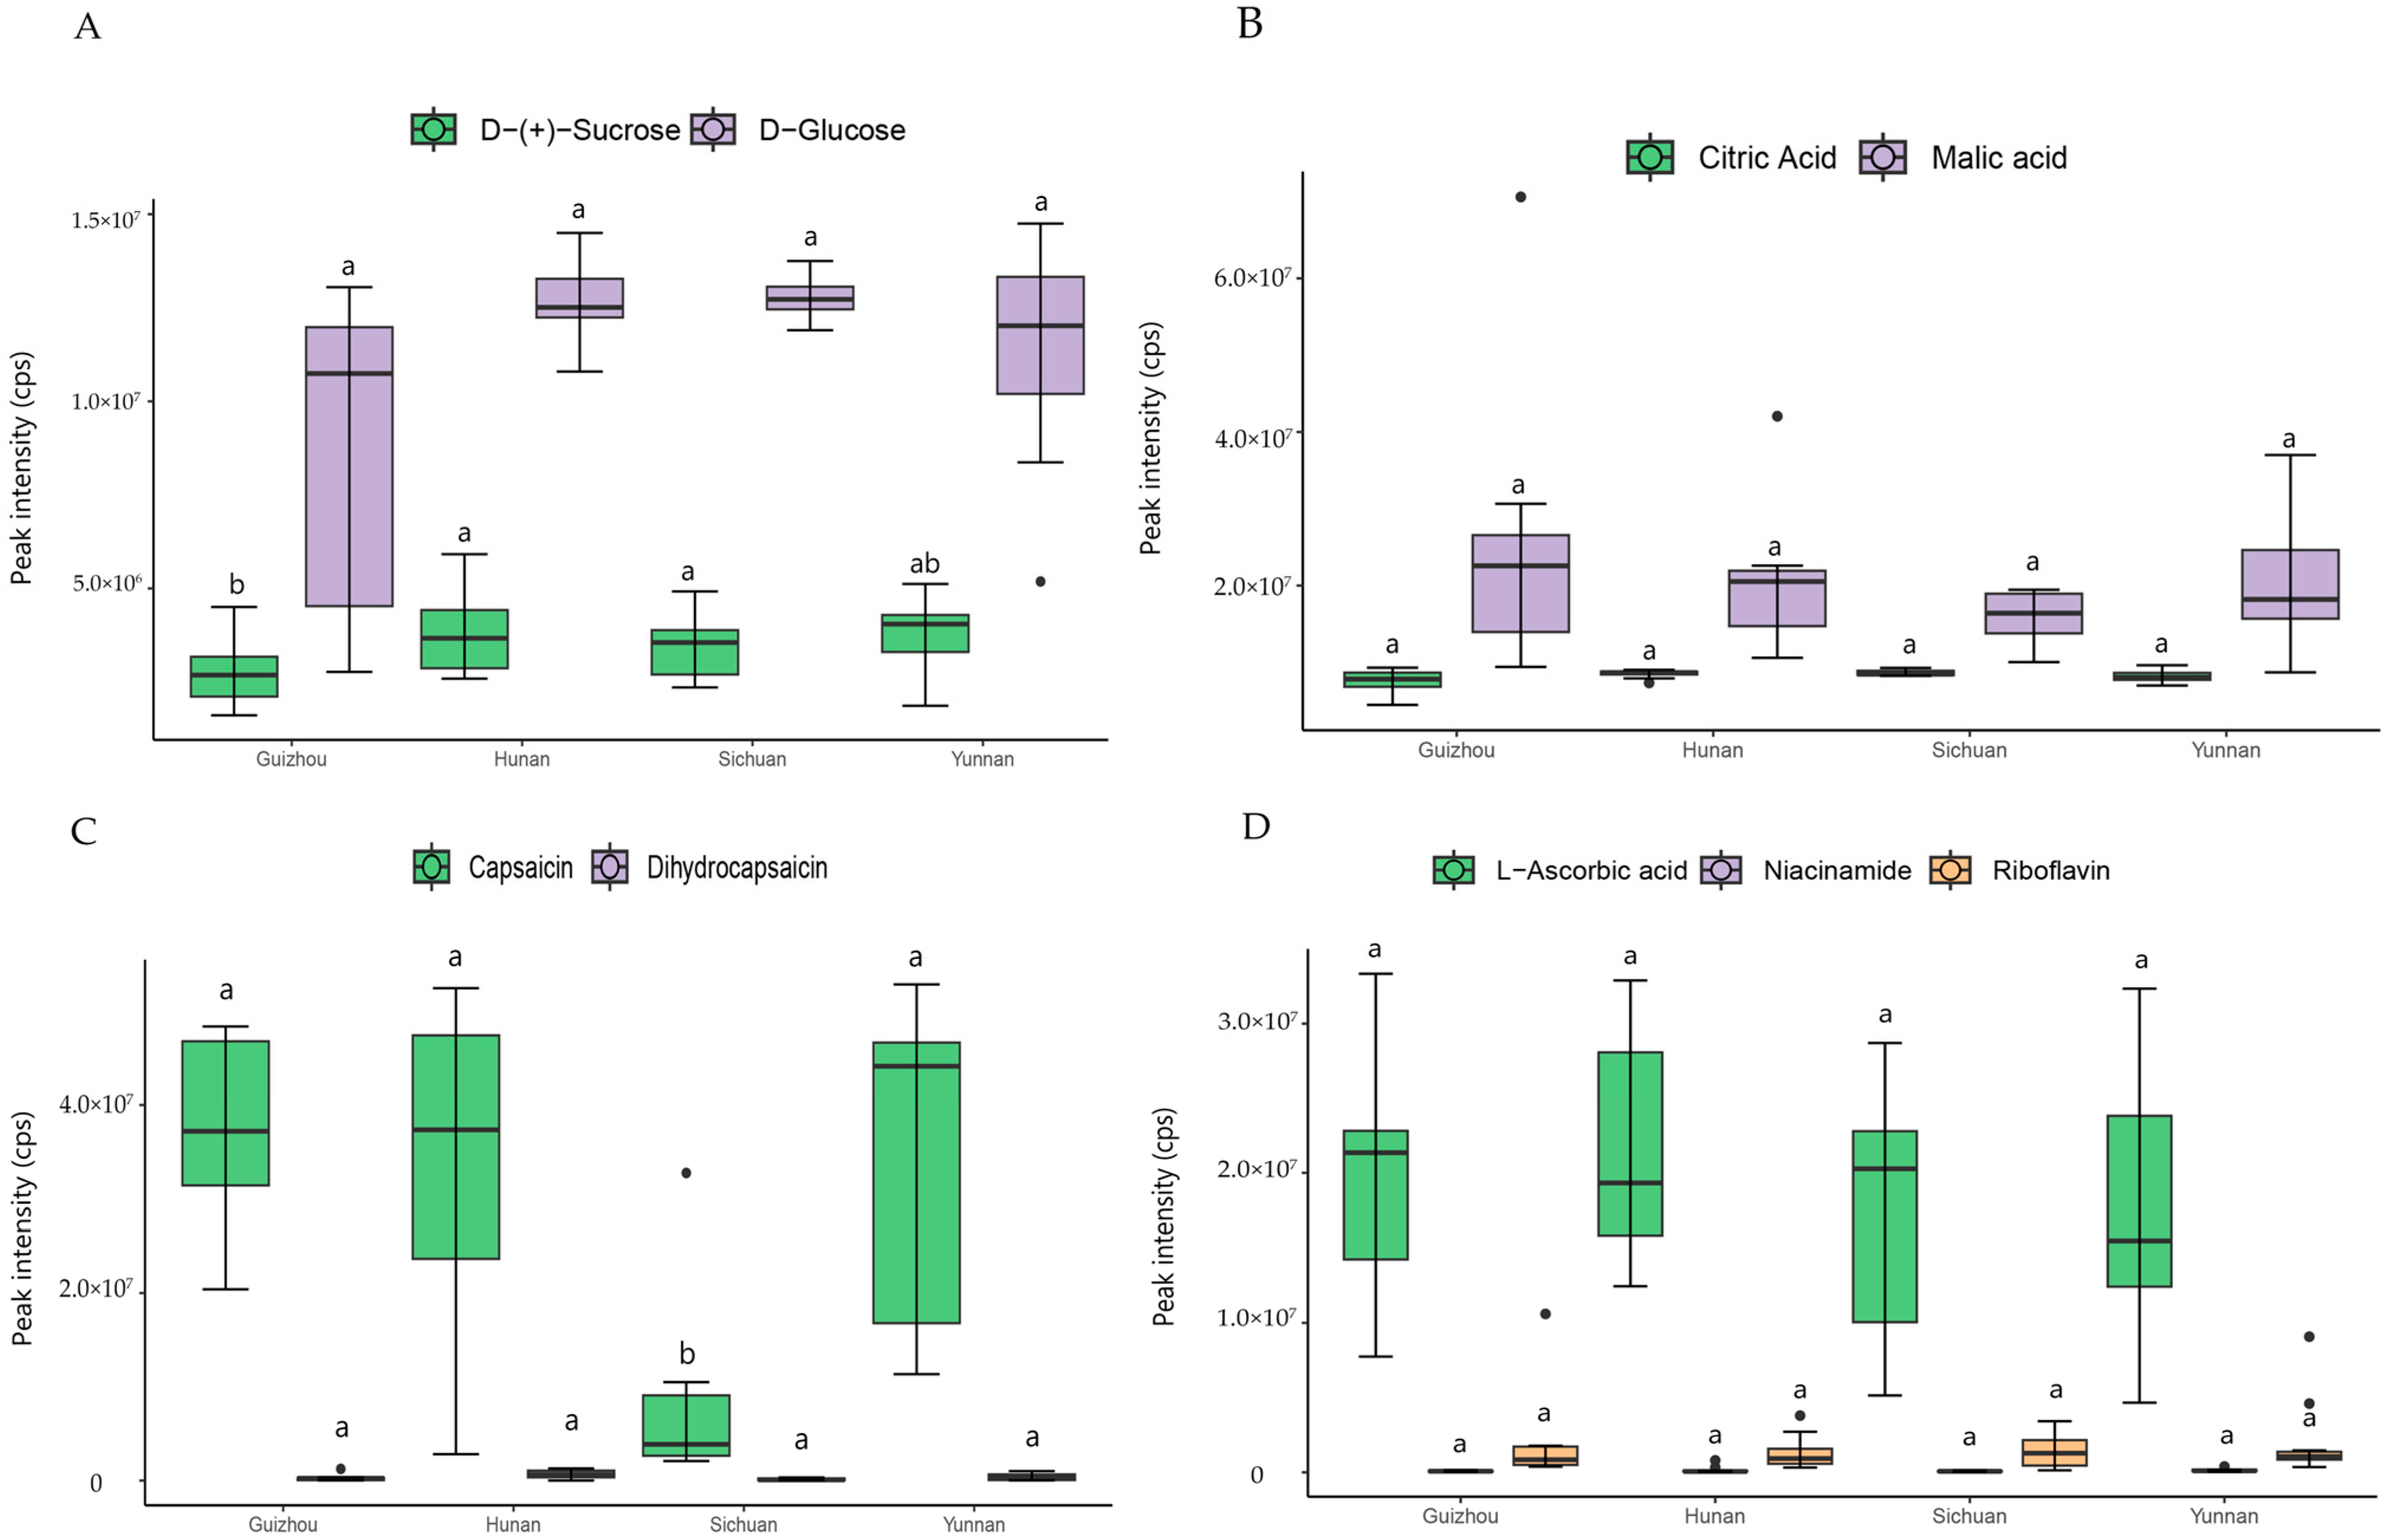
3.4. Taste and Nutrition Related Metabolites in Pepper Accession from Four Provinces

In addition to flavonoids, we also conducted comparative analysis on metabolites closely related to the taste and nutrition of pepper, particularly on sugars, acids, capsaicinoids and vitamins. The D- (+) -Sucrose content of accessions from Guizhou province was significantly lower than that of accessions from Hunan and Sichuan, and there was no significant difference from pepper accessions from Yunnan (Figure 5A). The capsaicin of accessions from Sichuan province was significantly lower than that of accessions from the other three provinces, and there was no significant difference in vitamin and acid contents. The citric acid contents of the pepper accessions from the four provinces were similar, while the malic acid content was higher in pepper accessions from Guizhou (Figure 5B). In pepper accessions from Sichuan, the contents of capsaicinoids were lowest. The mean values of capsaicinoids content of pepper accessions from Guizhou, Yunnan and Hunan provinces were similar, but in the pepper accessions from Hunan and Yunnan, the capsaicinoids contents varied considerably; in the pepper accessions from Guizhou, the capsaicinoid contents were similar (Figure 5C). Comparing the mean values of some vitamins’ contents in pepper accessions from different provinces, the average content of riboflavin in accessions from Guizhou was the highest, with high niacinamide and ascorbic acid contents in accessions from Hunan.

4. Discussion

Metabolites are important components of plants, such as sugars, proteins, lipids, terpenoids, phenols and alkaloids, which not only play an important role in plant life activities [53], but also are closely related to human life activities [54,55]. As a kind of plants secondary metabolites, flavonoids play important roles in many plants biological processes and in response to environmental factors [56,57]. Environmental factors such as altitude and soil affect changes in plant metabolites [58,59]. For example, the abundant variation in carotenoids was highly associated with high-altitude adaptations in Tibetan peach fruits [60]. In addition, many plants such as the evergreen azalea [61] and prunus fruit tree [62] have adaptive variation in high altitude areas. Yunnan, Guizhou and Sichuan have higher altitudes, which may be responsible for the high content of flavonoids in pepper accessions from Yun_Gui_Chuan Group.
In this study, the differences in the accumulation of fruit metabolites among peppers from the four provinces of China showed that there were significant differences in metabolites between pepper accessions from Yun_Gui_Chuan Group and Hunan Group, particularly in flavonoid accumulation. Pepper accessions from Yun_Gui_Chuan Group had higher contents of nine flavonoids, which were characteristic metabolites through PCA and PLS-DA, and pepper accessions from Hunan Group had only one characteristic flavonoid. The aglycones of the 10 characteristic flavonoids varies in pepper accessions from different groups; in Yun_Gui_Chuan Group, pepper accessions are mainly luteolin and chrysoeriol, and in Hunan Group, the pepper accession is apigenin. In the flavonoid biosynthesis processes, the luteolin and chrysoeriol are located in the downstream of apigenin. It may be that downstream flavonoids (luteolin and chrysoeriol) play a key role in high-altitude adaptation.
After chili peppers were introduced to China, they were commonly grown and eaten throughout the country. The first place where chili peppers began to be consumed was Guizhou, followed by Hunan. People in Guizhou and Hunan almost eat chili peppers for every meal [63], and different tastes are often related to geographical location and customs [64], which is consistent with that the pepper accessions from the two provinces showed relatively high levels of capsaicinoids. In addition, the content of cyanidin 3-Sambubioside, a kind of anthocyanin, is the highest in pepper accessions from Guizhou, which has the inhibitory effect on cancer cell metastasis [65], and quinic acid is the highest in pepper accessions from Guizhou, which have prominent antibacterial activity against bacteria [66].
Previous researchers studied metabolic differences in black pepper among three regions [67], and the results show that fatty acid derivates were the most frequent markers within the metabolites annotated for processing discrimination, such as 10,16-dihydroxyhexadecnoic acid and 9-hydroperoxy-10E-octadecenoic acid. In this study, two kinds of free fatty acids, 9-HPOTrE and 13 (S)-HOTrE, are higher in peppers from Guizhou. Under catalysis by the related enzymes, it can be converted into 9,16-dihydroperoxy acid or colnelenic acid [68]. They may be the important metabolites for the flavor of pepper accessions from Guizhou and can be used as marker metabolites to distinguish peppers from different regions, especially from Guizhou and other regions. Moreover, the previous study was basically about the differences of the same type of pepper in different regions [69,70], while this experiment analyzed the differences among the four provinces as a whole.
In this study, Cgla06g001871 is related to signal transduction, and a single SNP variant was identified at the position 43,760,475 bp on chromosome 6, which may be developed as a DNA marker to distinguish peppers from different regions, especially from Yun_Gui_Chuan and other regions. Through the detection and analysis of SNP locus information, crops of different varieties or origins can be effectively identified and differentiated, providing strong support for crop genetic improvement and regional specialty variety conservation.

5. Conclusions

In this study, according to PCA, PLS-DA, oPLS-DA and FC analyses, we found that pepper accessions from the same province have their own characteristic differential metabolites. In pepper accessions from Hunan Group, the characteristic metabolites are apigenin O-hexosyl-O-pentoside; and in pepper accessions from Yun_Gui_Chuan Group, the characteristic metabolites are also flavonoids. In Yun_Gui_Chuan Group, the characteristic metabolites of pepper accessions from each province were also analyzed. In pepper accessions from Yunnan, the characteristic metabolites are mainly caffeic aldehyde, dihydrocaffeoylglucose, abscisic acid, N’-p-coumaroyl agmatine-glucoside, N-(4′-O-glycosyl)-p-coumaroyl agmatine and ribulose-5-phosphate. In pepper accessions from Guizhou, the characteristic metabolites are mainly p-coumaroyl agmatine, cyanidin 3-sambubioside, 9-HpOTrE, 13-HOTrE(r), p-coumaroyl malic acid and nordihydrocapsiate. In pepper accessions from Sichuan, the characteristic metabolites are mainly fer-agmatine quinic acid and saslinic acid.
We found the characteristic expressed genes in the four provinces. The expression of these eight genes Cgla04g002509, Cgla05g001108, Cgla06g001871, Cgla06g002771, Cgla06g002772, Cgla07g000433, Cgla07g000244 and Cgla03g0033162, were higher in accessions from Hunan Group, and Cgla08g002247, Cgla08g002205, Cgla02g000694, Cgla04g000060, Cgla01g002925, Cgla05g000982 and Cgla12g001321 were higher in the pepper accessions from Yun_Gui_Chuan Group. Notably, an SNP was found in gene Cgla06g001871 with strong correlation with pepper accessions from Yun_Gui_Chuan Group, which can be served as a marker for identifying the source of pepper accessions. In Yun_Gui_Chuan Group, the characteristic expressed genes of pepper accessions from each province were also analyzed. There are nine genes, Cgla10g000890, Cgla10g000889, Cgla06g001432, Cgla02g003480, Cgla02g003546, Cgla11g001920, Cgla08g002556, Cgla09g000263 and Cgla10g002401, expressing highest in accessions from Guizhou province; one gene, Cgla10g000189, expressing highest in accessions from Sichuan province and five genes, Cgla06g002963, Cgla10g000189, Cgla06g000465, Cgla06g002658 and Cgla03g000465, expressing highest in accessions from Yunnan. The flavonoid 3′-monooxygenase corresponds to the gene AT5G07990 in Arabidopsis, and the corresponding homologous genes in peppers are Cgla01g001199 and Cgla04g001393 with VIP values greater than 1.5 in the oPLS-DA results, indicating that Cgla01g001199 and Cgla04g001393 may be regulating flavonoid biosynthesis in peppers. This study lays the foundation for characteristic metabolites and expressed genes in pepper accessions from different regions.

Supplementary Materials

The following supporting information can be downloaded at: https://www.mdpi.com/article/10.3390/genes16020137/s1, Table S1: Summary of the sampled collection of pepper.; Table S2: The 584 metabolites coefficients of variation (CV) less than 30% in the quality control.; Table S3: Top 15 metabolites with the highest VIP values.; Table S4: The differential metabolites of pepper accessions from Hunan and Yun_Gui_Chuan Group.

Author Contributions

Conceptualization, Z.L., F.C. and Y.C.; methodology, C.Y.; software, C.Y., L.Z. and X.X.; validation, X.X., H.Y. and Z.Z.; formal analysis, X.X. and K.Z.; investigation, H.Y.; resources, X.X.; data curation, L.Z., K.Z. and L.W.; writing—original draft preparation, Z.L. and Y.C.; writing—review and editing, Z.L., Y.C. and H.W.; visualization, X.X.; supervision, L.W.; project administration, L.W., J.H. and F.C.; funding acquisition, L.W., F.C., Y.C. and J.H. All authors have read and agreed to the published version of the manuscript.

Funding

China National Key Technology Research and Development Program (2023YFD1200101, 2022YFD1200502). The National Natural Science Foundation of China (NSFC grants 32494780, 32372712, 32302557, U23A20210). Science and Technology Innovation Program of the Chinese Academy of Agricultural Sciences (CAAS-ASTIP-IVFCAAS). The China Agricultural Research System (CARS-23-A15). Guizhou Province Science and Technology Plan Project (Construction of Quality Characteristics Analysis and Evaluation System for Guizhou Chili, Qiankehe Support [2022] Key No. 016). The Central Public-interest Scientific Institution Basal Research Fund, Y2024QC06. Hainan Seed Industry Lab, B23CQ15KP.

Institutional Review Board Statement

Not applicable.

Informed Consent Statement

Not applicable.

Data Availability Statement

The original contributions presented in the study are included in the Supplementary Tables S5 and S6.

Acknowledgments

We appreciate anonymous reviewers for providing valuable comments on this study. We also wish to thank the Chinese Academy of Agricultural Sciences (CAAS) for their ongoing support and providing the necessary infrastructure and resources. We extend our appreciation to the staff at the Institute of Vegetables and Flowers for their guidance and assistance throughout this research. Their expertise and facilities have been invaluable to the success of this project.

Conflicts of Interest

The authors declare that they have no known competing financial interests or personal relationships that could have appeared to influence the work reported in this paper.

Abbreviations

The following abbreviations are used in this manuscript:
FAOFood and Agriculture Organization of the United Nations
PCAPrincipal Component Analysis
FCFold Change
FDRFalse Discovery Rate
VIPVariable Importance in the Projection
oPLS-DAorthogonal Partial Least Squares Discriminant Analysis
PLS-DAPartial Least Squares Discriminant Analysis
CVCoefficients of Variation
QCQuality Control

References

  1. Andrews, J. Peppers: The Domesticated Capsicums; University of Texas Press: Austin, TX, USA, 1984. [Google Scholar]
  2. Perry, L.R.; Dickau, S.; Zarrillo, I.; Holst, D.M.; Pearsall, D.R.; Piperno, M.J.; Berman, M.J.; Cooke, R.G.; Rademaker, K.; Ranere, A.J.; et al. Starch Fossils and the Domestication and Dispersal of Chili Peppers (Capsicum Spp. L.) in the Americas. Science 2007, 315, 986–988. [Google Scholar] [CrossRef] [PubMed]
  3. Burger, C.P.J.; Smit, H.P. The World Pepper Economy—Developments and Outlook; Economisch en Sociaal Instituut (ESI): Prague, Czech Republic, 1997. [Google Scholar]
  4. Pickersgill, B. Domestication of plants in the Americas: Insights from mendelian and molecular genetics. Ann. Bot. 2007, 100, 925–940. [Google Scholar] [CrossRef] [PubMed]
  5. Carrizo García, C.; Barfuss, M.H.; Sehr, E.M.; Barboza, G.E.; Samuel, R.; Moscone, E.A.; Ehrendorfer, F. Phylogenetic relationships, diversification and expansion of chili peppers (Capsicum, Solanaceae). Ann. Bot. 2016, 118, 35–51. [Google Scholar] [CrossRef]
  6. Smith, S.H. In the shadow of a pepper-centric historiography: Understanding the global diffusion of capsicums in the sixteenth and seventeenth centuries. J. Ethnopharmacol 2015, 167, 64–77. [Google Scholar] [CrossRef] [PubMed]
  7. Wang, S. The Spread of Pepper and Its Influence in China. In Agricultural History of China; China Agriculture Press: Beijing, China, 2005. [Google Scholar]
  8. Batiha, G.E.-S.; Alqahtani, A.; Ojo, O.A.; Shaheen, H.M.; Wasef, L.; Elzeiny, M.; Ismail, M.; Shalaby, M.; Murata, T.; Zaragoza-Bastida, A.; et al. Biological Properties, Bioactive Constituents, and Pharmacokinetics of Some Capsicum spp. and Capsaicinoids. Int. J. Mol. Sci. 2020, 21, 5179. [Google Scholar] [CrossRef]
  9. Ochoa-Alejo, N. Capsaicin accumulation in Capsicum spp. suspension cultures. Methods Mol. Biol. 2006, 318, 327–334. [Google Scholar] [CrossRef] [PubMed]
  10. Dias, G.B.; Gomes, V.M.; Moraes, T.M.; Zottich, U.P.; Rabelo, G.R.; Carvalho, A.O.; Moulin, M.; Gonçalves, L.S.; Rodrigues, R.; Da Cunha, M. Characterization of Capsicum species using anatomical and molecular data. Genet. Mol. Res. 2013, 12, 6488–6501. [Google Scholar] [CrossRef] [PubMed]
  11. Shen, N.; Wang, T.; Gan, Q.; Liu, S.; Wang, L.; Jin, B. Plant flavonoids: Classification, distribution, biosynthesis, and antioxidant activity. Food Chem. 2022, 383, 132531. [Google Scholar] [CrossRef]
  12. Shishehbor, F.; Behroo, L.; Ghafouriyan Broujerdnia, M.; Namjoyan, F.; Latifi, S.-M. Quercetin effectively quells peanut-induced anaphylactic reactions in the peanut sensitized rats. Iran. J. Allergy Asthma Immunol. 2010, 9, 27–34. [Google Scholar]
  13. Xia, R.; Xu, G.; Huang, Y.; Sheng, X.; Xu, X.; Lu, H. Hesperidin suppresses the migration and invasion of non-small cell lung cancer cells by inhibiting the SDF-1/CXCR-4 pathway. Life Sci. 2018, 201, 111–120. [Google Scholar] [CrossRef]
  14. Calis, Z.; Mogulkoc, R.; Baltaci, A.K. The Roles of Flavonols/Flavonoids in Neurodegeneration and Neuroinflammation. Mini Rev. Med. Chem. 2020, 20, 1475–1488. [Google Scholar] [CrossRef] [PubMed]
  15. Yang, Y.; Tan, X.; Xu, J.; Wang, T.; Liang, T.; Xu, X.; Ma, C.; Xu, Z.; Wang, W.; Li, H.; et al. Luteolin alleviates neuroinflammation via downregulating the TLR4/TRAF6/NF-κB pathway after intracerebral hemorrhage. Biomed. Pharmacother. 2020, 126, 110044. [Google Scholar] [CrossRef] [PubMed]
  16. Pott, D.; Osorio, S.; Vallarino, J. From Central to Specialized Metabolism: An Overview of Some Secondary Compounds Derived From the Primary Metabolism for Their Role in Conferring Nutritional and Organoleptic Characteristics to Fruit. Front. Plant Sci. 2019, 10, 835. [Google Scholar] [CrossRef] [PubMed]
  17. Perla, V.; Nimmakayala, P.; Nadimi, M.; Alaparthi, S.; Hankins, G.R.; Ebert, A.W.; Reddy, U.K. Vitamin C and reducing sugars in the world collection of Capsicum baccatum L. genotypes. Food Chem. 2016, 202, 189–198. [Google Scholar] [CrossRef] [PubMed]
  18. Rosa-Martínez, E.; García-Martínez, M.D.; Adalid-Martínez, A.M.; Pereira-Dias, L.; Casanova, C.; Soler, E.; Figàs, M.R.; Raigón, M.D.; Plazas, M.; Soler, S.; et al. Fruit composition profile of pepper, tomato and eggplant varieties grown under uniform conditions. Food Res. Int. 2021, 147, 110531. [Google Scholar] [CrossRef] [PubMed]
  19. Naves, E.R.; de Ávila Silva, L.; Sulpice, R.; Araújo, W.L.; Nunes-Nesi, A.; Peres, L.E.; Zsögön, A. Capsaicinoids: Pungency beyond Capsicum. Trends Plant Sci. 2019, 24, 109–120. [Google Scholar] [CrossRef]
  20. Caritá, A.C.; Fonseca-Santos, B.; Shultz, J.D.; Michniak-Kohn, B.; Chorilli, M.; Leonardi, G.R. Vitamin C: One compound, several uses. Advances for delivery, efficiency and stability. Nanomed. Nanotechnol. Biol. Med. 2020, 24, 102117. [Google Scholar] [CrossRef]
  21. Gil Martínez, V.; Avedillo Salas, A.; Santander Ballestín, S. Vitamin Supplementation and Dementia: A Systematic Review. Nutrients 2022, 14, 1033. [Google Scholar] [CrossRef] [PubMed]
  22. Feng, Y.; Fan, X.; Zhang, S.; Wu, T.; Bai, L.; Wang, H.; Ma, Y.; Guan, X.; Wang, C.; Yang, H. Effects of variety and origin on the metabolic and texture characteristics of quinoa seeds based on ultrahigh-performance liquid chromatography coupled with high-field quadrupole-orbitrap high-resolution mass spectrometry. Food Res. Int. 2022, 162, 111693. [Google Scholar] [CrossRef] [PubMed]
  23. Feng, Y.; Yang, H.; An, Y.; Zhang, S.; Sheng, Y.; Wang, C. Analysis on the Difference of Daohuaxiang Rice Metabolites in Different Producing Areas. Sci. Technol. Food Ind. 2022, 43, 10–20. [Google Scholar]
  24. Feng, X.; Yu, Q.; Li, B.; Kan, J. Comparative analysis of carotenoids and metabolite characteristics in discolored red pepper and normal red pepper based on non-targeted metabolomics. LWT 2022, 153, 112398. [Google Scholar] [CrossRef]
  25. Hu, H.; Du, L.; Zhang, R.; Zhong, Q.; Liu, F.; Li, W.; Gui, M. Dissection of Metabolome and Transcriptome—Insights into Capsaicin and Flavonoid Accumulation in Two Typical Yunnan Xiaomila Fruits. Int. J. Mol. Sci. 2024, 25, 7761. [Google Scholar] [CrossRef] [PubMed]
  26. Darwin, C. On the Origin of Species by Means of Natural Selection, or the Preservation of Favoured Races in the Struggle for Life; John Murray: London, UK, 1859. [Google Scholar]
  27. Díaz-Valenzuela, E.; Sawers, R.H.; Cibrián-Jaramillo, A. Cis- and Trans-Regulatory Variations in the Domestication of the Chili Pepper. Mol. Biol. Evol. 2020, 37, 1593–1603. [Google Scholar] [CrossRef] [PubMed]
  28. Meyer, R.S.; Purugganan, M.D. Evolution of crop species: Genetics of domestication and diversification. Nat. Rev. Genet. 2013, 14, 840–852. [Google Scholar] [CrossRef] [PubMed]
  29. Clark, R.M.; Wagler, T.N.; Quijada, P.; Doebley, J. A distant upstream enhancer at the maize domestication gene tb1 has pleiotropic effects on plant and inflorescent architecture. Nat. Genet. 2006, 38, 594–597. [Google Scholar] [CrossRef] [PubMed]
  30. Doebley, J.F.; Gaut, B.S.; Smith, B.D. The molecular genetics of crop domestication. Cell 2006, 127, 1309–1321. [Google Scholar] [CrossRef] [PubMed]
  31. Li, N.; Pu, K.; Ding, D.; Yang, Y.; Niu, T.; Li, J.; Xie, J. Foliar Spraying of Glycine Betaine Alleviated Growth Inhibition, Photoinhibition, and Oxidative Stress in Pepper (Capsicum annuum L.) Seedlings under Low Temperatures Combined with Low Light. Plants 2023, 12, 2563. [Google Scholar] [CrossRef]
  32. Wang, Y.; Li, Y.; Wang, J.; Xiang, Z.; Xi, P.; Zhao, D. Physiological Changes and Differential Gene Expression of Tea Plants (Camellia sinensis (L.) Kuntze var. niaowangensis Q.H. Chen) Under Cold Stress. DNA Cell Biol. 2021, 40, 906–920. [Google Scholar] [CrossRef]
  33. Choi, J.Y.; Cho, J.S.; Park, K.J.; Choi, J.H.; Lim, J.H. Effect of Moisture Content Difference on the Analysis of Quality Attributes of Red Pepper (Capsicum annuum L.) Powder Using a Hyperspectral System. Foods 2022, 11, 4086. [Google Scholar] [CrossRef] [PubMed]
  34. Liu, Z.; Huang, Y.; Tan, F.; Chen, W.; Ou, L. Effects of Soil Type on Trace Element Absorption and Fruit Quality of Pepper. Front. Plant Sci. 2021, 12, 698796. [Google Scholar] [CrossRef]
  35. Mahmood, T.; Rana, R.M.; Ahmar, S.; Saeed, S.; Gulzar, A.; Khan, M.A.; Wattoo, F.M.; Wang, X.; Branca, F.; Mora-Poblete, F.; et al. Effect of Drought Stress on Capsaicin and Antioxidant Contents in Pepper Genotypes at Reproductive Stage. Plants 2021, 10, 1286. [Google Scholar] [CrossRef] [PubMed]
  36. Zhou, S.; Yin, W.; Yang, B.; Ma, Y. The Development Status, Problems and Suggestions of Hunan Pepper Industry. J. China Capsicum 2020, 18, 8–13. [Google Scholar]
  37. Gui, M.; Du, L.; Zhang, R.; Zhong, Q.; Long, H. Development of Processing Pepper Industry in Yunnan Province. Agric. Eng. 2019, 9, 70–73. [Google Scholar]
  38. Lu, M.; Tong, S.Q.; Peng, G.H.; Zhou, M.; Wu, Y.J. Processing status and development suggestions on pepper industry in Guizhou. China Brew. 2021, 40, 221–224. [Google Scholar]
  39. Xu, Y.; Li, H.; Fang, H.; Gong, X.; Chen, X.; Song, Z. Development Status and Suggestions on Pepper Industry in Sichuan Province. J. China Capsicum 2020, 18, 1–5. [Google Scholar]
  40. Gong, C.; Guo, G.; Pan, B.; Gao, C.; Zhu, X.; Liu, G.; Wang, S.; Diao, W. Global Transcription and Metabolic Profiles of Five Tissues in Pepper Fruits. Sci. Data 2024, 11, 1129. [Google Scholar] [CrossRef]
  41. Xue, Q.; Zhang, Q.; Zhang, A.; Li, D.; Liu, Y.; Xu, H.; Yang, Q.; Liu, F.; Han, T.; Tang, X.; et al. Integrated metabolome and transcriptome analysis provides clues to fruit color formation of yellow, orange, and red bell pepper. Sci. Rep. 2024, 14, 29737. [Google Scholar] [CrossRef] [PubMed]
  42. Von Steimker, J.; Tripodi, P.; Wendenburg, R.; Tringovska, I.; Nankar, A.N.; Stoeva, V.; Pasev, G.; Klemmer, A.; Todorova, V.; Bulut, M.; et al. The genetic architecture of the pepper metabolome and the biosynthesis of its signature capsianoside metabolites. Curr. Biol. 2024, 34, 4209–4223.e4203. [Google Scholar] [CrossRef] [PubMed]
  43. Chen, W.; Gong, L.; Guo, Z.; Wang, W.; Zhang, H.; Liu, X.; Yu, S.; Xiong, L.; Luo, J. A Novel Integrated Method for Large-Scale Detection, Identification, and Quantification of Widely Targeted Metabolites: Application in the Study of Rice Metabolomics. Mol. Plant 2013, 6, 1769–1780. [Google Scholar] [CrossRef]
  44. Fraga, C.G.; Clowers, B.H.; Moore, R.J.; Zink, E.M. Signature-discovery approach for sample matching of a nerve-agent precursor using liquid chromatography-mass spectrometry, XCMS, and chemometrics. Anal. Chem. 2010, 82, 4165–4173. [Google Scholar] [CrossRef] [PubMed]
  45. Kattupalli, D.; Pinski, A.; Sreekumar, S.; Usha, A.; Girija, A.; Beckmann, M.; Mur, L.A.J.S.; Vasudevan, E. Non-Targeted Metabolite Profiling Reveals Host Metabolomic Reprogramming during the Interaction of Black Pepper with Phytophthora capsici. Int. J. Mol. Sci. 2021, 22, 11433. [Google Scholar] [CrossRef]
  46. Abdelhafez, O.H.; Othman, E.M.; Fahim, J.R.; Desoukey, S.Y.; Pimentel-Elardo, S.M.; Nodwell, J.R.; Schirmeister, T.; Tawfike, A.; Abdelmohsen, U.R. Metabolomics analysis and biological investigation of three Malvaceae plants. Phytochem. Anal. 2020, 31, 204–214. [Google Scholar] [CrossRef]
  47. Fischer, S.; Flis, P.; Zhao, F.J.; Salt, D.E. Transcriptional network underpinning ploidy-related elevated leaf potassium in neo-tetraploids. Plant Physiol. 2022, 190, 1715–1730. [Google Scholar] [CrossRef] [PubMed]
  48. Sun, Y.; Wang, Y.; Zhang, X.; Chen, Z.; Xia, Y.; Wang, L.; Sun, Y.; Zhang, M.; Xiao, Y.; Han, Z.; et al. Plant receptor-like protein activation by a microbial glycoside hydrolase. Nature 2022, 610, 335–342. [Google Scholar] [CrossRef] [PubMed]
  49. Afgan, E.; Baker, D.; van den Beek, M.; Blankenberg, D.; Bouvier, D.; Čech, M.; Chilton, J.; Clements, D.; Coraor, N.; Eberhard, C.; et al. The Galaxy platform for accessible, reproducible and collaborative biomedical analyses. Nucleic Acids Res. 2016, 44, W3–W10. [Google Scholar] [CrossRef] [PubMed]
  50. Cao, Y.; Zhang, K.; Yu, H.; Chen, S.; Xu, D.; Zhao, H.; Zhang, Z.; Yang, Y.; Gu, X.; Liu, X.; et al. Pepper variome reveals the history and key loci associated with fruit domestication and diversification. Mol. Plant 2022, 15, 1744–1758. [Google Scholar] [CrossRef] [PubMed]
  51. R Core Team. R: A Language and Environment for Statistical Computing. In R Foundation for Statistical Computing; R Core Team: Vienna, Austria, 2024; Available online: https://www.R-project.org/ (accessed on 28 October 2024).
  52. Tang, Q.; Zheng, X.; Chen, W.; Ye, X.; Tu, P. Metabolomics reveals key resistant responses in tomato fruit induced by Cryptococcus laurentii. Food Chem. Mol. Sci. 2021, 4, 100066. [Google Scholar] [CrossRef] [PubMed]
  53. Bouzayen, M.; Latché, A.; Nath, P.; Pech, J.C. (Eds.) Mechanism of Fruit Ripening; Springer: Berlin/Heidelberg, Germany, 2010. [Google Scholar]
  54. Dillard, C.J.; German, J.B. Phytochemicals: Nutraceuticals and human health. J. Sci. Food Agric. 2000, 80, 1744–1756. [Google Scholar] [CrossRef]
  55. Olatunji, T.L.; Afolayan, A.J. The suitability of chili pepper (Capsicum annuum L.) for alleviating human micronutrient dietary deficiencies: A review. Food Sci. Nutr. 2018, 6, 2239–2251. [Google Scholar] [CrossRef]
  56. Goncalo, C.J. Flavonoids—From Biosynthesis to Human Health; InTech: Rijeka, Croatia, 2017. [Google Scholar]
  57. Dias, M.C.; Pinto, D.C.G.A.; Silva, A.M.S. Plant Flavonoids: Chemical Characteristics and Biological Activity. Molecules 2021, 26, 5377. [Google Scholar] [CrossRef]
  58. Zhang, K.L.; Leng, Y.N.; Hao, R.R.; Zhang, W.Y.; Li, H.F.; Chen, M.X.; Zhu, F.Y. Adaptation of High-Altitude Plants to Harsh Environments: Application of Phenotypic-Variation-Related Methods and Multi-Omics Techniques. Int. J. Mol. Sci. 2024, 25, 12666. [Google Scholar] [CrossRef] [PubMed]
  59. Zhang, X.; Kuang, T.; Dong, W.; Qian, Z.; Zhang, H.; Landis, J.B.; Feng, T.; Li, L.; Sun, Y.; Huang, J.; et al. Genomic convergence underlying high-altitude adaptation in alpine plants. J. Integr. Plant Biol. 2023, 65, 1620–1635. [Google Scholar] [CrossRef] [PubMed]
  60. Zheng, W.; Yu, S.; Zhang, W.; Zhang, S.; Fu, J.; Ying, H.; Pingcuo, G.; Liu, S.; Zhao, F.; Wu, Q.; et al. The content and diversity of carotenoids associated with high-altitude adaptation in Tibetan peach fruit. Food Chem. 2023, 398, 133909. [Google Scholar] [CrossRef] [PubMed]
  61. Wang, X.; Gao, Y.; Wu, X.; Wen, X.; Li, D.; Zhou, H.; Li, Z.; Liu, B.; Wei, J.; Chen, F.; et al. High-quality evergreen azalea genome reveals tandem duplication-facilitated low-altitude adaptability and floral scent evolution. Plant Biotechnol. J. 2021, 19, 2544–2560. [Google Scholar] [CrossRef] [PubMed]
  62. Wang, X.; Liu, S.; Zuo, H.; Zheng, W.; Zhang, S.; Huang, Y.; Pingcuo, G.; Ying, H.; Zhao, F.; Li, Y.; et al. Genomic basis of high-altitude adaptation in Tibetan Prunus fruit trees. Curr. Biol. 2021, 31, 3848–3860.e8. [Google Scholar] [CrossRef]
  63. Zhang, Y.; Zhu, H. Regional cultural influences on the introduction of chili peppers to China. Agric. Archaeol. 2013, 1, 221–224. (In Chinese) [Google Scholar]
  64. Sobczak, A.; Pióro-Jabrucka, E.; Gajc-Wolska, J.; Kowalczyk, K. Effect of Salicylic Acid and Calcium on Growth, Yield, and Fruit Quality of Pepper (Capsicum annuum L.) Grown Hydroponically. Agronomy 2024, 14, 329. [Google Scholar] [CrossRef]
  65. Lee, S.-J.; Hong, S.; Yoo, S.-H.; Kim, G.-W. Cyanidin-3-O-Sambubioside from Acanthopanax sessiliflorus Fruit Inhibits Metastasis by Downregulating MMP-9 in Breast Cancer Cells MDA-MB-231. Planta Med. 2013, 79, 1636–1640. [Google Scholar] [CrossRef] [PubMed]
  66. Bai, J.; Wu, Y.; Bu, Q.; Zhong, K.; Gao, H. Comparative study on antibacterial mechanism of shikimic acid and quinic acid against Staphylococcus aureus through transcriptomic and metabolomic approaches. Food Sci. Technol. 2022, 153, 112441. [Google Scholar] [CrossRef]
  67. Rivera-Pérez, A.; Romero-González, R.; Garrido Frenich, A. Application of an innovative metabolomics approach to discriminate geographical origin and processing of black pepper by untargeted UHPLC-Q-Orbitrap-HRMS analysis and mid-level data fusion. Food Res. Int. 2021, 150, 110722. [Google Scholar] [CrossRef]
  68. Zhao, X.; Pan, Y.; Tan, J.; Lv, H.; Wang, Y.; Chen, D.-X. Metabolomics and transcriptomics reveal the mechanism of alkaloid synthesis in Corydalis yanhusuo bulbs. PLoS ONE 2024, 19, e0304258. [Google Scholar] [CrossRef] [PubMed]
  69. Xiao, H.; Wang, R.; Chen, M.; Wang, X.; Yin, H.; Liu, Y.; Jiang, L. Comparison and Analysis of the Flavor Components of Chopped Peppers from Farmhouses in Different Regions of Hunan. Sci. Technol. Food Ind. 2022, 43, 310–318, (In Chinese with English abstract). [Google Scholar] [CrossRef]
  70. Dou, J. Comparisons of Yield and Disease Resistance of Different Dried Hot Pepper. China Fruit Veg. 2016, 35, 32–34, (In Chinese with English abstract). [Google Scholar]
Figure 1. Genome and metabolome analyses. (A): The neighbor joining tree of 36 pepper accessions. (B): The classification of 584 metabolites. (C): Principal component analysis of pepper metabolites from four provinces (HN-Hunan; SC-Sichuan; YN-Yunnan; GZ-Guizhou).
Genes 16 00137 g001
Figure 2. Metabolites analyses of pepper accessions from Hunan and Yun_Gui_Chuan Groups. (A): oPLS-DA score chart; (B): oPLS-DA VIP score chart; (C): volcano plot.
Genes 16 00137 g002
Figure 3. Hunan (HN) Group and Yun_Gui_Chuan(YGC) Group transcriptome analyses. (A): oPLS-DA score chart; (B): oPLS-DA VIP score chart; (C) volcano plot; (D): the structure of Cgla06g001871 and the SNP position.
Genes 16 00137 g003
Figure 4. Yunnan, Guizhou and Sichuan pepper accessions transcriptome and metabolome analyses. (A): Metabolome PLS-DA score chart; (B): Metabolome PLS-DA VIP score chart (C): Gene PLS-DA score chart (D): Gene PLS-DA VIP score chart.
Genes 16 00137 g004
Figure 5. Analyses of taste and nutrition metabolites among Yunnan, Guizhou Sichuan and Hunan province (A): sugars; (B): acids; (C): capsaicinoids; (D): vitamins. (Identical lowercase letters indicate no significant difference at the 0.05 level.) Unit: count per second (cps).
Genes 16 00137 g005
Table 1. Differential metabolites of Hunan and Yun_Gui_Chuan Groups, analyzed by all three methods (PCA, oPLSDA and FC analyses).
KZ IDCompoundsClassThe Group from Which Pepper Accessions with Higher Characteristic Metabolites Content Come
kz002597Kaempferol-C-glucoside-C-glucosideFlavonoid carbonosideYun_Gui_Chuan
kz000935C-Hexosyl-luteolin C-pentosideFlavonoid carbonoside
kz000832Luteolin-6,8-di-C-glucosideFlavonoid carbonoside
kz002593luteolin-6-C-glucoside (Isoorientin)Flavones
km1214Chrysoeriol 8-C-hexosideFlavonoid carbonoside
kz000927Luteolin-6-C-glucoside (Isoorientin)Flavonoid carbonoside
Rfa072NLuteolin 6-C-hexoside-8-C-pentosideFlavonoid carbonoside
kz000835Luteolin-6-C-2-glucuronylglucosideFlavonoid carbonoside
kz003987Luteolin-O-Malonyl-O-Hexoside-O-PentosideFlavones
kz000820Apigenin O-hexosyl-O-pentosideFlavonesHunnan
Table 2. Functional annotation of the differential expressed genes between Hunan Group and Yun_Gui_Chuan Group with the top 15 VIP value.
Gene IDFunction AnnotationThe Group from Which Pepper Accessions with Higher Characteristic Gene Expression Come
Cgla01g002925F-box domain-containing proteinYun_Gui_Chuan
Cgla02g000694Transcription factor TCP17
Cgla04g000060RING-H2 finger protein ATL44
Cgla05g000982sulfated surface glycoprotein 185-like
Cgla08g002205F-box domain-containing protein
Cgla08g002247F-box domain-containing protein
Cgla12g001321Rop guanine nucleotide exchange factor 9
Cgla03g003316Transposon MuDR mudrA-like protein, putativeHunan
Cgla04g002509Chaperone protein dnaJ 2
Cgla05g001108protein PHYLLO, chloroplastic isoform X1
Cgla06g001871Phorbol-ester/DAG-type domain-containing protein
Cgla06g002771Putative α-mannosidase I MNS5
Cgla06g002772Unknown function
Cgla07g000244Pentatricopeptide repeat-containing protein, chloroplastic
Cgla07g000433START domain-containing protein
Table 3. Characteristic differential metabolites of accessions from Yunnan, Guizhou and Sichuan provinces.
Kz IDCompoundsClassThe Province from Which Pepper Accessions with the Highest Characteristic Metabolites Come
kz000449p-Coumaroyl agmatineAlkaloidsGuizhou
kz002764Cyanidin 3-SambubiosideAnthocyanins
kz0001029-HpOTrEFree fatty acids
kz00123213-HOTrE(r)Free fatty acids
kz001825p-coumaroyl malic acidPhenolic acids
kz003944NordihydrocapsiatePhenolic acids
kz000454Fer-agmatineAlkaloidsSichuan
kz001318Quinic acidOrganic acids
kz001087Maslinic acidTerpenoids
kz000075Caffeic aldehydePhenolic acidsYunnan
kz003946DihydrocaffeoylglucosePhenolic acids
kz002663Abscisic acidOrganic acids
kz003925N’-p-Coumaroyl agmatine-glucosideAlkaloids
kz000036N-(4′-O-glycosyl)-p-coumaroyl agmatineAlkaloids
kz000257Ribulose-5-phosphateSaccharides
Table 4. Differential expressed genes of accessions from Yunnan, Guizhou and Sichuan provinces.
GeneFunction AnnotationThe Province from Which Pepper Accessions with the Highest Characteristic Metabolites Come
Cgla10g0008893-deoxy-manno-octulosonate cytidylyltransferase, mitochondrialGuizhou
Cgla02g003480Protein kinase domain-containing protein
Cgla02g003546Putative pentatricopeptide repeat-containing protein At3g01580
Cgla06g001432gibberellin 3-β-dioxygenase 1-like
Cgla08g002556Uncharacterized protein
Cgla09g000263Uncharacterized protein
Cgla10g000890DUF547 domain-containing protein
Cgla10g002401GH10 domain-containing protein
Cgla11g001920protein phytochrome kinase substrate 1
Cgla10g000891DUF547 domain-containing proteinSichuan
Cgla03g000465Peptidase_M16_C domain-containing proteinYunnan
Cgla06g000465CRAL-TRIO domain-containing protein
Cgla06g002658Dehydroascorbate reductase
Cgla06g002963Serine/threonine-protein kinase HT1-like (Fragment)
Cgla10g000189Unknown function
Disclaimer/Publisher’s Note: The statements, opinions and data contained in all publications are solely those of the individual author(s) and contributor(s) and not of MDPI and/or the editor(s). MDPI and/or the editor(s) disclaim responsibility for any injury to people or property resulting from any ideas, methods, instructions or products referred to in the content.

