Abstract
Background/Objectives: Seasonal reproduction in mammals is primarily regulated by the hypothalamic–pituitary–ovarian (HPO) axis, yet its molecular mechanisms in subterranean rodents living in light-restricted environments remain poorly understood. This study aimed to characterize the transcriptional regulation of the HPO axis during seasonal estrus in the Manchurian zokor (Myospalax psilurus, M. psilurus), a fossorial rodent exhibiting distinct breeding cycles despite perpetual darkness. Methods: Hypothalamic, pituitary, and ovarian tissues were collected from female zokors during estrus and anestrus (n = 5 per group). RNA sequencing was performed, followed by de novo transcriptome assembly and bioinformatic analyses. Differentially expressed genes (DEGs) were identified using edgeR, and functional enrichment was assessed via GO and KEGG analyses. Key DEGs were validated by RT-qPCR. Results: A total of 513, 292, and 138 DEGs were identified in the hypothalamus, pituitary, and ovary, respectively. GO analysis highlighted enrichment in G-protein-coupled receptor signaling, oxidation–reduction processes, and calcium ion binding. KEGG pathway analysis revealed significant enrichment of the neuroactive ligand–receptor interaction pathway across all three tissues. Key candidate genes included Trh and Mc3r in the hypothalamus, Pitx2 and NR4A2 in the pituitary, and PTGER2 and Sphk1 in the ovary. Conclusions: This study provides the first comprehensive transcriptomic profile of the HPO axis in Manchurian zokors during seasonal estrus. The neuroactive ligand–receptor interaction pathway appears central to reproductive regulation, and several tissue-specific genes were identified as potential regulators of seasonal breeding. These findings enhance our understanding of reproductive adaptation in subterranean mammals and offer a foundation for further functional studies.
1. Introduction
Reproduction is essential for species survival and population persistence, with seasonal reproduction being a common strategy in mammals. This process is primarily regulated by the hypothalamus–pituitary–ovarian (HPO) axis and entrained by environmental cues—such as light–dark cycles—via the suprachiasmatic nucleus [1,2,3]. The HPO axis modulates follicular development, ovulation, and estrogen synthesis through coordinated feedback mechanisms involving gonadotropin-releasing hormone (GnRH), luteinizing hormone (LH), and follicle-stimulating hormone (FSH), while reproduction-related genes exhibit rhythmic expression that supports seasonal breeding [4,5,6,7,8,9,10].
Subterranean rodents provide a unique model for studying seasonal reproduction, as their underground habitats differ drastically from the aboveground environments in which most mammalian reproductive rhythms have been studied [11]. The Manchurian zokor, a typical subterranean rodent distributed across Transbaikalia, eastern Mongolia, and eastern and central China, resides in underground tunnels year-round yet still exhibits a distinct seasonal breeding pattern—breeding initiates in late spring and pup rearing occurs in summer [12,13,14]. However, how seasonal reproduction is regulated under lightless conditions remains unclear. The molecular mechanisms underlying this process, particularly the transcriptional dynamics across the HPO axis, are still unknown.
In the present investigation, hypothalamic, pituitary, and ovarian tissue samples were collected from female Manchurian zokors during estrus and anestrus, from which mRNA was extracted and subjected to separate sequencing. Bioinformatic analysis of the resulting data identified key genes and signaling pathways that regulate seasonal reproduction throughout the entire HPO axis of the Manchurian zokor.
2. Materials and Methods
2.1. Experimental Animals and Tissue Collection
Manchurian zokors were captured in the Hulunbeier Meadow Grassland Area in Inner Mongolia, China (E 120°20′1″–120°16′1″, N 49°14′–49°20′), using circular-tong traps during the non-breeding (mid-April 2024) and breeding (May 2024) seasons. From the captured individuals, five females in the breeding stage and five in the non-breeding stage, with a mean body weight of 335.1 ± 21.4 g, were selected for subsequent analyses. The sample size for each group (n = 5) followed standard practice in similar mammalian transcriptomic studies, providing a balance between statistical robustness for detecting differentially expressed genes and the ethical principle of minimizing animal use [5,15]. Female zokors captured in each season were randomly assigned to experimental groups. The random allocation sequence was generated using the random-number function in Microsoft Excel. To minimize potential confounding factors, the order of tissue dissection, RNA extraction, and library preparation for all samples was also randomized. Sample positions during sequencing were likewise randomized to avoid batch effects. Animals were euthanized by carbon dioxide inhalation. Hypothalamic, pituitary, and ovarian tissues were rapidly dissected, flash-frozen in liquid nitrogen, and stored at −80 °C until RNA isolation.
Group allocation was necessarily known during tissue dissection; however, to prevent bias, all subsequent laboratory procedures—including RNA extraction, library construction, RNA sequencing, and qPCR—and all data analyses were performed under blinded conditions. Samples were handled using coded labels by personnel unaware of group identity until data collection and analyses were complete.
2.2. RNA Extraction and Library Construction
Total RNA was extracted from hypothalamic, pituitary, and ovarian tissues of Manchurian zokors using TRIzol reagent (Invitrogen, Carlsbad, CA, USA). The extraction procedure included tissue homogenization in TRIzol, phase separation with chloroform, RNA precipitation with isopropanol, and washing with 75% ethanol. The RNA pellet was air-dried and dissolved in RNase-free water. RNA concentration and purity were determined with a NanoDrop ND-1000 spectrophotometer (NanoDrop, Technologies, Wilmington, DE, USA), and integrity was verified using an Agilent Bioanalyzer 2100 (RIN > 7.0, Agilent Technologies, Santa Clara, CA, USA) and denaturing agarose gel electrophoresis. Polyadenylated RNA was purified from 1 μg of total RNA using Dynabeads™ Oligo(dT)25 (Thermo Fisher Scientific, Waltham, MA, USA) in two rounds. The enriched poly(A) RNA was fragmented at 94 °C for 5–7 min using a Magnesium RNA Fragmentation Module (New England Biolabs, Ipswich, MA, USA). First-strand cDNA was synthesized with SuperScript™ II Reverse Transcriptase (Invitrogen, Carlsbad, CA, USA), and the second strand was generated using Escherichia coli (E. coli) DNA Polymerase I (NEB, Ipswich, MA, USA), RNase H (NEB, USA), and dUTP Solution (Thermo Fisher, USA) to incorporate dUTP. The resulting cDNA fragments were blunt-ended, adenylated at their 3′ ends for adapter ligation, and size-selected using AMPureXP beads. Uracil bases were excised using UDG enzyme (NEB, USA), and the libraries were PCR-amplified (95 °C for 3 min; 8 cycles of 98 °C for 15 s, 60 °C for 15 s, and 72 °C for 30 s; final extension at 72 °C for 5 min). The final cDNA libraries, with an average insert size of 300 ± 50 bp, were sequenced (paired-end, 2 × 150 bp) on an Illumina NovaSeq™ 6000 platform at LC Bio (Hangzhou, China).
2.3. Identification of Differentially Expressed Genes
All biological replicates (n = 5 per group) were processed and analyzed independently throughout RNA extraction, library preparation, sequencing, and differential expression analysis to ensure statistical robustness and reproducibility. Following quality control, raw sequencing reads were processed with the fastp tool using default parameters to remove adapter contaminants, low-quality bases, and undetermined nucleotides. In the absence of a reference genome for Manchurian zokor, the clean reads were subjected to de novo assembly using Trinity (Version 2.15). The assembled unigenes were functionally annotated by aligning them against six public databases—Nr, GO, Swiss-Prot, KEGG, Pfam, and eggNOG—using DIAMOND with a stringent E-value cutoff of <0.00001. For expression quantification, sample-specific transcriptomes were first assembled with StringTie and then merged into a unified transcriptome using gffcompare. Transcript abundance was estimated as FPKM values via StringTie, and differential expression analysis was performed using the edgeR package (Version 3.40.2). Differentially expressed genes (DEGs) were identified using a false discovery rate (FDR) of 1% for statistical reliability, with additional thresholds of an absolute fold change > 1.5 and a p-value < 0.05.
2.4. GO and KEGG Enrichment Analysis
Functional enrichment of DEGs was investigated through Gene Ontology (GO) and Kyoto Encyclopedia of Genes and Genomes (KEGG) analyses using the DAVID database and the ClueGO (Version 3.10.2) plugin in Cytoscape (Version 3.10.2). Terms with a corrected p-value < 0.05 were considered statistically significant. GO enrichment results were visualized as bar graphs showing distributions across biological processes (BP), cellular components (CC), and molecular functions (MF).
2.5. Validation of DEGs by RT-qPCR
To validate the RNA-seq results, nine DEGs were randomly selected for confirmation by quantitative real-time PCR (qRT-PCR). Following cDNA synthesis from total RNA using the PrimeScript RT Reagent Kit (TaKaRa, Kusatsu, Japan), qRT-PCR assays were performed with SYBR Premix Ex Taq (TaKaRa, Japan) and gene-specific primers Gene expression was normalized to GAPDH (Supplementary Materials S1) as an internal control, and relative expression levels were calculated using the 2−ΔΔCt method. Data are presented as the mean ± SEM from five biological replicates, with each sample run in triplicate.
2.6. Statistical Analysis
All statistical analyses were performed using SPSS software (version 23.0; IBM Corp., Armonk, NY, USA). Continuous variables are presented as the mean ± SEM. Between-group differences were determined using Student’s t-test, with * p < 0.05 and ** p < 0.01 indicating two levels of statistical significance.
3. Results
3.1. RNA Sequencing Data Quality
Transcriptomic analysis was performed on hypothalamic, pituitary, and ovarian tissues from Manchurian zokors during estrus and anestrus. A total of 15 cDNA libraries representing all groups were constructed and sequenced on the Illumina NovaSeq™ 6000 platform. After quality control, each library yielded an average of over 41 million raw reads and 40 million clean reads, with overall data quality meeting established standards (Table 1). Based on (Version 2.16.0) similarity analysis, approximately 60.1% of the assembled unigenes were functionally annotated to known rodent genes. The annotated sequences showed the highest homology with those of the blind mole-rat (Nannospalax galili), Chinese hamster (Cricetulus griseus), mouse (Mus musculus), rat (Rattus norvegicus), and deer mouse (Peromyscus maniculatus) (Figure 1A).

Table 1.
Sample quality control statistics.
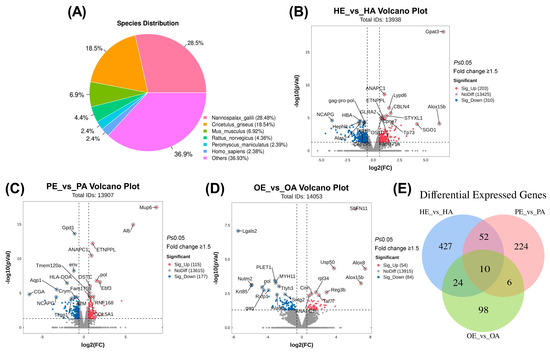
Figure 1.
Transcriptomic profiling of hypothalamic–pituitary–ovarian-axis tissues in the Manchurian zokor during estrus and anestrus. (A) Species distribution from BLASTX homology analysis of assembled unigenes. Nannospalax galili shows the highest homology, followed by Cricetulus griseus, Mus musculus, Rattus norvegicus, and Peromyscus maniculatus. (B) Volcano plot of differentially expressed genes in the hypothalamus (HE_vs_HA). (C) Volcano plot of differentially expressed genes in the pituitary (PE_vs_PA). (D) Volcano plot of differentially expressed genes in the ovary (OE_vs_OA). X-axis: log2 (fold change), y-axis: −log10 (p-value). Tags in red represent upregulated genes during estrus, and tags in green represent downregulated genes during estrus. (E) Venn diagram illustrating the overlap of differentially expressed genes among hypothalamus, pituitary, and ovarian tissues.
3.2. Differentially Expressed Gene Identification
To explore the molecular mechanisms regulating the HPO axis during the estrous cycle in Manchurian zokors, we compared gene expression profiles across three tissue-specific comparisons: HE vs. HA (hypothalamus), PE vs. PA (pituitary), and OE vs. OA (ovary). In the hypothalamus, 513 mRNAs were differentially expressed between estrus and anestrus, with 203 upregulated and 310 downregulated genes (Figure 1B, Supplementary Materials S2). The pituitary exhibited 292 DEGs (115 upregulated, 177 downregulated; Figure 1C, Supplementary Materials S3), while the ovary showed 138 DEGs (54 upregulated, 84 downregulated; Figure 1D, Supplementary Materials S4). Venn diagram analysis identified 10 DEGs common to all three tissues, with tissue-specific DEG counts of 427, 224, and 98 in the hypothalamus, pituitary, and ovary, respectively (Figure 1E).
3.3. GO Enrichment Analysis of DEGs in HPO-Axis Tissues
To functionally characterize the DEGs, they were annotated within the GO framework, encompassing BP, CC, and MF categories (Figure 2; Supplementary Materials S5). In the hypothalamus, significantly enriched BP terms included the oxidation–reduction process, G-protein-coupled receptor (GPCR) signaling pathway, and response to hypoxia. CC terms were primarily associated with the plasma membrane, extracellular matrix, and cell surface, whereas MF terms involved calcium ion binding and GPCR activity (Figure 2A).
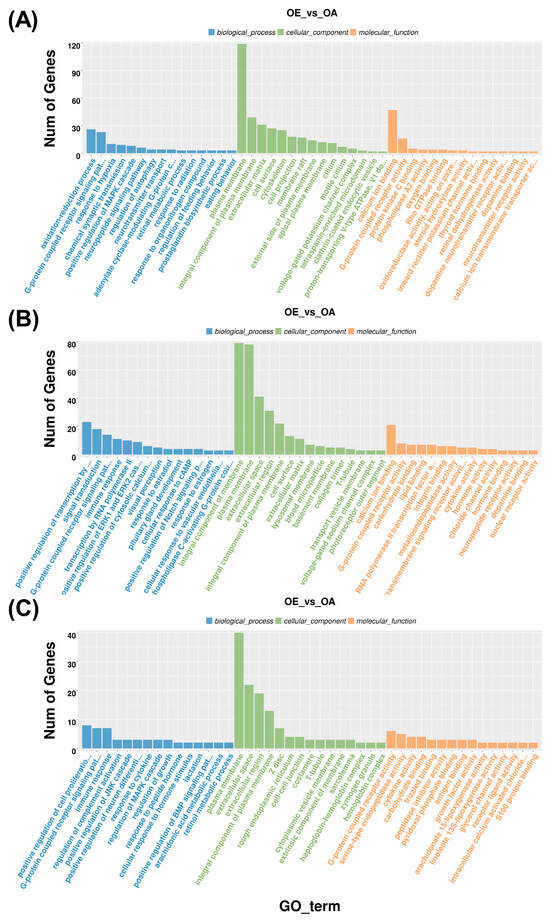
Figure 2.
Gene Ontology enrichment analysis of differentially expressed genes in HPO-axis tissues. (A) Enriched GO terms in the hypothalamus. (B) Enriched GO terms in the pituitary. (C) Enriched GO terms in the ovary. Blue represents biological processes, green represents cellular components, and orange represents molecular functions.
In the pituitary, enriched BP terms were mainly associated with the positive regulation of transcription by RNA polymerase II, signal transduction, and GPCR signaling. CC terms were related to the integral component of membrane, plasma membrane, and extracellular space, while MF enrichment highlighted calcium ion binding, GPCR activity, and carbohydrate binding (Figure 2B).
In the ovary, enriched BP terms included GPCR signaling, regulation of complement activation, and positive regulation of the JNK cascade. CC terms were related to the plasma membrane, extracellular space, and integral component of plasma membrane, while MF terms involved GPCR activity, serine-type endopeptidase activity, and cytokine activity (Figure 2C). Overall, GPCR signaling, plasma membrane localization, calcium ion binding, and GPCR activity were consistently represented across all three HPO-axis tissues.
3.4. KEGG Pathway Enrichment of DEGs
KEGG pathway enrichment analysis was performed to identify key signaling pathways involved in seasonal reproduction. In the hypothalamus, the neuroactive ligand–receptor interaction pathway contained the most DEGs, followed by the PI3K–Akt signaling, calcium signaling, and ovarian steroidogenesis pathways (Figure 3A). The pituitary also showed the highest DEG representation in neuroactive ligand–receptor interaction, with additional enrichment in cell adhesion molecules, cytokine–cytokine receptor interaction, and arachidonic acid metabolism (Figure 3B). In the ovary, the neuroactive ligand–receptor interaction and cytokine–cytokine receptor interaction pathways were most prominent, along with reproduction-related pathways such as ubiquinone and other terpenoid–quinone biosynthesis, fat digestion and absorption, and phenylalanine metabolism (Figure 3C). Notably, neuroactive ligand–receptor interaction was the only pathway commonly enriched across all three tissues.
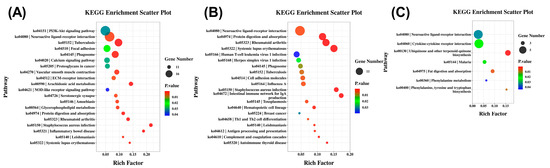
Figure 3.
KEGG pathway enrichment analysis of differentially expressed genes in HPO-axis tissues. (A) Significantly enriched KEGG pathways in the hypothalamus. (B) Significantly enriched KEGG pathways in the pituitary. (C) Significantly enriched KEGG pathways in the ovary. Dot size indicates the number of DEGs; color represents the p-value range.
3.5. Validation by RT-QPCR
To verify the RNA-seq results, nine DEGs from the HPO-axis tissues were randomly selected for RT-qPCR validation using GAPDH as an internal control. The expression patterns of these genes were consistent with the RNA-seq data (Figure 4), confirming the reliability of the transcriptomic findings for subsequent bioinformatic analyses.
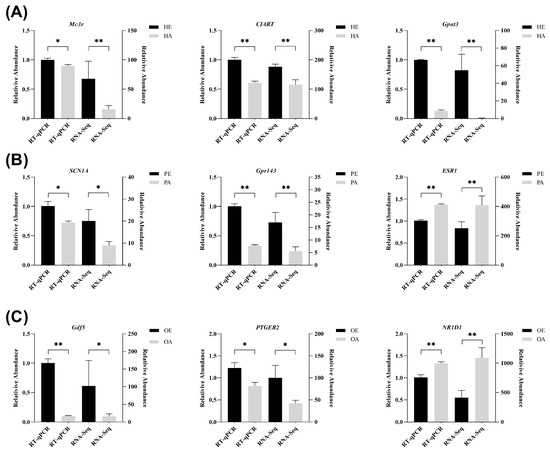
Figure 4.
Validation of RNA-seq results by RT-qPCR in HPO-axis tissues. (A) Comparison of gene expression levels between RNA-seq and qRT-PCR in the hypothalamus. (B) Comparison of gene expression levels between RNA-seq and qRT-PCR in the pituitary. (C) Comparison of gene expression levels between RNA-seq and qRT-PCR in the ovary. Significant differences (p-value < 0.05) are indicated by one asterisk (*), and highly significant differences (p-value < 0.01) are indicated by two asterisks (**).
4. Discussion
Reproductive function in vertebrates critically depends on the integrated operation of the hypothalamic–pituitary–ovarian (HPO) axis, which synchronizes the development of sexual organs and gametes [16,17]. Because reproductive processes such as folliculogenesis and ovulation are driven by gene expression changes in the hypothalamus, pituitary, and ovaries, RNA transcript profiling provides a powerful approach to elucidate the underlying regulatory mechanisms [18,19]. This study employed RNA-seq technology—widely used for gene discovery and expression analysis in mammalian tissues [20,21]—to identify estrus-related mRNAs across the HPO axis of female Manchurian zokors. Although the absence of a reference genome necessitated a de novo assembly approach, which can introduce issues such as transcript fragmentation and incomplete isoform recovery, these challenges were mitigated through a stringent bioinformatic strategy. This included optimized assembly with Trinity, rigorous multi-database annotation (E-value < 0.00001), and RT-qPCR validation of key findings, ensuring the robustness of our dataset [22,23]. This study aimed to establish a molecular basis for understanding how seasonal reproduction is regulated in subterranean rodents living under light-deprived conditions.
As the central hub for environmental signal transduction, differential gene expression in the hypothalamus elucidates how Manchurian zokors translate external environmental cues into reproductive responses. In this study, 513 DEGs were identified in the hypothalamus of female Manchurian zokors during estrus compared with anestrus, comprising 203 upregulated and 310 downregulated genes. GO and KEGG pathway enrichment analyses revealed that the hypothalamus, serving as the integrative center of reproductive rhythm, showed significant enrichment of DEGs in the GO terms neuropeptide signaling pathway (GO:0007218) and adenylate cyclase-modulating G-protein-coupled receptor signaling pathway (GO:0007187). In seasonally breeding sheep, the neuropeptide kisspeptin and its receptor GPR54 are core regulators that activate the mammalian reproductive axis by stimulating GnRH neuronal activity to control ovulation [24,25,26]. This suggests that the Manchurian zokor employs a similar neuroendocrine mechanism to initiate estrus.
The neuroactive ligand–receptor interaction pathway was the only KEGG pathway significantly enriched across all three HPO-axis tissues, highlighting its central role in mediating seasonal estrus in the Manchurian zokor. This pathway has been widely associated with reproductive regulation in vertebrates. Previous transcriptomic studies in ducks, chickens, and fish have demonstrated its involvement in modulating reproductive processes [27,28,29,30,31]. In swine, nutritional restriction has been shown to affect estrus via this pathway [32], while hypothalamic transcriptome analyses in goats have implicated it in sexual maturation [33]. Similarly, a study in Tan sheep reported co-enrichment of this pathway in pineal, hypothalamic, and pituitary tissues, further supporting its conserved function in seasonal reproduction among ruminants [5]. These findings align with our results, reinforcing the notion that the neuroactive ligand–receptor interaction pathway represents an evolutionarily conserved mechanism underlying reproductive timing across diverse seasonal breeders.
Notably, thyrotropin-releasing hormone (Trh) and its receptor (Trhr) were significantly upregulated during estrus. Trh, which plays multifaceted roles in integrating neuroendocrine, autonomic, and reproductive functions, is primarily expressed in the hypothalamic paraventricular nucleus (PVN). Together with its significantly enriched GO terms—response to glucose (GO:0009749) and thyrotropin-releasing hormone activity (GO:0008437)—Trh may translate rising temperature cues into accelerated metabolic signals during spring by elevating the thyroid hormone metabolic rate, thereby promoting estrus initiation. Furthermore, as a stimulator of prolactin synthesis, Trh may also sustain luteal function via the prolactin pathway or promote ovulation by modulating dopaminergic neuron activity to disinhibit GnRH neurons [34,35,36].
Conversely, the leptin receptor gene (Lepr) was significantly downregulated during estrus. Because leptin acts on the hypothalamus to suppress appetite and increase energy expenditure [37], and murine studies show that cold exposure suppresses NPY-5R and activates NPY via upregulation of serum leptin and hypothalamic Lepr—thereby downregulating GnRH expression, impairing HPO-axis function, and reducing ovarian reserves [38]—the observed downregulation of Lepr may promote estrus by disinhibiting the NPY–GnRH axis. Melanocortin receptor 3 (Mc3r) is highly enriched in hypothalamic KNDy neurons in mice [39]. These neurons serve as key hubs regulating GnRH pulse release and, consequently, gonadotropin secretion and the estrous cycle [40]. Studies have reported delayed estrus onset in Mc3r knockout mice. Fasting experiments further confirm that Mc3r mediates nutrient-deficiency signals that prolong the estrous cycle, linking energy status to reproduction via leptin signaling [39]. The upregulation of Mc3r during estrus in late spring—a period of relatively abundant but not yet peak food availability—may reflect that, although resources improve at estrus onset, substantial vegetation has not yet formed and underground food stores are depleted, leaving Manchurian zokors in relative food scarcity.
Phosphoenolpyruvate carboxykinase 1 (Pck1), a rate-limiting enzyme in gluconeogenesis [41], was downregulated during estrus. This downregulation may help prevent hypoglycemia-induced reproductive suppression by reducing the activity of hypothalamic glucose-sensing neurons [42,43]. Pyroglutamylated arginine-phenylalanine-amide peptide receptor (Qrfpr), the ligand-binding site of the G-protein-coupled receptor GPR103, plays a central role in regulating energy balance and neuroendocrine activity. The QRFP/QRFPR system significantly promotes feeding, activity, and metabolic rate by activating hypothalamic neurons [44,45]. Because hypothalamic Qrfp expression increases during fasting [46], the significant upregulation of Qrfpr during estrus suggests that Manchurian zokors integrate energy-status information into estrus-initiation signaling through this receptor.
This study identified 292 DEGs in the pituitary gland of Manchurian zokors, including 115 upregulated and 177 downregulated genes during estrus. Genes associated with pituitary development and reproductive hormone synthesis exhibited significantly higher expression during this phase. Among the upregulated genes, Pitx2—a key effector of the Wnt/β-catenin signaling pathway in pituitary development—drives pituitary precursor cell proliferation to establish normal structure and regulates gonadotropin (e.g., LH, FSH) synthesis in the adult mouse pituitary [47,48]. The increased expression of Pitx2 during estrus may therefore promote gonadotropin release by enhancing gonadotrope cell activity.
Similarly, NR4A2—a critical response factor for hypothalamic–pituitary axis activation that is primarily expressed in gonadotropes and induced by GnRH/TRH signaling [49]—was significantly upregulated, suggesting its involvement in regulating gonadotropin synthesis and secretion during estrus. The anterior pituitary differentiation gene LHX1 was also significantly upregulated during this phase. Given the crucial functions of its homologous genes LHX3 and LHX4—whose deficiency leads to pituitary developmental disorders and impaired gonadotroph formation—LHX1 may play a similar role during the estrous phase of the Manchurian zokors. LHX3 can directly bind to the LHβ/FSHβ promoter to activate transcription, synergize with BMP2 signaling to induce GATA2 expression, and thereby regulate gonadotropin synthesis [50,51].
Among the downregulated genes during estrus in the pituitary gland, the reduced expression of the core estrogen receptor ESR1 may promote pulsatile gonadotropin release by attenuating estrogen’s negative feedback [52]. Similarly, the reduced expression of SIX3 and SIX6 [53]—regulators of pituitary morphogenesis and inhibitors of the Wnt/β-catenin pathway—may relieve inhibition of the pathway, thereby contributing to estrus initiation. Notably, the Npy2r gene, which encodes the neuropeptide Y (NPY) Y2 receptor, was also downregulated. This receptor primarily regulates feeding, energy metabolism, and body-weight control; knockout mice exhibit hyperphagia and excessive weight gain [54,55]. These results underscore the importance of energy-metabolism regulation in the estrous process of Manchurian zokors, consistent with the overall pituitary DEG pattern.
At the ovarian level, 138 DEGs were identified, with 54 upregulated and 84 downregulated during estrus. Among the upregulated genes, prostaglandin E2 receptor subtype 2 (PTGER2) showed significantly higher expression. This gene enhances fertilization rates by promoting cumulus expansion during mammalian ovulation; mouse models show that its absence leads to impaired cumulus expansion and a 50% reduction in fertilization rates without affecting uterine receptivity [56,57]. This suggests that PTGER2 may similarly regulate ovulation in Manchurian zokors.
The sphingosine kinase gene Sphk1 was also significantly upregulated during estrus in the ovary. Its product, sphingosine-1-phosphate (S1P), is essential for oocyte maturation. LH signaling activates the Sphk1–S1P axis, triggering calcium oscillations and the PI3K/Akt pathway, thereby enhancing oocyte developmental potential [58]. This indicates a potentially positive role for Sphk1 in oocyte maturation during estrus in Manchurian zokors.
Notably, the cytokine-signaling inhibitors Socs2 and Cish were both upregulated during estrus in the ovary. Socs2 negatively regulates the GH–JAK2–STAT5b pathway by binding phosphorylated tyrosine residues on the growth hormone receptor (GHR), thereby inhibiting somatic growth [59]. Their upregulation during estrus contrasts with the expectation that the breeding period is typically associated with enhanced metabolism. Combined with DEG patterns in the hypothalamus and pituitary that support estrus onset under low-energy conditions, this suggests that Manchurian zokors may prioritize reproductive processes over somatic growth, adopting a “reproduction-priority” energy allocation strategy.
Among the downregulated genes, the nuclear receptor NR1D1 (Rev-erbα)—a core clock component that inhibits target gene transcription by binding RORE elements—has been shown to negatively regulate estrogen synthesis in porcine ovarian granulosa cells [60]. Its downregulation during estrus may relieve inhibition of estrogen synthesis, providing the hormonal environment necessary for reproductive activity.
Interestingly, despite inhabiting perpetual darkness and possessing a highly degenerate visual system [61], this study detected significant differential expression of several light-responsive genes in the hypothalamic and pituitary transcriptomes of Manchurian zokors. For example, the circadian-associated transcriptional repressor (Ciart) was significantly upregulated during estrus. As a core clock repressor directly influenced by light [62], Ciart regulates circadian rhythmic output by inhibiting the CLOCK/BMAL1 complex [63].
In the hypothalamus, DEGs were significantly enriched in light-related GO terms such as response to radiation (GO:0009314) and retinal metabolic process (GO:0042574), while in the pituitary, they were enriched in visual perception (GO:0007601) and detection of light stimulus involved in visual perception (GO:0050908). These categories include genes such as COL2A1, Col11a1, DLL4, EFEMP1, and Tulp1.
Significant upregulation was also observed for NPAS1, whose homolog NPAS2 is a core regulator of mammalian light response and circadian rhythm [64,65,66]; for the light-gated ion channel gene SCN1A [67,68]; and for the retinal development-associated gene GPR143 [69]. These results suggest that although the Manchurian zokor is a strictly subterranean rodent, faint light signals received during brief surface exposure or movement in shallow tunnels may still influence hypothalamic and pituitary function via the SCN. This finding aligns with evidence that the SCN of the Gansu zokor (Myospalax cansus) retains photoperiodic perception [61] and that the degenerate eyes of blind subterranean mole-rats (Spalax) still express the circadian clock genes Clock and MOP3 (Bmal1), indicating residual photic signal perception [70]. Such patterns are consistent with observations in Gansu zokors and blind subterranean mole-rats but contrast with findings in African mole-rats (Bathyergidae), which have lost selective pressure on UV damage repair genes due to prolonged subterranean life [71]. While seasonal breeders typically rely on photoperiod to time reproduction, subterranean rodents may have adapted by weakening photoperiodic dependence and strengthening endogenous rhythmicity. This hypothesis is supported by comparative analyses of circadian gene expression between the aboveground Lasiopodomys brandtii (L. brandtii) and the subterranean Lasiopodomys mandarinus (L. mandarinus) [72]. The potential role of faint light signals in this regulatory system, though intriguing, remains speculative and requires further validation.
5. Conclusions
In this study, RNA-seq was used to identify genes and signaling pathways involved in regulating seasonal reproduction across the HPO axis of the Manchurian zokor. The neuroactive ligand–receptor interaction pathway was significantly enriched in all three HPO-axis tissues, indicating its central role in mediating seasonal estrus. Key candidate genes were identified in each tissue—Trh and Mc3r in the hypothalamus, Pitx2 and NR4A2 in the pituitary, and PTGER2 and Sphk1 in the ovary—all closely associated with seasonal reproductive regulation in this subterranean rodent. These findings improve understanding of the molecular regulation mechanisms underlying seasonal reproduction in fossorial mammals and provide a valuable resource for future research on reproductive adaptation in subterranean species. Although core genes and key signaling pathways regulating seasonal reproduction across the HPO axis were identified, the specific molecular mechanisms by which they coordinate estrus initiation in the absence of light cues remain unclear. Functional and mechanistic analyses of these candidate genes and pathways will therefore be essential in future investigations.
Supplementary Materials
The following supporting information can be downloaded at: https://www.mdpi.com/article/10.3390/genes16111289/s1, Supplementary Materials S1: real-time fluorescence quantification primer sequence. Supplementary Materials S2: HE_vs_HA_Differentially Expressed Genes. Supplementary Materials S3: PE_vs_PA_Differentially Expressed Genes. Supplementary Materials S4: OE_vs_OA_Differentially Expressed Genes. Supplementary Materials S5: GO entries for differentially expressed genes. Supplementary Materials S6: KEGG pathway entries for differentially expressed genes.
Author Contributions
R.N., X.L. and D.S. made substantial contributions to the conception and design of the experiments. D.M., F.W. and Y.X. also contributed to experimental design. R.N., X.L., Y.L. and S.B. performed the experiments. R.N., D.M.,Y.Z. and Y.X. carried out data analysis. R.N., D.M. and S.B. wrote the manuscript. B.H. and X.L. critically revised the manuscript. All authors have read and agreed to the published version of the manuscript.
Funding
This work was supported by the Doctoral Fund Project of Hulunbuir College (grant numbers 2020BS12 and 2023BSJJ08), the Hulunbuir College General Natural Science Project (grant number 2020ZKYB14), and the Task Book of the Special Project for Basic Research Business Expenses of Hebei Normal University of Science and Technology (grant number 2023JK06).
Institutional Review Board Statement
This study was conducted in accordance with the Regulations for the Administration of Affairs Concerning Experimental Animals (Ministry of Science and Technology, China; revised March 2017) and approved by the Animal Ethical and Welfare Committee (AEWC) of Hulunbuir University (permit no. 20240006; 15 March 2024).
Informed Consent Statement
Not applicable.
Data Availability Statement
The original contributions presented in this study are included in the article/Supplementary Material. Further inquiries can be directed to the corresponding authors.
Acknowledgments
We thank all the authors of this paper for their hard work. We would also like to thank the reviewers for their insightful comments on this paper.
Conflicts of Interest
The authors declare that they have no competing interests.
Abbreviations
| BP | biological processes |
| CC | cellular components |
| Ciart | circadian-associated transcriptional repressor |
| DEGs | differentially expressed genes |
| FSH | follicle-stimulating hormone |
| GO | Gene Ontology |
| GnRH | gonadotropin-releasing hormone |
| GPCR | G-protein-coupled receptor |
| GHR | growth hormone receptor |
| HPO | hypothalamic–pituitary–ovarian |
| KEGG | Kyoto Encyclopedia of Genes and Genomes |
| LH | luteinizing hormone |
| Mc3r | Melanocortin receptor 3 |
| MF | molecular functions |
| NPY | neuropeptide Y |
| PVN | paraventricular nucleus |
| Pck1 | Phosphoenolpyruvate carboxykinase 1 |
| PTGER2 | prostaglandin E2 receptor subtype 2 |
| Qrfpr | Pyroglutamylated arginine-phenylalanine-amide peptide receptor |
| qRT-PCR | quantitative real-time PCR |
| S1P | sphingosine-1-phosphate |
| Trh | thyrotropin-releasing hormone |
References
- Baohui, Y.; Kang, A.; Yukun, K.; Yuchen, T.; Degang, Z.; Junhu, S. Reproductive Suppression Caused by Spermatogenic Arrest: Transcriptomic Evidence from a Non-Social Animal. Int. J. Mol. Sci. 2023, 24, 4611. [Google Scholar] [CrossRef]
- Wayne, N.L.; Malpaux, B.; Karsch, F.J. Social cues can play a role in timing onset of the breeding season of the ewe. Reprod. Fertil. 1989, 87, 707–713. [Google Scholar] [CrossRef][Green Version]
- Allan, E.H. Control of puberty onset and fertility by gonadotropin-releasing hormone neurons. Nat. Rev. Endocrinol. 2016, 12, 452–466. [Google Scholar] [CrossRef] [PubMed]
- Sasha, M.; Advaita, P.-P.; Larisa, G.-J. Hypothalamic-Pituitary-Ovarian Axis Disorders Impacting Female Fertility. Biomedicines 2019, 7, 5. [Google Scholar]
- Wei, S.; Kang, X.; Yang, C.; Wang, F.; Dai, T.; Guo, X.; Ma, Z.; Li, C.; Zhao, H.; Dan, X. Analysis of reproduction-related transcriptomes on pineal-hypothalamic-pituitary-ovarian tissues during estrus and anestrus in Tan sheep. Front. Vet. Sci. 2022, 9, 1068882. [Google Scholar] [CrossRef]
- Nimmi, W.; Robert, H.; Craig, A.; Tracy, B. The roles of GnRH in the human central nervous system. Horm. Behav. 2022, 145, 105230. [Google Scholar] [CrossRef]
- Ren, Q.L.; Zhang, J.Q.; Lu, D.F.; Wang, J.; Chen, J.; Ma, Q.; Bai, X.X.; Guo, H.X.; Gao, B.W.; Xing, B.S. Comparison and analysis of lincRNAs expression profile in the hypothalamic-pituitary-ovarian axis of anestrous and estrous primiparous sows. Hereditas 2020, 42, 15. [Google Scholar]
- De Miera, C.S.; Monecke, S.; Bartzen-Sprauer, J.; Laran-Chich, M.P.; Pévet, P.; Hazlerigg, D.G.; Simonneaux, V. A circannual clock drives expression of genes central for seasonal reproduction. Curr. Biol. 2014, 24, 1500–1506. [Google Scholar] [CrossRef] [PubMed]
- Jaiswal, S.; Nandi, S.; Iquebal, M.A.; Jasrotia, R.S.; Patra, S.; Mishra, G.; Udit, U.K.; Sahu, D.K.; Angadi, U.B.; Meher, P.K.; et al. Revelation of candidate genes and molecular mechanism of reproductive seasonality in female rohu (Labeo rohita Ham.) by RNA sequencing. BMC Genom. 2021, 22, 685. [Google Scholar] [CrossRef]
- Yao, W.; Wang, D.H.; Zhang, Y.Z. Research advances in endogenous annual clock and photosensitive neural circuitry regulating seasonal breeding in mammals. Chin. J. Zool. 2017, 52, 717–725. [Google Scholar]
- Kang, A.; Baohui, Y.; Yukun, K.; Mingfang, B.; Yuchen, T.; Qiangsheng, P.; Junhu, S. Seasonal Expression of Gonadotropin Genes in the Pituitary and Testes of Male Plateau Zokor (Eospalax baileyi). Animals 2022, 12, 275. [Google Scholar] [CrossRef]
- Li, Y.W.; Lu, J.Q.; Wang, Z.L. Complete mitochondrial genome of Manchurian Zokor (Myospalax psilurus). Mitochondrial DNA A DNA Mapp. Seq. Anal. 2015, 27, 1461–1462. [Google Scholar] [CrossRef]
- Fu, H.P.; Yuan, S.; Man, D.H.; Chai, X.X.; Yang, S.W.; Bao, D.H.; Wu, X.D. The burrow behavior and influenced factors of a prairie subterranean zokor (Myospalax psilurus). Ecol. Evol. 2019, 8, 12773–12779. [Google Scholar] [CrossRef]
- Man, D.H.; Yuan, S.; Yang, S.W.; Ji, Y.; Chao, K.T.; Wei, J.; Fu, H.P.; Wu, X.D. Activity intensity of Manchurian zokor and its relationship with soil temperature and humidity. Acta Theriol. Sin. 2021, 41, 441–450. [Google Scholar]
- Zhong, Y.; Di, R.; Yang, Y.; Liu, Q.; Chu, M. Transcriptome Analysis of Neuroendocrine Regulation of Ovine Hypothalamus-Pituitary-Ovary Axis during Ovine Anestrus and the Breeding Season. Genes 2021, 12, 1861. [Google Scholar] [CrossRef] [PubMed]
- Xie, T.; Ye, W.; Liu, J.; Zhou, L.; Song, Y. The Emerging Key Role of Klotho in the Hypothalamus-Pituitary-Ovarian Axis. Reprod. Sci. 2020, 28, 322–331. [Google Scholar] [CrossRef] [PubMed]
- Prunier, A.; Quesnel, H. Nutritional influences on the hormonal control of reproduction in female pigs. Livest. Prod. Sci. 2000, 63, 1–16. [Google Scholar] [CrossRef]
- Yuan, X.L.; Zhang, Z.; Li, B.; Gao, N.; Zhang, H.; Sangild, P.T.; Li, J.Q. Genome-wide DNA methylation analysis of the porcine hypothalamus-pituitary-ovary axis. Sci. Rep. 2017, 7, 4277. [Google Scholar] [CrossRef]
- Rory, S.; Marta, G.; James, H. RNA sequencing: The teenage years. Nat. Rev. Genet. 2019, 20, 631–656. [Google Scholar] [CrossRef]
- Hrdlickova, R.; Toloue, M.; Tian, B. RNA-Seq methods for transcriptome analysis. Wiley Interdiscip. Rev. RNA 2017, 8, e1364. [Google Scholar] [CrossRef]
- Wang, W.M.; Hu, T.X.; Li, F.D.; Ma, Y.J.; Fan, H.Y.; Pan, X.Y. Genome-wide transcriptome profiling in ovaries of small-tail Han sheep during the follicular and luteal phases of the oestrous cycle. Anim. Reprod. Sci. 2018, 197, 212–221. [Google Scholar] [CrossRef] [PubMed]
- Grabherr, M.G.; Haas, B.J.; Yassour, M.; Levin, J.Z.; Thompson, D.A.; Amit, I.; Adiconis, X.; Fan, L.; Raychowdhury, R.; Zeng, Q.; et al. Full-length transcriptome assembly from RNA-Seq data without a reference genome. Nat. Biotechnol. 2011, 29, 644–652. [Google Scholar] [CrossRef]
- Ungaro, A.; Pech, N.; Martin, J.F.; McCairns, R.S.; Mévy, J.P.; Gilles, A. Challenges and advances for transcriptome assembly in non-model species. PLoS ONE 2017, 12, e0185020. [Google Scholar] [CrossRef] [PubMed]
- Ullah, Y.; Li, C.; Li, X.; Ni, W.; Yao, R.; Xu, Y.; Quan, R.; Li, H.; Zhang, M.; Liu, L.; et al. Identification and Profiling of Pituitary microRNAs of Sheep during Anestrus and Estrus Stages. Animals 2020, 10, 402. [Google Scholar] [CrossRef] [PubMed]
- Goodman, R.L.; He, W.; Lopez, J.A.; Bedenbaugh, M.N.; McCosh, R.B.; Bowdridge, E.C.; Coolen, L.M.; Lehman, M.N.; Hileman, S.M. Evidence That the LH Surge in Ewes Involves Both Neurokinin B-Dependent and -Independent Actions of Kisspeptin. Endocrinology 2019, 160, 2990–3000. [Google Scholar] [CrossRef]
- Lavalle, S.N.; Chou, T.; Hernandez, J.; Naing, N.C.P.; Tonsfeldt, K.J.; Hoffmann, H.M.; Mellon, P.L. Kiss1 is differentially regulated in male and female mice by the homeodomain transcription factor VAX1. Mol. Cell. Endocrinol. 2021, 534, 111358. [Google Scholar] [CrossRef]
- Tao, Z.; Song, W.; Zhu, C.; Xu, W.; Liu, H.; Zhang, S.; Huifang, L. Comparative transcriptomic analysis of high and low egg-producing duck ovaries. Poult. Sci. 2017, 96, 4378–4388. [Google Scholar] [CrossRef]
- Yan, X.; Liu, H.; Hu, J.; Han, X.; Qi, J.; Ouyang, Q.; Hu, B.; He, H.; Li, L.; Wang, J.; et al. Transcriptomic analyses of the HPG axis-related tissues reveals potential candidate genes and regulatory pathways associated with egg production in ducks. BMC Genom. 2022, 23, 281. [Google Scholar] [CrossRef]
- Zhang, T.; Chen, L.; Han, K.; Zhang, X.; Zhang, G.; Dai, G.; Wang, J.; Xie, K. Transcriptome analysis of ovary in relatively greater and lesser egg producing Jinghai Yellow Chicken. Anim. Reprod. Sci. 2019, 208, 106114. [Google Scholar] [CrossRef]
- Chen, H.; Feng, W.; Chen, K.; Qiu, X.; Xu, H.; Mao, G.; Zhao, T.; Ding, Y.; Wu, X. Transcriptomic analysis reveals potential mechanisms of toxicity in a combined exposure to dibutyl phthalate and diisobutyl phthalate in zebrafish (Danio rerio) ovary. Aquat. Toxicol. 2019, 216, 105290. [Google Scholar] [CrossRef]
- Yong, Y.J.; Mei, L.C.; Wen, P.J.; Shi, L.L.; Shun, C.; Jian, B.Z.; Zhi, M.G. Identification of reproduction-related genes and pathways in the Culter alburnus H-P-G axis and characterization of their expression differences in malformed and normal gynogenetic ovaries. Fish Physiol. Biochem. 2020, 47, 1–20. [Google Scholar]
- Xu, S.; Wang, D.; Zhou, D.; Lin, Y.; Che, L.; Fang, Z.; Wu, D. Reproductive Hormone and Transcriptomic Responses of Pituitary Tissue in Anestrus Gilts Induced by Nutrient Restriction. PLoS ONE 2015, 10, e0143219. [Google Scholar] [CrossRef]
- Su, F.; Guo, X.; Wang, Y.; Wang, Y.; Cao, G.; Jiang, Y. Genome-Wide Analysis on the Landscape of Transcriptomes and Their Relationship With DNA Methylomes in the Hypothalamus Reveals Genes Related to Sexual Precocity in Jining Gray Goats. Front. Endocrinol. 2018, 9, 501. [Google Scholar] [CrossRef]
- Yamada, M.; Shibusawa, N.; Ishii, S.; Horiguchi, K.; Umezawa, R.; Hashimoto, K.; Monden, T.; Satoh, T.; Hirato, J.; Mori, M. Prolactin secretion in mice with thyrotropin-releasing hormone deficiency. Endocrinology 2006, 147, 2591–2596. [Google Scholar] [CrossRef]
- Zhao, G.K.; Zheng, Y.; Guo, H.X.; Wang, H.Q.; Ji, Z.H.; Wang, T.; Yu, S.; Zhang, J.B.; Yuan, B.; Ren, W.Z. TRH Regulates the Synthesis and Secretion of Prolactin in Rats with Adenohypophysis through the Differential Expression of miR-126a-5p. Int. J. Mol. Sci. 2022, 23, 15914. [Google Scholar] [CrossRef]
- Omprakash, S.; Devraj, S.; Saptarsi, M.; Anal, K.; Ronald, M.L.; Praful, S.S. TRH and NPY Interact to Regulate Dynamic Changes in Energy Balance in the Male Zebra Finch. Endocrinology 2022, 164, bqac195. [Google Scholar] [CrossRef]
- Baver, S.B.; Hope, K.; Guyot, S.; Bjørbaek, C.; Kaczorowski, C.; O’Connell, K.M. Leptin modulates the intrinsic excitability of AgRP/NPY neurons in the arcuate nucleus of the hypothalamus. Neuroscience 2014, 34, 5486–5496. [Google Scholar] [CrossRef]
- Wu, S.; Zhang, G.; Wei, W.; Zhang, Y.; Li, X.; Yang, D. Mechanism of Leptin on Impaired Ovarian Reserve Function After Cold Exposure in Female Rats. Res. Sq. 2021. [Google Scholar] [CrossRef]
- Lam, B.Y.H.; Williamson, A.; Finer, S.; Day, F.R.; Tadross, J.A.; Gonçalves Soares, A.; Wade, K.; Sweeney, P.; Bedenbaugh, M.N.; Porter, D.T.; et al. MC3R links nutritional state to childhood growth and the timing of puberty. Nature 2021, 599, 436–441. [Google Scholar] [CrossRef] [PubMed]
- Rajae, T.; Victor, M.N. Novel insights into the metabolic action of Kiss1 neurons. Endocr. Connect. 2020, 9, R124–R133. [Google Scholar] [CrossRef] [PubMed]
- Yufu, T.; Yibing, Z.; Chunhui, W.; Zhongyi, S.; Longfei, L.; Shuqun, C.; Wenping, Z. Overexpression of PCK1 Gene Antagonizes Hepatocellular Carcinoma Through the Activation of Gluconeogenesis and Suppression of Glycolysis Pathways Cell Physiol Biochem. Int. J. Exp. Cell. Physiol. Biochem. Pharmacol. 2018, 47, 344–355. [Google Scholar]
- McCosh, R.B.; Kreisman, M.J.; Tian, K.; Ho, B.S.; Thackray, V.G.; Breen, K.M. Insulin-induced hypoglycaemia suppresses pulsatile luteinising hormone secretion and arcuate Kiss1 cell activation in female mice. J. Neuroendocrinol. 2019, 31, e12813. [Google Scholar] [CrossRef]
- Takeshi, I.; Toshiya, M.; Kiyohito, Y.; Yiliyasi, M.; Rie, Y.; Yuri, Y.; Akira, K.; Minoru, I. Effects of Low Energy Availability on Reproductive Functions Their Underlying Neuroendocrine Mechanisms. J. Clin. Med. 2018, 7, 166. [Google Scholar] [CrossRef]
- Takayasu, S.; Sakurai, T.; Iwasaki, S.; Teranishi, H.; Yamanaka, A.; Williams, S.C.; Iguchi, H.; Kawasawa, Y.I.; Ikeda, Y.; Sakakibara, I.; et al. A neuropeptide ligand of the G protein-coupled receptor GPR103 regulates feeding, behavioral arousal, and blood pressure in mice. Proc. Natl. Acad. Sci. USA 2006, 103, 7438–7443. [Google Scholar] [CrossRef]
- Ryuichi, M.; Hideki, S.; Tatsuya, U.; Makoto, I.; Yuki, T.; Masao, M.; Akane, I.; Akio, K.; Hisashi, I. RFamide peptide QRFP43 causes obesity with hyperphagia and reduced thermogenesis in mice. Endocrinology 2006, 147, 2916–2922. [Google Scholar] [CrossRef] [PubMed]
- Raphaëlle, Q.; Safia, A.; Frédéric, B.; Khadija, E.; Brigitte, I.; Frédéric, S. RF-amide neuropeptides and their receptors in Mammals: Pharmacological properties, drug development and main physiological functions. Pharmacol. Ther. 2016, 160, 84–132. [Google Scholar] [CrossRef]
- Tamara, G.; Peter, W.; Alexandra, K.; Walter, B. Deciphering the function of canonical Wnt signals in development and disease: Conditional loss- and gain-of-function mutations of beta-catenin in mice. Genes Dev. 2008, 22, 2308–2341. [Google Scholar]
- Michael, A.C.; Hoonkyo, S.; Tord, A.H.; Jacques, D.; Sally, A.C.; Philip, J.G. PITX genes are required for cell survival and Lhx3 activation. Mol. Endocrinol. 2005, 19, 1893–1903. [Google Scholar] [CrossRef]
- Ryota, T.; Daiki, N.; Masato, I.; Keisuke, M.; Titaree, L.; Shiro, K.; Mitsumori, K. Parallel expression patterns of NR4A nuclear receptor family genes in the pituitary gland of proestrus rats. Reprod. Dev. 2024, 70, 115–122. [Google Scholar]
- Khushnooda, R.; Bassam, B.-A.; Lolwa, A.-J.; Rabab, A.; Mohammed, A.-O.; Faiqa, I. Two novel LHX3 mutations in patients with combined pituitary hormone deficiency including cervical rigidity and sensorineural hearing loss. BMC Endocr. Disord. 2017, 17, 17. [Google Scholar] [CrossRef]
- Rachel, D.M.; Stephanie, C.C.; Chad, S.H.; Jesse, J.S.; Emily, C.W.; Amrit, P.S.B.; Svetlana, T.; Johannes, W.; Roland, W.P.; Simon, J.R. Roles of the LHX3 and LHX4 LIM-homeodomain factors in pituitary development. Mol. Cell. Endocrinol. 2007, 264, 190–195. [Google Scholar] [CrossRef]
- McQuillan, H.J.; Clarkson, J.; Kauff, A.; Han, S.Y.; Yip, S.H.; Cheong, I.; Porteous, R.; Heather, A.K.; Herbison, A.E. Definition of the estrogen negative feedback pathway controlling the GnRH pulse generator in female mice. Nat. Commun. 2022, 13, 7433. [Google Scholar] [CrossRef]
- Karine, R. Genetic regulation of murine pituitary development. Mol. Endocrinol. 2015, 54, R55–R73. [Google Scholar]
- Yoshihiro, O.; Taro, C.; Satoyo, Y.; Shoichi, I.; Toshinori, T.; Takahisa, F. Identification of GProtein-Coupled Receptors (GPCRs) in Primary Cilia Their Possible Involvement in Body Weight Control. PLoS ONE 2015, 10, e0128422. [Google Scholar]
- Xi, Q.; Pauer, G.J.; Ball, S.L.; Rayborn, M.; Hollyfield, J.G.; Peachey, N.S.; Crabb, J.W.; Hagstrom, S.A. Interaction between the photoreceptor-specific tubby-like protein 1 and the neuronal-specific GTPase dynamin-1. Investig. Ophthalmol. Vis. Sci. 2007, 48, 2837–2844. [Google Scholar] [CrossRef]
- Dong, J.; Fu, Y. Research advances in the role molecular mechanisms of Prostaglandin E2 during ovulation. Chin. J. Clin. Med. 2020, 27, 515–519. [Google Scholar]
- Hizaki, H.; Segi, E.; Sugimoto, Y.; Hirose, M.; Saji, T.; Ushikubi, F.; Matsuoka, T.; Noda, Y.; Tanaka, T.; Yoshida, N.; et al. Abortive expansion of the cumulus and impaired fertility in mice lacking the prostaglandin E receptor subtype EP(2). Proc. Natl. Acad. Sci. USA 1999, 96, 10501–10506. [Google Scholar] [CrossRef] [PubMed]
- Yuan, F.; Hao, X.; Cui, Y.; Huang, F.; Zhang, X.; Sun, Y.; Hao, T.; Wang, Z.; Xia, W.; Su, Y.; et al. SphK-produced S1P in somatic cells is indispensable for LH-EGFR signaling-induced mouse oocyte maturation. Cell Death Dis. 2022, 13, 963. [Google Scholar] [CrossRef] [PubMed]
- Christopher, J.G.; Elizabeth, R.-B.; Mattias, L.; Anne, L.T.; Phillip, O.M.; Tracy, A.W.; Panagiota, Z.; Donald, M.; Ian, S.; Nicos, A.N.; et al. SOCS2 negatively regulates growth hormone action in vitro and in vivo. Clin. Investig. 2005, 115, 397–406. [Google Scholar]
- Li, J. Molecular Mechanism of NR1D1 in Regulating Estrogen Synthesis in Porcine Ovarian Granulosa Cells. Master’s Thesis, Northwest A&F University, Xianyang, China, 2020. [Google Scholar]
- Du, Y. Photoreception in the Visual System of Gansu Zokor (Eospalax cansus). Master’s Thesis, Shaanxi Normal University, Xi’an, China, 2005. [Google Scholar]
- Nikkola, V.; Miettinen, M.E.; Karisola, P.; Grönroos, M.; Ylianttila, L.; Alenius, H.; Snellman, E.; Partonen, T. Ultraviolet B radiation modifies circadian time in epidermal skin and in subcutaneous adipose tissue. Photodermatol. Photoimmunol. Photomed. 2018, 35, 157–163. [Google Scholar] [CrossRef]
- Burns, J.N.; Jenkins, A.K.; Xue, X.; Petersen, K.A.; Ketchesin, K.D.; Perez, M.S.; Vadnie, C.A.; Scott, M.R.; Seney, M.L.; Tseng, G.C.; et al. Comparative transcriptomic rhythms in the mouse and human prefrontal cortex. Front. Neurosci. 2025, 18, 1524615. [Google Scholar] [CrossRef]
- Chu, L.W.; Till, C.; Yang, B.; Tangen, C.M.; Goodman, P.J.; Yu, K.; Zhu, Y.; Han, S.; Hoque, A.M.; Ambrosone, C.; et al. Circadian genes and risk of prostate cancer in the prostate cancer prevention trial. Mol. Carcinog. 2018, 57, 462–466. [Google Scholar] [CrossRef] [PubMed]
- Erica, F.S.; Christine, B.; Niels, J.D.; Bart, K.; Jakob, C.M. Genetic Correlates of Individual Differences in Sleep Behavior of Free-Living Great Tits (Parus major). G3 2016, 6, 599–607. [Google Scholar]
- Peng, L.U.; Bai, G.; Pang, Y. PJABBS: Roles of NPAS2 in circadian rhythm and disease. Acta Biochim. Biophys. Sin. 2021, 53, 1257–1265. [Google Scholar] [CrossRef]
- Sung, H.; Frank, H.Y.; Michael, D.S.; Jonathan, D.L.; Martha, M.B.; James, B.H.; William, A.C.; Horacio, O. dlI: Na(V)1.1 channels are critical for intercellular communication in the suprachiasmatic nucleus and for normal circadian rhythms. Proc. Natl. Acad. Sci. USA 2012, 109, E368–E377. [Google Scholar]
- Christopher, S.C. Linking neural activity and molecular oscillations in the SCN. Nat. Rev. Neurosci. 2011, 12, 553–569. [Google Scholar] [CrossRef]
- Beatriz, B.; Prashiela, M.; Anke, C.S. The Many Faces of G Protein-Coupled Receptor 143, an Atypical Intracellular Receptor. Front. Mol. Biosci. 2022, 9, 873777. [Google Scholar] [CrossRef]
- Avivi, A.; Albrecht, U.; Oster, H.; Joel, A.; Beiles, A.; Nevo, E. Biological clock in total darkness: The Clock/MOP3 circadian system of the blind subterranean mole rat. Proc. Natl. Acad. Sci. USA 2001, 98, 13751–13756. [Google Scholar] [CrossRef]
- Kalina, T.J.D.; Nigel, C.B.; Georgia, T.; Stephen, J.R.; Christopher, G.F. Family Wide Molecular Adaptations to Underground Life in African Mole-Rats Revealed by Phylogenomic Analysis. Mol. Biol. Evolut. 2015, 32, 3089–3107. [Google Scholar]
- Sun, H. Comparative Study on Circadian Rhythm Regulation Mechanisms in Brandt’s Vole (Lasiopodomys brandtii) and Mandarin Vole (Lasiopodomys mandarinus). Ph.D. Thesis, Zhengzhou University, Zhengzhou, China, 2019. [Google Scholar]
Disclaimer/Publisher’s Note: The statements, opinions and data contained in all publications are solely those of the individual author(s) and contributor(s) and not of MDPI and/or the editor(s). MDPI and/or the editor(s) disclaim responsibility for any injury to people or property resulting from any ideas, methods, instructions or products referred to in the content. |
© 2025 by the authors. Licensee MDPI, Basel, Switzerland. This article is an open access article distributed under the terms and conditions of the Creative Commons Attribution (CC BY) license (https://creativecommons.org/licenses/by/4.0/).