Article

Atad1 Is a Potential Candidate Gene for Prepulse Inhibition

1
Department of Genetics, Genomics and Informatics, University of Tennessee Health Sciences Center, Memphis, TN 38163, USA
2
Department of Psychology, The University of Memphis, Memphis, TN 38152, USA
*
Authors to whom correspondence should be addressed.
Current address: Department of Neurobiology, University of Massachusetts Chan Medical School, Worcester, MA 01655, USA.
Genes 2025, 16(10), 1139; https://doi.org/10.3390/genes16101139
Submission received: 19 August 2025 / Revised: 20 September 2025 / Accepted: 24 September 2025 / Published: 26 September 2025
(This article belongs to the Special Issue Genetics of Neuropsychiatric Disorders)

Abstract

Background/Objectives: Prepulse inhibition (PPI) is a robust, reproducible phenotype associated with schizophrenia and other psychiatric disorders. This study was carried out to identify gene(s) influencing PPI. Methods: We performed Quantitative Trait Locus (QTL) analysis of PPI in 59 strains from the BXD recombinant inbred (BXD RI) mouse family and used a 2-LOD region for candidate gene identification. Genes significantly correlated with the candidate gene were identified based on genetic, partial, and literature correlation, and were further studied through gene enrichment and protein–protein interaction analyses. Phenome-wide association study (PheWAS) and differential expression analyses of the candidate gene were performed using human data. Results: We identified one significant (GN Trait 11428) and two suggestive male-specific QTLs (GN Traits 11426 and 11427) on Chromosome 19 between 27 and 36 Mb with peak LRS values of 19.2 (−logP = 4.2), 14.4 (−logP = 3.1), and 13.3 (−logP = 2.9), respectively. Atad1, ATPase family, AAA domain containing 1 was identified as the strongest candidate for the male-specific PPI loci. Atad1 expression in BXDs is strongly cis-modulated in the nucleus accumbens (NAc, LRS = 26.5 (−logP = 5.7). Many of the Atad1-correlated genes in the NAc were enriched in neurotransmission-related categories. Protein–protein interaction analysis suggested that ATAD1 functions through its direct partners, GRIA2 and ASNA1. PheWAS revealed significant associations between Atad1 and psychiatric traits, including schizophrenia. Analysis of a human RNA-seq dataset revealed differential expression of Atad1 between schizophrenia patients and the control group. Conclusions: Collectively, our analyses support Atad1 as a potential candidate gene for PPI and suggest that this gene should be further investigated for its involvement in psychiatric disorders.

1. Introduction

Schizophrenia affects approximately 1.1% of the U.S. adult population, with associated lifetime prevalence estimates ranging from 0.3 to 1% [1,2,3], and is characterized by numerous behavioral and brain abnormalities (e.g., impaired social cognition, delusions, flattened affect, and region-specific changes in brain volume, etc.). Although widely studied, the etiology of schizophrenia remains poorly understood. One of the first large-scale GWAS on schizophrenia identified 108 significant schizophrenia-related loci [4,5]; after increasing the size of the cohort, the number of significant loci increased to 270 [6]. Schizophrenia is highly heritable, with estimates between 79 and 87% [7,8,9]. Prepulse inhibition (PPI), an index of sensory motor gating, has been advanced as a reliable endophenotype for schizophrenia-related behavior [10] and is moderately heritable, with estimates ranging from 31 to 50% [11,12,13,14,15]. Interestingly, deficits in PPI are detectable prior to the onset of psychosis [13], suggesting usefulness in assessing risk for development of psychosis. A recent study reported decreased neural PPI in early schizophrenia and bipolar disorder patients [16]. Identifying the genetic components contributing to psychosis may aid in our understanding of schizophrenia and in the development of therapeutic agents. Critically, identification of biomarkers associated with schizophrenia risk may permit earlier detection/diagnosis.
Mouse models have been useful in identifying genetic factors contributing to schizophrenia. Disc1 (disrupted in schizophrenia 1) and Nrg1 (Neuregulin 1) are among the genes most often associated with schizophrenia in mouse studies, as reviewed in [17]. Still, many models are of single gene mutations and do not address interactions between multiple genes. There are likely many genes that contribute with a small effect to schizophrenia. One way of identifying these genes is examination of schizophrenia-related endophenotypes. PPI and sensorimotor gating phenotypes have been associated with schizophrenia-related behavior, other mental disorders [18], Alzheimer’s disease [19], anxiety, Huntington’s disease, and autism among others, as reviewed in [20]. Thus, additional insight into genetic regulation of PPI/sensorimotor gating could prove informative with respect to multiple disorders.
Acoustic startle and PPI tasks assess startle response and sensorimotor gating. The startle reflex is measured in response to a loud acoustic stimulus, while a prepulse stimulus preceding the acoustic stimulus should inhibit a startle response to the acoustic stimulus [21,22]. There are several lines of evidence showing that PPI is genetically modulated. Studies have identified PPI QTLs in models including the chromosome (Chr) substitution strains Chr. 16, Ref. [23], and Chrs 4, 10, 11, and 16, Ref. [24]; the recombinant congenic strains Chrs 3, 5, 7, and 16, Ref. [25]; the heterogeneous stock Chrs 11 and 16, Ref. [26]; F1- and F2-crosses and advanced intercross lines Chr 7, Ref. [27], Chrs 2 and 7, Ref. [28], and Chrs 11 and 12 [29]; and a limited number of BXD recombinant inbred (RI) strains, including Chr 17, Ref. [30]. The power to dissect genetic regulation of traits like PPI/sensorimotor gating often lies in the model(s) used. Here, we used a powerful genetic resource, BXD RI strains, to examine genetic regulation of PPI.
The original BXD RI panel consisted of approximately 30 extant strains, providing advantages over smaller sets of RI strains, but still limiting precision and power to detect QTLs of small effect size [31]. After the addition of advanced intercross RI strains to this panel [32], as well as more recent additions, the expanded BXD RI panel is now the largest mouse RI panel. The increased number of strains offers significant promise in mapping QTLs of large and small effect sizes, influencing virtually any phenotype of interest. This expanded panel also allows for analysis of epistatic interactions, something not easily accomplished with the original set [32]. The BXD RI strains have been genotyped with more than five million microsatellite and single-nucleotide polymorphic (SNP) markers; thus, there is a dense genetic map of this panel. Importantly, the advanced intercross RI strains have more recombination events, permitting greater mapping precision.

2. Materials and Methods

2.1. Animals

Male and female mice from 59 BXD RI strains were used for behavioral testing. A total of 455 animals (2–6 animals per sex per strain) were tested. All animals were 45–55 days of age at the time of testing. The study was approved by the University of Memphis Institutional Animal Care and Use Committee. Additional details on breeding and housing are provided in [33].

2.2. Acoustic Startle and Prepulse Inhibition

We carried out behavioral testing as previously described [33,34]. Briefly, 55 pseudorandom trials consisted of an acoustic startle stimulus (120 dB white noise burst) and prepulse stimuli (70-, 80-, and 85 dB white noise bursts, 20 msec in duration) which preceded the startle stimulus by 100 msec. All data (means and standard errors) generated by us were submitted to GeneNetwork (www.genenetwork.org) and are publicly available. This dataset was revisited after more advanced genetic, sequencing and bioinformatic tools and/or datasets became available.

2.3. Single-Trait Mapping for Behavioral QTLs

The PPI data generated from 455 animals was averaged per BXD strain, which was then used for QTL mapping. Genotypic markers were regressed against each PPI trait using WebQTL. Empirical significance thresholds from 1000 to 1,000,000 permutations of trait data were employed to deal with the genome-wide multiple testing problems inherent in QTL mapping studies [35]. Where significant QTLs were observed, interval mapping was performed to identify the location of the QTL and candidate genes within the QTL region. We then used GEMMA 0.98.5 (genome-wide efficient mixed-model analysis) mapping (http://gn2.genenetwork.org) to confirm the QTL positions. This linear mixed model corrects for overlap in genomes due to kinship (i.e., BXD RI strains are derived from two parental strains and thus highly related genetically) and possible overlaps in gene expression due to interactions between genes and environment [36,37].

2.4. Criteria for Identification of Candidate Genes

A 2-LOD confidence interval was used to identify potential candidate genes for PPI. To prioritize candidate genes, we employed a scoring system (scores ranging from 0 to 10) using five different parameters, as follows: (a) significant correlation with PPI (score = 2); (b) containing nonsynonymous SNPs or indels [38] (score = 2); (c) mean expression ≥ 8 in datasets for brain regions associated with schizophrenia and PPI (two-fold higher than the baseline expression level of 7), consistent with methods/strategies we have used previously [39,40] (score = 1); (d) cis-regulation (gene located within +/− 10 Mb of flanking SNPs) (score = 2); and (e) functional significance to PPI (score = 3), based on resources including Mouse Genome Informatics (MGI, http://www.informatics.jax.org/) [41], the Rat Genome Database (RGD, www.rgd.mcw.edu) [42], the International Mouse Phenotyping Consortium (IMPC, http://www.mousephenotype.org/) [43], the GWAS Catalog (www.ebi.ac.uk/gwas) [44], and the Kyoto Encyclopedia of Genes and Genomes (KEGG, https://www.genome.jp/kegg/) [45]. The gene with the highest score was selected as the candidate modulating PPI and used for further analysis.

2.5. Gene Expression Datasets

Initial analyses used the following publicly available BXD RI expression datasets to examine associations between transcript levels and PPI: prefrontal cortex (PFC) mRNA: VCU BXD PFC Sal M430 2.0 (Dec 06) RMA; hippocampus (HIPP) mRNA: Hippocampus Consortium M430v2 (June06) PDNN; striatum (STR) mRNA: BIDMC/UTHSC Dev Striatum P3 ILMv6.2 (Nov11) RankInv; nucleus accumbens (NAc) mRNA: VCU BXD NAc Sal M430 2.0 (Oct07) RMA; midbrain (Mdb) mRNA: VU BXD Midbrain Agilent SurePrint G3 Mouse GE (May12) Quantile; ventral tegmental area (VTA) mRNA: VCU BXD VTA Sal M430 2.0 (Jun09) RMA; amygdala (AMYG) mRNA: INIA Amygdala Cohort Affy MoGene 1.0ST (Mar11) RMA; and hypothalamus (HYPO) mRNA: INIA Hypothalamus Affy MoGene 1.0ST (Nov10) RMA. Specific information on these datasets (i.e., strain, sex, data processing, etc.) can be found on the GeneNetwork website (www.genenetwork.org). The HIPP, PFC, AMYG, and NAc are implicated in PPI modulation, while the VTA has been implicated in the acoustic startle response, as reviewed in [20].

2.6. Functional Analysis

Genetic, partial, and literature correlations were performed to filter lists of transcripts correlated with our candidate gene and to perform gene enrichment analyses [39,40]. To identify genes co-expressed with our candidate gene, we compared the candidate gene’s expression to that of all available probe-sets in the brain regions examined. Genes with expression levels greater than the baseline of 7.0 and correlated with our candidate gene were analyzed further. Following genetic correlation, partial correlation analysis was performed to eliminate any genes that were only genetically, but not biologically, related to the candidate gene. A literature correlation was performed to further examine the correlation between other genes and the candidate based on MEDLINE abstracts and titles [46]. Gene enrichment analysis was conducted using significantly correlated genes with a p-value < 0.05, mean expression ≥ 8.0, and literature correlation ≥ 0.2. Gene sets were uploaded to WebGestalt v2024 (https://www.webgestalt.org/, accessed on 10 June 2025), and p-values of the over-represented categories were adjusted for multiple comparisons [47]. In addition, we submitted the correlated genes to the Metascape v3.5 (http://metascape.org, accessed on 3 May 2025) [48] to explore networks of Gene Ontology biological processes (GO-BP).

2.7. Correlation and PheWAS Analyses

Correlations between PPI and the expression of the candidate gene were examined and Pearson’s product correlation values of p < 0.05 were used.
We queried human PheWAS (phenome-wide association study) data for the strongest candidate gene in our QTL region to identify human phenotype associations [49,50], using the PheWAS tool in GWASatlas Release 3 (https://atlas.ctglab.nl/PheWAS, accessed on 15 May 2025) [51].

2.8. Protein–Protein Interaction Network Analysis

The genes correlated significantly (p-value < 0.05, mean expression ≥ 8, and literature correlation ≥ 0.2) with the candidate gene in the NAc dataset were used to explore interactions at the protein level using the STRING database [52,53], where only “experimentally verified” interactions (medium confidence score of 0.4) were considered. The protein–protein network was further analyzed and visualized using Cytoscape v3.10.1 [54], and network statistics, such as degree, betweenness and closeness centrality, were calculated for each protein in the network.

2.9. Validation of Candidate Genes Using Human RNA Sequencing Data

Expression of the candidate genes was validated using human RNA-seq data from schizophrenia patients, retrieved from the Gene Expression Omnibus (GEO) database [55]. Raw read count data of schizophrenia and matched control samples for NAc were downloaded from the dataset GSE202537 (https://www.ncbi.nlm.nih.gov/geo/query/acc.cgi?acc=GSE202537, accessed on 11 November 2024) [56]. Briefly, the postmortem samples were sequenced using Illumina NextSeq 500, raw reads were aligned to the human genome (GRh38) using HISAT2v2.1.0 [57], and read counts were estimated using HTSeq v0.10.0 [58]. The read counts were normalized, and differential expression analysis was performed using DeSeq2 [59]. Genes with an adjusted p-value < 0.05 (Benjamini & Hochberg, B&H, correction) were considered significant.

3. Results

3.1. Prepulse Inhibition

The strain distribution for %PPI at 85 dB is presented in Figure 1A; BXD85 had the lowest %PPI (11.78 ± 8.00) and BXD01 had the highest (84.37 ± 0.96). QTL mapping revealed a significant locus for %PPI at 85 dB (GN Trait 11428) between 27 and 36 Mb of Chr 19, with a peak at 32.7 Mb (LRS = 19.2), in male BXD mice (Figure 1B). We also found overlapping suggestive QTLs on the same chromosome for %PPI at 70 dB (GN Trait 11426) and 80 dB (GN Trait 11427) in males. The suggestive locus for GN Trait 11426 was located at 27.53 Mb on Chr 19 (LRS = 14.4) and the locus for GN Trait 11427 at 32.74 Mb (LRS = 13.3) (Figure 1C,D), strongly indicating the association of this chromosomal region with PPI, particularly in male mice.

3.2. Identification of Candidate Genes

The 2-LOD region for the QTL of %PPI at 85 dB is located between 27.5 and 36 Mb of Chromosome 19, with ~100 genes in this region. After filtering by genetic correlation with %PPI 85 dB, only ten genes remained (Table 1). Among these, we shortlisted genes with expression levels of at least 8 (reflecting two-fold baseline) in the brain expression datasets, then determined whether genes had functional polymorphisms between B6 and D2 (i.e., non-synonymous, insertions, or deletions in coding or regulatory regions) or a significant cis-regulated expression QTL (cis-eQTL). Finally, the functional significance of these ten genes was assessed based on their association with brain/nervous system/schizophrenia-related pathways or phenotypes. Genes were then scored as indicated in the Methods. Of the 10 genes, 8 received more than 50% of the possible total score. Atad1 (also known as thorase) was the strongest potential candidate gene, with a maximum score of 10. Rnls and Prkg1 received scores of 9 and 8, respectively, while Asah2 received a score of 7 (Table 1). We found that Atad1 had expression levels >8 in each of the brain expression datasets examined; however, six of the datasets were not considered further because expression of Atad1 was not cis-regulated (PFC, HYPO) or expression of Atad1 was not correlated with PPI (STR, MDB, VTA, HYPO)

3.3. Genetic, Partial, and Literature Correlations for Identified Candidate and Gene Sets

We queried gene expression dataset [GN156: VCU BXD NAc Sal M430 2.0 (Oct07) RMA] for the top 15,000 genes whose expression correlated with Atad1. Partial correlation yielded 7880 genes significantly correlated (p < 0.05) with Atad1 (1148763_at) in the NAc dataset. Next, including those with literature correlations ≥0.20 yielded 2212 genes. Finally, filtering out correlated genes with low expression (≤8) resulted in 1716 genes, which were used for further analysis. We also queried the gene expression dataset [GN 112: Hippocampus Consortium M430v2 (6 June) PDNN], which resulted in a small set of genes, hence our focus on the NAc dataset.

3.4. Gene Enrichment Analysis

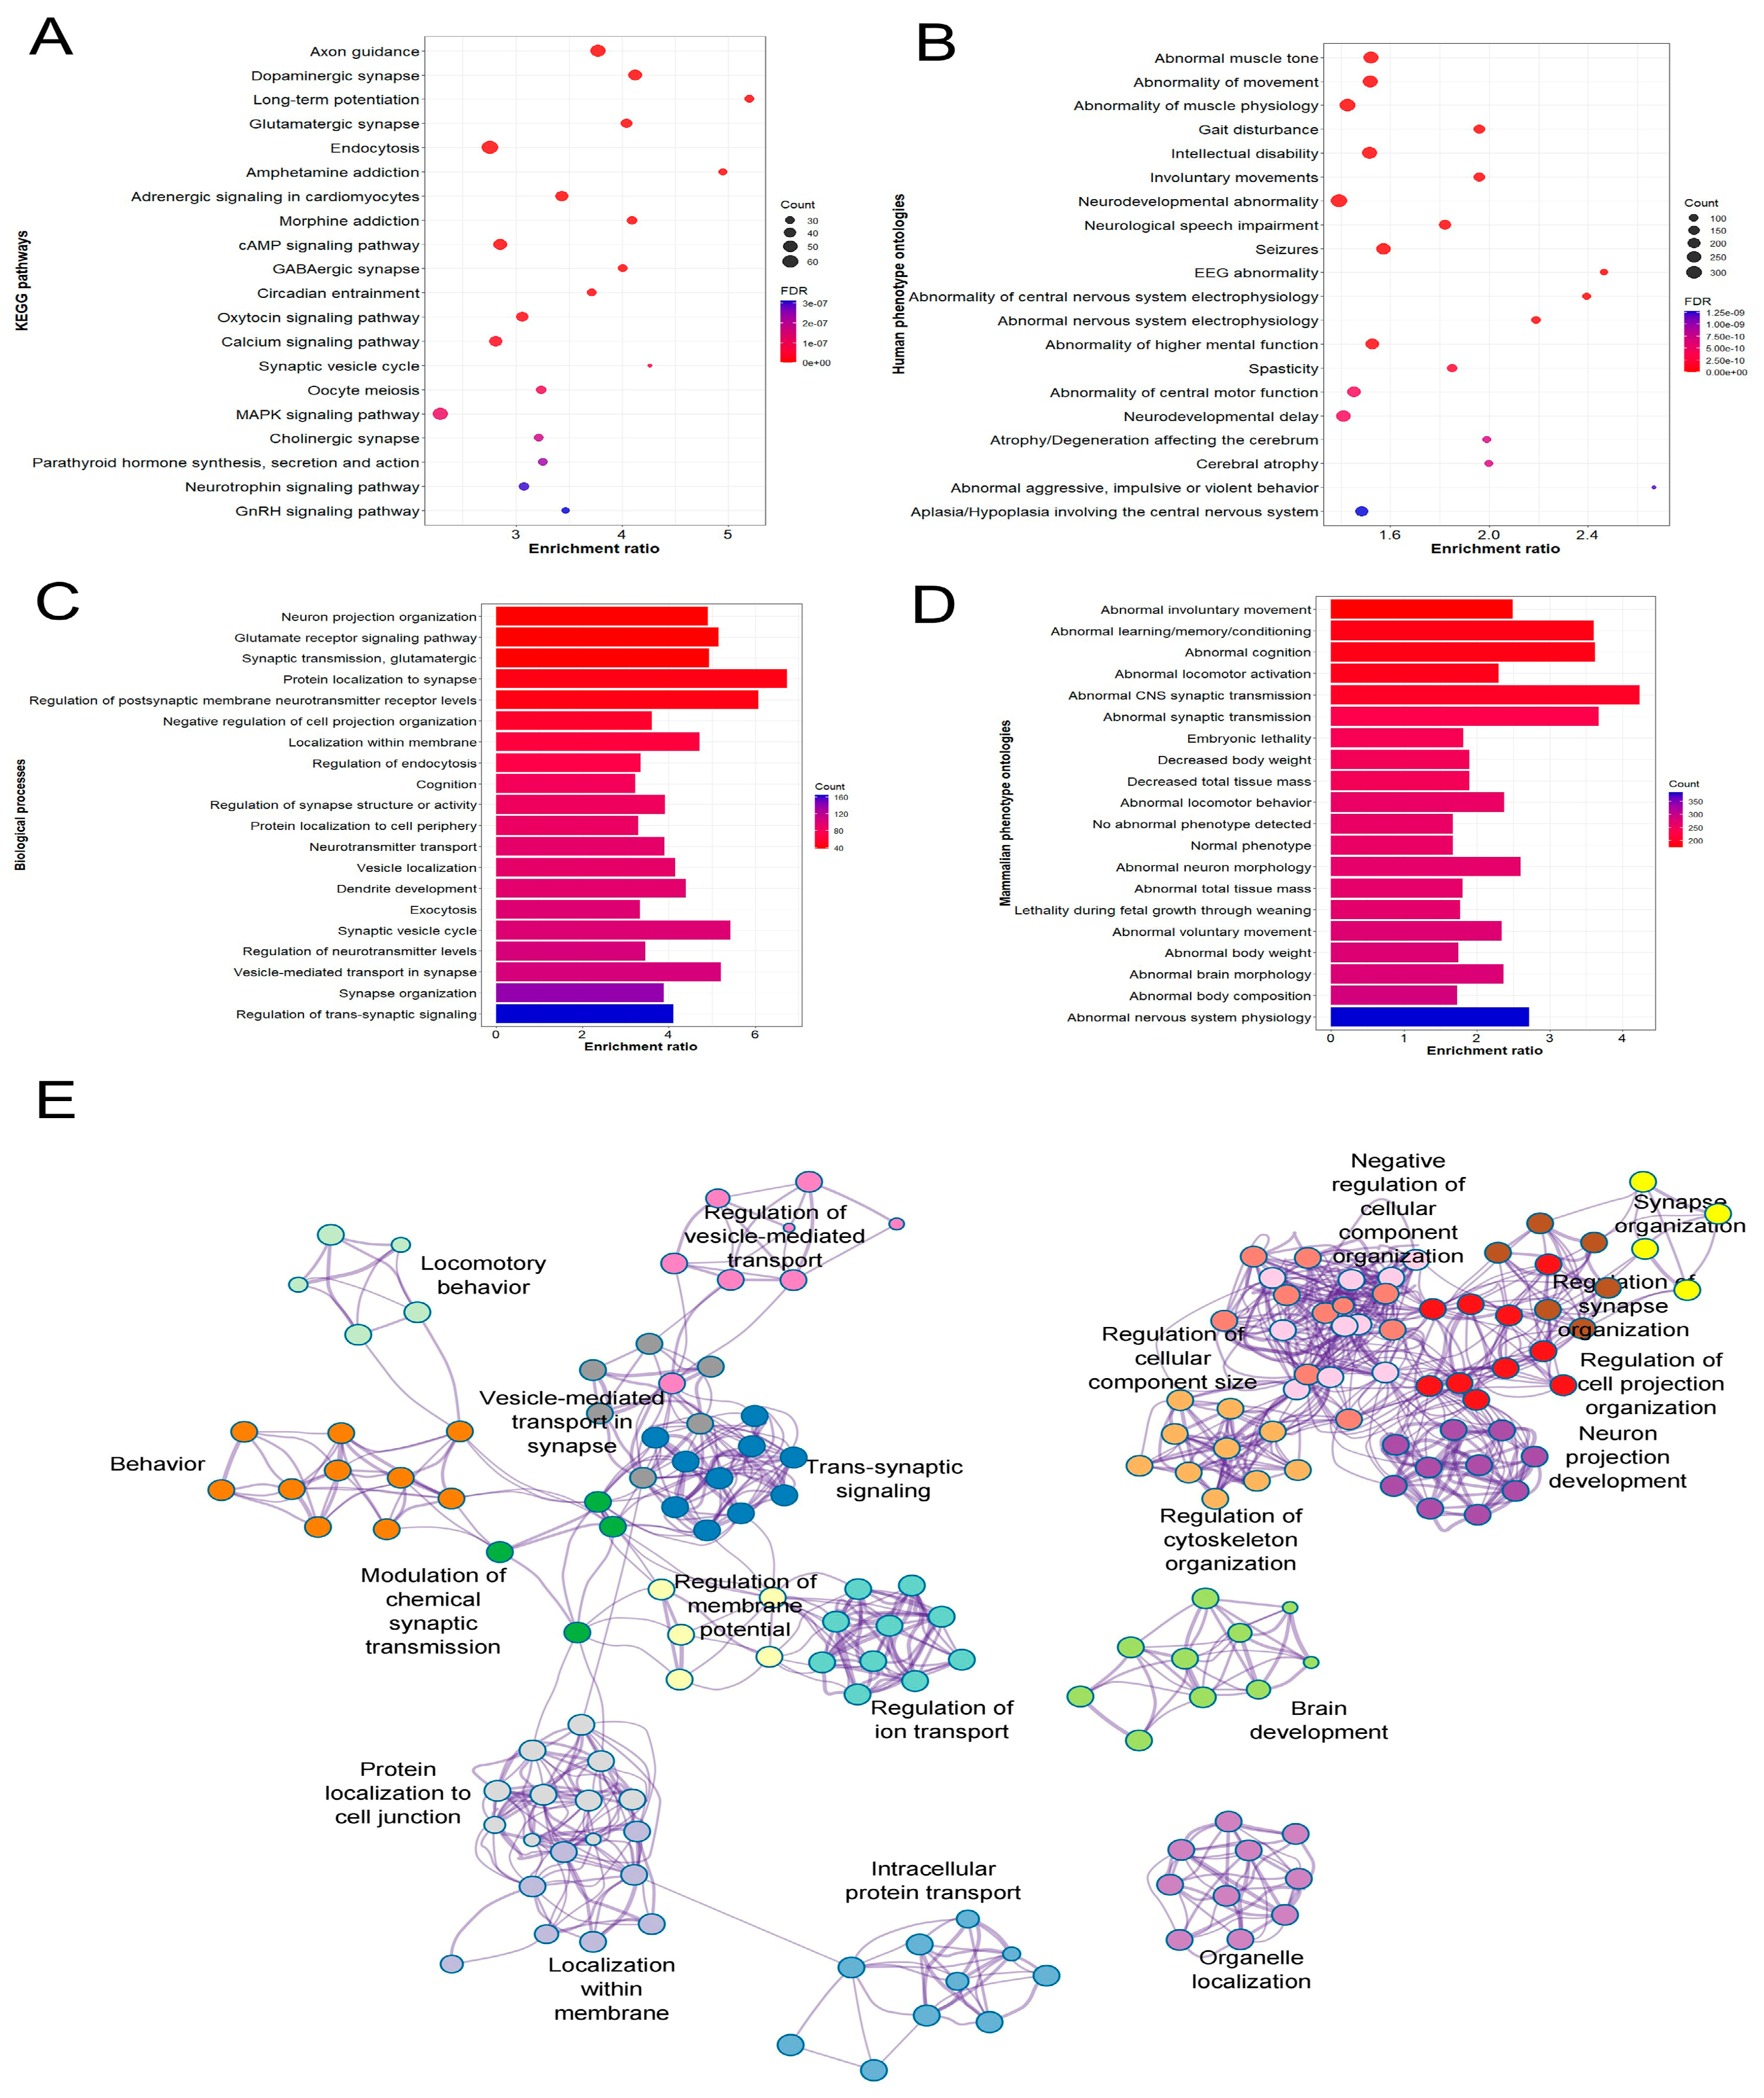
Many of the enriched categories for Atad1-correlated genes were related to neurotransmission and/or properties of its components. Figure 2A–D show the top 20 significant KEGG pathways, mammalian phenotype ontologies (MPOs), Gene Ontology biological processes (GO-BPs), and human phenotype ontologies (HPOs) enriched by Atad1-correlated genes (a complete list of significant annotations, false discovery rate (FDR) p < 0.05, is provided in Supplementary Table S1). Among the top KEGG pathways, over 60% were directly associated with nervous system/physiology. “Dopaminergic synapse” and “Axon guidance” were the most significant KEGG pathways, with a p-value < 0.001. Similarly, more than 70% of the top 20 GO-BPs were related to neuron/brain-related processes. While the FDR-corrected p-value was <0.00001 for the top 20 GO-BPs, “regulation of trans-synaptic signaling” involved the largest number of genes (n = 165), followed by “synapse organization” (n = 139). Further, our results demonstrated the involvement of Atad1-correlated genes in nervous system- and brain-related phenotypes in mice and humans. “Abnormal nervous system physiology” was the most significant MPO, with 383 genes (Figure 2D). The top enriched HPOs were “Involuntary movements”, “Neurological speech impairment”, and “Neurodevelopmental abnormality”. To gain a better insight into the relationships between different biological processes, we constructed a network of GO-BPs. This revealed a close interaction between terms associated with neurodevelopmental physiology. Furthermore, many GO-BP clusters were connected to behavioral processes (Figure 2E).

3.5. Phenotype Correlation

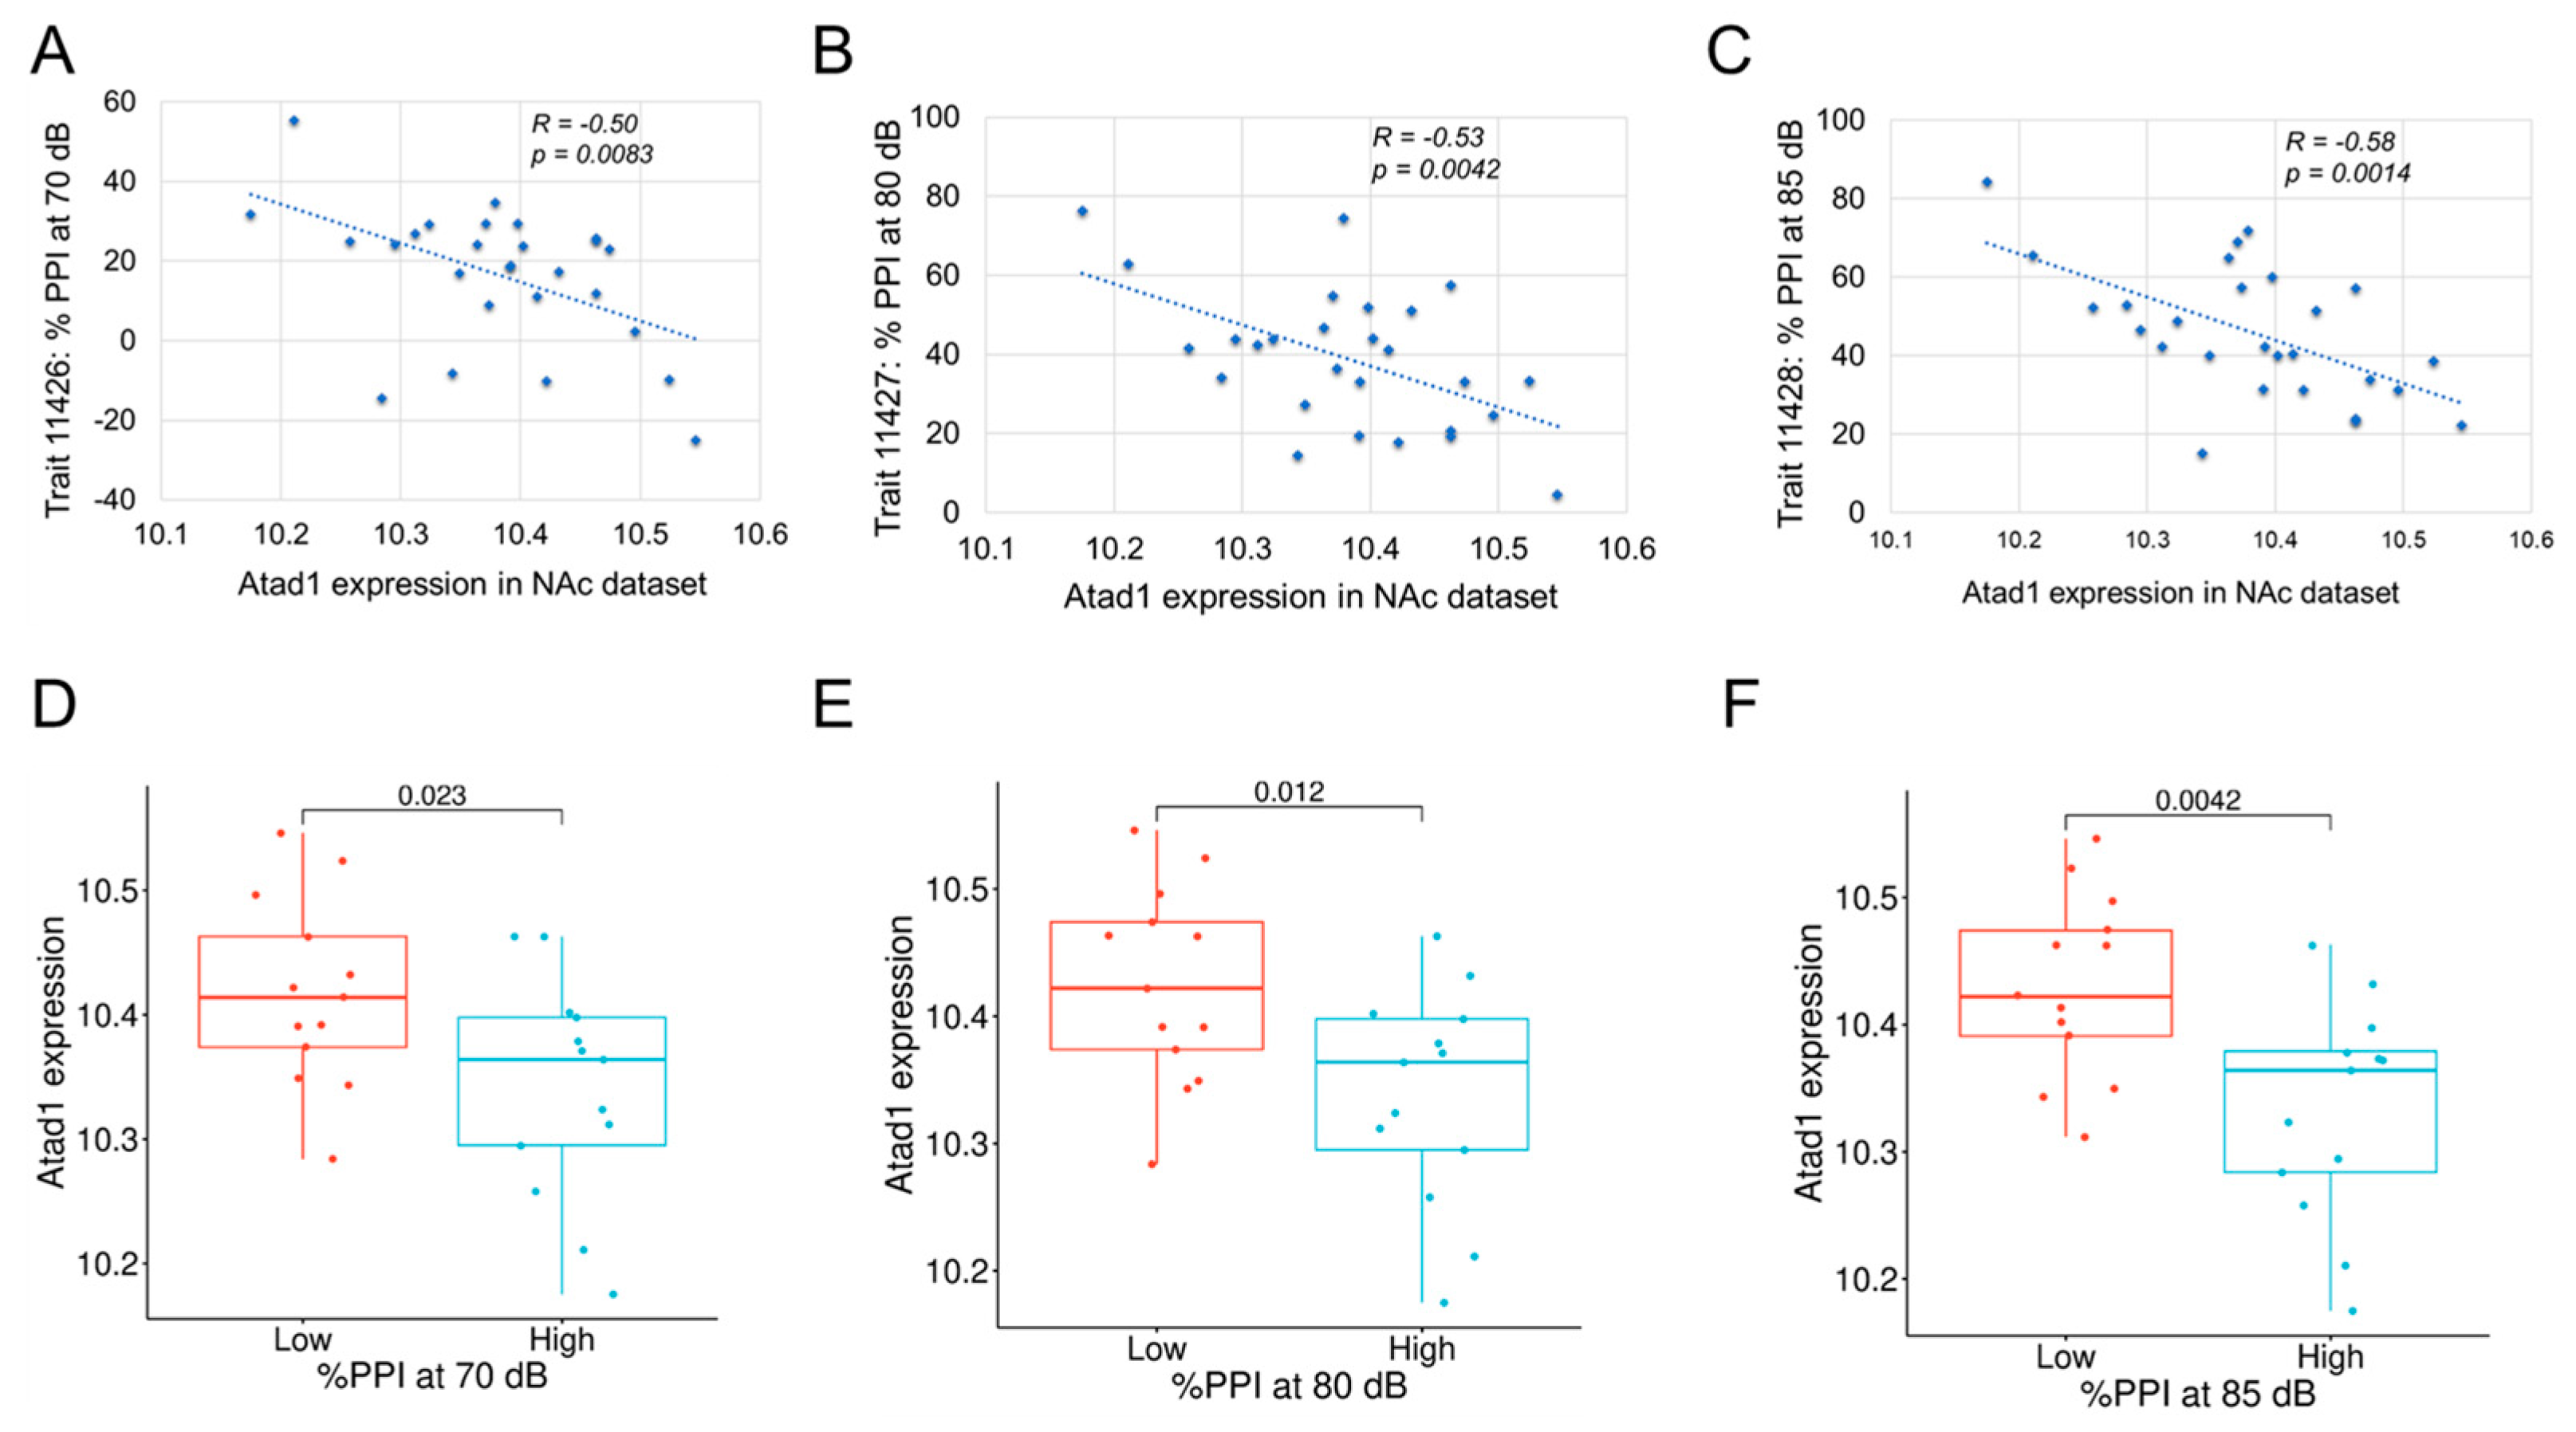
As shown in Figure 3A, the correlation between Atad1 expression in the NAc and our PPI trait (Trait 11428) was r = −0.582 (p = 0.0014), indicating increased expression levels of Atad1 correlated with lower levels of PPI. Additionally, Atad1 was significantly negatively correlated with %PPI at 70 dB (GN Trait 11426) and at 80 dB (GN Trait 11427) in BXD mice (Figure 3B,C), strengthening the key role of this gene in PPI. Furthermore, to investigate whether the expression of Atad1 varied between the BXD strains depending on PPI, we divided the BXD strains into “high” and “low” PPI groups. The grouping was based on the median PPI values across the BXD strains, i.e., strains with PPI values less than the median were classified as belonging to the “low” group, whereas those with PPI values higher than the median were considered as belonging to the “high” group. Atad1 expression was found to be statistically significant between the two groups based on Student’s t-test, and was higher in the “low” PPI group compared to the “high” group for all the traits tested (Figure 3D–F), corroborating with the correlation analysis results.

3.6. Protein–Protein Interaction Network

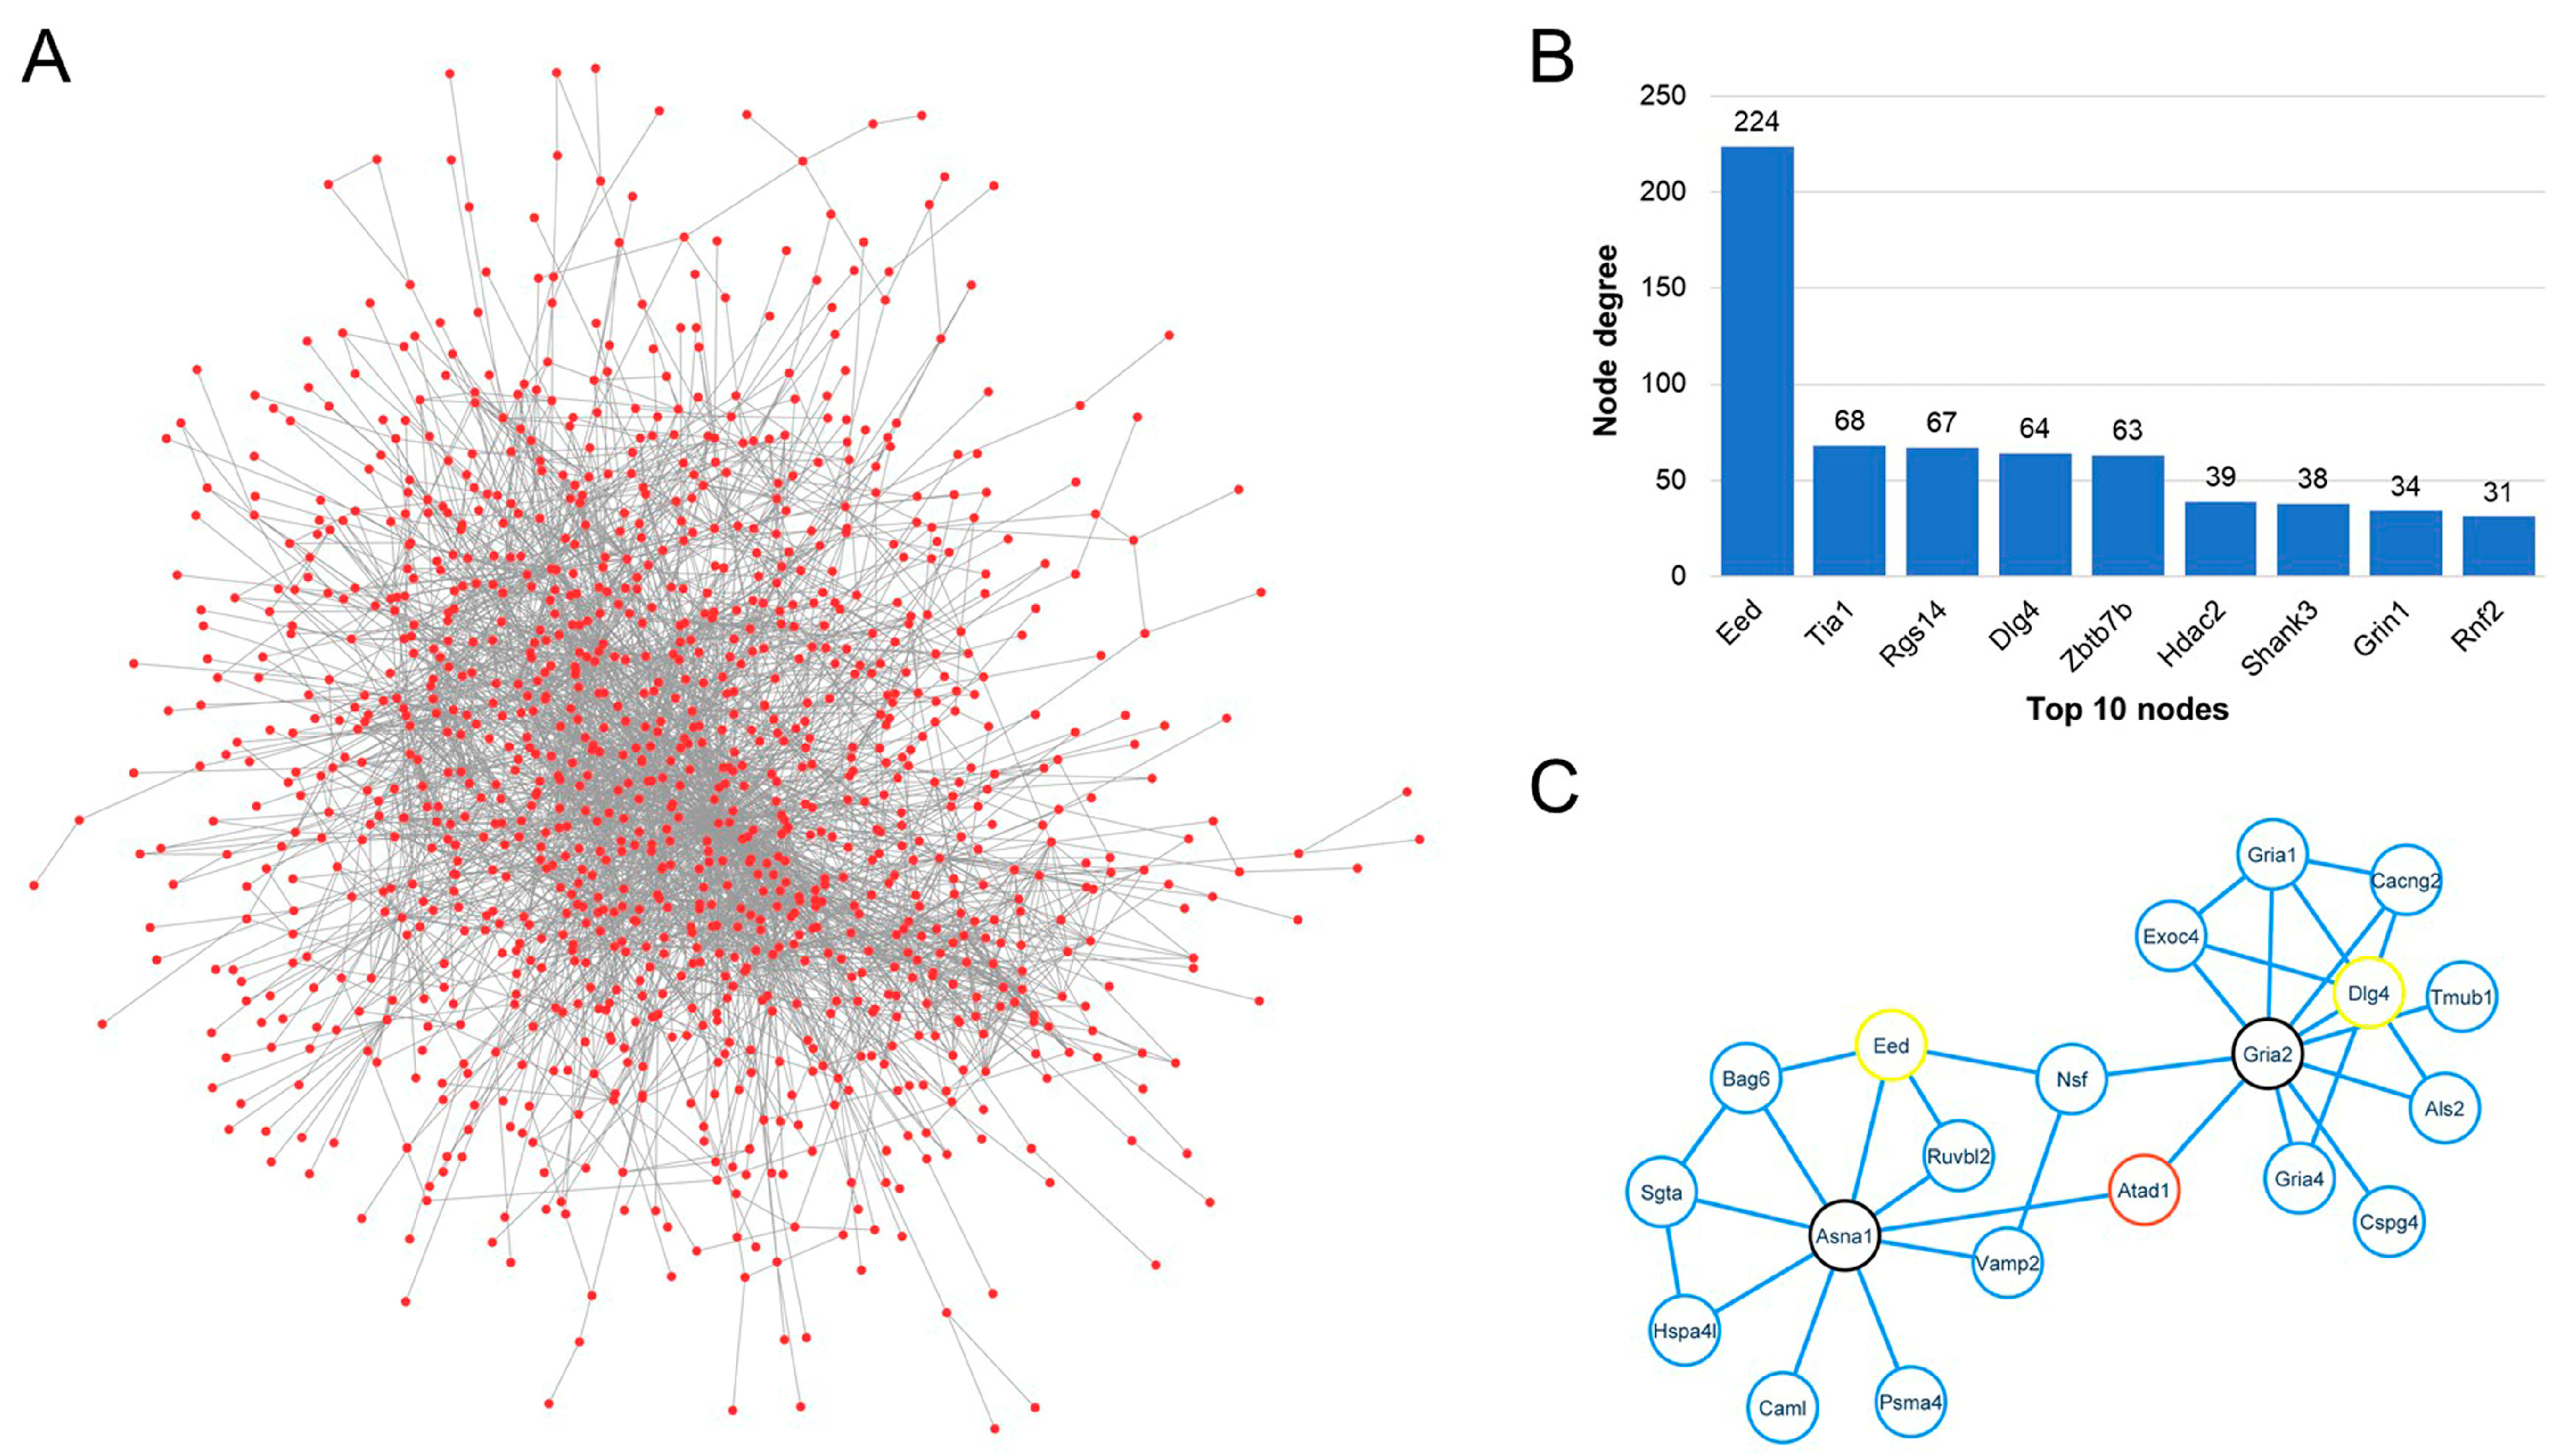
We constructed a protein–protein interaction network using Atad1-correlated genes to understand how Atad1 affects neurodevelopmental processes. The global network of Atad1-correlated genes contained ~1100 proteins and 3500 edges (Figure 4A). A large number of interactions demonstrate that many of these genes work closely together to perform similar functions. This was further corroborated by analyzing network statistics, which revealed that, on average, every protein in the network has a minimum of six interactions (node degree (ND) = 6). EED (embryonic ectoderm development), a protein involved in epigenetic regulation, had the highest ND of 224 (Figure 4B). Other important proteins with high NDs were TIA1 (ND = 68), RGS14 (ND = 67), DLG4 (ND = 64), and ZBTB7B (ND = 63). Our candidate, ATAD1, interacted with only two proteins, but had a “closeness centrality” of 0.25 (maximum value in the global network = 0.44). “Closeness centrality” estimates how fast the flow of information is through a given node to other nodes in a protein interaction network. Although ATAD1 has a low ND, it appears to be an important protein in the network, likely functioning through other molecules. Hence, we explored the ATAD1-specific interaction network by extracting its primary and secondary interactors from the global network. ATAD1 directly interacts with GRIA2 and ASNA1 (Figure 4C). Further, GRIA2 directly interacts with 10 other proteins, including EED, which has the highest ND in the global network. Similarly, ASNA1 interacts with nine other proteins, including DLG4, which has an ND of 64 in the global network. Thus, our protein interaction analysis demonstrated that instead of directly interacting with many proteins, ATAD1 carries out its functions by indirectly interacting with other proteins through GRIA2 and ASNA1. A complete list of interactions and node properties can be found in Supplementary Table S2.

3.7. PheWAS Analysis

We performed PheWAS analysis (48, 49) using human GWAS datasets. ATAD1 had significant associations with human phenotypes, including neurological traits (Figure 5). Psychiatric traits significantly associated with ATAD1 were schizophrenia, bipolar disorder, and depression (Table 2), confirming its association with human neurodevelopmental disorders.

3.8. Candidate Variants in Atad1

There are 185 small variants within Atad1 which segregate in the BXD population (154 SNPs, 15 insertions, and 16 deletions), and evidence of a large 214 bp deletion (32,738,422–32,738,636). None of these variants are in protein coding regions, and the large deletion is within the first intron. Most of the small variants are intronic (n = 158); 14 are upstream or downstream of the gene, 12 are in the 3′ UTR, and 1 is in the 5′ UTR. This agrees with our finding that Atad1 is differentially expressed between the two genotypes (B6 and D2 progenitor strains of the BXD population) and is cis-regulated. We are not able to determine which variant is causal, but it is probable that a variant in the 3′ UTR could alter transcription factor binding.

3.9. Validation of the Candidate Gene in Schizophrenia Patients

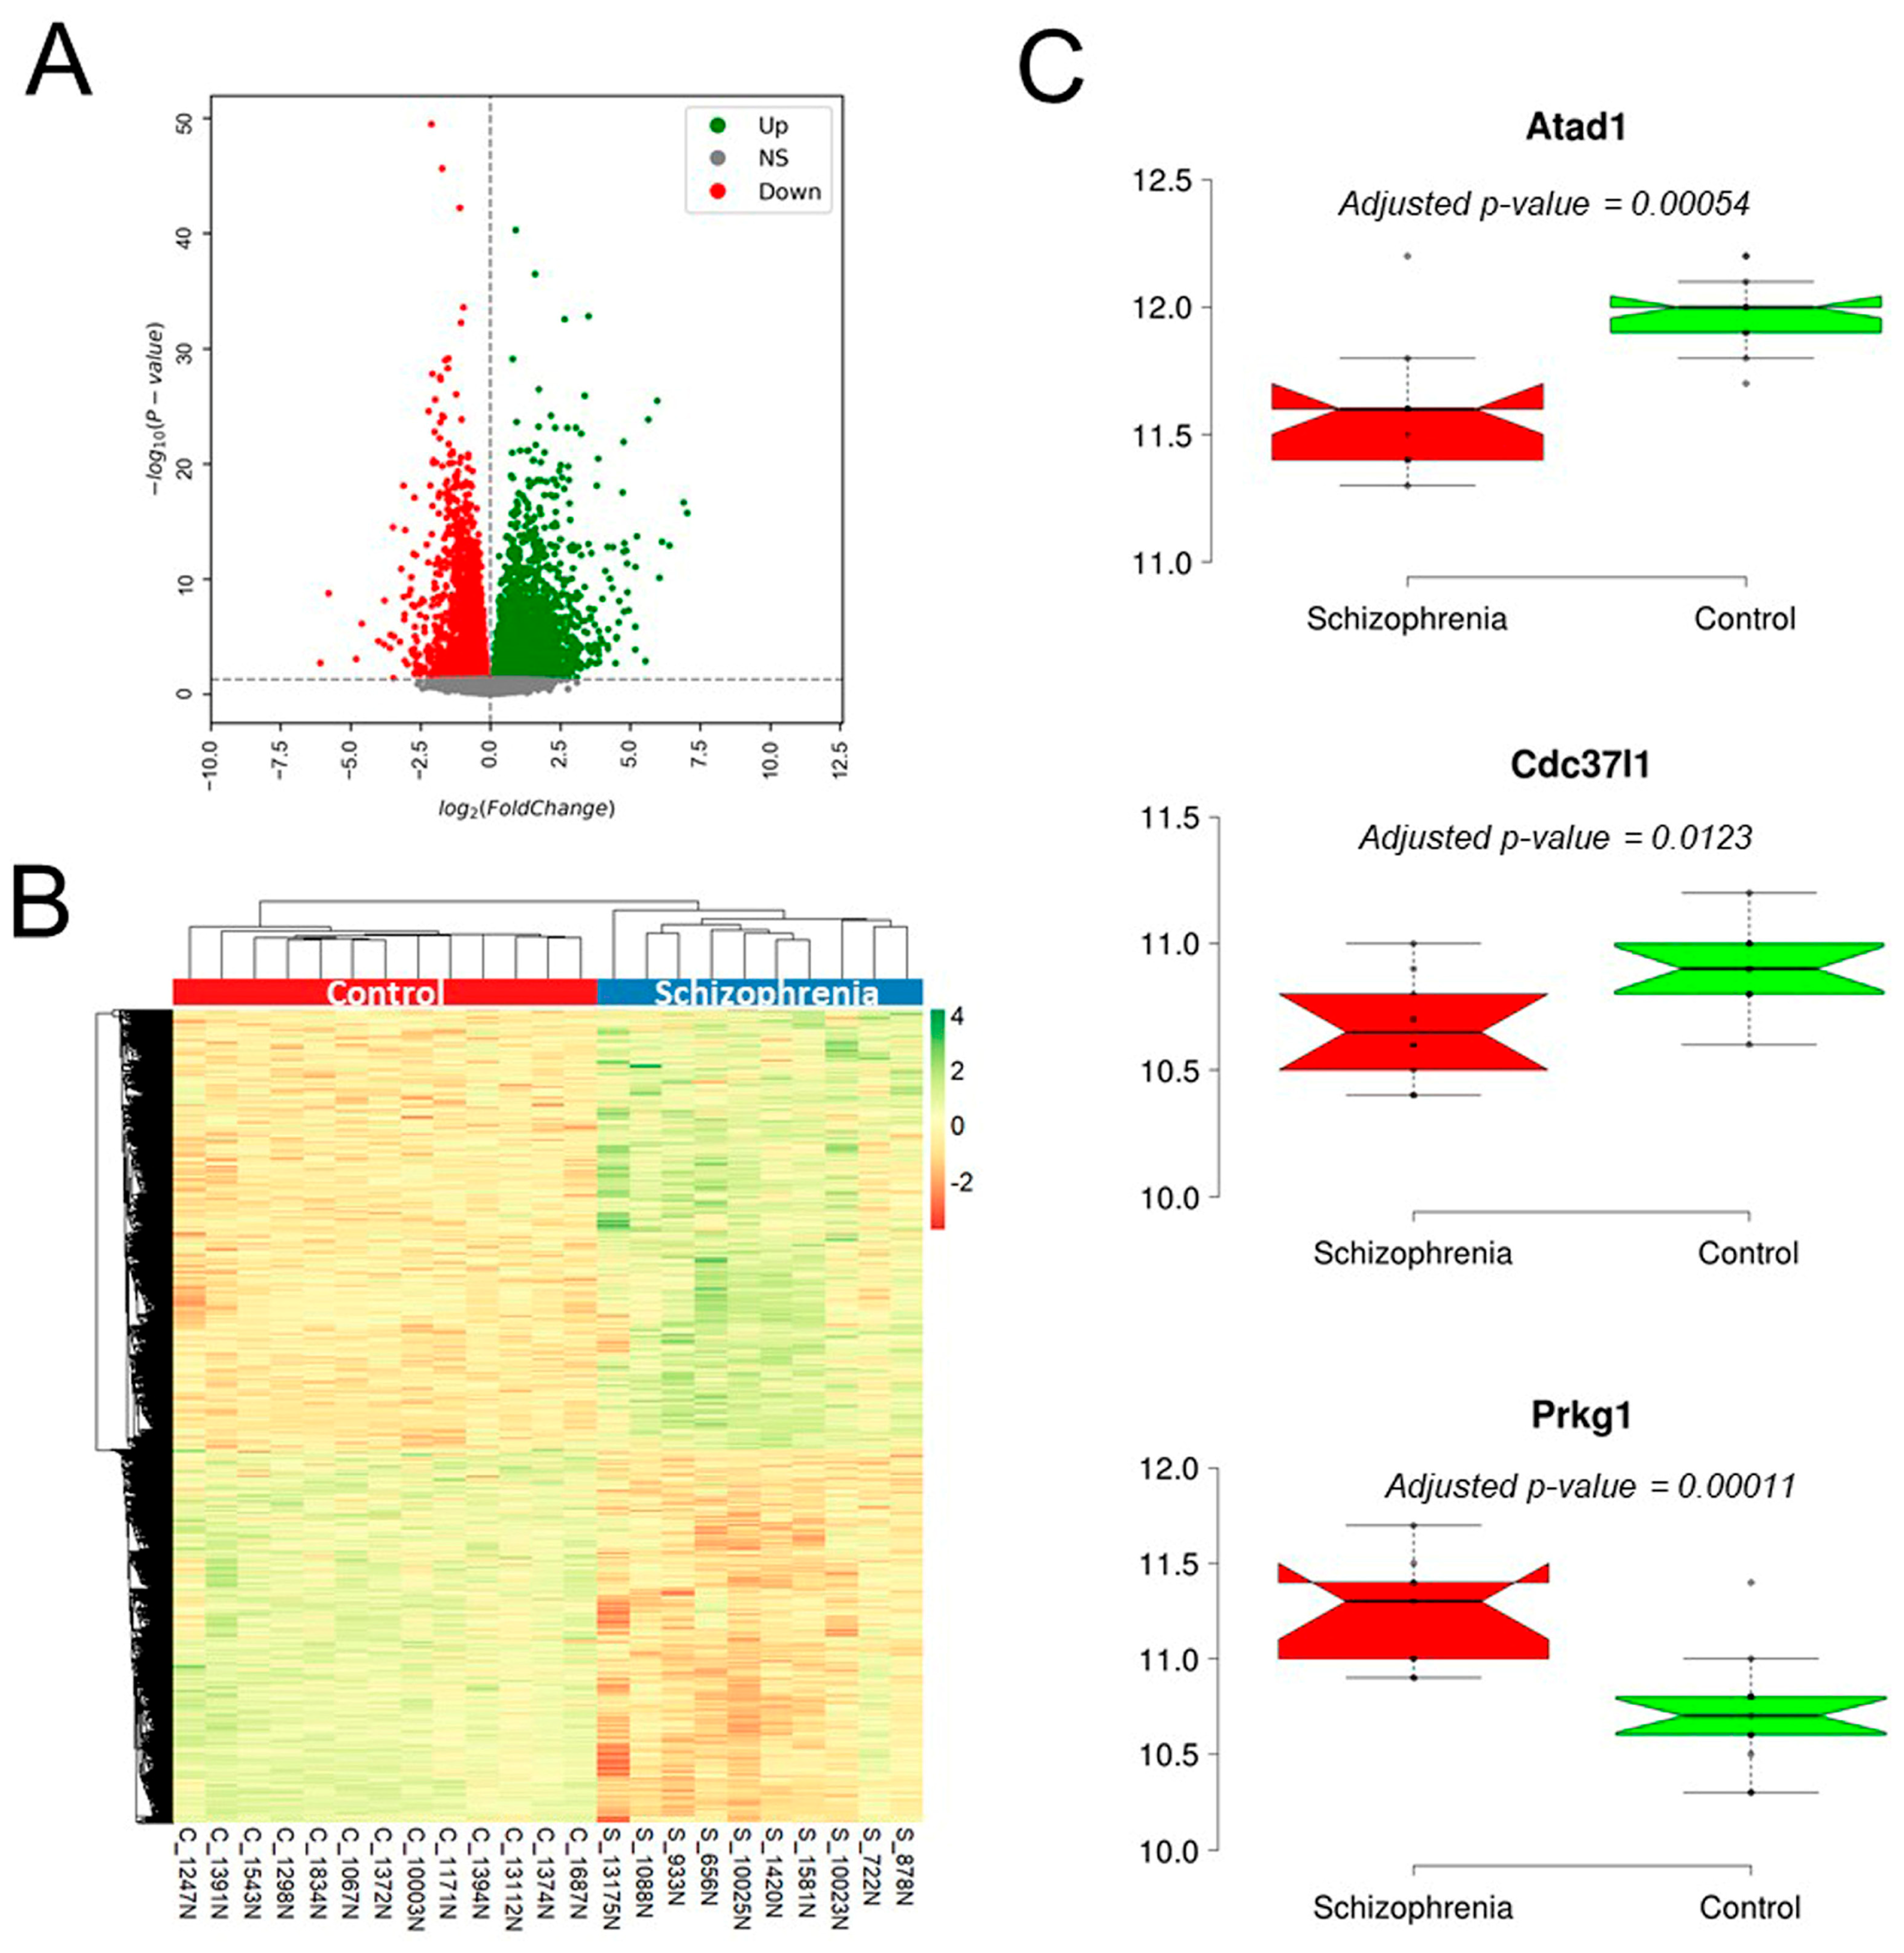
We used the RNA-seq dataset GSE202537 to explore differential expression of candidate genes between schizophrenia (n = 28) and control (n = 36) NAc samples. We first excluded the outlier samples based on PCA and clustering methods, and finally used 10 schizophrenia and 13 control samples for differential expression analysis. A total of 8132 genes were differentially expressed (4397 upregulated and 3735 downregulated) between the two groups (B&H adjusted, p < 0.05) (Figure 6A,B). Of the 10 potential candidate genes (Table 1), 3 genes (Atad1, Cdc37l1, and Prkg1) were differentially expressed between schizophrenia patients and the control group. While Atad1 and Cdc37l1 showed lower expression in the patient than in the control group, Prkg1 had a contrasting expression pattern (Figure 6C).

4. Discussion

Although a significant number of genes have been implicated in schizophrenia and related traits, the etiology of schizophrenia remains poorly understood. Diagnosis and therefore treatment for this disorder is often delayed. Identification of biomarkers may facilitate earlier diagnosis. Because of its robustness, heritability, and ease of study in animal models, PPI is an informative endophenotype of schizophrenia and other psychiatric disorders. Here, we used a powerful genetic resource, the BXD RI panel, to identify genetic factors influencing PPI. The limitations of our use of a single endophenotype are acknowledged, although robust deficits in PPI have been replicated in human sample cohorts [17,60]. Here, we focus not on deficits per se, but on genetic regulation of PPI. We identified a significant male-specific QTL for PPI on Chr 19 in the BXD RI panel and identified Atad1 as a strong potential candidate gene. Other sex-dependent associations between genes and schizophrenia include Fabp7, which is associated with NMDA receptors in mice [27]; in humans, DLG1, which codes for a synapse-associated protein, has a male-specific association with schizophrenia [61], and Ptpn5, tyrosine-protein phosphatase non-receptor type 5, is important in excitatory postsynaptic activity [62]. These findings suggest the need for closer examination of sex differences in the expression of genes and sex-based variants in genes associated with PPI, schizophrenia, and related traits. Additionally, although we tested relatively young animals and cannot rule out any influence of hearing, potential differences in hearing sensitivity are acknowledged, given that age-related hearing loss has been documented in the BXD parental strains, B6 and D2 [63,64]. However, it should be noted that our PPI QTL did not map to any regions, i.e., Chrs 5, 11, 18 [63,65,66], previously associated with age-related hearing loss in the parental or BXD RI strains. Interestingly, a locus that protects against hearing loss in a small number of strains has been identified on Chr. 16 in the BXD RI strains [64].
Although several schizophrenia susceptibility/risk genes have been identified, researchers have shown that “top” susceptibility genes code for proteins that converge on a highly interconnected molecular network. The heterogeneous nature of schizophrenia, therefore, could be explained by a mutation in any single gene in that highly interconnected network, rather than some common mutation [67] in the large number of genes that have been associated with schizophrenia. The task of understanding how genes function (and especially interact with one another) in such networks remains. The robustness and stability of the PPI phenotype [18,68], coupled with the genetic power of the BXD RI panel, should aid in mapping and elucidating neural and genetic substrates related to sensory gating. Strengthening the argument for the use of PPI as an endophenotype, 117 genetic variants have been associated with sensory/sensorimotor gating, as reviewed in [69]. A critical next step is to discern the mechanisms through which Atad1 affects PPI. In other words, what is the functional effect? Our protein–protein interaction analysis suggests that Atad1 functions through its interactions with other highly interconnected players in the network. Gene enrichment analysis revealed that the top enriched category in Atad1’s gene network was “dopaminergic synapse”, with “glutamatergic synapse” as the fourth. Reviews have summarized evidence from mutant mice (with gene disruptions) for the putative roles of dopaminergic and glutamatergic pathophysiology in schizophrenia [70,71]. This suggests that Atad1 interacts, indirectly, with other genes that affect neurotransmitter systems, components, and pathways implicated in schizophrenia and other disorders.
In an examination of schizophrenia-related endophenotypes in humans, both distinct and overlapping genes were associated with individual endophenotypes, suggesting that both unique and overlapping pathways are involved in schizophrenia risk [72]. An investigation of the protein interactome found that schizophrenia-related risk genes formed a disease module including genes related to developmental biology and cognition [73]. Postmortem examination of co-expression networks in the schizophrenia prefrontal cortex revealed that genes with altered expression were associated with oxidative phosphorylation, myelination, synaptic transmission, and immune function [74]. The potential PPI QTL gene, Fabp7, is associated with functional links to the NMDA receptor [27]; further analysis, using engineered mice and human pluripotent stem cells, revealed a potential role of Cdh23 in PPI and CDH23 in schizophrenia [75]. The recent identification of APBB1lP as a candidate gene for PPI also links immune function with schizophrenia [76]; other studies highlight the role of immune activation and synapse remodeling in schizophrenia [77].
There is mounting evidence that Atad1 plays a significant role in schizophrenia-related traits. The construction of glutamatergic synapses throughout development is critical in the etiology of schizophrenia [78]. Atad1 is associated with glutamatergic signaling and regulation of AMPA receptor (AMPAR) expression. AMPAR trafficking is implicated in synaptic plasticity/learning and memory [78], and may be key in understanding cognitive function and dysfunction [79]. More recent studies have highlighted the importance of ATAD1 in the regulation of neurodevelopment and synaptic function [80]. In a mouse model, loss of ATAD1 increased surface expression of AMPARs, which was directly related to increased AMPA current. While its loss did not affect basal transmission at CA1 synapses, long-term potentiation (LTP) increased and long-term depression (LTD) was blocked. Further, aberrant behaviors in the open field and Y-maze suggest that Atad1-KO mice (deletion limited to forebrain structures) showed short-term memory deficits specific to novel environments [81]. Other studies suggest that rapid GluR1 (an AMPAR subunit) trafficking may be required for short-term memory processes [82]. Atad1 likely prevents the recycling of GluR1 (and GluR2) back to the plasma membrane [76]. Recent studies have identified ATAD1 variants in the postmortem brains of schizophrenia patients. These findings were followed up with mouse studies that showed that AMPAR-mediated synaptic transmission was increased after deletion of ATAD1 proteins from dopamine neurons. Moreover, the conditional loss of this gene (cKO) impaired LTD at glutamatergic synapses onto dopamine neurons, showing that glutamatergic transmission onto dopamine neurons is important to fear learning, but not generalized fear [83]; the cKO mice also showed greater associative learning and enhanced second-order conditioning in comparison to wildtype littermates. Likewise, associative learning deficits (contextual and cued fear conditioning) were observed in heterozygous mice expressing Atad1 variants; these mice displayed deficits in spatial working memory, spatial recognition memory, and PPI, and social behavior deficits were reversed by perampanel, an AMPAR antagonist [84]. Such findings are important because Atad1 variants can affect the disassembly of the AMPAR/Glutamate interacting protein-1 (GRIP1) complex [84], which is important in AMPAR trafficking, particularly internalization of AMPARs. We identified several variants in Atad1. A limitation is that we are not able to pinpoint the causal variant(s) in Atad1; however, others have shown that genetic variants in untranslated mRNA regions can modify regulatory mechanisms (i.e., transcription, structure, localization) and contribute to disease processes [85]. Thus, an important next step is determining which of the identified Atad1 variants influence PPI.

5. Conclusions

We identified Atad1 as a candidate gene for PPI and demonstrated that Atad1-correlated genes are enriched in annotations related to behavior, synapse function, and brain development. Human mapping studies have not implicated ATAD1 in schizophrenia and related disorders; however, this gene has been implicated in neuronal function, synaptic organization, and transmission, among others [6]. Recent mouse studies, however, have shown that ATAD1 signaling is important in preventing α-synucleinopathy and behaviors associated with Parkinson’s Disease [86]. We identified associations between ATAD1 and psychiatric traits in human GWAS datasets. Finally, using an RNA-seq dataset, we found differential expression of ATAD1, including two other candidates, CDC37L1 and PRKG1, between schizophrenia and control groups, suggesting that examination of co-regulation of Atad1 and other “players” is warranted. Future studies should further characterize the role of Atad1 in PPI, schizophrenia, and related phenotypes, i.e., ATAD1 has been associated with hyperekplexia, a phenotype associated with “exaggerated” startle and excessive stiffness [87,88,89,90,91].

Supplementary Materials

The following supporting information can be downloaded at https://www.mdpi.com/article/10.3390/genes16101139/s1. Table S1: Functional annotation of KEGG pathways, HPOs, GO-BPs, and MPOs. Table S2. Protein–protein interactions and node properties.

Author Contributions

Conceptualization, M.N.C. and L.L.; methodology, M.N.C. and L.L.; validation, L.L. and A.K.B.; formal analysis, M.N.C., L.L. and A.K.B.; data curation, M.N.C. and L.L.; writing—original draft preparation, M.N.C.; writing—review and editing, M.N.C., A.K.B., L.L. and T.G.F.; project administration, M.N.C. and L.L.; funding acquisition, M.N.C. All authors have read and agreed to the published version of the manuscript.

Funding

Collection of PPI data was funded by 5R01DA020677, with a subaward to MN Cook.

Institutional Review Board Statement

The manuscript includes new analyses of existing datasets. The original animal study was approved by the University of Memphis Institutional Animal Care and Use Committee under protocol #0631, 2/02/07-2/01/2010, Cook, M.N.

Informed Consent Statement

Not applicable.

Data Availability Statement

The publicly archived dataset for PPI is available on GeneNetwork, https://genenetwork.org/. The PPI traits analyzed in this paper are GN Trait 11428, GN Trait 11427, and GN 11426. The gene expression datasets examined include the following: GN135: prefrontal cortex mRNA: VCU BXD PFC Sal M430 2.0 (Dec 06) RMA; GN112: hippocampus mRNA: Hippocampus Consortium M430v2 (June06) PDNN; GN377: striatum mRNA: BIDMC/UTHSC Dev Striatum P3 ILMv6.2 (Nov11) RankInv; GN156: VCU BXD NAc Sal M430 2.0 (Oct07) RMA; GN381: midbrain mRNA: VCU BXD Midbrain Agilent SurePrint G3 Mouse GE (May12) Quantile; GN228: ventral tegmental area mRNA: VCU BXD VTA Sal M430 2.0 (Jun09) RMA; GN323: amygdala mRNA: INIA Amygdala Cohort Affy MoGene 1.0ST (Mar11) RMA; and GN281: hypothalamus mRNA: INIA Hypothalamus Affy MoGene 1.0ST (Nov10) RMA. These are also publicly available on GeneNetwork. The RNA-seq dataset is GSE202537.

Acknowledgments

We have previously reported the existence of and details on the collection of this PPI dataset [33], but have not previously published any behavioral or mapping analyses of this dataset. The authors acknowledge the help of David Ashbrook in identifying Atad1 sequence variants. The authors have reviewed and edited the output and take full responsibility for the content of this publication.

Conflicts of Interest

Drs. Bajpai, Freels, Lu, and Cook reported no biomedical financial interests or potential conflicts of interest.

Abbreviations

The following abbreviations are used in this manuscript:
PPIPrepulse Inhibition
QTLQuantitative Trait Locus
BXD RIB6 × D2 Recombinant Inbred Strain
B6C57/BL6
D2DBA2/J
PheWASPhenome-Wide Association Study
GNGeneNetwork
LRSLikelihood Ratio Statistic
Atad1ATPase family, AAA domain containing 1, also known as thorase
PFCPrefrontal Cortex
HIPPHippocampus
STRStriatum
NAcNucleus Accumbens
MDBMidbrain
VTAVentral Tegmental Area
AMYGAmygdala
HYPOHypothalamus
GRIA2Glutamate Ionotropic Receptor AMPA type 2 subunit
ASNA1Arsenical Pump-Driving ATPase 1
GWASGenome-Wide Association Study
Disc1Disrupted in Schizophrenia 1
Nrg1Neuregulin 1
ChrChromosome
SNPSingle-Nucleotide Polymorphism
GEMMAGenome-Wide Efficient Mixed-Model Analysis
LODLogarithm Odds
MGIMouse Genome Informatics
RGDRat Genome Database
IMPCInternational Mouse Phenotyping Consortium
KEGGKyoto Encyclopedia of Genes and Genomes
mRNAMessenger RNA
RMARobust Multi-Array Average
STRINGSearch Tool for the Retrieval of Interacting Genes/Proteins
GEOGene Expression Omnibus
Prkg1Protein Kinase cGMP-dependent type 1
RnlsRenalase, FAD Dependent Amine Oxidase
Asah2N-acylsphingosine amidohydrolase 2
Papss23′-phosphoadenosine 5′ phosphosulfate synthase 2
Ifit1Interferon-induced protein with tetratricopeptide repeats 1
Cdc37l1Cell Division cycle 37 homolog-like 1
Ak3Adenylate Kinase 3
Ranbp6RAN binding protein 6
Ifit1bl2Interferon-induced protein with tetratricopeptide repeats 1B like 2
MPOMammalian Phenotype Ontology
GO-BPGene Ontology Biological Processes
HPOHuman Phenotype Ontology
FDRFalse Discovery Rate
NDNode Degree
EEDEmbryonic Ectoderm Development
TIA1Cytotoxic Granule-Associated RNA binding protein 1
RGS14Regulator of G protein Signaling 14
DLG4Discs Large Homolog 4
ZBTB7BZinc finger and BTB domain containing 7B
GRIA2Glutamate Ionotropic Receptor AMPA type subunit 2
bpBase pair
UTRUntranslated Region
PCAPrincipal Component Analysis
Fabp7Fatty acid binding protein 7
Ptpn5Tyrosine-Protein-Phosphatase Non-receptor Type 5
APBB1lPAmyloid Beta Precursor Protein Binding Family B Member 1 Interacting Protein
AMPARAMPA receptor 
LTDLong-Term Depression
cKOConditional Knockout
GRIP1AMPAR/Glutamate Interacting-Protein 1

References

  1. Regier, D.; Narrow, W.E.; Rae, D.S.; Manderscheid, R.W.; Locke, B.Z.; Goodwin, F.K. The de facto mental and addictive disorders service system. Epidemiologic catchment area prospective 1-year prevalence rates of disorders and services. Arch. Gen. Psychiatry 1993, 50, 85–94. [Google Scholar] [CrossRef] [PubMed]
  2. Vawter, M.P.; Mamdani, F.; Macciardi, F. An integrative functional genomics approach for discovering biomarkers in schizophrenia. Brief. Funct. Genom. 2011, 10, 387–399. [Google Scholar] [CrossRef] [PubMed]
  3. American Psychiatric Association. What Is Schizophrenia. 2018. Available online: https://www.psychiatry.org/patients-families/schizophrenia/what-is-schizophrenia (accessed on 13 April 2018).
  4. Crowley, J.J.; Sakamoto, K. Psychiatric Genomics: Outlook for 2015 and challenges for 2020. Curr. Opin. Behav. Sci. 2015, 2, 102–107. [Google Scholar] [CrossRef]
  5. Schizophrenia Working Group of the Psychiatric Genomics Consortium. Biological insights from 108 schizophrenia-associated genetic loci. Nature 2014, 511, 421–427. [Google Scholar] [CrossRef]
  6. Trubetskoy, V.; Pardiñas, A.F.; Qi, T.; Panagiotaropoulou, G.; Awasthi, S.; Bigdeli, T.B.; Bryois, J.; Chen, C.-Y.; Dennison, C.A.; Hall, L.S.; et al. Mapping genomic loci implicates genes and synaptic biology in schizophrenia. Nature 2022, 604, 502–508. [Google Scholar] [CrossRef]
  7. Cardno, A.G.; Marshall, E.J.; Coid, B.; Macdonald, A.M.; Ribsheter, T.R.; Davies, N.J.; Venturi, P.; Jones, L.A.; Lewis, S.W.; Sham, P.C.; et al. Heritability estimates for psychotic disorders: The Maudsley Twin Psychosis Series. Arch. Gen. Psychiatry 1999, 56, 162–168. [Google Scholar] [CrossRef]
  8. Sullivan, P.F.; Kendler, K.S.; Neale, M.C. Schizophrenia as a complex trait. Arch. Gen. Psychiatry 2003, 60, 1187–1192. [Google Scholar] [CrossRef] [PubMed]
  9. Hilker, R.; Helenius, D.; Fagerlund, B.; Skytthe, A.; Christensen, K.; Werge, T.M.; Nordentoft, M.; Glenthøj, B. Heritability of schizophrenia and schizophrenia spectrum based on the nationwide Danish twin register. Biol. Psychiatry 2017, 83, 492–498. [Google Scholar] [CrossRef]
  10. Roussos, P.; Giakoumaki, S.G.; Zouraraki, C.; Fullard, J.F.; Karagiorga, V.-E.; Tsapakis, E.-M.; Petraki, Z.; Siever, L.J.; Lencz, T.; Malhotra, A.; et al. The Relationship of Common risk variants and polygenic risk for schizophrenia to sensorimotor gating. Biol. Psychiatry 2015, 79, 988–996. [Google Scholar] [CrossRef]
  11. Anokhin, A.P.; Health, A.C.; Myers, E.; Ralano, A.; Wood, S. Genetic influences on prepulse inhibition of startle reflex in humans. Neurosci. Lett. 2003, 353, 45–48. [Google Scholar] [CrossRef]
  12. Hasenkamp, W.; Epstein, M.P.; Green, A.; Wilcox, L.; Boshoven, W.; Lewison, B.; Duncan, E. Heritability of acoustic startle magnitude, prepluse inhibition, and startle latency in schizophrenia and control families. Psychiatry Res. 2010, 175, 236–243. [Google Scholar] [CrossRef]
  13. Takahashi, H.; Hashimoto, R.; Iwase, M.; Ishii, R.; Kamio, Y.; Takeda, M. Prepulse inhibition of startle response: Recent advances in human psychiatric disease. Clin. Psychopharmacol. Neurosci. 2011, 9, 102–111. [Google Scholar] [CrossRef]
  14. Light, G.; Greenwood, T.A.; Swerdlow, N.R.; Calkins, M.E.; Freedman, R.; Green, M.F.; Gur, R.E.; Gur, R.C.; Lazzeroni, L.C.; Nuechterlein, K.H.; et al. Comparison of the heritability of schizophrenia and endophenotypes in the COGS-1 family study. Schizophr. Bull. 2014, 4, 1404–1411. [Google Scholar] [CrossRef] [PubMed]
  15. Greenwood, T.A.; Light, G.A.; Swerdlow, N.R.; Calkins, M.E.; Green, M.F.; Gurr, R.E.; Gur, R.C.; Lazzeroni, L.C.; Nuechterlein, K.H.; Olincy, A.; et al. Gating deficit heritability and correlation with increased clinical severity in schizophrenia with positive family history. Am. J. Psychiatry 2016, 173, 385–391. [Google Scholar] [CrossRef] [PubMed]
  16. San-Martin, R.; Zimiani, M.I.; Vendramini de Ávila, M.A.; Shumama, R.; Del-Ben, C.M.; Menezes, P.R.; Fraga, F.J.; Salum, C. Early Schizophrenia and bipolar disorder patients display reduced neural prepulse inhibition. Brain Sci. 2022, 12, 93. [Google Scholar] [CrossRef] [PubMed]
  17. Desbonnet, L.; Waddington, J.L.; O’Tuatiagh, C.M.P. Mutant models for genes associated with schizophrenia. Biochem. Soc. Trans. 2009, 37, 308–312. [Google Scholar] [CrossRef]
  18. Swerdlow, N.R.; Braff, D.L.; Geyer, M.A. Sensorimotor gating of the startle reflex: What we said 25 Years Ago, what has happened since then, and what comes next. Psychopharmacology 2016, 30, 1072–1081. [Google Scholar] [CrossRef]
  19. Jafari, Z.; Kolb, B.E.; Mohajerani, M.H. Prepusle inhibition of the acoustic startle reflex and P50 gating in aging and alzheimer’s disease. Ageing Res. Rev. 2020, 59, 101028. [Google Scholar] [CrossRef]
  20. Kohl, S.; Heekeren, K.; Klosterköotter, J.; Kuhn, J. Prepulse inhibition in psychiatric disorders-apart from schizophrenia. J. Psychiatr. Res. 2013, 47, 445–452. [Google Scholar] [CrossRef]
  21. Crawley, J.N.; Paylor, R. A proposed test battery and constellations of specific behavioral paradigms to Investigate the behavioral phenotypes of transgenic and knockout mice. Horm. Behav. 1997, 31, 197–211. [Google Scholar] [CrossRef]
  22. Swerdlow, N.R.; Geyer, M.A. Using an animal model of deficient sensorimotor gating to study the pathophysiology and new treatments of schizophrenia. Schizophr. Bull. 1998, 24, 285–301. [Google Scholar] [CrossRef] [PubMed]
  23. Petryshen, T.L.; Kirby, A.; Hammer, R.P., Jr.; Purcell, S.; O’Leary, S.B.; Singer, J.B.; Hill, A.E.; Nadeau, J.H.; Daly, M.J.; Sklar, P. Two quantitative trait loci for prepulse inhibition of startle identified on mouse chromosome 16 using chromosome substitution strains. Genetics 2005, 171, 1896–1904. [Google Scholar] [CrossRef]
  24. Leussis, M.P.; Frayne, M.L.; Saitor, M.; Berry, E.M.; Aldinger, K.A.; Rockwell, G.N.; Hammer , R.P., Jr.; askin-Hill, A.E.; Singer, J.B.; Nadeau, J.H.; et al. Genomic survey of prepulse inhibition in mouse chromosome substitution strains. Genes Brain Behav. 2009, 8, 806–816. [Google Scholar] [CrossRef] [PubMed]
  25. Joober, R.; Zarate, J.-M.; Rouleau, G.-A.; Skamene, E.; Boska, P. Provisional mapping of quantitative trait loci modulating the acoustic startle response and prepulse inhibition of acoustic startle. Neuropsychopharmacology 2002, 27, 765–781. [Google Scholar] [CrossRef] [PubMed]
  26. Hitzemann, R.; Malmanger, B.; Belknap, J.; Darakjian, P.; McWeeny, S. Short-term selective breeding for high and low prepulse inhibition of the acoustic startle response: Pharmacological characterization and QTL mapping in the selected lines. Pharmacol. Biochem. Behav. 2008, 90, 525–533. [Google Scholar] [CrossRef]
  27. Watanabe, A.; Toyota, T.; Owada, Y.; Hayashi, T.; Iyayama, Y.; Matsumata, M.; Ishitsuka, Y.; Nakaya, A.; Maekawa, M.; Ohnishi, T.; et al. Fabp7 maps to a quantitative trait locus for a schizophrenia endophenotype. PLoS Biol. 2007, 5, e297. [Google Scholar] [CrossRef]
  28. Sittig, L.J.; Carbonetto, P.; Engel, K.A.; Krauss, K.S.; Palmer, A.A. Integration of genome-wide association and extant brain expression QTL identifies candidate genes influencing prepuluse inhibition in F1 mice. Genes Brain Behav. 2016, 15, 260–270. [Google Scholar] [CrossRef]
  29. Samocha, K.E.; Lim, J.E.; Cheng, R.; Sokoff, G.; Palmer, A.A. Fine Mapping of QTL for Prepulse inhibition in LG/J and SM/J mice using F2 and advance intercross lines. Genes Brain Behav. 2010, 9, 759–767. [Google Scholar] [CrossRef]
  30. Loos, M.; Staal, J.; Pattij, T.; Neuro-BSK Mouse Phenome Consortium; Smit, A.B.; Spijker, S. Independent genetic loci for sensorimotor gating and attentional performance in BXD recombinant inbred strains. Genes Brain Behav. 2012, 11, 147–156. [Google Scholar] [CrossRef]
  31. Belknap, J.K.; Mitchell, S.R.; O’Toole, L.A.; Helms, M.L.; Crabbe, J.C. Type I and Type II error rates for quantitative trait loci (QTL) mapping studies using recombinant inbred mouse strains. Behav. Genet. 1997, 26, 149–160. [Google Scholar] [CrossRef]
  32. Peirce, J.; Lu, L.; Gu, J.; Silver, L.M.; Williams, R.W. A new set of BXD recombinant inbred lines from intercross populations in mice. BMC Genet. 2004, 5, 7. [Google Scholar] [CrossRef]
  33. Philip, V.M.; Duvvuru, S.; Gomero, B.; Ansah, T.A.; Blaha, C.D.; Cook, M.N.; Hamre, K.M.; Lariviere, W.R.; Matthews, D.B.; Mittleman, G.; et al. High-throughput behavioral phenotyping in the expanded panel of BXD recombinant inbred strains. Genes Brain Behav. 2010, 9, 129–159. [Google Scholar] [CrossRef]
  34. Cook, M.N.; Dunning, J.P.; Wiley, R.G.; Chesler, E.J.; Johnson, D.K.; Miller, D.R.; Goldowitz, D. Neurobehavioral mutants identified in an ENU mutagenesis project. Mamm. Genome 2007, 18, 559–572. [Google Scholar] [CrossRef]
  35. Churchill, G.A.; Doerge, R.W. Empirical threshold values for quantitative trait mapping. Genetics 1994, 138, 963–971. [Google Scholar] [CrossRef]
  36. Sul, J.H.; Kostem, E.; Furlotte, N.; He, D.; Eskin, E. Accounting for population structure in gene-by-environment interactions in genome-wide association studies using mixed models. PLoS Genet. 2015, 12, e1005849. [Google Scholar] [CrossRef] [PubMed]
  37. Zhou, X.; Stephens, M. Genome-wide efficient mixed-model analysis for association studies. Nat. Genet. 2012, 44, 821–824. [Google Scholar] [CrossRef] [PubMed]
  38. Alberts, R.; Schughart, K. QTLminer: Identifying genes regulating quantitative traits. BMC Bionform. 2010, 11, 516. [Google Scholar] [CrossRef]
  39. Zhou, X.; Zhao, Y.; Baker, J.A.; Gu, Q.; Hamre, K.M.; Yue, J.; Jones, B.C.; Cook, M.N.; Lu, L. The effect of alcohol on the differential expression of cluster of differentiation 14 genes, associated pathways, and genetic network. PLoS ONE 2017, 12, e0178689. [Google Scholar] [CrossRef] [PubMed]
  40. Cook, M.N.; Baker, J.A.; Heldt, S.; Williams, R.W.; Hamre, K.M.; Lu, L. Identification of candidate genes that underlie the QTL on chromomsome 1 mediates genetic differences in stress-ethanol interactions. Physiol. Genom. 2015, 47, 308–317. [Google Scholar] [CrossRef]
  41. Smith, C.L.; Blake, J.A.; Kadin, J.A.; Richardson, J.E.; Bult, C.J. Mouse Genome Database Group. Mouse Genome Database (MGD) -2018: Knowledgebase for the laboratory mouse. Nucleic Acids Res. 2018, 46, D836–D842. [Google Scholar] [CrossRef]
  42. Smith, J.R.; Hayman, G.T.; Wang, S.-J.; Faulederkind, S.J.F.; Hoffman, M.J.; Kaldunski, M.L.; Tutaj, M.; Thota, J.; Nalabolu, H.S.; Ellanki, S.L.R.; et al. The year of the rat: The rat genome database at 20: A multi-species knowledgebase and analysis platform. Nucleic Acids Res. 2020, 48, D731–D742. [Google Scholar] [CrossRef]
  43. Groza, T.; Gomez, F.L.; Mashhadi, H.H.; Munõz-Fuentes, V.; Gunes, O.; Wilson, R.; Cacheiro, P.; Frost, A.; Keskivali-Bond, P.; Vardal, B.; et al. The International Mouse Phenotyping Consortium: Comprehensive knockout phenotyping underpinning the study of human disease. Nucleic Acids Res. 2023, 51, D1045–D1308. [Google Scholar] [CrossRef]
  44. Buniello, A.; MacArthur, J.A.L.; Cerezo, M.; Harris, L.W.; Hayhurst, J.; Malangone, C.; McMahon, A.; Morales, J.; Mountjoy, E.; Sollis, E.; et al. The NHGRI-EBI GWAS Catalog of published genome-wide association studies, targeted arrays and summary statistics 2019. Nucleic Acids Res. 2019, 47, D1005–D1012. [Google Scholar] [CrossRef]
  45. Kaneshia, M.; Goto, S.; Kawashima, S.; Nakaya, A. The KEGG database at GenomeNet. Nucleic Acids Res. 2002, 30, 42–46. [Google Scholar] [CrossRef]
  46. Homayouni, R.; Heinrich, K.; Wei, K.; Berry, M.W. Gene clustering by latent semantic indexing of MEDLINE abstracts. Bioinformatics 2005, 21, 104–115. [Google Scholar] [CrossRef] [PubMed]
  47. Benjamini, Y.; Hochberg, Y. Controlling the false discovery rate: A practical and powerful approach to multiple testing. JR Stat. Soc. 1995, 57, 289–300. [Google Scholar] [CrossRef]
  48. Zhou, Y.; Zhou, B.; Pache, L.; Chang, M.; Khodabakhshi, A.H.; Tanaseichuk, O.; Benner, C.; Chanda, S.K. Metascape provides a biologist-oriented resource for the analysis of systems-level datasets. Nat. Commun. 2019, 10, 1523. [Google Scholar] [CrossRef] [PubMed]
  49. Xu, F.; Gao, J.; Bergman, S.; Sims, A.C.; Ashbrook, D.G.; Baric, R.S.; Cui, Y.; Jonsson, C.B.; Li, K.; Williams, R.W.; et al. Genetic Dissection of the Regulatory Mechanisms of Ace2 in the Infected Mouse Lung. Front. Immunol. 2020, 11, 3332. [Google Scholar] [CrossRef] [PubMed]
  50. Chundri, A.; Watson, P.M.; Ashbrook, D.G. New Insights on Gene by Environment Effects of Drug Abuse in Animal Models Using GeneNetwork. Genes 2022, 13, 614. [Google Scholar] [CrossRef]
  51. Watanabe, K.; Stringer, S.; Frei, O.; Mirkov, M.U.; de Leeuw, C.; Polderman, T.J.C.; van der Sluis, S.; Andreassen, O.A.; Neale, B.M.; Posthuma, D. A global view of pleitropy and genetic architecture in complex traits. Nat Genet. 2019, 51, 1339–1348. [Google Scholar] [CrossRef]
  52. Szklarczyk, D.; Gable, A.L.; Nastou, K.C.; Lyon, D.; Kirsch, R.; Pyysalo, S.; Doncheva, N.T.; Legeay, M.; Fang, T.; Bork, P.; et al. The STRING database in 2021: Customizable protein-protein networks, and functional characterization of user-uploaded gene/measurement sets. Nucleic Acids Res. 2021, 49, D60–D612. [Google Scholar] [CrossRef]
  53. Bajpai, A.K.; Davuluri, S.; Tiwary, K.; Narayanan, S.; Oguru, S.; Basavaraju, K.; Dayalan, D. Systematic comparison of the protein-protein interaction databases from a user’s perspective. J. Biomed. Inform. 2020, 103, 103380. [Google Scholar] [CrossRef] [PubMed]
  54. Shannon, P.; Markiel, A.; Ozier, O.; Baliga, N.S.; Wang, J.T.; Ramage, D.; Amin, N.; Schwikowski, B.; Ideker, T. Cytoscape: A software environment for integrated models of biomolecular interaction networks. Genome Res. 2003, 11, 2450–2498. [Google Scholar] [CrossRef] [PubMed]
  55. Barrett, T.; White, S.E.; Ledoux, P.; Evangelista, C.; Kim, I.F.; Tomashevsky, M.; Marshall, K.A.; Phillippy, K.H.; Sherman, P.M.; Holko, M.; et al. NCBI GEO: Archive for functional genomics data sets—Update. Nucleic Acids Res. 2013, 41, D991–D995. [Google Scholar] [CrossRef] [PubMed]
  56. Ketchesin, K.D.; Zong, W.; Hildebrand, M.A.; Scott, M.R.; Seney, M.L.; Cahill, K.M.; Shankar, V.G.; Glausier, J.R.; Lewis, D.A.; Tseng, G.C.; et al. Diurnal Alterations in Gene Expression Across striatal subregions in psychosis. Biol. Psychiatry 2022, 93, 137–148. [Google Scholar] [CrossRef]
  57. Kim, D.; Langmead, B.; Salzberg, S.L. HISAT: A fast spliced aligner with low memory requirements. Nat. Methods 2015, 12, 357–360. [Google Scholar] [CrossRef]
  58. Anders, S.; Pyl, P.T.; Huber, W. HTSeq—A Python framework to work with high-throughput sequencing data. Bioinformatics 2015, 31, 166–169. [Google Scholar] [CrossRef]
  59. Love, M.I.; Huber, W.; Anders, S. Moderated estimation of fold change and dispersion for RNA-seq data with DESeq2. Genome Biol. 2014, 15, 550. [Google Scholar] [CrossRef] [PubMed]
  60. Swerdlow, N.R.; Light, G.A.; Thomas, M.L.; Sprock, J.; Calkins, M.E.; Green, M.F.; enwood, T.A.; Gur, R.E.; Gur, R.C.; Lazzeroni, L.C.; et al. Deficient prepulse inhibition in schizophrenia in a multi-site cohort: Internal replication and extension. Schizophr. Res. 2007, 17, S0920–S9964. [Google Scholar] [CrossRef]
  61. Uezato, A.; Kimura-Sato, J.; Yamamoto, N.; Iijima, Y.; Kunugi, H.; Nishikawa, T. Further evidence for a male-selective genetic association of synapse-associated protein 97 (SAP97) gene with schizophrenia. Behav. Brain Funct. 2012, 8, 2. [Google Scholar] [CrossRef] [PubMed]
  62. Johnson, K.R.; Longo-Guess, C.; Gagnon, L.H.; Yu, H.; Zheng, Q.Y. A locus on distal chromosome 11 (ahl8) and it interactions with Cd23 ahl underlie the early onset, age-related hearing loss in DBA/2J mice. Genomics 2008, 92, 219–225. [Google Scholar] [CrossRef] [PubMed]
  63. Zheng, Q.Y.; Kui, L.; Xu, F.; Zheng, T.; Li, B.; McCarty, M.; Sun, Z.; Zhang, A.; Liu, L.; Starland-Davenport, A.; et al. An Age-Related Hearing Protection Locus on Chromosome 16 of BXD Strain Mice. Neural Plast. 2020, 2020, 8889264. [Google Scholar] [CrossRef]
  64. Nagtegaal, A.P.; Spijker, S.; Crins, T.T.H.; Neuro-Bsik Mouse Phenomics Consortium; Bort, J.G.G. A novel QTL underlying early-onset frequency hearing loss in BXD recombinant inbred strains. Genes Brain Behav. 2014, 11, 911–920. [Google Scholar] [CrossRef]
  65. Johnson, K.R.; Longo-Guess, C.; Gagnon, L.H. A QTL on Chr 5 modified hearing loss associated with the fascin-2 variant of DBA/2J mice. Mamm. Genome 2015, 26, 338–347. [Google Scholar] [CrossRef]
  66. Pelov, I.; Teltsh, O.; Greenbaum, L.; Rigbi, A.; Kanyas-Sarner, K.; Lerer, B.; Lombroso, P.; Kohn, Y. Involvement of PTPN5, the gene encoding the STriatal-Enriched protein tyrosine Phosphatase (STEP), in schizophrenia and cognition. Psychiatr. Genet. 2012, 22, 168–176. [Google Scholar] [CrossRef]
  67. Luo, X.; Huang, L.; Jia, P.; Li, M.; Su, B.; Zhao, Z.; Gan, L. Protein-protein interaction pathway analyses of top schizophrenia genes reveal schizophrenia susceptibility genes converge on common molecular networks and enrichment of nucleosome (chromatin) assembly genes in schizophrenia susceptibility loci. Schizophr. Bull. 2014, 40, 39–49. [Google Scholar] [CrossRef]
  68. Ludewig, K.; Geyer, M.A.; Etzensberger, M.; Vollenweider, F.X. Stability of the acoustic startle reflex: Prepulse inhibition, and habituation in schizophrenia. Schizophr. Res. 2002, 55, 129–137. [Google Scholar] [CrossRef] [PubMed]
  69. Rovnỷ, R.; Besterciová, D.; Riečanskỷ, I. Genetic determinants of gating functions: Do we get closer to understanding schizophrenia etiopathogenesis? Front. Psychiatry 2020, 11, 550225. [Google Scholar] [CrossRef]
  70. Kirby, B.P.; Waddington, J.L.; O’Tuathiagh, C.M.P. Advancing a functional genomics for schizophrenia: Psychopathophysiological and cognitive phenotypes in mutants with gene disruption. Brain Res. Bull. 2010, 83, 162–176. [Google Scholar] [CrossRef]
  71. O’Tuathiagh, C.M.P.; Waddington, J.L. Mutant mouse models: Phenotypic relationships to domains of psychopathology and pathobiology in schizophrenia. Schizophr. Bull. 2010, 36, 243–245. [Google Scholar] [CrossRef]
  72. Greenwood, T.A.; Light, G.A.; Swerdlow, N.R.; Radant, A.D.; Braff, D.L. Association analysis of 94 candidate genes and schizophrenia-related endophenotypes. PLoS ONE 2012, 7, e29630. [Google Scholar] [CrossRef]
  73. Kauppi, K.; Rosenthal, S.B.; Lo, M.-T.; Sanyani, N.; Jiang, M.; Abagyan, R.; McEvoy, L.K.; Andreassen, O.A.; Chen, C.-H. Revisiting antipsychotic drug actions through gene networks associated with schizophrenia. Am. J. Psychiatry 2018, 175, 674–682. [Google Scholar] [CrossRef]
  74. Mistry, M.; Gillis, J.; Pavlidis, P. Meta-analysis of gene coexpression networks in the post-mortem prefrontal cortex of patients with schizophrenia and unaffected controls. BMC Neurosci. 2013, 14, 105. [Google Scholar] [CrossRef] [PubMed]
  75. Balan, S.; Ohnishi, T.; Watanabe, A.; Ohba, H.; Iwayama, Y.; Toyoshima, M.; Hara, T.; Hisano, Y.; Miyasaka, Y.; Toyota, T.; et al. Role of an atypical cadherin gene, Cdh23 in prepulse inhibition, and implication of CDH23 in schizophrenia. Schizophr. Bull. 2021, 47, 1190–1200. [Google Scholar] [CrossRef]
  76. Ashbrook, D.G.; Cahill, S.; Hager, R. A cross-species systems genetic analysis links APBB1lP as a candidate gene for schizophrenia and prepulse inhibition. Front. Behav. Neurosci. 2019, 13, 266. [Google Scholar] [CrossRef] [PubMed]
  77. Gao, Y.; Li, Y.; Li, S.Y.; Liang, X.; Ren, Z.; Yang, Z.; Zhang, B.; Hu, Y.; Yang, X. Systematic discovery of signaling pathways linking immune activation to schizophrenia. iScience 2021, 24, 103209. [Google Scholar] [CrossRef] [PubMed]
  78. Hayashi-Takagi, A.; Sawa, A. Disturbed synaptic connectivity in schizophrenia: Convergence of genetic risk factors during neurodevelopment. Brain Res. Bull. 2010, 83, 140–146. [Google Scholar] [CrossRef]
  79. Kessels, W.; Malinow, R. Synaptic AMPA receptor plasticity and behavior. Neuron 2009, 61, 340–350. [Google Scholar] [CrossRef]
  80. Yan, H.-H.; He, J.-J.; Fu, C.; Chen, J.-H.; Tang, A.-H. ATAD1 regulates neuronal development and synapse formation through tuning mitochondrial function. Int. J. Mol. Sci. 2025, 26, 44. [Google Scholar] [CrossRef]
  81. Zhang, J.; Wang, Y.; Chi, Z.; Keuss, M.J.; Pai, Y.-M.E.; Kang, H.C.; Shin, J.-H.; Bugayenko, A.; Wang, H.; Xiong, Y.; et al. The AAA+ ATPase, thorase regulates AMPA receptor-dependent synaptic plasticity and behavior. Cell 2011, 145, 284–299. [Google Scholar] [CrossRef]
  82. Keifer, J.; Zheng, Z. AMPA receptor trafficking and learning. Eur. J. Neurosci. 2010, 32, 269–277. [Google Scholar] [CrossRef] [PubMed]
  83. Pignatelli, M.; Umanah, G.K.E.; Ribeiro, S.P.; Dawson, V.L.; Dawson, T.; Bonci, A. Synaptic plasticity onto dopamine neurons shapes fear learning. Neuron 2017, 93, 425–440. [Google Scholar] [CrossRef] [PubMed]
  84. Umanah, G.K.E.; Pignatelli, M.; Yin, X.; Chen, R.; Crawford, J.; Neifert, S.; Scarffe, L.; Behensky, A.A.; Guiberson, N.; Chang, M.; et al. Thorase variants are associated with defects in glutamatergic neurotransmission that can be rescued by perampanel. Sci. Transl. Med. 2017, 9, eeah4985. [Google Scholar] [CrossRef]
  85. Steri, M.; Idda, M.L.; Whalen, M.B.; Orrù, V. Genetic variants in mRNA untranslated regions. Wiley Interdiscip. Rev. RNA 2018, 9, e1474. [Google Scholar] [CrossRef] [PubMed]
  86. Gao, F.; Zhang, H.; Yang, J.; Cai, M.; Yang, Q.; Wang, H.; Xu, Y.; Chen, H.; Hu, Y.; He, W.; et al. ATPase Thorase deficiency causes α-Synucleinopathy and Parkinson’s Disease-like behavior. Cells 2023, 11, 2990. [Google Scholar] [CrossRef]
  87. Schaefer, N.; Harvey, R.J.; Vilmann, C. Startle Disease: New Molecular Insights into an Old Neurological Disorder. Neuroscientist 2023, 29, 767–781. [Google Scholar] [CrossRef]
  88. Saini, A.G.; Pandey, S. Hyperexkplexia and other startle syndromes. J. Neurol. Sci. 2020, 416, 117051. [Google Scholar] [CrossRef]
  89. Craddock, K.E.; McKee, J.L.; Fitzgerald, M.; Ahrens-Nicklas, R.; Agarwal, S. Neonatal Hypertonia and Progressive Respiratory Failure due to Novel Heterozygous Mutation in ATAD1. Pediatr. Neurol. 2023, 142, 56–57. [Google Scholar] [CrossRef]
  90. Bunod, R.; Doummar, D.; Whalen, S.; Keren, B.; Chantot-Bastaraud, S.; Maincent, K.; Villy, M.-C.; Mayer, M.; Rodriguez, D.; Burglen, L.; et al. Congentital immobility and stiffness related to biallelic ATAD1 variants. Neurol. Genet. 2020, 6, e520. [Google Scholar] [CrossRef] [PubMed]
  91. Wolf, N.I.; Zschocke, J.; Jakobs, C.; Rating, D.; Hoffmnn, G.F. ATAD1 encephalopathy and stiff baby syndrome: A recognizable clinical presentation. Brain 2018, 141, e49. [Google Scholar] [CrossRef] [PubMed]
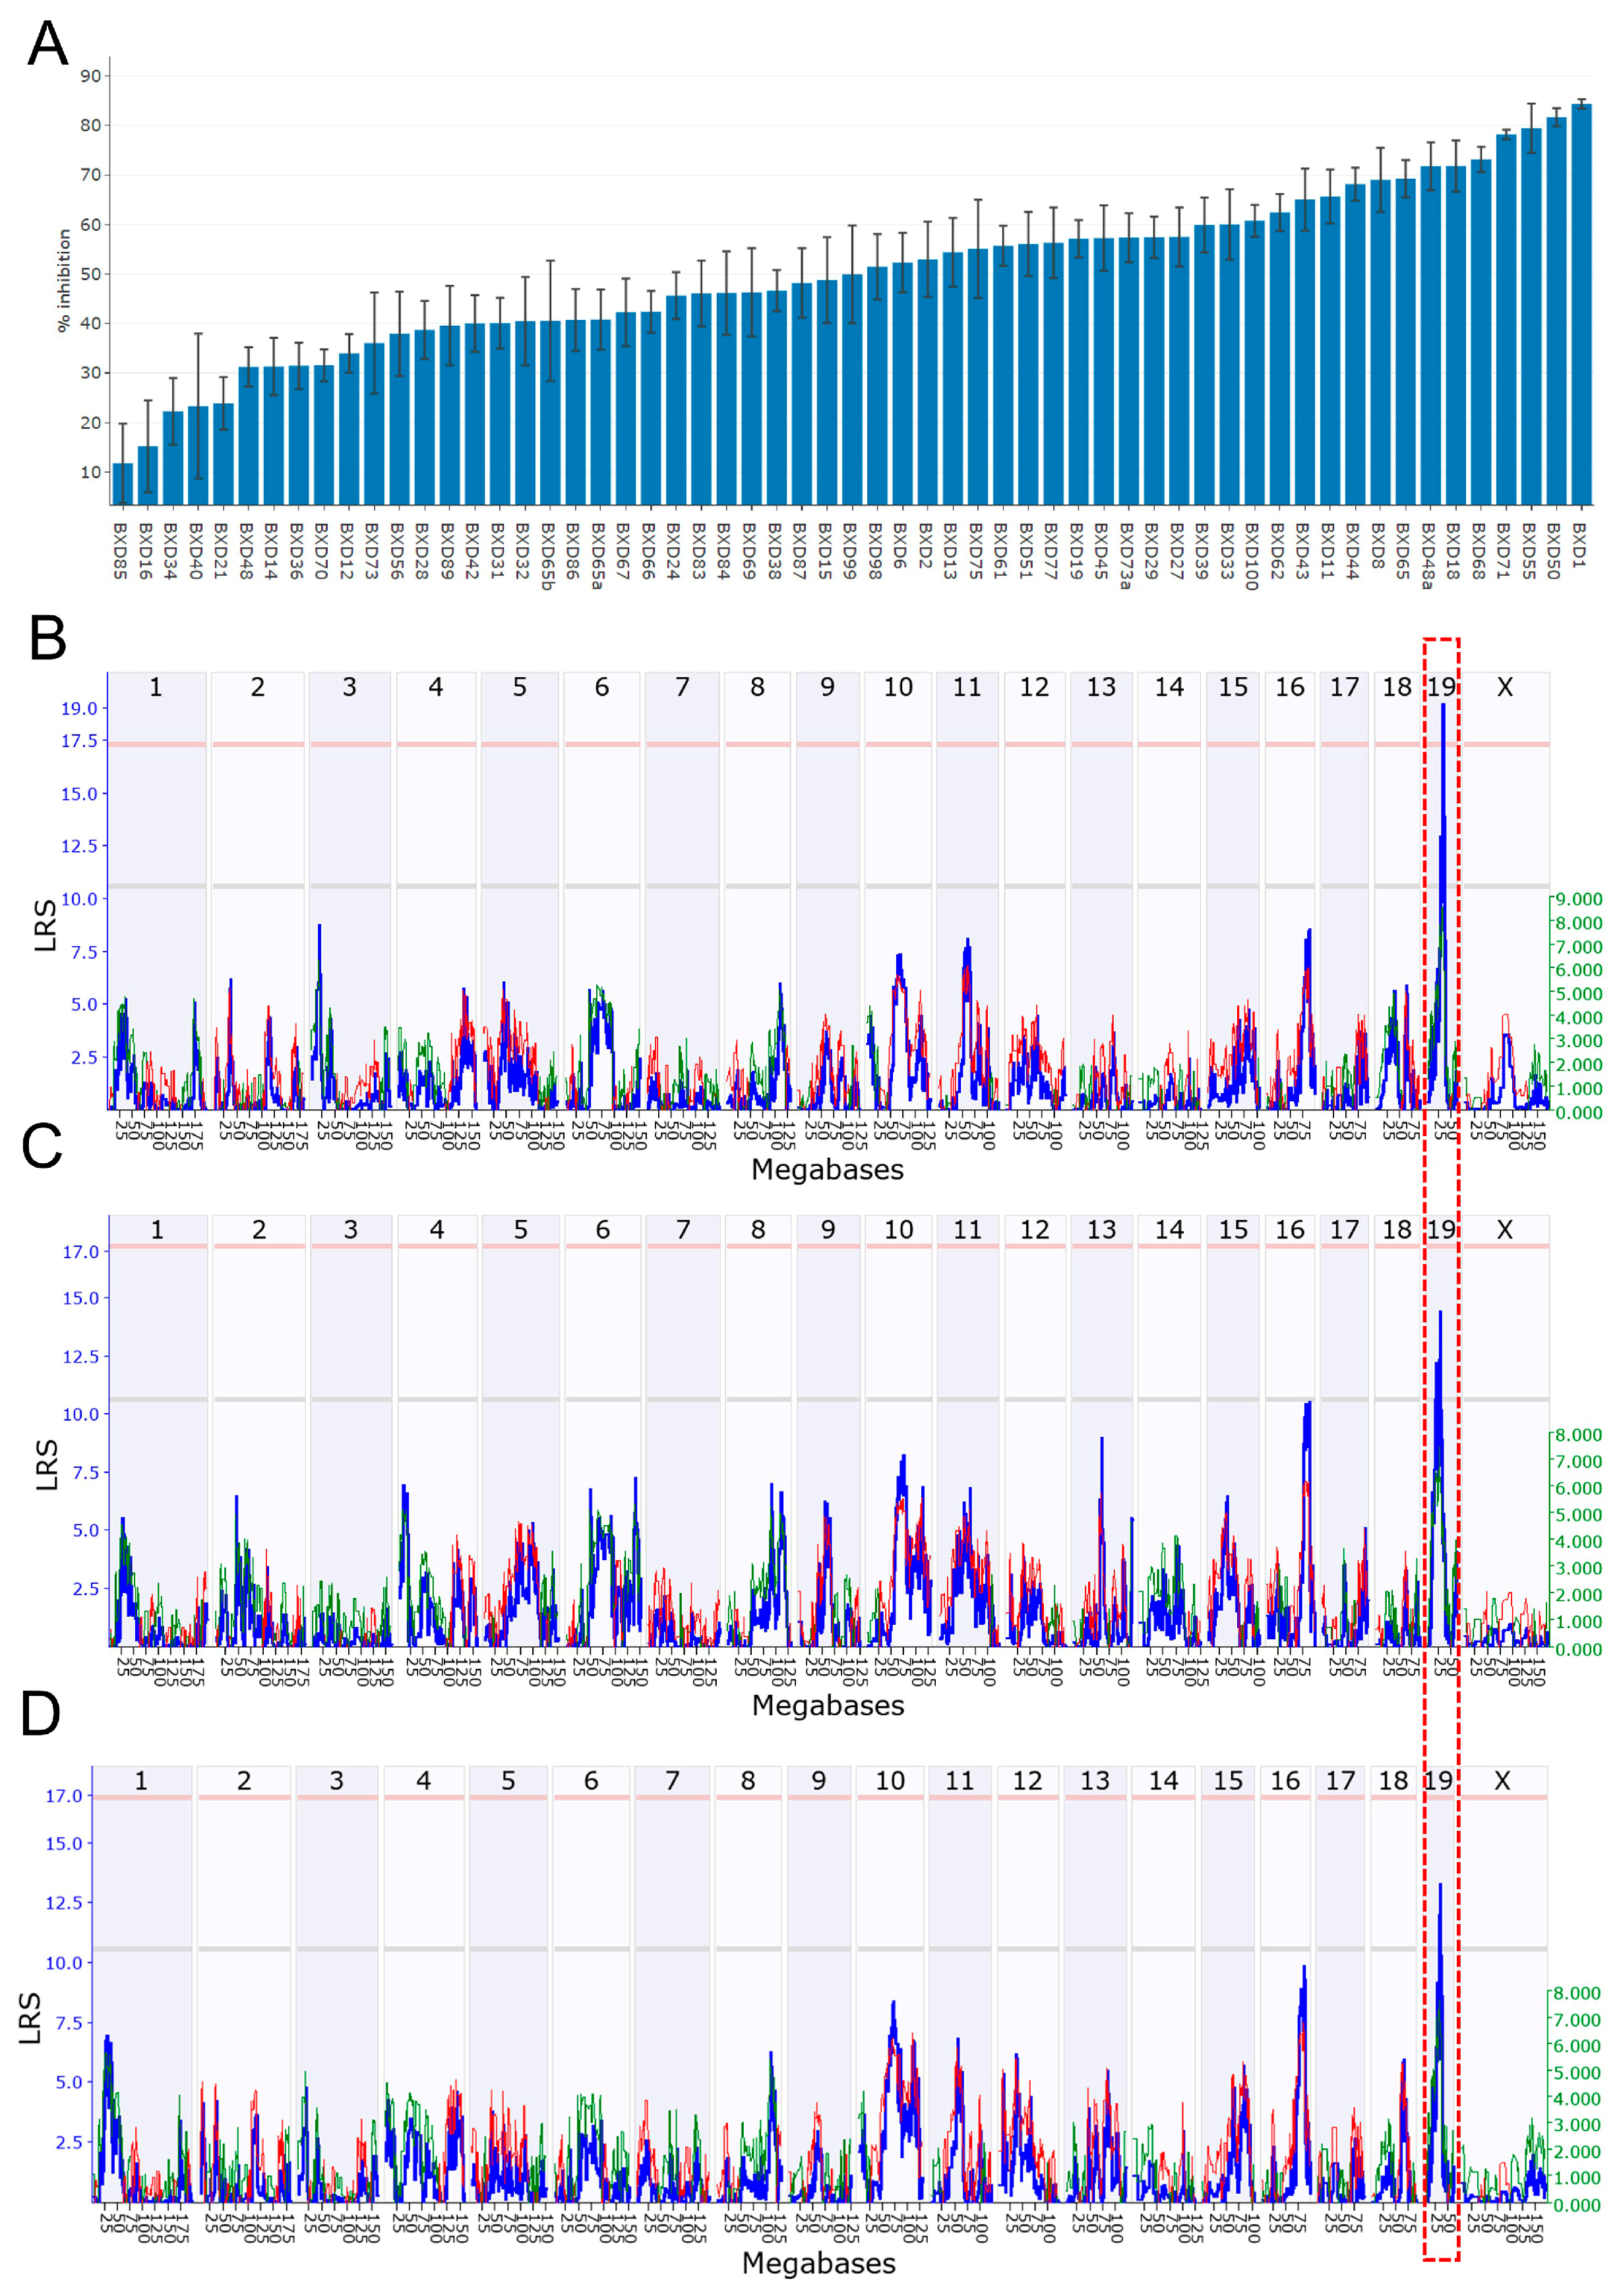
Figure 1. Genetic mapping for prepulse inhibition (PPI) percentage in BXD mice. (A) Bar plot showing %PPI in BXD mice at 85 dB. The x-axis shows the BXD strains, and the y-axis shows %PPI genomic loci mapped across all mouse chromosomes for %PPI at (B) 85 dB, (C) 70 dB, and (D) 80 dB, respectively, in male BXD mice. The x-axis indicates the genomic position, while the y-axis shows the LRS value, a measurement of the linkage between the % PPI and genomic region. One unit of LRS is equivalent to 4.61 units of “logarithm of the odds” (which is equal to −log10P likelihood ratio). The gray and red horizontal lines indicate suggestive and significant genome-wide thresholds, respectively. Suggestive QTLs were identified for % PPI at 70 and 80 dB, whereas a significant QTL was identified at 85 dB. The overlap of all the three QTLs on Chr 19 is shown with a red dotted box.
Genes 16 01139 g001
Figure 2. Functional enrichment analysis of Atad1-correlated genes. The genes correlated with Atad1 in NAc dataset were used as input in WebGestalt for enrichment analysis. Top 20 (A) KEGG pathways, (B) human phenotype ontologies (HPOs), (C) Gene Ontology biological processes (GO-BPs), and (D) mammalian phenotype ontologies (MPOs), respectively. The top 20 GO-BPs and MPOs presented here are significant with an FDR p-value < 0.001. A complete list of functional annotations is provided in Supplementary Table S1. (E) The correlated genes were uploaded into the Metscape tool to analyze the network of GO-BPs. Metascape employs a heuristic algorithm to select the most informative terms from the GO clusters obtained. More specifically, it samples the 20 top-score clusters, selects up to 10 of the best-scoring terms (lowest p-values) within each cluster, then connects all term pairs with Kappa similarity above 0.3. The nodes represent enriched GO-BP terms and are colored by their cluster IDs. The edges link similar terms. The most significant term of the cluster is displayed as a label to represent that cluster.
Genes 16 01139 g002
Figure 3. Correlation of prepulse inhibition (PPI) traits in male BXD mice with archived Atad1 expression in nucleus accumbens (NAc). % PPI at (A) 70 dB, (B) 80 dB, and (C) 85 dB is significantly negatively correlated with Atad1 expression. Correlation R and p-values are indicated in the figures. (DF): Atad1 expression difference between the “low” and “high” PPI BXD strains. The p-value based on Student’s t-test is shown above each plot. More details on traits can be found by querying GeneNetwork with the trait identifiers.
Genes 16 01139 g003
Figure 4. Protein–protein interaction network analysis of Atad1-correlated genes in the NAc dataset. (A) The protein–protein interaction network of all Atad1-correlated genes (global network). The network contains 1124 proteins (nodes/dots) and 3507 edges (interactions/lines). The network shows a high number of interactions among Atad1-correlated genes. (B) The top 10 nodes based on degree (number of interacting partners). (C) Protein–protein interaction network showing primary and secondary interactors of Atad1 (extracted from the global network presented in “panel A”). The Atad1 protein is indicated with a red border; its direct/primary interactors, Asna1 and Gria2, are indicated with black borders; and its secondary interactors, Eed and Dlg4, which have a high node degree in the global network (panel B), are indicated with yellow borders.
Genes 16 01139 g004
Figure 5. PheWAS analysis for Atad1. This analysis utilizes the Atad1 genomic region to find its associations with phenotypes measured in GWAS datasets. The PheWAS tool within GWASatlas (https://atlas.ctglab.nl/PheWAS, accessed on 15 May 2025) was used for this analysis.
Genes 16 01139 g005
Figure 6. Validation of candidate genes identified in BXD mice using schizophrenia patient RNA-seq data. (A,B) Volcano plot and heatmap showing significant differential expression of genes between schizophrenia patients and controls. (C) Box plots indicating the expression of candidate genes in patient and control groups.
Genes 16 01139 g006
Table 1. Candidate genes within the QTL region and significantly correlated with % PPI at 85 dB.
Official SymbolMean Expression ≥ 8
(Score = 1)
Non-Syn SNPs/Indels (Score = 2)Cis-Regulation (Score = 2)Sig. Phenotype Correlation (Score = 2)Functional Significance (Score = 3)Total (Score = 10)
Atad1YesYesYesYesYes10
Rnls--YesYesYesYes9
Prkg1YesYes--YesYes8
Asah2--Yes--YesYes7
Ifit1--Yes--YesYes7
Cdc3711Yes----YesYes6
Ak3Yes----YesYes6
Papps2Yes--YesYes--5
Ifit1bl2------YesYes5
Ranbp6Yes----Yes--3
Table 2. Psychiatric traits significantly associated with Atad1 based on human GWASs.
Atlas IDPMIDYearTraitp-ValueN
12242809822014Schizophrenia/bipolar disorder0.04039,202
15284391012017Post-traumatic stress disorder0.0139223
30211737762012Agreeableness (NEO-FFI)0.04717,375
1141274943212016Chronotype0.001128,266
1142274943212016Sleep duration0.045128,266
1173269558852016Chronotype (continuous)4.98 × 10−5100,420
1174269558852016Extreme chronotype0.032100,420
2018243690492014Lithium response in Bipolar I patients—Alda Scale of 7 to 80.042294
202522952603201210 mg response to amphetamine0.025381
2043273297602016Bipolar disorder0.03634,950
3230314277892019Morning/evening person (chronotype)0.040345,148
3235314277892019Current tobacco smoking0.009386,150
3262314277892019Average weekly red wine intake0.025274,058
3287314277892019Sensitivity/hurt feelings0.042375,272
3292314277892019Worry too long after embarrassment0.002370,660
3295314277892019Guilty feelings0.000376,361
3296314277892019Risk-taking0.031372,651
3297314277892019Frequency of depressed mood in last 2 weeks0.001370,017
3394314277892019Ever unenthusiastic/disinterested for a whole week0.024123,848
3567314277892019Why stopped smoking: illness or ill health0.02194,509
3655314277892019Smoking status: previous vs. current0.014177,025
3729314277892019Depression—age at first episode of depression0.00965,776
3744314277892019Cannabis use—ever taken cannabis0.012126,632
3770314277892019Depression—trouble falling or staying asleep or sleeping too much0.001126,545
3772314277892019Depression—recent feelings of tiredness or low energy0.030126,540
3775314277892019Traumatic events—able to pay rent/mortgage as an adult0.014124,944
3795299420852018Neuroticism0.015390,278
3796299420852018Depressive symptoms0.011381,455
3982294836562018Schizophrenia0.002105,318
3993295003822018Irritability (IRR)0.048260,369
3999295003822018Worry too long after embarrassment (WORR-EMB)0.001261,094
4002295003822018Guilty feelings (GUILT)0.001265,139
4014297004752018Major depressive disorder0.004173,005
4040299064482018Schizophrenia/bipolar disorder0.037107,620
4087292552612018Neuroticism0.010329,821
4294306968232019Chronotype0.029449,732
4316306432512019Smoking cessation0.005312,821
4368301506632018Cannabis use0.013162,082
Disclaimer/Publisher’s Note: The statements, opinions and data contained in all publications are solely those of the individual author(s) and contributor(s) and not of MDPI and/or the editor(s). MDPI and/or the editor(s) disclaim responsibility for any injury to people or property resulting from any ideas, methods, instructions or products referred to in the content.