Highlights
What are the main findings?
- Knowledge regarding the fish biodiversity of the Cosmonaut Sea, East Antarctica, has been updated and expanded.
- Indicative signals of cryptic species were detected in both Notolepis coatsorum and Bathylagus antarcticus by DNA barcoding analyses.
What is the implication of the main finding?
- Taxonomic composition and occurrence record of demersal ichthyofauna revealed by our study can help inform the ecological baseline of the Cosmonaut Sea, East Antarctica.
- DNA barcoding was further demonstrated to be a very efficient and sound method for the discrimination and classification of Antarctic fishes, even for cryptic species.
Abstract
The Cosmonaut Sea is one of the least accessed regions in the Southern Ocean, and our knowledge about the fish biodiversity in the region is sparse. In this study, we provided a description of demersal fish diversity in the Cosmonaut Sea by analysing cytochrome oxidase I (COI) barcodes of 98 fish samples that were hauled by trawling during the 37th and 38th Chinese National Antarctic Research Expedition (CHINARE) cruises. Twenty-four species representing 19 genera and 11 families, namely, Artedidraconidae, Bathydraconidae, Bathylagidae, Channichthyidae, Liparidae, Macrouridae, Muraenolepididae, Myctophidae, Nototheniidae, Paralepididae and Zoarcidae, were discriminated and identified, which were largely identical to local fish occurrence records and the general pattern of demersal fish communities at high Antarctic shelf areas. The validity of a barcoding gap failed to be detected and confirmed across all species due to the indicative signals of two potential cryptic species. Nevertheless, DNA barcoding still demonstrated to be a very efficient and sound method for the discrimination and classification of Antarctic fishes. In the future, various sampling strategies that cover all geographic sections and depth strata of the Cosmonaut Sea are encouraged to enhance our understanding of local fish communities, within which DNA barcoding can play an important role in either molecular taxonomy or the establishment of a dedicated local reference database for eDNA metabarcoding analyses.
1. Introduction
The Antarctic Circumpolar Current (ACC), which is driven by strong westerly winds, encircles the entire Antarctic continent and forms a thermal obstacle by substantially isolating lower-latitude warmer waters from higher-latitude colder waters [1]. Antarctica is geographically separated from other continents by large abyssal basins and great distances [2]. Therefore, the Southern Ocean that surrounds the Antarctic continent represents one of the most unique and extreme environments globally due to subzero temperatures and the widespread presence of sea ice [3]. The environmental characteristics and patterns in the Southern Ocean have been quite stable for more than 20 million years [4], which not only poses great eco-physiological challenges for marine organisms inhabiting Antarctic seas [3] but also allows for the independent evolution of inimitable and well-adapted endemic lives [5]. As a result, fewer than 400 fish species, approximately 2% of the fish species diversity worldwide [6], have managed to successfully colonise Antarctic waters [3].
The fish fauna of the Southern Ocean is dominated by a single group with a high degree of endemism, the perciform suborder Notothenioidei, particularly in the shelf and upper slope areas [7,8]. Most notothenioid fish belong to five families: Nototheniidae, Channichthyidae, Artedidraconidae, Bathydraconidae and Harpagiferidae [7]. Nonnotothenioid fish species living in Antarctic waters mostly belong to typical deep-sea groups such as zoarcids, liparids, macrourids and myctophids, whose distribution is mainly restricted to the lower slope and the abyssalpelagic layer. In particular, the diversity of demersal ichthyofauna varies among ice-free zones, seasonal zones and high Antarctic zones, with a latitudinal shift in species composition [2]. In general, Antarctic fish fauna show an endemism to a very large extent, with nearly 90% of Antarctic fish species restricted to the Southern Ocean [9]. Considering the impact of climate change as well as associated environmental alterations [10], the endemic feature of Antarctic fishes raises concerns about their vulnerability when they are exposed to multiple stress factors, such as increasing water temperature, decreasing salinity and oxygen level, habitat loss and ocean acidification [2]. Meanwhile, as the most speciose vertebrate group, fish are an integral component of ecological networks and have been regarded as effective sentinels of environmental alterations driven by climate change [11]. In the Antarctic marine ecosystem, most Antarctic fishes link small invertebrates of lower trophic levels and top predators; thus, their underlying vulnerability to ecological variation is of significant importance [2] and may serve as a useful indicator of climate change. Therefore, holistic knowledge of Antarctic fishes, particularly their biodiversity, can facilitate our understanding of the impact climate change has on the Southern Ocean ecosystem [6,12].
Although the fish fauna in Antarctic waters was once suggested to be fairly well known after a century of research [9], not all taxa have been completely revealed, as new species—Bathyraja sp. Ishiyama, 1958 (cf. eatonii) identified in 2008 [13] and Pogonophryne favosa Balushkin & Korolkova, 2013, described in 2013 [14]—and cryptic species—for instance, a member of genus Macrourus Bloch, 1786, discovered in 2010 [15] and candidates in Gymnoscopelus bolini Andriashev, 1962, Lampanyctus achirus Andriashev, 1962 and genus Bathylagus Günther, 1878, as revealed in 2018 [16]—are being found continuously. Furthermore, the species richness curve has not yet reached an asymptotic level from a historical perspective, suggesting that the species richness might still be underestimated, as several taxa and a number of areas have not been completely investigated [17]. Even in those taxa that have already been defined, some families, such as Rajidae, Muraenolepidida and Harpagiferidae, still need thorough taxonomic revision due to insufficient information on detailed morphological diagnoses or misidentifications in scientific records [17]. All these bottlenecks in respect to the systematics and biodiversity of Antarctic fishes mainly come from the inherent limitations of conventional morphological taxonomy systems, which are built on external visible morphological diagnoses and countable meristic features [18,19] and thus rely heavily on expert knowledge of taxonomy, systemics, natural history, biology, ecology and biogeography [20]. However, Antarctic fishes have tremendous variability in body shape, scale size, colour type and count and pattern of fin ray [21], and they also show significant phenotypic changes during different developmental stages [6,22]. In addition, sibling species may share similar morphological characteristics [23,24]. Therefore, an accurate and effective way to discriminate and identify Antarctic fishes is urgently needed, and DNA barcoding could be adopted as an alternative solution relative to traditional classification systems [25,26]. Since its initial successful use in the Scotia Sea [27], DNA barcoding analyses have been performed in a lot of Antarctic waters and across various fish taxa [12,15,26,28] and have demonstrated to be a robust tool for species discrimination and identification of Antarctic fishes.
The Cosmonaut Sea is a marginal sea northwest of Enderby Land in East Antarctica between the Cooperation Sea and Riiser-Larsen Sea [29], with relatively little impact from anthropogenic activities such as scientific research and commercial fishing [5,17], which could be the reason for the insufficient biological data for the region [30]. To date, only the pelagic fish community of the Cosmonaut Sea has been reported [31,32], while the diversity of demersal ichthyofauna remained obscure until it was characterised by morphological taxonomy recently [33].
In this study, DNA barcoding was adopted as a main approach for species classification to reveal demersal fish diversity of the Cosmonaut Sea and to determine whether these communities differ from those of typical demersal ichthyofauna inhabiting high-latitude Antarctic ice zones. Our findings can provide valuable elementary data for comprehensive ecosystem evaluation and contribute an important scientific reference for conservation and management.
2. Materials and Methods
2.1. Specimen Collection and Morphological Identification
In addition to two fish samples that were obtained as bycatch in stations C7P-07 and C5P-05 by a krill trawl net (8 m2 size; 5 mm mesh size), all fish caught were sampled from the Cosmonaut Sea by a triangular bottom trawl net (2.2 m wide, 0.65 m high and 6.5 m long; 20 mm mesh size) on the R/V XUELONG 2 icebreaker during the 37th and 38th Chinese National Antarctic Research Expedition (CHINARE) cruises conducted in 2021 and 2022, respectively (Figure 1). The bottom trawl net was hauled at a speed of 2 knots for 15 min, except for 5 min at station CA3-08 according to the bathymetric topography of the local seabed. Krill trawl net was hauled at a speed of 2 knots for 30 min at a depth of 250 m. All fish samples were roughly categorised and tentatively identified to the finest taxonomic level possible by checking the morphological diagnoses described in Fishes of the Southern Ocean [21] and matching the latest checklist of notothenioid fish species [34] and non-notothenioid fish species [17]. Other pieces of literature were also referred to when resolving the taxonomic identity of a Muraenolepididae member [35]. Muscle tissue samples for molecular analysis were stored in 95% ethanol (Sinopharm Chemical Reagent Co., Ltd., Shanghai, China) following the Barcode of Life protocol for fishes [36]. Species identifications were first conducted onboard and further verified in the laboratory through dedicated morphological examination, and the two rounds of morphological examinations were all implemented by qualified personnel of marine biological monitoring. Both morphologically ambiguous and unambiguous specimens were used for further molecular taxonomic analysis. Voucher specimens were then counted, weighed and fixed in 95% ethanol (Sinopharm Chemical Reagent Co., Ltd., Shanghai, China) at −80 °C onshore in the specimen repository of Third Institute of Oceanography, Ministry of Natural Resources for long-term preservation. A total of 98 specimens were collected during the 37th and 38th CHINARE cruises and used for DNA extraction and PCR amplification.
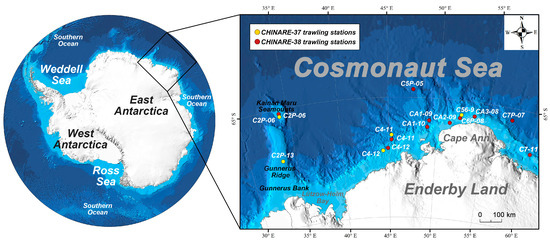
Figure 1.
Trawling stations in the Cosmonaut Sea during 37th and 38th CHINARE cruises.
2.2. DNA Extraction, Amplification and Sequencing
Genomic DNA was isolated from muscle tissue near dorsal fin employing a TIANamp Marine Animals DNA Kit (TIANGEN Biotech Co., Ltd., Beijing, China) according to the manufacturer’s protocol. The concentration of template DNA was adjusted to approximately 2.5 to 10 ng/µL prior to amplification. Partial fragments of the mitochondrial cytochrome oxidase I (COI) gene, with approximate lengths of 680–690 bp, were amplified using the universal barcoding primers FishF1 and FishR1 [37]. Polymerase chain reaction (PCR) was running in a 25 μL volume that consisted of 2.5 mM MgCl2, 0.1 mM dNTPs, 0.25 U of Taq polymerase (Takara Biomedical Technology Co., Ltd., Beijing, China), 0.2 μM each forward/reverse primer and 1 μL of DNA template. The thermocycle began with a first step for 4 min at 95 °C; then turned to 35 cycles of 0.5 min at 94 °C, 0.5 min at 52 °C and 0.5 min at 72 °C; and finished with a final step for 10 min at 72 °C. Negative controls were set in all amplifications to detect potential contamination. PCR yields were inspected on 1.5% agarose gels. Final products were directly sequenced using an ABI 3730 capillary sequencer (Applied Biosystems, Foster City, CA, USA) using the BigDye Terminator Sequencing Kit (Applied Biosystems, Foster City, CA, USA) and following the manufacturer’s instructions.
2.3. Species Discrimination, Identification and Occurrence Comparison
The sequences were assembled and viewed in Sequencher v4.1.4 [38] and aligned using Clustal W multiple algorithms [39]. Ambiguous sequences and primer binding sites were trimmed after alignment, and final obtained COI fragments had a length of 652 bp. The identity of all obtained COI fragments was verified by a BLAST [40] search in GenBank (BLASTn, megablast algorithm), comparing the match higher than 98%. Sequences with a match lower than 98% hit against the GenBank database were treated as unidentified. Two distinct molecular species delimitation approaches were adopted to distinguish taxonomic units from the COI dataset. The first method, assembly species by automatic partitioning (ASAP), is a new method for highly efficient species partitioning from single-locus sequence alignments [41]. We conducted the COI gene fragment alignment through an online tool (https://bioinfo.mnhn.fr/abi/public/asap/asapweb.html, accessed on 17 October 2023) with default settings. The second method, Bayesian phylogenetics and phylogeography (BPP), is a Bayesian Markov chain Monte Carlo (MCMC) program for analysing DNA barcode sequence alignments under the multispecies coalescent model (MSC), which can precisely discriminate sequences at the species level without support from defined distance thresholds in advance and thus brings great improvements to DNA barcoding analyses [42,43]. All obtained COI sequences were deposited in GenBank under the accession number PP218555-PP218652.
The most up-to-date fish occurrence records in the Cosmonaut Sea, although scattered, can be best derived from Duhamel et al. (2014), who integrated various national and international data sources, scientists involved in fish surveys, collections of museums and polar institutes and well-referenced published lists of stations and catches [17]. After all sequences were discriminated and identified, the corresponding fish occurrence data in the Cosmonaut Sea were used for comparison with records included in the book chapter across various taxonomic levels.
2.4. Genetic Divergence and Phylogenetic Analysis
As suggested by jModeltest 2 [44], pairwise genetic divergent levels were calculated using the Kimura two-parameter (K2P) distance model [45], and neighbour-joining (NJ) trees of K2P distances with 5000 bootstrap replications were also drawn to generate graphic indications of the divergence between species using MEGA X software [46]. The DNA barcoding gap was calculated for all 24 species by comparing the pairwise interspecific genetic distance and pairwise intraspecific genetic distance, according to the criterion of a mean interspecific variability at least 10 times greater than the mean intraspecific genetic distance [47].
Phylogenetic analysis was implemented with all obtained sequences to visualise the relationship among distinct taxonomic units determined by the ASAP and BPP methods. SMS [48] online execution (http://www.atgc-montpellier.fr/sms, accessed on 17 October 2023) was taken to choose the most appropriate model of nucleotide substitution under the Akaike information criterion before conducting phylogenetic analysis. Bayesian analysis was implemented using MrBayes v.3.2 [49]. Parameters for BEAST were inputted in BEAUti 1.10.4 selecting a Coalescent Model with Speciation Yule Process, uncorrelated relaxed clock model, TN93 substitution model and invariant site heterogeneity model with a chain length of 500,000,000 iterations, sampling every 500,000 generations, for the Markov chain Monte Carlo (MCMC) analysis [50]. For maximum likelihood analysis, PhyML 3.0 [51] online tool (https://www.atgc-montpellier.fr/phyml, accessed on 17 October 2023) was chosen following automatic model selection by SMS under the Akaike information criterion. We used NNI as a tree improvement for tree searching and the fast likelihood-based parameter aLRT SH-like for branch support. Majority rule consensus trees were rebuilt after discarding a burn-in of 250 and visualised with FigTree v.1.4.4 (https://tree.bio.ed.ac.uk/software/Figtree). The results of ASAP and BPP were also integrated into the consensus tree for visualisation and comparison.
3. Results
3.1. Sequence Information
All mitochondrial COI barcode fragments were successfully amplified using aforementioned primers. Low-quality sequences such as double peaks, short fragments or background noise were not detected. The full length of the amplified barcode fragments after alignment was 652 bp. Abnormalities such as insertions, deletions or stop codons were not found in the aligned sequences, implying that all barcode alignments were in line with functional mitochondrial COI sequences [37]. Among the 652 base sites, 273 were polymorphic, and 53 were parsimony informative. The average base composition was A = 22.25%, C = 29.30%, G = 18.42% and T =30.02% on average, with a slight bias against G and A.
3.2. Morphological and Molecular Species Identification and Occurrence Comparison
Most voucher specimens were adult fish in complete shape and could thus be discriminated and inspected. However, there existed also some incomplete specimens and juvenile fish samples, which hindered accurate morphological identification. Thus, although all samples were identified at the finest classification level we could, some could be assigned to only the genus level. In total, 28 morphological species belonging to 19 genera and 11 families were successfully identified according to main morphological diagnoses, including Artedidraconidae (2 species, 3 specimens), Bathydraconidae (5 species, 20 specimens), Bathylagidae (2 species, 3 specimens), Channichthyidae (2 species, 2 specimens), Liparidae (1 species, 1 specimen), Macrouridae (4 species, 34 specimens), Muraenolepididae (2 species, 2 specimens), Myctophidae (3 species, 11 specimens), Nototheniidae (2 species, 18 specimens), Paralepididae (2 species, 2 specimens) and Zoarcidae (2 species, 2 specimens), with Macrouridae being the most specimen-rich family and Bathydraconidae forming the most species-rich family (Table 1). Among the 28 morphological species, 21 species were identified to species level successfully, while 7 species were assigned at the genus level only, namely, Bathylagus sp., Coryphaenoides Gunnerus, 1765 sp.1, Coryphaenoides sp.2, Notolepis Dollo, 1908 sp.1, Notolepis sp.2, Pogonophryne Regan, 1914 sp.1 and Pogonophryne sp.2.

Table 1.
Summary of fish specimens and species identities using both morphological and molecular taxonomies.
As indicated by the book chapter, at least 29 species belonging to 12 families, including Artedidraconidae, Bathydraconidae, Bathylagidae, Channichthyidae, Liparidae, Macrouridae, Muraenolepididae, Myctophidae, Nototheniidae, Paralepididae, Rajidae and Zoarcidae, inhabit the Cosmonaut Sea. Our results verified the existence of thirteen fish species in the Cosmonaut Sea but missed the other seventeen species. However, the fish fauna revealed by our DNA barcoding analyses overlap with historical records across different taxonomic levels to a large extent. At the family level, fish groups were highly identical (92.31%) between our results and existing data except for the absence of Rajidae in our fish catch. At the genus level, half of taxonomic units (50%) in the historical records were shared by CHINARE results. At the species level, almost half (44.83%) of the fish species with occurrence information could still be found on both sides (Table 2).
Table 2.
Comparison of historical records and CHINARE results of fish occurrence in the Cosmonaut Sea.
All obtained fragments were then used to validate species information, which disentangled the consistencies between morphologically determined species and vouchered references. DNA barcode sequences were all successfully assigned to the genus or species level, with the consensus robustness of all fragments determined by alignment through a BLAST annotation in GenBank. Seventy-two morphological identification results (73.47%) matched BLAST searching in the GenBank database with at least 99% similarity, supporting the consistency of species information provided by the two distinct taxonomic approaches. Meanwhile, five other specimens previously identified at the genus level (5.10%) were further assigned to the species level. However, twenty-one morphological identifications (21.43%) were shown to be invalid (Table 1). In particular, the sequence of morphological identification of Muraenolepis microps Lönnberg, 1905 did not match any BLAST annotations well except for a Notomuraenobathys microcephalus (Norman, 1937) reference. However, the matched reference contained only a 499 bp sequence, which was 153 bp shorter than ours. The authenticity of BLAST annotation for this species was further confirmed after dedicated morphological re-examination of the fish sample based on key morphological characters (Figure S1) [35].
DNA identification (ASAP) was capable of detecting a barcode gap among barcode alignment sequences and implied that 98 sequences formed 25 taxonomic units, among which P. scotti Regan, 1914, Artedidraco shackletoni Waite, 1911 and A. skottsbergi Lönnberg, 1905 consisted of a putative taxonomic unit together, while both N. coatsorum Dollo, 1908 and B. antarcticus Günther, 1878 split into two putative taxonomic units. However, the phylogenetic trees of BPP analysis suggested that all analysed barcode alignment fragments formed 24 putative species, which almost matched fairly well with the BLAST annotations utilising vouchered sequences existing in the GenBank database. Taking the potential impact insufficient count of most studied species into account [12], the BPP outcome was adopted as the ultimate result.
Both the Bayesian inference and maximum likelihood calculations and analyses generated phylogenetic trees with similar topologies. The phylogenetic trees suggested that all Antarctic fish species developed different clusters, and most species then stayed with their conspecifics in monophyletic clades with high bootstrap values. However, a haplotype sequence identified as Cygnodraco mawsoni Waite, 1916 was nested within Artedidraconidae and Channichthyidae with a high bootstrap support value, while separating from its sibling members within Bathydraconidae (Figure 2).
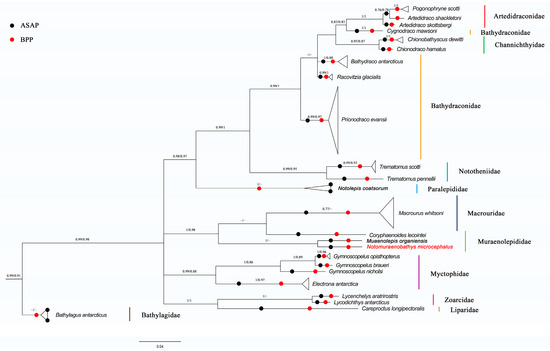
Figure 2.
The COI phylogenetic tree based on Bayesian inference for demersal fish of the Cosmonaut Sea, obtained with MrBayes, with the scale bars proportional to the substitution rates; support values are Bayesian Posterior/ML probability support; support values below 0.5 are not shown; species names in red font indicate fish species that are further identified by morphological taxonomy; and results of DNA-based classification from ASAP and BPP are also integrated into the COI phylogenetic tress, as indicated by solid black/red circles.
In summary, our study identified 24 species belonging to 19 genera and 11 families, namely, Paralepididae (2 species, 2 specimens), Macrouridae (2 species, 34 specimens), Muraenolepididae (2 species, 2 specimens), Myctophidae (4 species, 11 specimens), Bathylagidae (1 species, 3 specimens), Artedidraconidae (2 species, 4 specimens), Bathydraconidae (4 species, 32 specimens), Channichthyidae (2 species, 2 specimens), Nototheniidae (2 species, 5 specimens), Zoarcidae (2 species, 2 specimens) and Liparidae (1 species, 1 specimens), with Macrouridae being the most abundant family in terms of specimen number and Bathydraconidae and Myctophidae being the most diverse families in terms of species richness (Figure 2, Table 1). The main groups across different taxonomic levels revealed by both conventional and molecular methods were highly similar.
3.3. Genetic Divergence Pattern and Phylogenetic Analysis
As expected, a hierarchical increase in the average K2P genetic distance with elevating taxonomic levels (from 0.63% to 3.98%) was recorded (Table 3). At the species level, the minimum divergence was found between A. shackletoni and A. skottsbergi (2.35%), and the maximum was detected between Bathydraco antarcticus Günther, 1878 and N. microcephalus (30.65%); at the genus level, the minimum divergence was found between Artedidraco Lönnberg, 1905 and Pogonophryne (2.64%), and the maximum was detected between Bathylagus and Notomuraenobathys Balushkin & Prirodina, 2010 (29.75%); and at the family level, the minimum divergence was found between Artedidraconidae and Bathydraconidae (9.13%), and the maximum was detected between Bathylagidae and Muraenolepididae (29.75%).
Table 3.
Details of genetic divergence (K2P percentage) across different taxonomic levels.
The intraspecific K2P distances as mean values ranged from 0% to 3.29% across all species, with a mean value of 0.63%, while the minimum interspecific K2P distances, as mentioned above, ranged from 2.35% to 23.86%, with a mean value of 8.94% (Table 4). The maximum intraspecific distances of all species were less than 2%, except for B. antarcticus, Lycodichthys antarcticus Pappenheim, 1911 and N. coatsorum, whose intraspecific distances were 2.09%, 2.18% and 3.29%, respectively. In particular, the maximum intraspecific distance of B. antarcticus and N. coatsorum even exceeded the minimum interspecific distance of some other Antarctic fish species. In this regard, although no overlap existed between intraspecific variability and interspecific variability for most fish species, a clear DNA barcoding gap cannot be applied for all taxonomic units.
Table 4.
Details of interspecific and intraspecific divergence among species based on K2P distances.
4. Discussion
4.1. DNA Barcoding Demonstrated to Be an Effective Way to Discriminate Antarctic Fish Species
As the largest vertebrate taxa, fish show tremendous variabilities in colour pattern, scale size, body shape as well as fin ray type and number [52,53] and may experience drastic phenotypic changes during different developmental stages [54,55]. In addition, morphological characteristics are often of little value for species delineation due to the considerable interspecific overlaps or intraspecific invariants found in many cases [53]. Therefore, fish identification could be a challenge for taxonomists in some complicated cases, even for well-trained and highly experienced experts. Since the initiation of biological identification [56], taking the mitochondrial COI gene fragment as a standard DNA barcode has been proven to be a powerful approach to discriminate and identify species in various taxa. Previous studies have demonstrated that DNA barcoding with the COI gene can effectively discriminate and identify most Antarctic fish species in the Southern Ocean, for example, 87.5% morphological species of Southern Ocean fishes can be well resolved by COI barcoding [26]. In our study, although only 72.45% morphological identification results were fully supported by DNA barcoding analyses, the consistency between traditional species delimitation and molecular approach is quite close when taking our inexperienced classification skills into account. A key prerequisite for such accurate and effective species delineation is a valid barcoding gap between interspecific genetic distance and intraspecific genetic distance [57].
In this study, the validity of a barcoding gap was initially supported by ASAP but failed to be further verified by genetic divergence analysis, which was attributed to the overlap between maximum intraspecific distance of B. antarcticus and N. coatsorum and minimum interspecific distance of some other species. Previous DNA barcoding analysis on Antarctic fishes found that cryptic species might exist in genus Bathylagus [16] and N. coatsorum [26] due to their unusual high intraspecific divergent level. Although our study cannot fully prove their assumption due to insufficient samples, the fact that ASAP divided N. coatsorum and B. antarcticus into two taxonomic units, respectively, raised our attention. Meanwhile, the maximum and mean intraspecific distances of the two “species” were also greatest among all and exceeded the general intraspecific level. Therefore, there was no doubt that our finding was another important indicative proof for the existence of these potential cryptic species and thus further supported viewpoints proposed by previous studies. In addition, it was also noteworthy that the efficacy of DNA barcoding as an important taxonomic method for Antarctic fishes has not been compromised by the lack of a clear DNA barcoding gap, rather, it has been further strengthened by the indication of candidate cryptic species.
Furthermore, almost all mitochondrial COI barcode sequences, including those affiliated with potential cryptic species, hit against the vouchered reference well with almost unanimous (99–100%) consensus strength, including a sequence assigned to N. microcephalus, whose reference length was 153 bp shorter. The species identity of the sequence was finally confirmed by checking the key morphological diagnoses. Thus, a combined approach integrating both morphological taxonomy and molecular taxonomy is highly recommended, particularly for Antarctic fishes, whose reference sequences might be limited or even unavailable in public databases such as GenBank [31]. In spite of the reference sequence problems we encountered, all these results can establish solid confidence for the validity and reliability of our Antarctic fish taxonomy.
4.2. Demersal Fish Communities of the Cosmonaut Sea
To the best of our knowledge, there has been no systematic description of demersal fish diversity and communities in the Cosmonaut Sea that integrates both morphological taxonomy and molecular taxonomy so far, therefore, this study provided novel insights into demersal fish diversity in the Cosmonaut Sea. As revealed by our DNA barcoding results, the demersal fish fauna of the Cosmonaut Sea was characterised by typical demersal species inhabiting the shelf and upper slope around the Antarctic continent, and the most species-abundant fish groups were the notothenioids, including artedidraconids, bathydraconids, channichthyids and nototheniids, followed by myctophids, muraenolepidids, zoarcids, macrourids, liparids, bathylagids and paralepidids. Non-notothenoids were either typical deep-sea groups or representative mesopelagic members. Although many Antarctic fish species have a circumpolar distribution, local fish communities of different regions may still vary regionally when latitude and location change [12]. For example, in the ice-free Sub-Antarctic island shelf areas, predominant members of local demersal fish communities include the channichthyids Champsocephalus gunnari Lönnberg, 1905 and Chaenocephalus aceratus (Lönnberg, 1906), the nototheniids Lepidonotothen Balushkin, 1976 spp. and Notothenia Richardson, 1844 spp. as well as Gobionotothen gibberifrons (Lönnberg, 1905) and Patagonotothen guntheri (Norman, 1937) [27]. In the seasonal sea ice zones located in higher latitudes, such as the neritic waters of the Antarctic Peninsula, benthic fish fauna was most likely to be bathydraconids Parachaenichthys charcoti (Vaillant, 1906), channichthyids Pagetopsis macropterus (Boulenger, 1907) and Pseudochaenichthys georgianus Norman, 1937, nototheniids Lepidonotothen spp. and Notothenia spp. and Harpagifer antarcticus Nybelin, 1947 (Harpagiferidae) [6]; in the high-latitude Antarctic shelf regions, such as the Dumont d’Urville Sea and Ross Sea, demersal fish communities consisted of artedidraconids, bathydraconids, channichthyids and nototheniids, mainly Pleuragramma antarcticum Boulenger, 1902 and Trematomus Boulenger, 1902 spp. Other non-notothenioids were deep-sea fishes such as paralepidids, macrourids, muraenolepidids, myctophids, bathylagids, zoarcids and liparids [26,58]. In this regard, the demersal fish ichthyofauna inhabiting Cosmonaut Sea match the typical pattern at high latitudes of the Southern Ocean more than that of Sub-Antarctic island shelf areas and seasonal sea ice zones of higher latitudes, which was consistent with our anticipation as well. When compared with demersal fish communities of other Eastern Antarctica areas at high latitudes, such as Prydz Bay, which is dominated by Artedidraconidae, Bathydraconidae, Channichthyidae, Nototheniidae (Trematomus spp. and P. antarcticum), Zoarcidae and Rajidae [12], almost all groups were also found in the Cosmonaut Sea. In addition, additional members of Paralepididae, Macrouridae, Muraenolepididae, Myctophidae, Bathylagidae and Liparidae, most of which were more likely to be mesopelagic fish, were identified in our study. However, it was noteworthy that skates, a dominant chondrichthyan group in Antarctic waters, were absent in our fish samples because skates in the Southern Ocean were more likely to be captured as the bycatch of toothfish longline vessels [26] and less likely to be harvested by bottom trawling. Despite the absence of skates, the benthic ichthyofauna of the Cosmonaut Sea still resembles the typical pattern of fish communities in high-latitude Antarctic waters to a very large extent.
4.3. Comparison of Our Results and Fish Occurrence Records in the Cosmonaut Sea
For the absence of seventeen fish species previously recorded in the book chapter, there were several possible explanations. First, the trawl stations were not capable of covering all sections of the Cosmonaut Sea. For example, Pachycara Zugmayer, 1911 spp. was mainly distributed in neritic zones of Lützow-Holm Bay [17], which was beyond the targeted exploration area of the 37th and 38th CHINARE cruises. Second, the trawling depths of all stations were not successive, with a missing stratum of approximately 300–800 m in particular due to the combined effects of sea ice cover, bottom topography, substrate pattern and other random factors on trawling station setting. However, fish species such as P. permitini Andriashev, 1967, Gerlachea australis Dollo, 1900 and Cryodraco Dollo, 1900 spp. were recorded inhabiting this depth range only [59], which may have resulted in the failure to capture these species in our hauls. Last, as previously mentioned, the main fishing gear we used was bottom trawl. Although trawling nets may unintentionally harvest mesopelagic fish such as Electrona antarctica (Günther, 1878) and Gymnoscopelus Günther, 1873 sp., their target groups were mainly demersal fishes; thus, they can hardly, though not impossibly, capture pelagic fish such as P. antarcticum. For the demersal fish, not all members were still target groups. For instance, skates and toothfish were more likely to be caught by bottom longlines [26,60] than any other fishing gear, which might be the reason why we failed to observe these typical demersal fish in our catch. Even so, our DNA barcoding analysis of fish samples has substantially expanded current knowledge regarding fish biodiversity in the Cosmonaut Sea. Meanwhile, the novel distribution records for the nine species supported by molecular taxonomy indicated that the Cosmonaut Sea was poorly explored even in comparison with other seas in the Southern Ocean. In the future, more sampling efforts, including but not limited to the use of various fishing gear and eDNA methods, are encouraged to fully cover the geographic range and depth stratum of the Cosmonaut Sea to enhance our understanding of endemic fish biodiversity, within which DNA barcoding can play an important role in either molecular taxonomy or the establishment of a local reference database in eDNA analyses by contributing 12S rDNA and 16S rDNA barcodes that are urgently needed [31].
5. Conclusions
By implementing DNA barcoding analysis on fish samples collected by trawling during 37th and 38th CHINARE cruises, we provided novel insights into the demersal fish diversity of the Cosmonaut Sea. Twenty-four species representing 19 genera and 11 families, namely, Artedidraconidae, Bathydraconidae, Bathylagidae, Channichthyidae, Liparidae, Macrouridae, Muraenolepididae, Myctophidae, Nototheniidae, Paralepididae and Zoarcidae were characterised, which was highly identical to historical records. Nevertheless, skates and some other fish species that were previously observed were absent in our catches, which was due to the biased station setting, incomplete coverage of specific depths and selectivity of fishing gear. Furthermore, a novel description of the occurrence of nine fish species was added by our sampling effort and DNA taxonomy, implying that our knowledge regarding fish diversity in the Cosmonaut Sea has been sparse. In general, the demersal fish diversity of the Cosmonaut Sea was consistent with the general pattern of ichthyofauna in the high-latitude Antarctic seas. However, various sampling strategies that cover all geographic sections and depth strata are still encouraged to further improve our understanding of local fish communities, within which DNA barcoding can play a significant role in either molecular taxonomy or the establishment of a dedicated local reference database for eDNA metabarcoding analyses.
Supplementary Materials
The following supporting information can be downloaded at: https://www.mdpi.com/article/10.3390/genes15060691/s1, Figure S1: Morphological photos of Notomuraenobathys microcephalus (Norman, 1937); Figure S2: Morphological photos of Muraenolepis orangiensis Vaillant, 1888; Figure S3: Morphological photos of Electrona antarctica (Günther, 1878); Figure S4: Morphological photos of Gymnoscopelus braueri (Lönnberg, 1905); Figure S5: Morphological photos of Bathylagus antarcticus Günther, 1878; Figure S6: Morphological photos of Notolepis coatsorum Dollo, 1908; Figure S7: Morphological photos of Macrourus whitsoni (Regan, 1913); Figure S8: Morphological photos of Chionobathyscus dewitti Andriashev & Neelov 1978.; Figure S9: Morphological photos of Cygnodraco mawsoni Waite 1916; Figure S10: Morphological photos of Prionodraco evansii Regan 1914.; Figure S11: Morphological photos of Racovitzia glacialis Dollo 1900; Figure S12: Morphological photos of Trematomus scotti (Boulenger 1907).
Author Contributions
Conceptualisation, H.L.; data curation, R.W.; formal analysis, H.L.; funding acquisition, L.L.; investigation, X.M.; methodology, Y.L.; project administration, L.L.; resources, R.W.; software, H.L.; supervision, L.L.; validation, Y.W.; visualisation, R.Z.; writing—original draft, H.L.; writing—review and editing, L.L. All authors have read and agreed to the published version of the manuscript.
Funding
This work was funded by “Impact and Response of Antarctic Seas to Climate Change” program (IRASCC01-02-02&02-02), Chinese Arctic and Antarctic Administration, Ministry of Natural Resources of the People’s Republic of China.
Institutional Review Board Statement
Not applicable.
Informed Consent Statement
Not applicable.
Data Availability Statement
Data were deposited in GenBank under the accession number PP218555-PP218652.
Conflicts of Interest
The authors declare no conflicts of interest.
References
- Orsi, A.H.; Whitworth, T.; Nowlin, W.D. On the meridional extent and fronts of the Antarctic Circumpolar Current. Deep-Sea Res. Part I Oceanogr. Res. Pap. 1995, 42, 641–673. [Google Scholar] [CrossRef]
- Mintenbeck, K.; Barrera-Oro, E.R.; Brey, T.; Jacob, U.; Knust, R.; Mark, F.C.; Moreira, E.; Strobel, A.; Arntz, W.E. Impact of Climate Change on Fishes in Complex Antarctic Ecosystems. In Advance in Ecological Research; Elsevier Science & Technology: London, UK, 2012; Volume 46, pp. 351–426. [Google Scholar]
- Matschiner, M.; Colombo, M.; Damerau, M.; Ceballos, S.; Hanel, R.; Salzburger, W. The Adaptive Radiation of Notothenioid Fishes in the Waters of Antarctica. In Extremophile Fishes; Springer International Publishing AG: Cham, Switzerland, 2015; pp. 35–57. [Google Scholar]
- Dayton, P.K. Polar benthos. In Polar Oceanography, Part B: Chemistry, Biology, and Geology; Smith, W.O., Ed.; Academic Press: Boston, MA, USA, 1990; pp. 631–685. [Google Scholar]
- Mintenbeck, K. Impacts of Climate Change on the Southern Ocean. In Climate Change Impacts on Fisheries and Aquaculture: A Global Analysis; Phillips, B.F., Pérez Ramírez, M., Eds.; John Wiley & Sons, Ltd: Chichester, UK, 2017; pp. 663–701. [Google Scholar]
- Mabragaña, E.; Delpiani, S.M.; Rosso, J.J.; González-Castro, M.; Deli Antoni, M.; Hanner, R.; Díaz De Astarloa, J.M. Barcoding Antarctic Fishes: Species Discrimination and Contribution to Elucidate Ontogenetic Changes in Nototheniidae. In DNA Barcoding in Marine Perspectives; Springer International Publishing AG: Cham, Switzerland, 2016; pp. 213–242. [Google Scholar]
- Andriashev, A.P. Andriashev, A.P. A general review of the Antarctic bottom fish fauna. In Fifth Congress of European Ichthyologists; Swedish Museum of Natural History: Stockholm, Sweden, 1987. [Google Scholar]
- Eastman, J.T. Antarctic Fish Biology: Evolution in a Unique Environment; Academic Press: San Diego, CA, USA, 1993. [Google Scholar]
- Eastman, J.T. The nature of the diversity of Antarctic fishes. Polar Biol. 2005, 28, 93–107. [Google Scholar] [CrossRef]
- Rogers, A.D.; Frinault, B.; Barnes, D.; Bindoff, N.L.; Downie, R.; Ducklow, H.W.; Friedlaender, A.S.; Hart, T.; Hill, S.L.; Hofmann, E.E.; et al. Antarctic futures: An assessment of climate-driven changes in ecosystem structure, function, and service provisioning in the Southern Ocean. Annu. Rev. Mar. Sci. 2020, 12, 87–120. [Google Scholar] [CrossRef] [PubMed]
- Fogarty, H.E.; Burrows, M.T.; Pecl, G.T.; Robinson, L.M.; Poloczanska, E.S. Are fish outside their usual ranges early indicators of climate-driven range shifts? Glob. Change Biol. 2017, 23, 2047–2057. [Google Scholar] [CrossRef]
- Li, H.; Cao, S.; Li, Y.; Song, P.; Zhang, R.; Wang, R.; Liu, S.; Miao, X.; Lin, L. Molecular assessment of demersal fish diversity in Prydz Bay using DNA taxonomy. Deep-Sea Res. Part II Top. Stud. Oceanogr. 2022, 202, 105140. [Google Scholar] [CrossRef]
- Smith, P.J.; Steinke, D.; Mcveagh, S.M.; Stewart, A.L.; Struthers, C.D.; Roberts, C.D. Molecular analysis of Southern Ocean skates (Bathyraja) reveals a new species of Antarctic skate. J. Fish Biol. 2008, 73, 1170–1182. [Google Scholar] [CrossRef]
- Balushkin, A.V.; Korolkova, E.D. New species of plunderfish Pogonophryne favosa sp. n. (Artedidraconidae, Notothenioidei, Perciformes) from the Cosmonauts Sea (Antarctica) with description in artedidraconids of unusual anatomical structures-convexitas superaxillaris. J. Ichthyol. 2013, 53, 562–574. [Google Scholar] [CrossRef]
- Smith, P.J.; Steinke, D.; McMillan, P.J.; Stewart, A.L.; McVeagh, S.M.; Diaz De Astarloa, J.M.; Welsford, D.; Ward, R.D. DNA barcoding highlights a cryptic species of grenadier Macrourus in the Southern Ocean. J. Fish Biol. 2011, 78, 355–365. [Google Scholar] [CrossRef] [PubMed]
- Christiansen, H.; Dettai, A.; Heindler, F.M.; Collins, M.A.; Duhamel, G.; Hautecoeur, M.; Steinke, D.; Volckaert, F.A.M.; Van de Putte, A.P. Diversity of mesopelagic fishes in the Southern Ocean-a phylogeographic perspective using DNA barcoding. Front. Ecol. Evol. 2018, 6, 120. [Google Scholar] [CrossRef]
- Duhamel, G.; Hulley, P.; Causse, R.; Koubbi, P.; Vacchi, M.; Pruvost, P.; Vigetta, S.; Irisson, J.; Mormede, S.; Belchier, M. Biogeographic patterns of fish. In Biogeographic Atlas of the Southern Ocean; Scientific Committee on Antarctic Research: Cambridge, UK, 2014. [Google Scholar]
- Xiong, X.; Yao, L.; Ying, X.; Lu, L.; Guardone, L.; Armani, A.; Guidi, A.; Xiong, X. Multiple fish species identified from China’s roasted Xue Yu fillet products using DNA and mini-DNA barcoding: Implications on human health and marine sustainability. Food Control 2018, 88, 123–130. [Google Scholar] [CrossRef]
- Xu, L.; Wang, X.; Van Damme, K.; Huang, D.; Li, Y.; Wang, L.; Ning, J.; Du, F. Assessment of fish diversity in the South China Sea using DNA taxonomy. Fish. Res. 2021, 233, 105771. [Google Scholar] [CrossRef]
- Nelson, J.S.; Grande, T.C.; Wilson, M.V. Fishes of the World, 5th ed.; John Wiley & Sons: Hoboken, NJ, USA, 2016. [Google Scholar]
- Gon, O.; Heemstra, P.C. Fishes of the Southern Ocean; JLB Smith Institute of Ichthyology: Grahamstown, South Africa, 1990. [Google Scholar]
- Murphy, K.R.; Kalmanek, E.A.; Cheng, C.H.C. Diversity and biogeography of larval and juvenile notothenioid fishes in McMurdo Sound, Antarctica. Polar Biol. 2017, 40, 161–176. [Google Scholar] [CrossRef]
- Eastman, J.T.; Eakin, R.R. Decomplicating and identifying species in the radiation of the Antarctic fish genus Pogonophryne (Artedidraconidae). Polar Biol. 2022, 45, 825–832. [Google Scholar] [CrossRef]
- Li, Y.; Zhang, L.; Song, P.; Zhang, R.; Wang, L.; Lin, L. Fish diversity and molecular taxonomy in the Prydz Bay during the 29th CHINARE. Acta Oceanol. Sin. 2018, 37, 15–20. [Google Scholar] [CrossRef]
- Koubbi, P.; Duhamel, G.; Hecq, J.; Beans, C.; Loots, C.; Pruvost, P.; Tavernier, E.; Vacchi, M.; Vallet, C. Ichthyoplankton in the neritic and coastal zone of Antarctica and Subantarctic islands: A review. J. Mar. Syst. 2009, 78, 547–556. [Google Scholar] [CrossRef]
- Smith, P.J.; Steinke, D.; Dettai, A.; McMillan, P.; Welsford, D.; Stewart, A.; Ward, R.D. DNA barcodes and species identifications in Ross Sea and Southern Ocean fishes. Polar Biol. 2012, 35, 1297–1310. [Google Scholar] [CrossRef]
- Rock, J.; Costa, F.O.; Walker, D.I.; North, A.W.; Hutchinson, W.F.; Carvalho, G.R. DNA barcodes of fish of the Scotia Sea, Antarctica indicate priority groups for taxonomic and systematics focus. Antarct. Sci. 2008, 20, 253–262. [Google Scholar] [CrossRef]
- Lautredou, A.C.; Bonillo, C.; Denys, G.; Cruaud, C.; Ozouf-Costaz, C.; Lecointre, G.; Dettai, A. Molecular taxonomy and identification within the Antarctic genus Trematomus (Notothenioidei, Teleostei): How valuable is barcoding with COI? Polar Sci. 2010, 4, 333–352. [Google Scholar] [CrossRef]
- Li, Q.; Xiao, W.; Wang, R.; Chen, Z. Diatom based reconstruction of climate evolution through the Last Glacial Maximum to Holocene in the Cosmonaut Sea, East Antarctica. Deep-Sea Res. Part II Top. Stud. Oceanogr. 2021, 194, 104960. [Google Scholar] [CrossRef]
- Hunt, B.P.V.; Pakhomov, E.A.; Trotsenko, B.G. The macrozooplankton of the Cosmonaut Sea, east Antarctica (30°E–60°E), 1987–1990. Deep-Sea Res. Part I Oceanogr. Res. Pap. 2007, 54, 1042–1069. [Google Scholar] [CrossRef]
- Liao, Y.; Miao, X.; Wang, R.; Zhang, R.; Li, H.; Lin, L. First pelagic fish biodiversity assessment of Cosmonaut Sea based on environmental DNA. Mar. Environ. Res. 2023, 106225. [Google Scholar] [CrossRef]
- Van de Putte, A.P.; Jackson, G.D.; Pakhomov, E.; Flores, H.; Volckaert, F.A.M. Distribution of squid and fish in the pelagic zone of the Cosmonaut Sea and Prydz Bay region during the BROKE-West campaign. Deep-Sea Res. Part II Top. Stud. Oceanogr. 2010, 57, 956–967. [Google Scholar] [CrossRef]
- Wang, R.; Zhang, R.; Miao, X.; Li, H.; Song, P.; Li, Y.; Lin, L. Demersal fish community in the near-shelf zone of the Cosmonaut Sea, Southern Ocean. Diversity 2024, 16, 156. [Google Scholar] [CrossRef]
- Eastman, J.T.; Eakin, R.R. Checklist of the species of notothenioid fishes. Antarct. Sci. 2021, 3, 273–280. [Google Scholar] [CrossRef]
- Fitzcharles, E.; Hollyman, P.R.; Goodall-Copestake, W.P.; Maclaine, J.S.; Collins, M.A. The taxonomic identity and distribution of the eel cod Muraenolepis (Gadiformes: Muraenolepididae) around South Georgia and the South Sandwich Islands. Polar Biol. 2021, 44, 637–651. [Google Scholar] [CrossRef]
- Steinke, D.; Zemlak, T.S.; Boutillier, J.A.; Hebert, P.D.N. DNA barcoding of Pacific Canada’s fishes. Mar. Biol. 2009, 156, 2641–2647. [Google Scholar] [CrossRef]
- Ward, R.D.; Zemlak, T.S.; Innes, B.H.; Last, P.R.; Hebert, P.D.N. DNA barcoding Australia’s fish species. Philos. Trans. R. Soc. B Biol. Sci. 2005, 360, 1847–1857. [Google Scholar] [CrossRef] [PubMed]
- Nishimura, D. Sequencher 3.1.1. Biotech Softw. Internet Rep. 2000, 1, 24–30. [Google Scholar] [CrossRef]
- Larkin, M.A.; Blackshields, G.; Brown, N.P.; Chenna, R.; McGettigan, P.A.; McWilliam, H.; Valentin, F.; Wallace, I.M.; Wilm, A.; Lopez, R.; et al. Clustal W and Clustal X version 2.0. Bioinformatics 2007, 23, 2947–2948. [Google Scholar] [CrossRef]
- Ye, J.; McGinnis, S.; Madden, T.L. BLAST: Improvements for better sequence analysis. Nucleic Acids Res. 2006, 34, W6–W9. [Google Scholar] [CrossRef]
- Puillandre, N.; Brouillet, S.; Achaz, G. ASAP: Assemble species by automatic partitioning. Mol. Ecol. Resour. 2021, 21, 609–620. [Google Scholar] [CrossRef] [PubMed]
- Yang, Z. The BPP program for species tree estimation and species delimitation. Curr. Zool. 2015, 61, 854–865. [Google Scholar] [CrossRef]
- Yang, Z.; Rannala, B. Bayesian species identification under the multispecies coalescent provides significant improvements to DNA barcoding analyses. Mol. Ecol. 2017, 26, 3028–3036. [Google Scholar] [CrossRef] [PubMed]
- Darriba, D.; Taboada, G.L.; Doallo, R.; Posada, D. jModelTest 2: More models, new heuristics and high-performance computing. Nat. Methods 2012, 9, 772. [Google Scholar] [CrossRef] [PubMed]
- Kimura, M. A simple method for estimating evolutionary rates of base substitutions through comparative studies of nucleotide sequences. J. Mol. Evol. 1980, 16, 111–120. [Google Scholar] [CrossRef] [PubMed]
- Kumar, S.; Stecher, G.; Tamura, K. MEGA7: Molecular Evolutionary Genetics Analysis Version 7.0 for Bigger Datasets. Mol. Biol. Evol. 2016, 33, 1870–1874. [Google Scholar] [CrossRef] [PubMed]
- Hebert, P.D.N.; Stoeckle, M.Y.; Zemlak, T.S.; Francis, C.M.; Charles, G. Identification of birds through DNA barcodes. PLoS Biol. 2004, 2, e312. [Google Scholar] [CrossRef] [PubMed]
- Lefort, V.; Longueville, J.; Gascuel, O. SMS: Smart Model Selection in PhyML. Mol. Biol. Evol. 2017, 34, 2422–2424. [Google Scholar] [CrossRef] [PubMed]
- Ronquist, F.; Teslenko, M.; van der Mark, P.; Ayres, D.L.; Darling, A.; Höhna, S.; Larget, B.; Liu, L.; Suchard, M.A.; Huelsenbeck, J.P. MrBayes 3.2: Efficient Bayesian Phylogenetic Inference and Model Choice Across a Large Model Space. Syst. Biol. 2012, 61, 539–542. [Google Scholar] [CrossRef]
- Suchard, M.A.; Lemey, P.; Baele, G.; Ayres, D.L.; Drummond, A.J.; Rambaut, A. Bayesian phylogenetic and phylodynamic data integration using BEAST 1.10. Virus Evol. 2018, 4, vey16. [Google Scholar] [CrossRef]
- Guindon, S.; Dufayard, J.F.; Lefort, V.; Anisimova, M.; Hordijk, W.; Gascuel, O. New algorithms and methods to estimate maximum-likelihood phylogenies: Assessing the performance of PhyML 3.0. Syst. Biol. 2010, 59, 307–321. [Google Scholar] [CrossRef] [PubMed]
- Strauss, R.E.; Bond, C.E. Taxonomic methods: Morphology. In Methods for Fish Biology; American Fisheries Society: Bethesda, MD, USA, 1990; pp. 109–140. [Google Scholar]
- Zhang, J.; Hanner, R. Molecular approach to the identification of fish in the South China Sea. PLoS ONE 2012, 7, e30621. [Google Scholar] [CrossRef] [PubMed]
- Batta-Lona, P.G.; Galindo-Sánchez, C.E.; Arteaga, M.C.; Robles-Flores, J.; Jiménez-Rosenberg, S.P.A. DNA barcoding and morphological taxonomy: Identification of lanternfish (Myctophidae) larvae in the Gulf of Mexico. Mitochondrial DNA Part A DNA Mapp. Seq. Anal. 2019, 30, 375–383. [Google Scholar] [CrossRef]
- Hou, G.; Wang, J.; Liu, L.; Chen, Y.; Pan, C.; Lin, J.; Zhang, H. Assemblage structure of the ichthyoplankton and its relationship with environmental factors in spring and autumn off the Pearl River Estuary. Front. Mar. Sci. 2021, 8, 732970. [Google Scholar] [CrossRef]
- Hebert, P.D.N.; Cywinska, A.; Ball, S.L.; DeWaard, J.R. Biological identifications through DNA barcodes. Proc. R. Soc. B Biol. Sci. 2003, 270, 313–321. [Google Scholar] [CrossRef]
- Xing, B.; Lin, H.; Zhang, Z.; Wang, C.; Wang, Y.; Wang, J. DNA barcoding for identification of fish species in the Taiwan Strait. PLoS ONE 2018, 13, e198109. [Google Scholar]
- Dettai, A.; Lautredou, A.C.; Bonillo, C.; Goimbault, E.; Busson, F.; Causse, R.; Couloux, A.; Cruaud, C.; Duhamel, G.; Denys, G.; et al. The actinopterygian diversity of the CEAMARC cruises: Barcoding and molecular taxonomy as a multi-level tool for new findings. Deep-Sea Res. Part II Top. Stud. Oceanogr. 2011, 58, 250–263. [Google Scholar] [CrossRef]
- Eastman, J.T. Bathymetric distributions of notothenioid fishes. Polar Biol. 2017, 40, 2077–2095. [Google Scholar] [CrossRef]
- Hanchet, S.; Dunn, A.; Parker, S.; Horn, P.; Stevens, D.; Mormede, S. Antarctic toothfish (Dissostichus mawsoni): Biology, ecology, and life history in the Ross Sea region. Hydrobiologia 2015, 761, 397–414. [Google Scholar] [CrossRef]
Disclaimer/Publisher’s Note: The statements, opinions and data contained in all publications are solely those of the individual author(s) and contributor(s) and not of MDPI and/or the editor(s). MDPI and/or the editor(s) disclaim responsibility for any injury to people or property resulting from any ideas, methods, instructions or products referred to in the content. |
© 2024 by the authors. Licensee MDPI, Basel, Switzerland. This article is an open access article distributed under the terms and conditions of the Creative Commons Attribution (CC BY) license (https://creativecommons.org/licenses/by/4.0/).