
Full-Length Transcriptome Sequencing and Comparative Transcriptomic Analyses Provide Comprehensive Insight into Molecular Mechanisms of Flavonoid Metabolites Biosynthesis in Styphnolobium japonicum
 ,
,
Abstract

1. Introduction
2. Materials and Methods
2.1. Plant Materials Preparation and Collection
2.2. Total RNA Extraction
2.3. RNA-seq Library Preparation and Sequencing
2.4. SMRT Sequencing Library Construction and Sequencing
2.5. Processing and Error Correction of PacBio Iso-Seq Reads
2.6. Transcripts’ Functional Annotations
2.7. Gene Expression Quantification
2.8. GO and KEGG Enrichment Analysis
2.9. Gene Co-Expression Analysis
3. Results
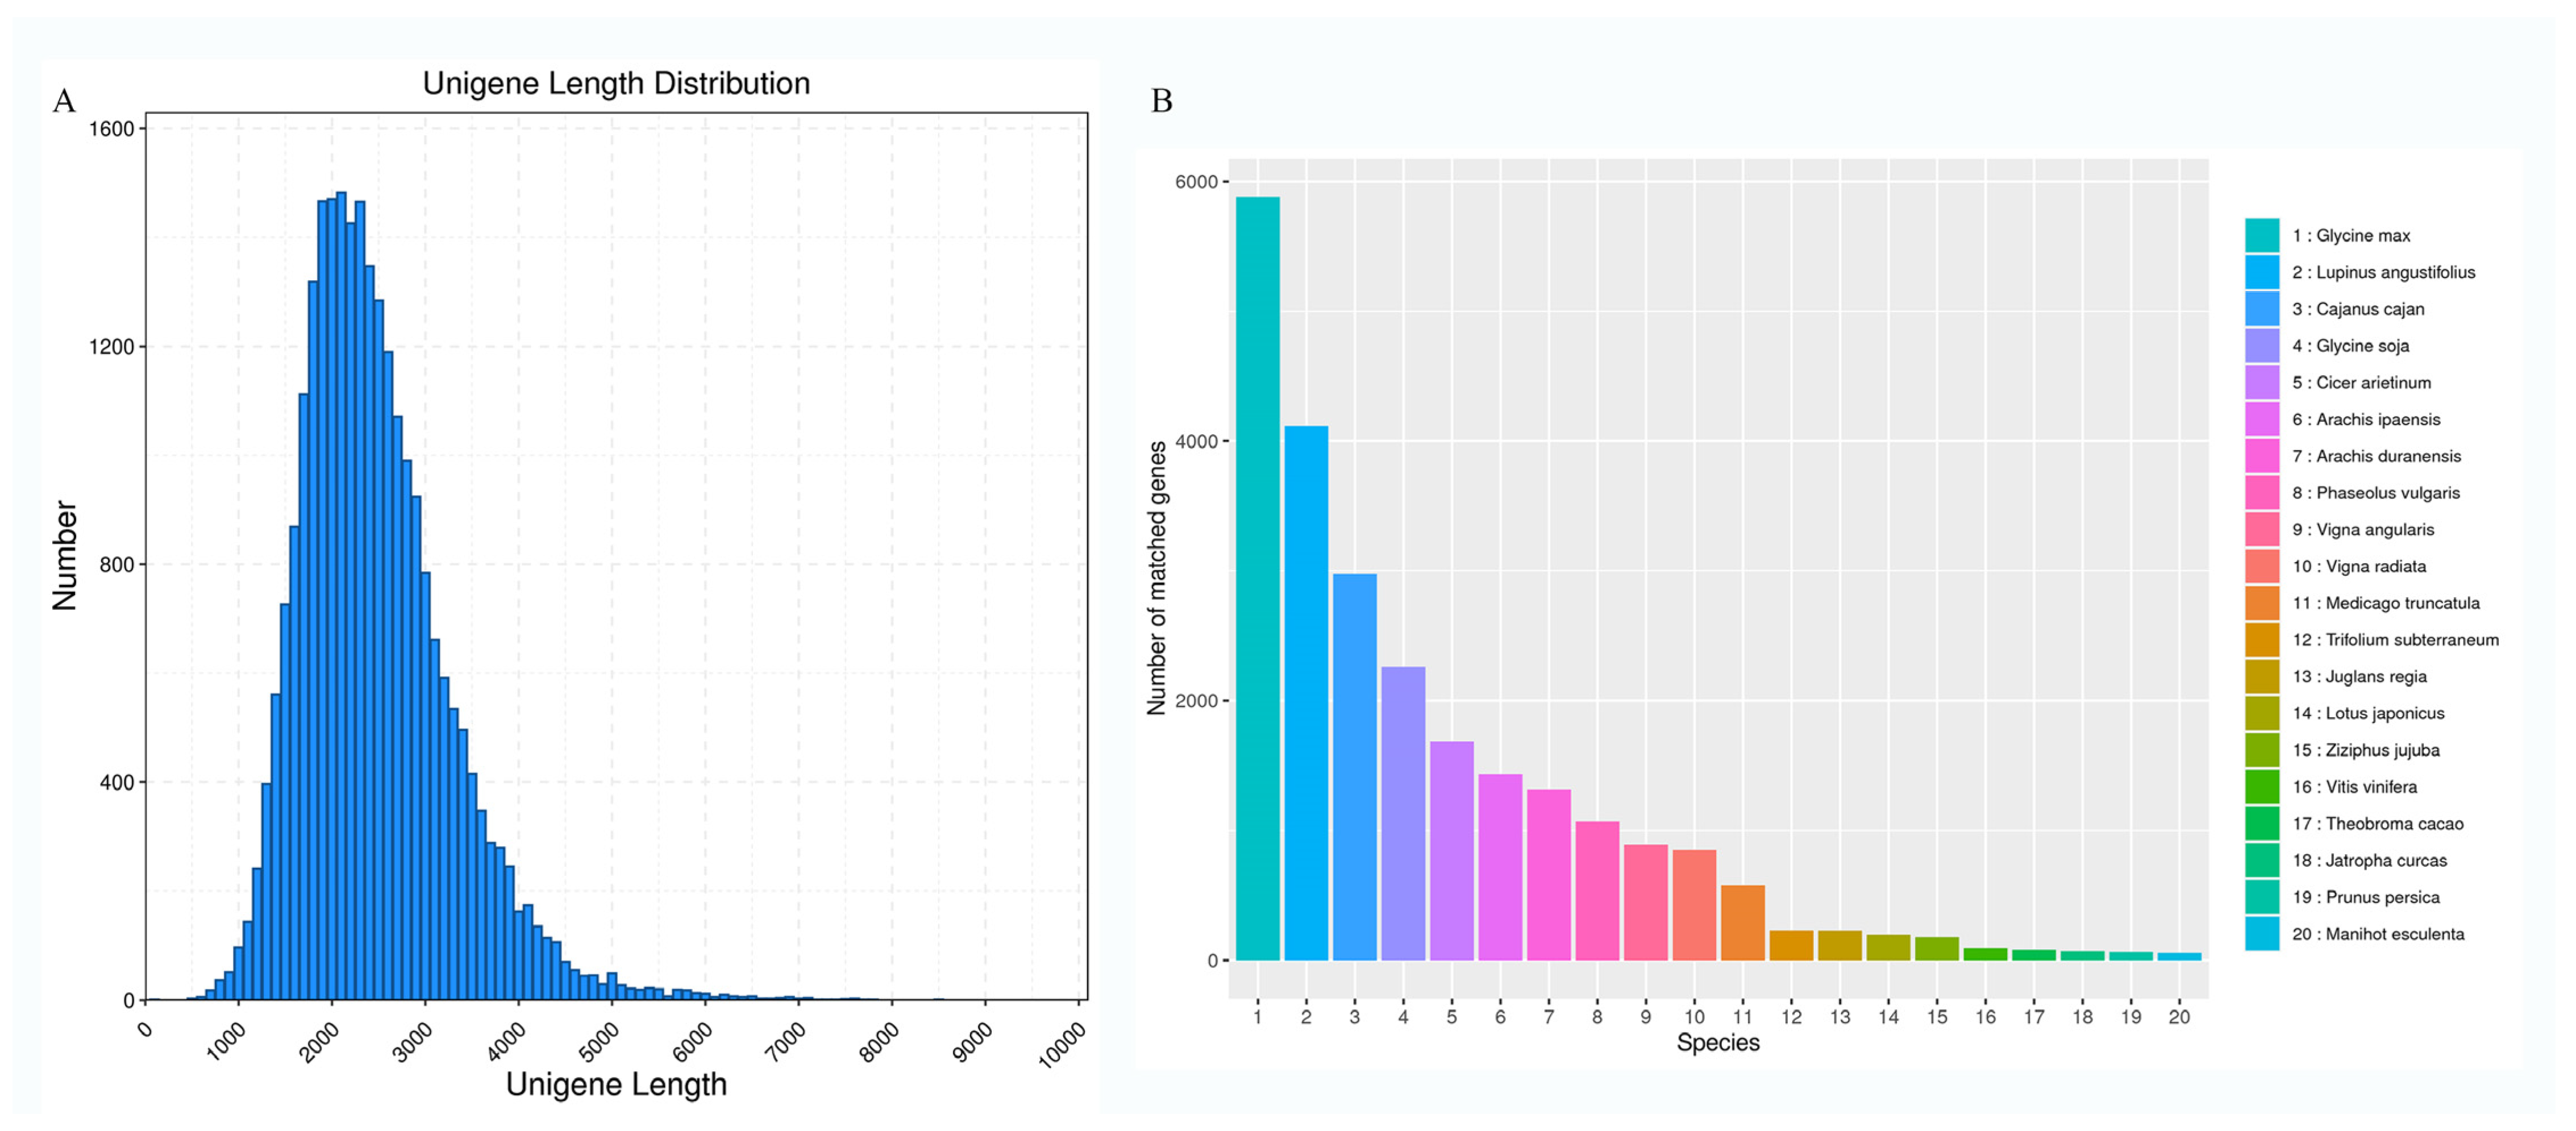
3.1. Analysis of S. japonicum Flower Full-Length Transcripts
3.2. Gene Function Annotation
3.3. Gene Expression Analysis of S. japonicum Flower
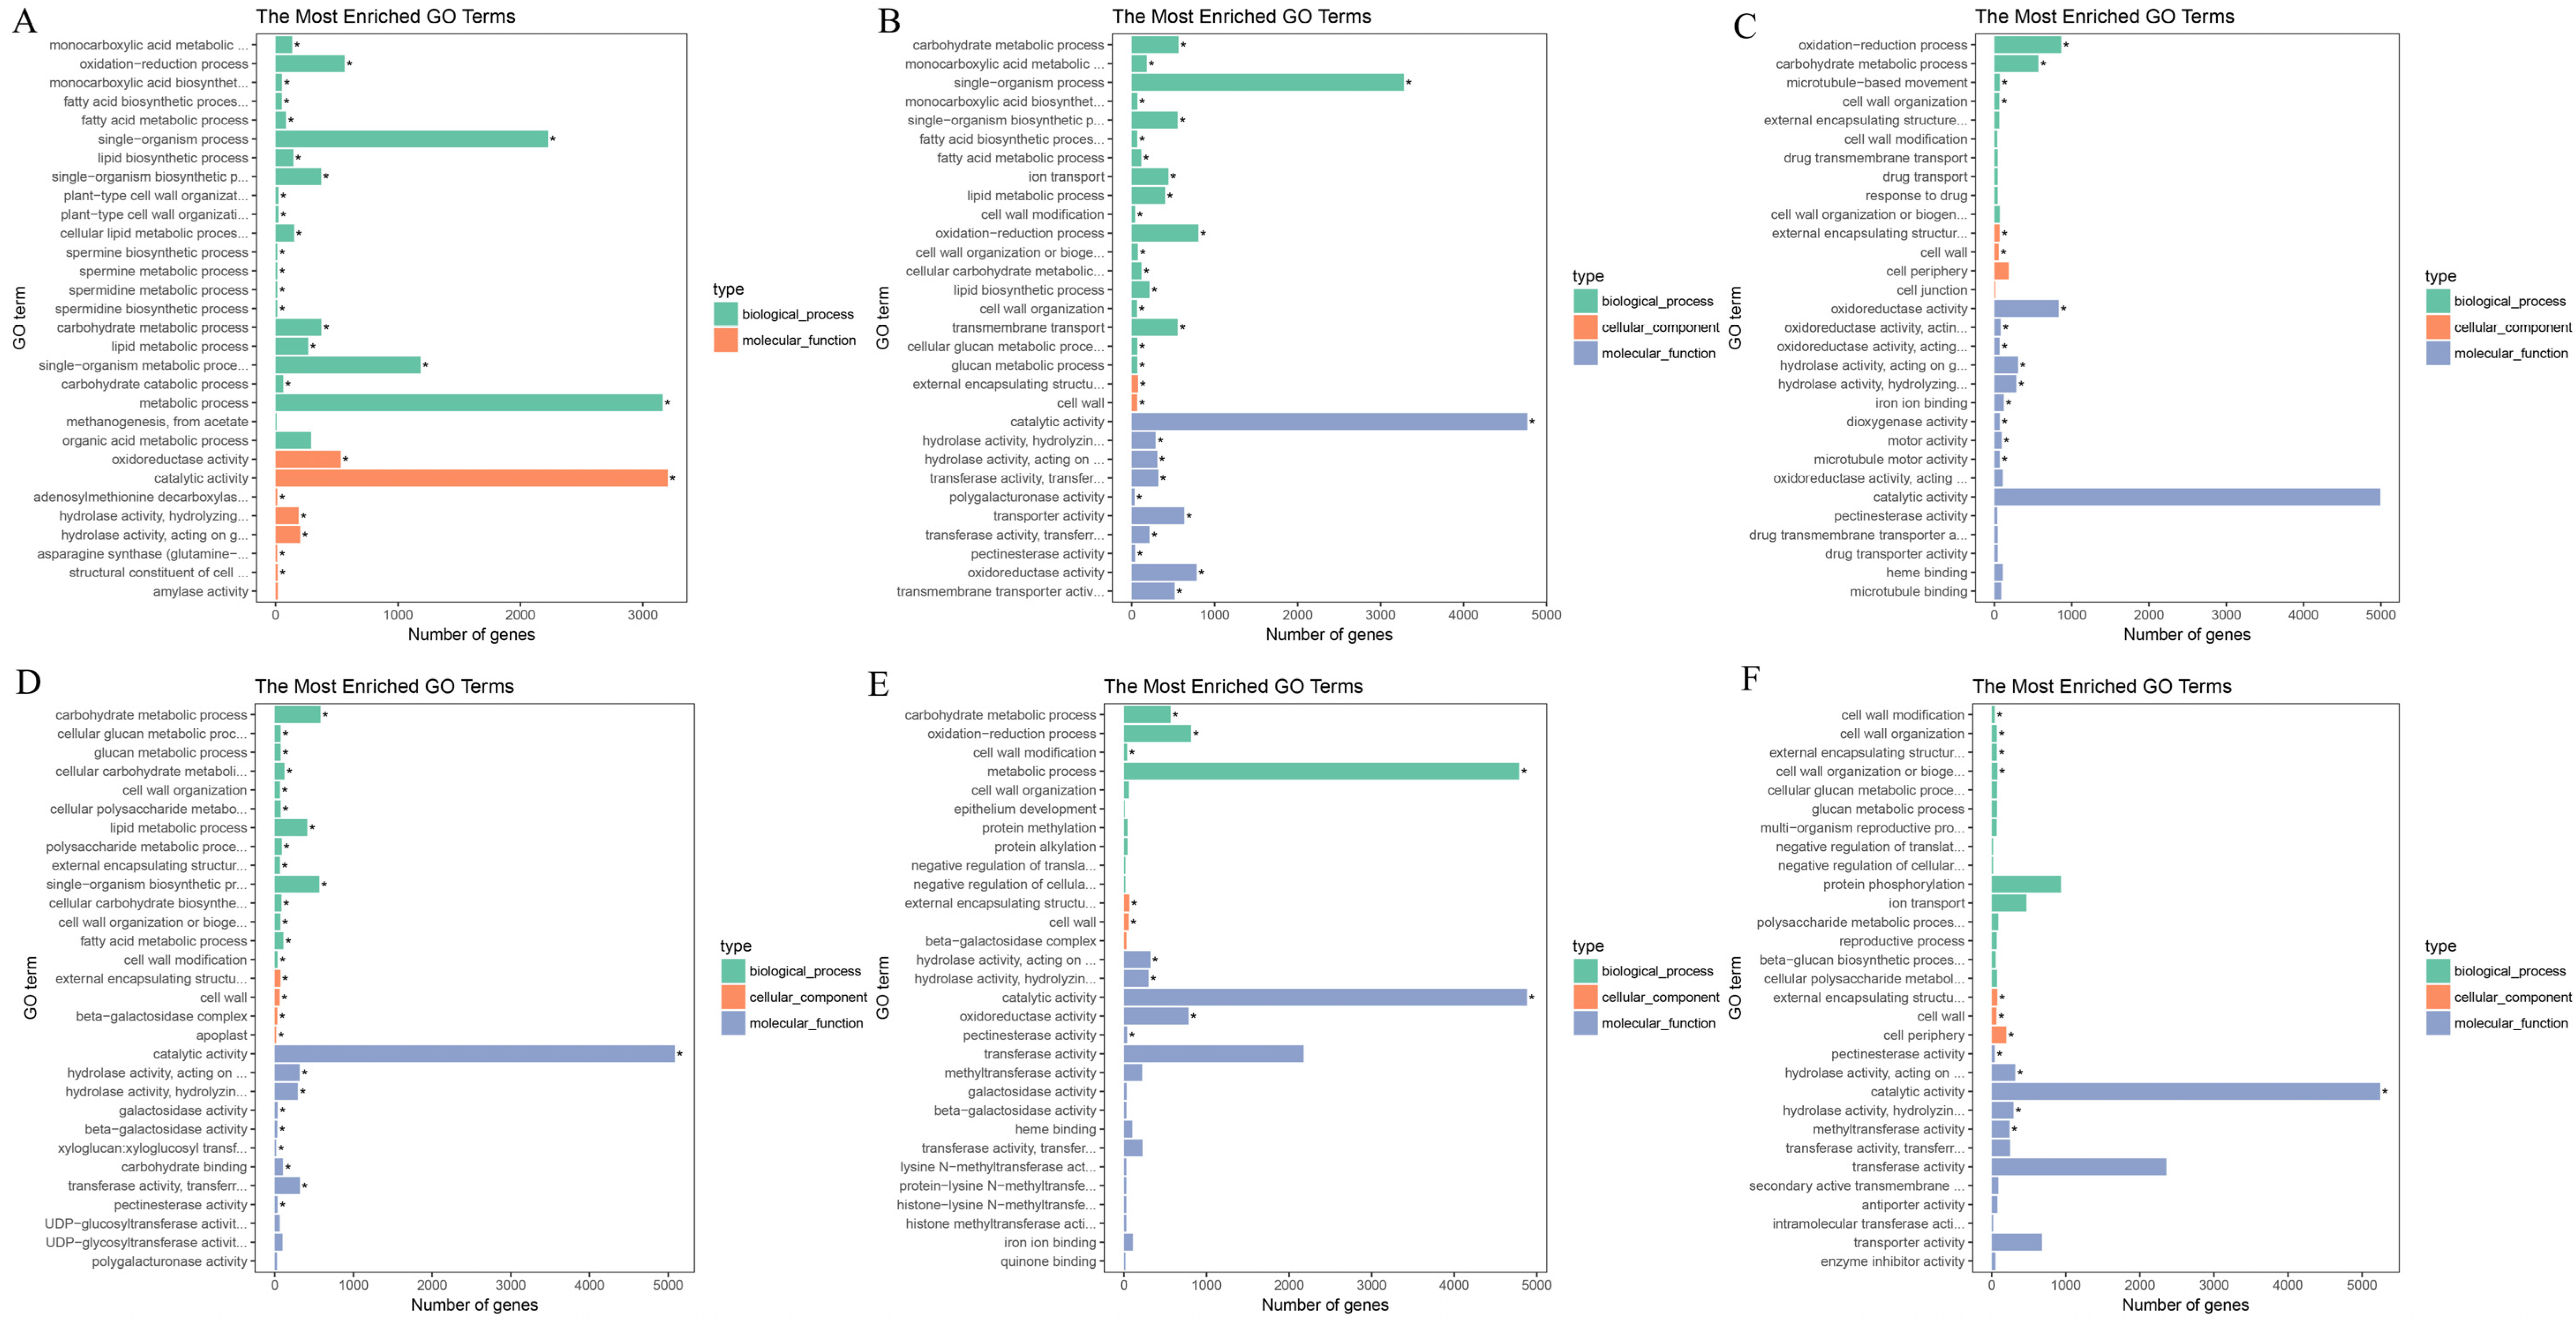
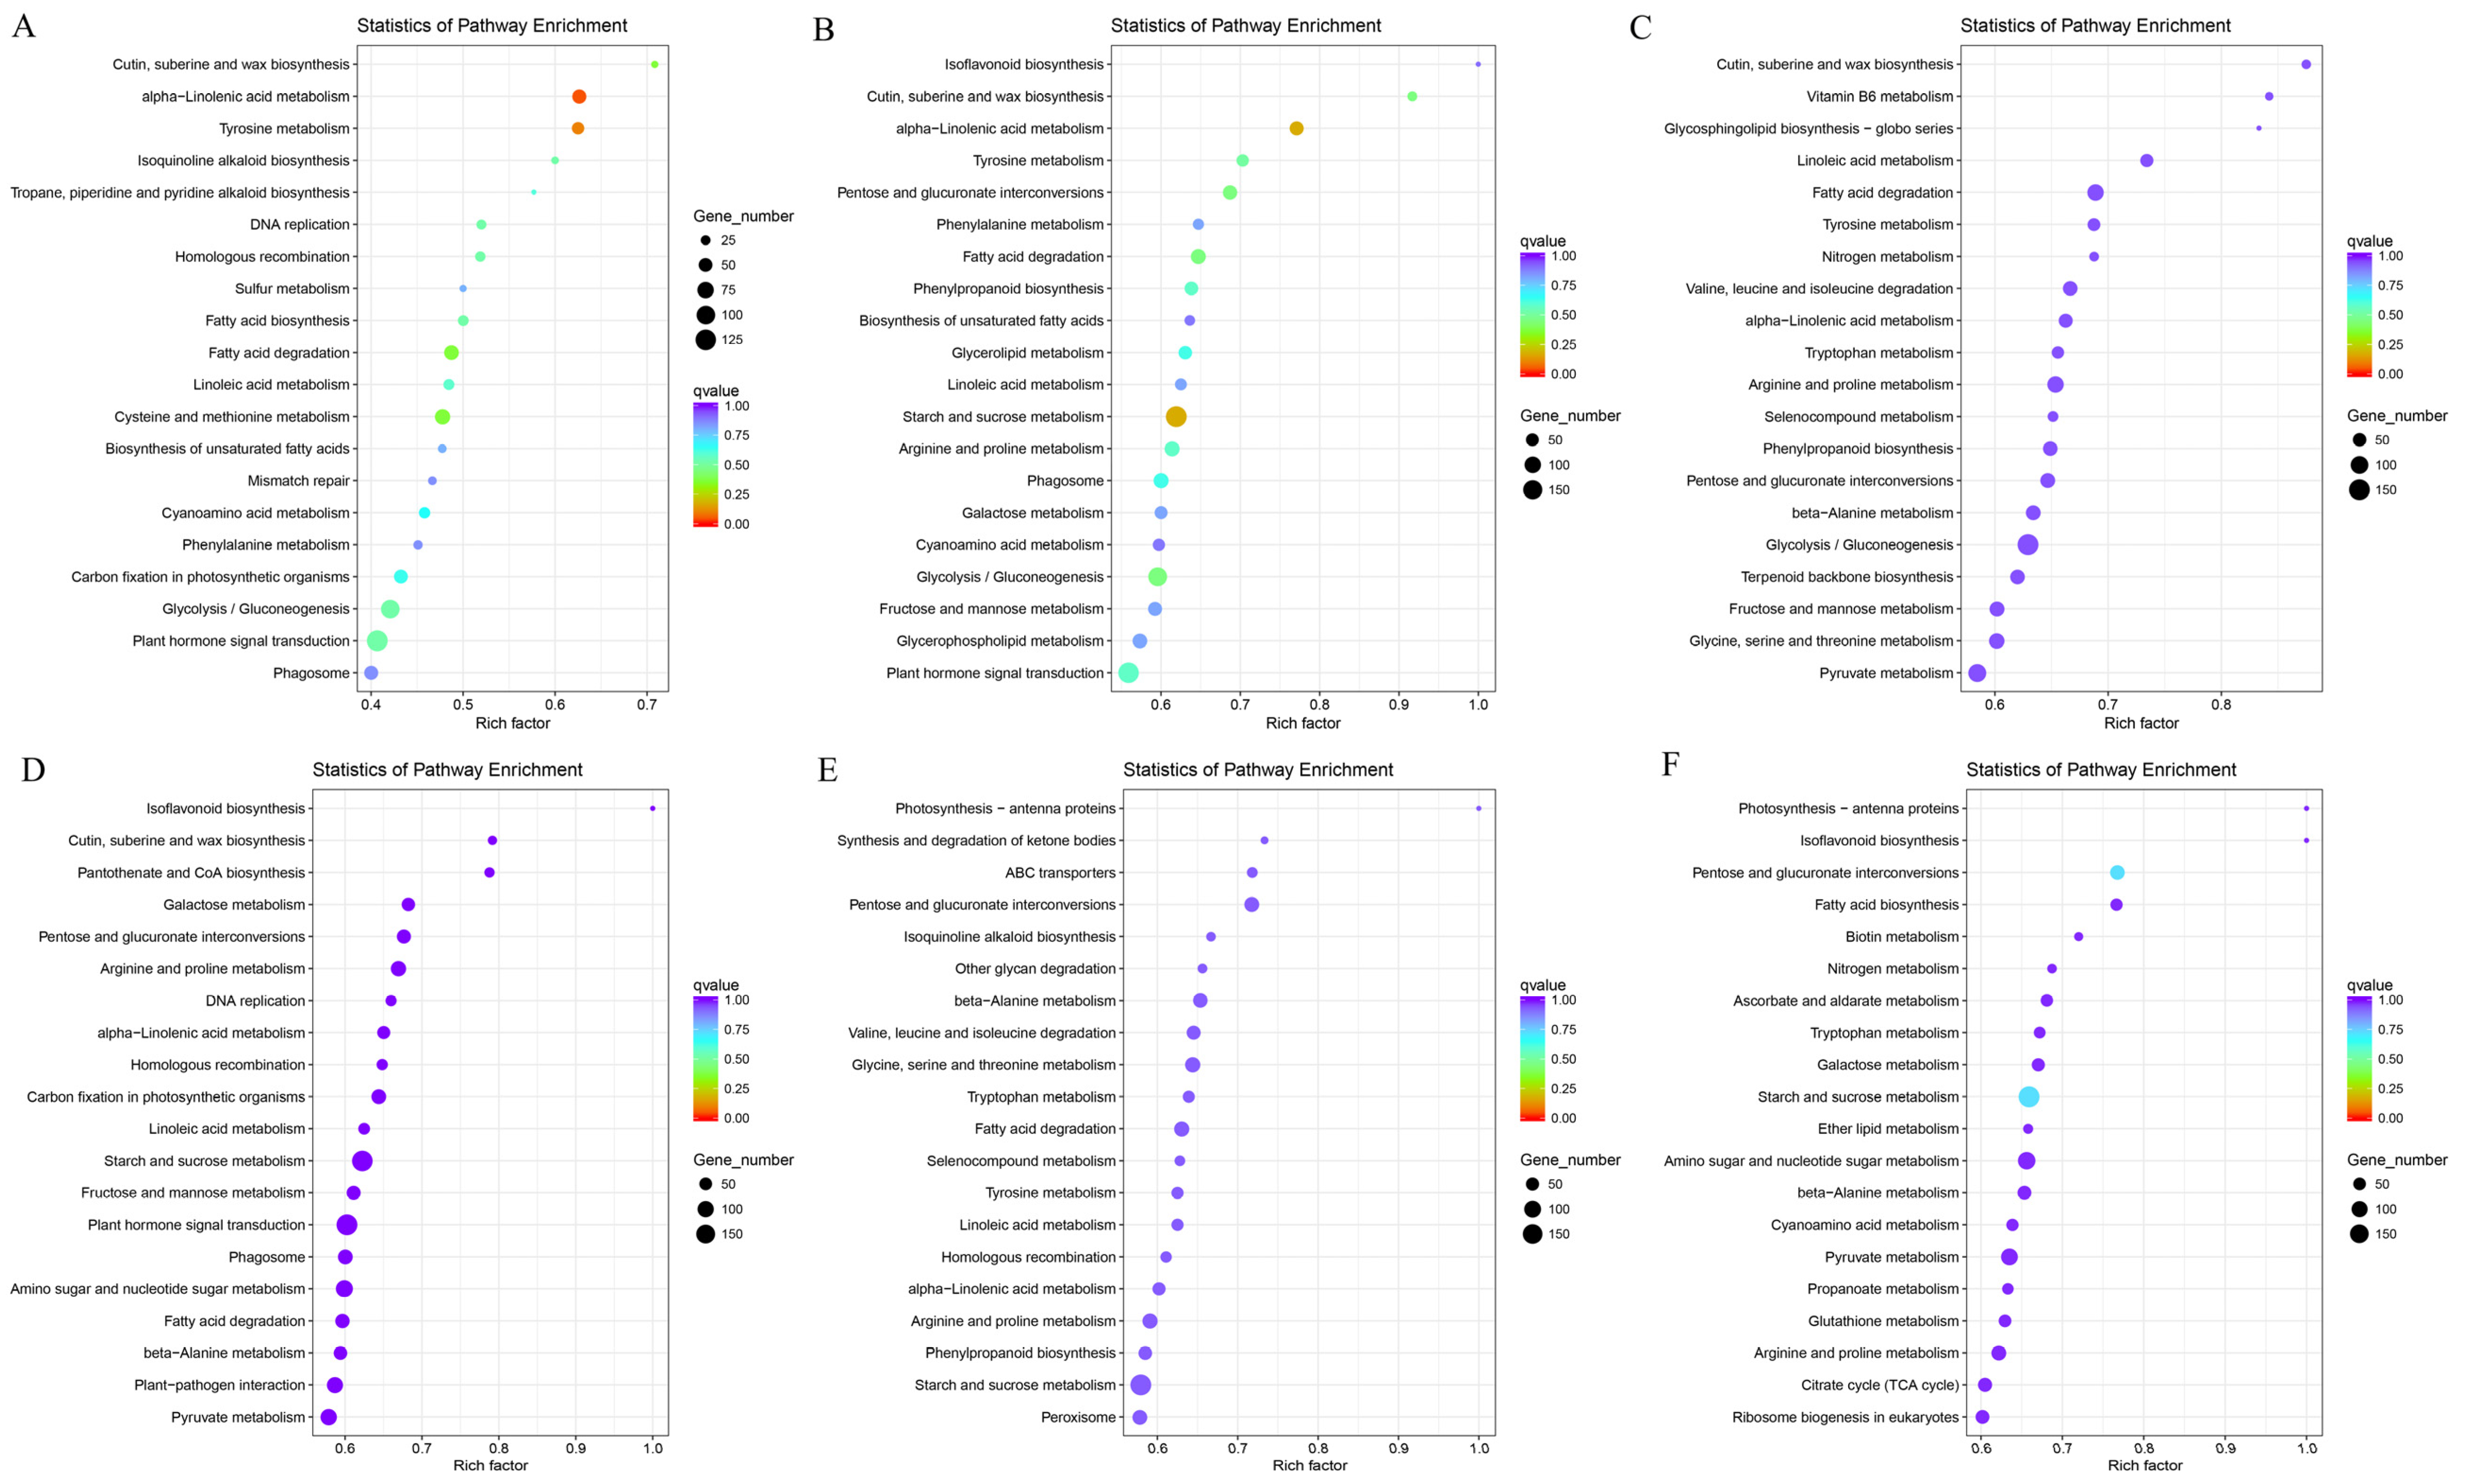
3.4. Functional Enrichment Analysis of DEGs
3.5. Cluster Analysis of DEGs
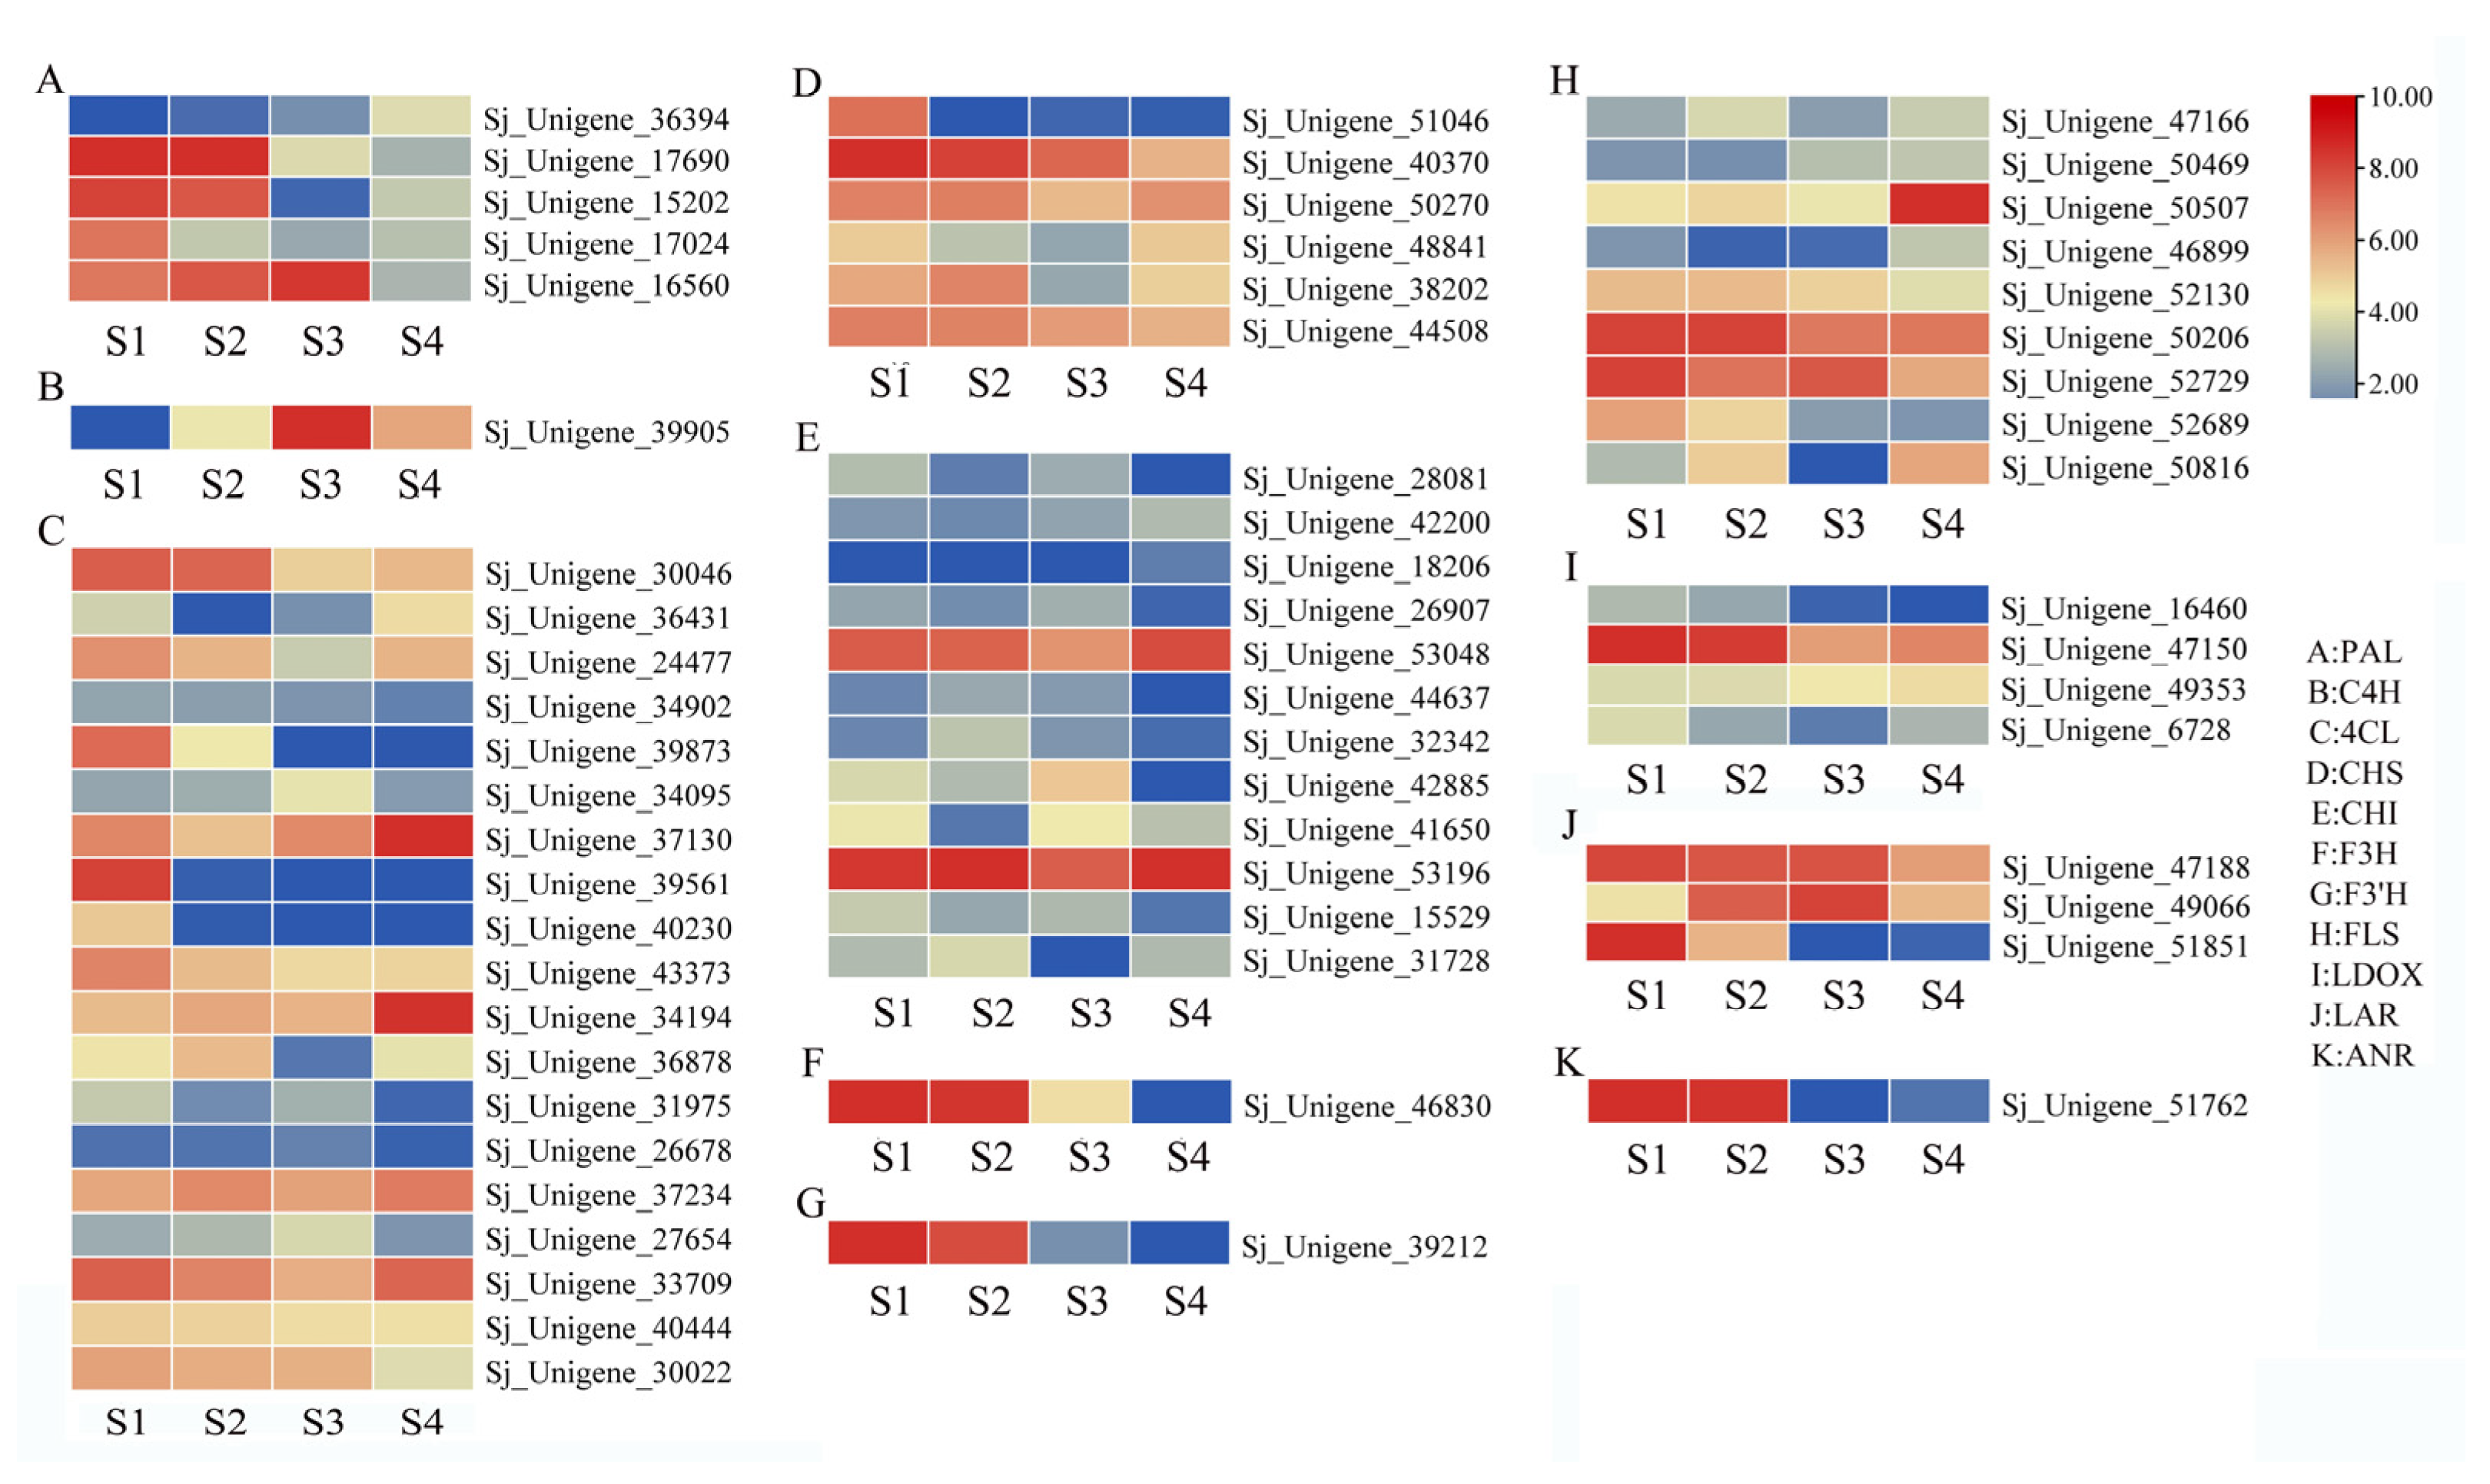
3.6. Expression of Flavonoid Synthesis-Related Genes in the Flower of S. japonicum
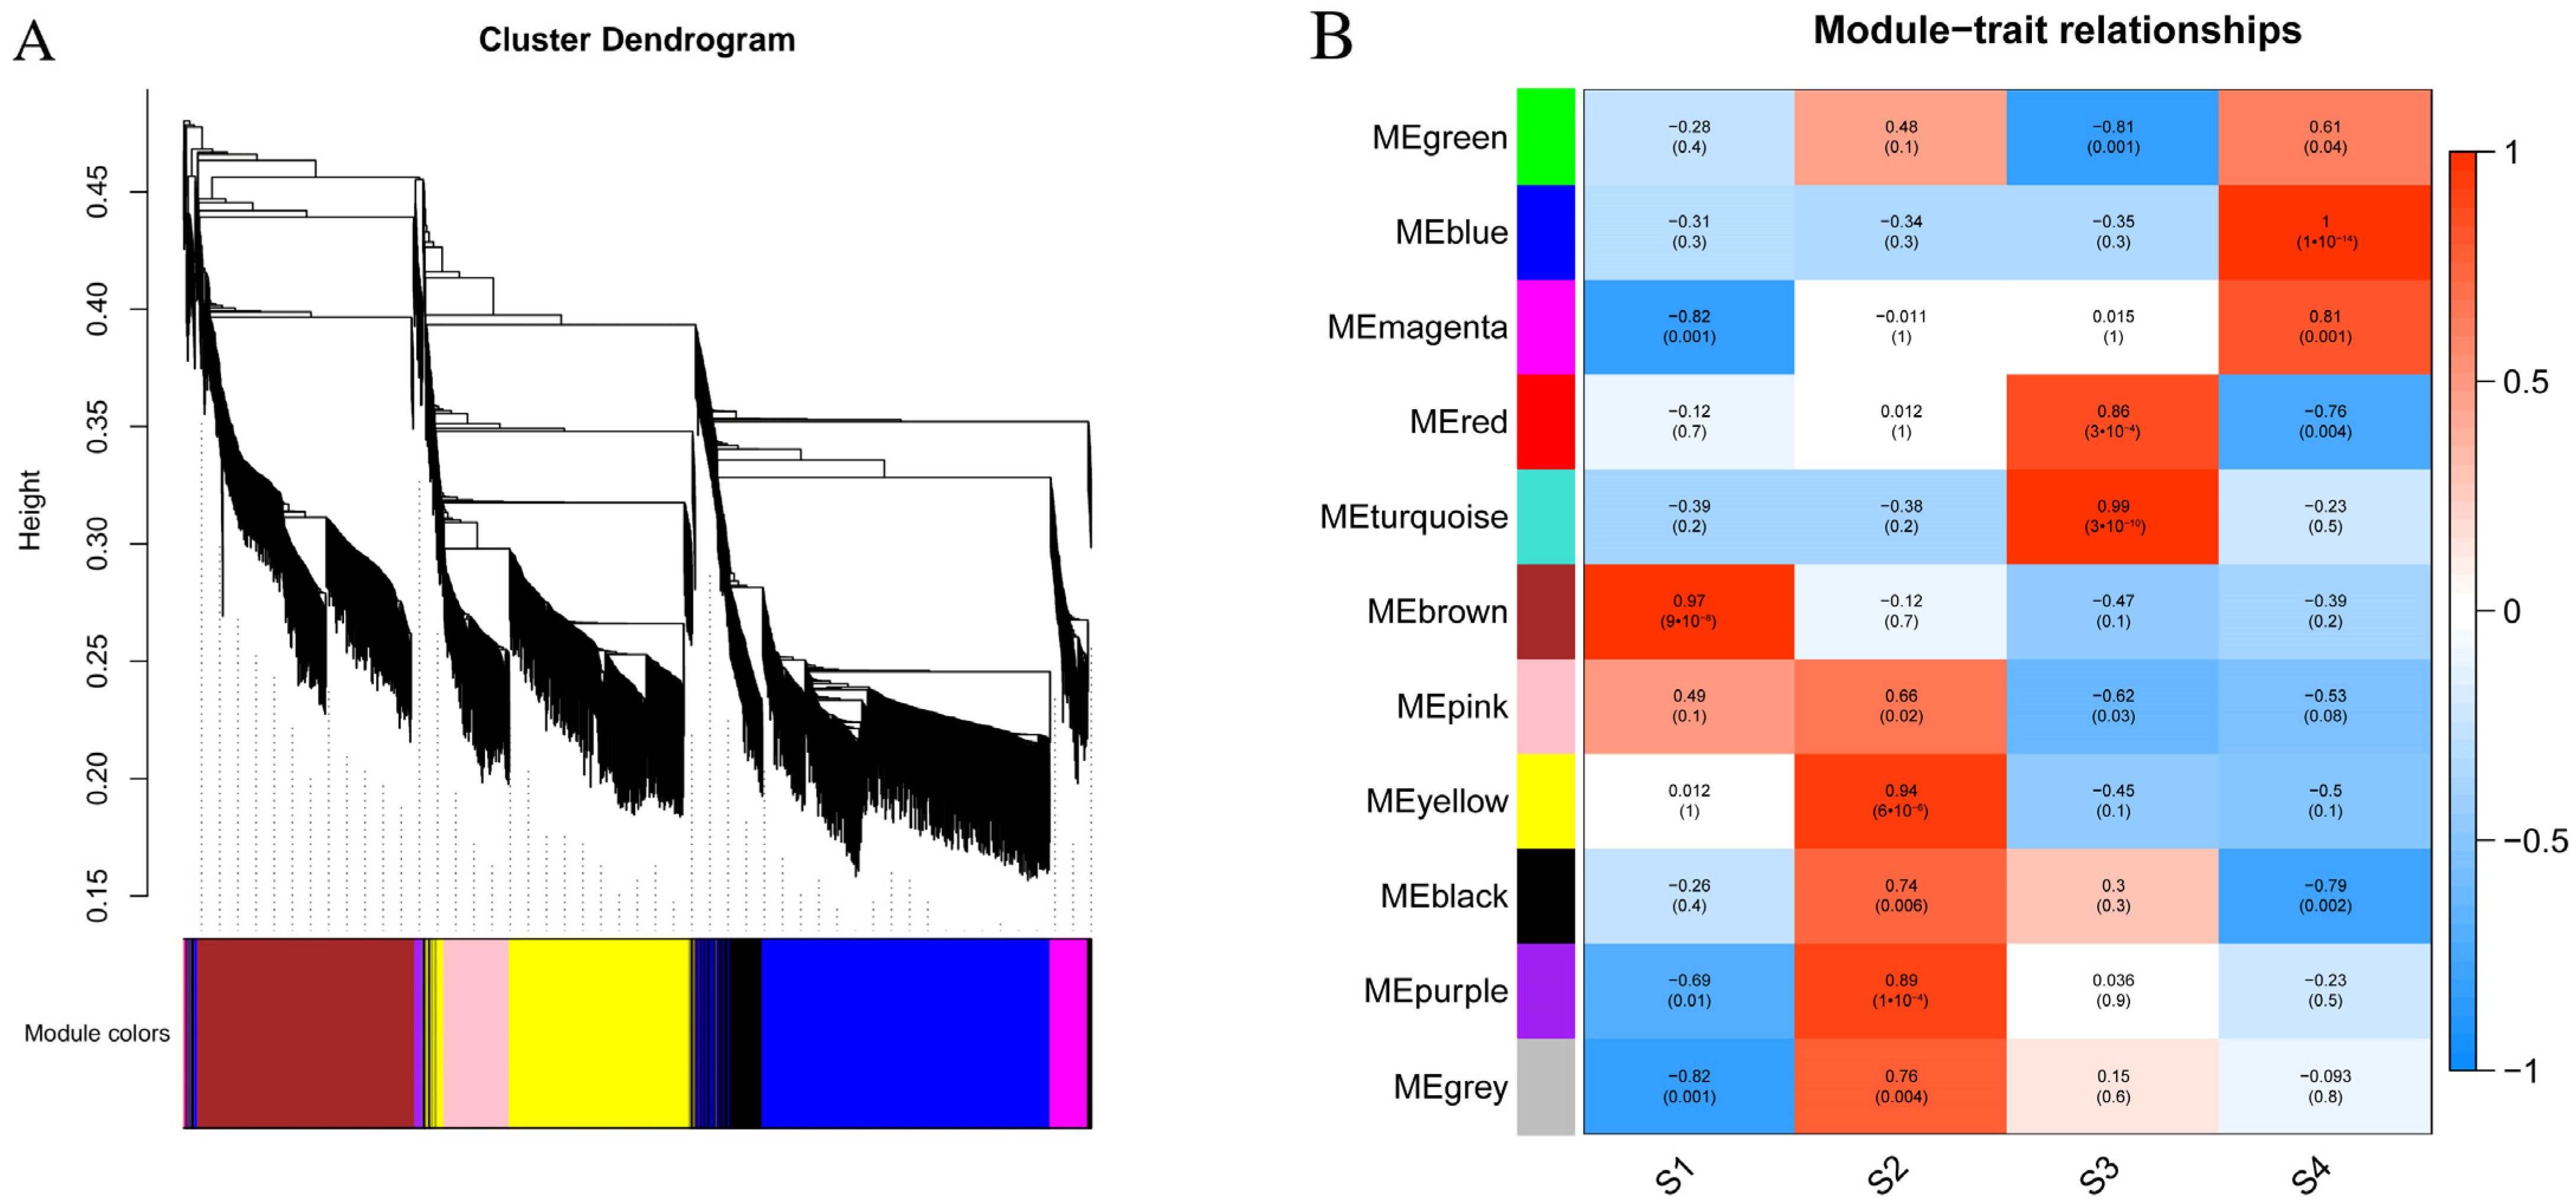
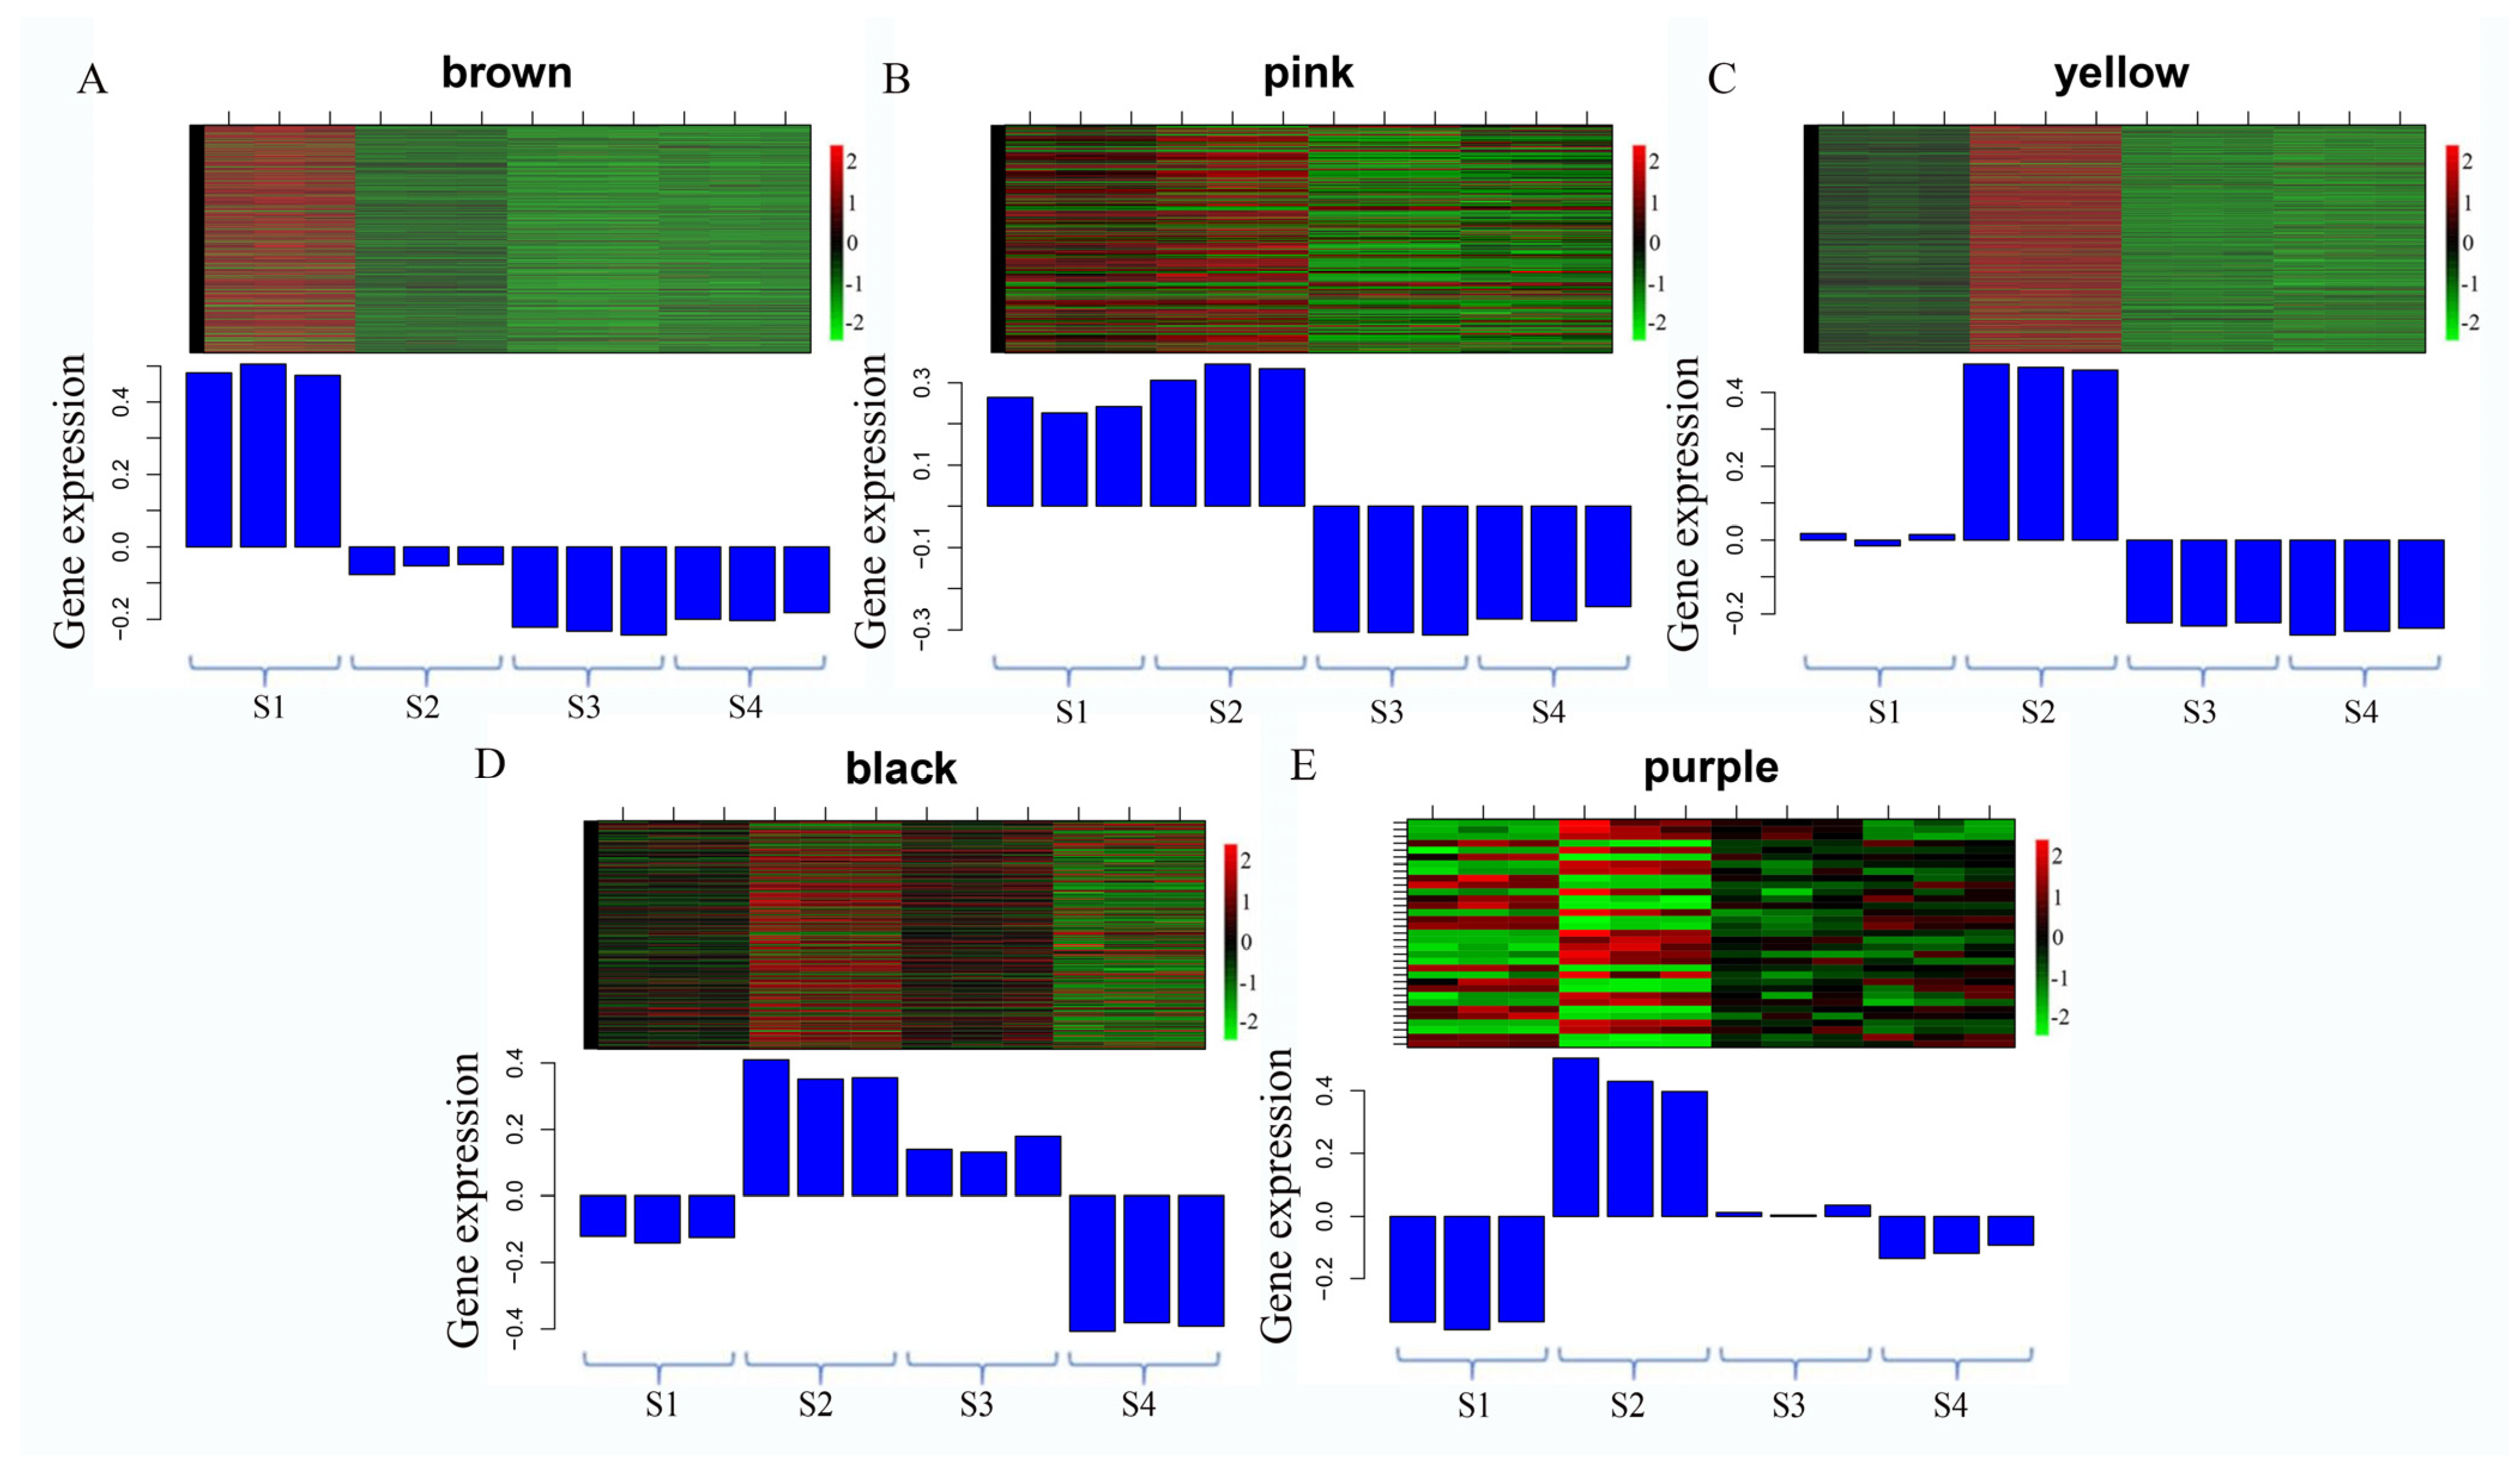
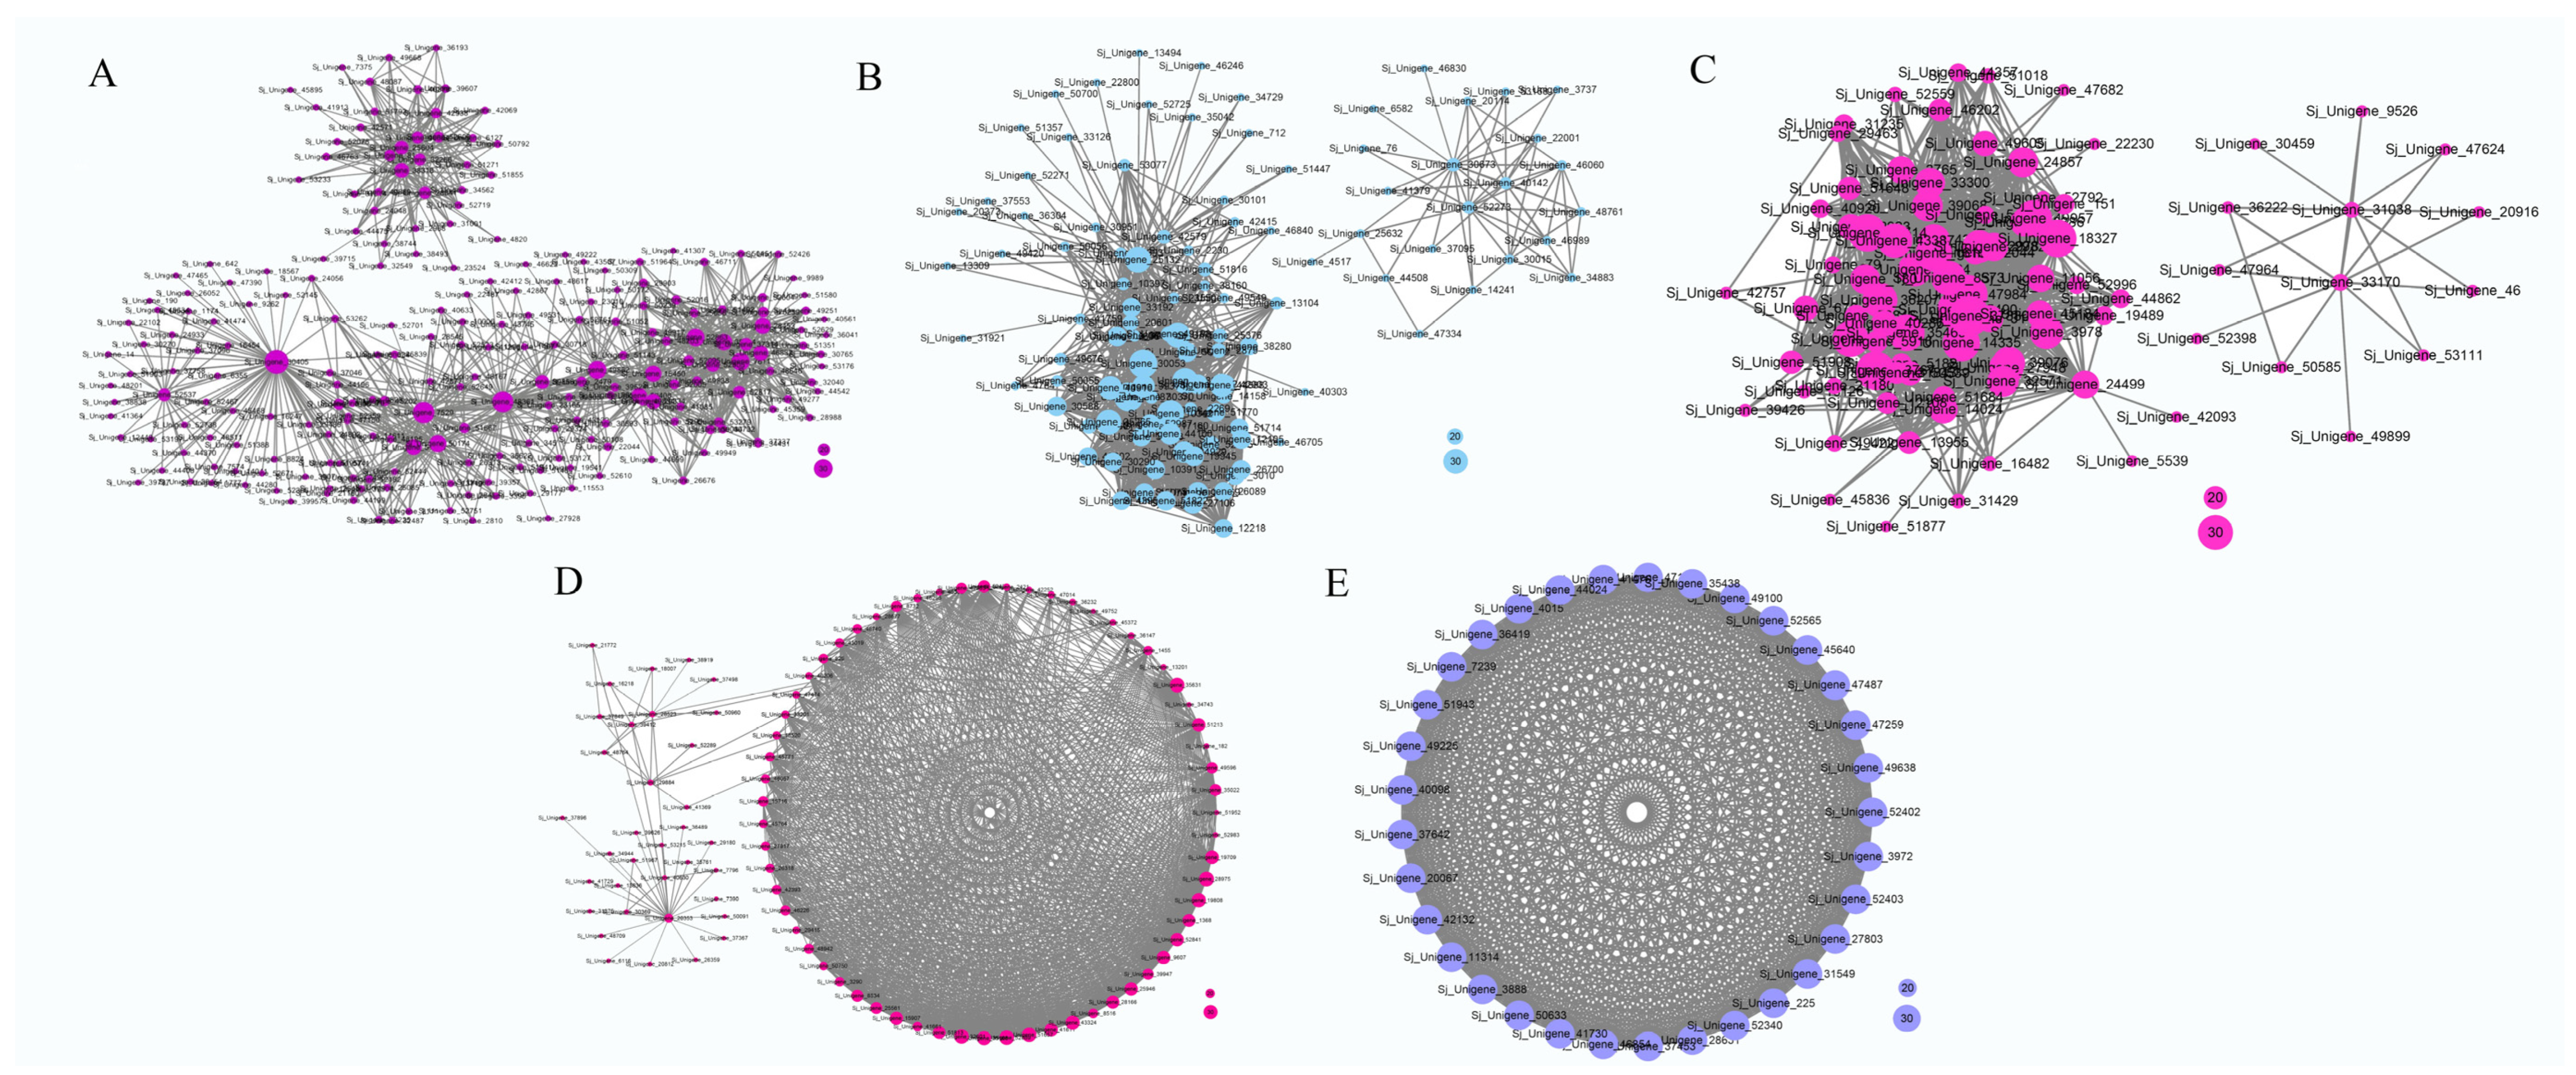
3.7. Construction of Gene Co-Expression Network
4. Discussion
4.1. Generation of Comprehensive and High-Quality Transcriptomic Data of S. japonicum
4.2. Function of Genes Involved in Flavonoid Biosynthesis
4.3. The Candidate Transcription Factors Might Regulate Flavonoids Biosynthesis in S. japonicum Flower
5. Conclusions
Supplementary Materials
Author Contributions
Funding
Institutional Review Board Statement
Informed Consent Statement
Data Availability Statement
Conflicts of Interest
References
- Horosanskaia, E.; Minh Nguyen, T.; Dinh Vu, T.; Seidel-Morgenstern, A.; Lorenz, H. Crystallization-based isolation of pure rutin from herbal extract of Sophora japonica L. Org. Process Res. Dev. 2017, 21, 1769–1778. [Google Scholar] [CrossRef]
- Wang, J.R.; Li, L.Y.; Tan, J.; Song, X.H.; Chen, D.X.; Xu, J.; Ding, G. Variations in the components and antioxidant and tyrosinase inhibitory activities of Styphnolobium japonicum (L.) schott extract during flower maturity stages. Chem. Biodivers. 2019, 16, e1800504. [Google Scholar] [CrossRef]
- Wang, X.Y.; Tian, L.; Feng, S.J.; Wei, A.Z. Identifying potential flavonoid biosynthesis regulator in Zanthoxylum bungeanum Maxim. by genome-wide characterization of the MYB transcription factor gene family. J. Integr. Agr. 2022, 21, 1997–2018. [Google Scholar] [CrossRef]
- He, X.R.; Bai, Y.J.; Zhao, Z.F.; Wang, X.X.; Fang, J.C.; Huang, L.H.; Zeng, M.; Zhang, Q.; Zhang, Y.J.; Zheng, X.H. Local and traditional uses, phytochemistry, and pharmacology of Sophora japonica L.: A review. J. Ethnopharmacol. 2016, 187, 160–182. [Google Scholar] [CrossRef]
- Tang, R.Y.; Lu, Y.R.; Hou, C.Y.; Peng, J.X.; Wang, W.; Guo, X.L. Co-supplementation of flos sophorae extract with tremella fuciformis polysaccharides improves physicochemical, textural, rheological, and antioxidant properties of low-fat yogurts. J. Food Quality 2020, 2020, 2048756. [Google Scholar] [CrossRef]
- Tang, R.Y.; Luo, J.; Wang, W.; Liu, D.Y.; Wang, G.Z.; Guo, X.L. Rutin’s natural source Flos Sophorae as potential antioxidant and improver of fungal community in Chinese sausages. LWT-Food Sci. Technol. 2019, 101, 435–443. [Google Scholar] [CrossRef]
- Yang, Y.; Xia, Y.; Song, X.; Mu, Z.; Qiu, H.; Tao, L.; Ai, L. The potential of flos sophorae immaturus as a pigment-stabilizer to improve the monascus pigments preservation, flavor profiles, and sensory characteristic of Hong Qu Huangjiu. Front. Microbiol. 2021, 12, 678903. [Google Scholar] [CrossRef] [PubMed]
- Elberry, A.; Mufti, S.; Al-Maghrabi, J.; Ghareib, S.; Mosli, H.; El-Halawany, A.; Abdel-Sattar, E. The protective effect of Sophora japonica on prostatic hypertrophy and inflammation in rat. Inflammopharmacology 2020, 28, 1525–1536. [Google Scholar] [CrossRef] [PubMed]
- Wang, T.; Miao, M.S.; Bai, M.; Li, Y.; Li, M.; Li, C.R.; Xu, Y.Y. Effect of Sophora japonica total flavonoids on pancreas, kidney tissue morphology of streptozotocin-induced diabetic mice model. Saudi J. Biol. Sci. 2017, 24, 741–747. [Google Scholar] [CrossRef] [PubMed]
- Zhang, Y.; Wang, Q.; Wang, Y.D.; Sun, B.; Leng, X.W.; Li, Q.; Ren, L.Q. Effect of rutin on cisplatin-induced damage in human mesangial cells via apoptotic pathway. Hum. Exp. Toxicol. 2019, 38, 118–128. [Google Scholar] [CrossRef] [PubMed]
- Dang, D.X.; Cho, S.; Wang, H.; Seok, W.J.; Ha, J.H.; Kim, I.H. Quercetin extracted from Sophora japonica flower improves growth performance, nutrient digestibility, cecal microbiota, organ indexes, and breast quality in broiler chicks. Anim. Biosci. 2022, 35, 577–586. [Google Scholar] [CrossRef]
- Xie, Z.; Lam, S.; Wu, J.; Yang, D.; Xu, X. Chemical fingerprint and simultaneous determination of flavonoids in Flos Sophorae Immaturus by HPLC-DAD and HPLC-DAD-ESI-MS/MS combined with chemometrics analysis. Anal. Methods 2014, 6, 4328–4335. [Google Scholar] [CrossRef]
- Yao, W.R.; Wang, S.T.; Chen, Y.; Wang, H.Y. Composition and antibacterial activity of essential oils of flos sophorae immaturus. Int. J. Food Prop. 2011, 14, 903–913. [Google Scholar] [CrossRef]
- Hendrich, A.B.; Malon, R.; Pola, A.; Shirataki, Y.; Motohashi, N.; Michalak, K. Differential interaction of Sophora isoflavonoids with lipid bilayers. Eur. J. Phar. Sci. 2002, 16, 201–208. [Google Scholar] [CrossRef]
- Maksimenko, E.V.; Lekar, A.V.; Borisenko, S.N.; Khizrieva, S.S.; Vetrova, E.V.; Borisenko, N.I.; Minkin, V.I. The development of a one-step method for production of the antioxidant quercetin from flower buds of the Sophora Japonica (Sophora japonica L.) in a subcritical water medium. Russ. J. Phys. Chem. B 2018, 12, 1269–1275. [Google Scholar] [CrossRef]
- Wang, R.P.; Chang, Y.; Tan, Z.J.; Li, F.F. A novel combined process for extracting, separating and recovering flavonoids from flos sophorae immaturus. Sep. Purif. Technol. 2017, 172, 422–432. [Google Scholar] [CrossRef]
- Xi, J.; Yan, L.G. Optimization of pressure-enhanced solid-liquid extraction of flavonoids from Flos Sophorae and evaluation of their antioxidant activity. Sep. Purif. Technol. 2017, 175, 170–176. [Google Scholar] [CrossRef]
- Abudayeh, Z.H.M.; Azzam, K.M.A.; Cholak, I.S.; Karpiuk, U.V.; Naddaf, A.; Aboul-Enein, H.Y. Analysis of essential oil in Sophora japonica L. flower buds on different stages of development by gas chromatography-mass spectrometry. World J. Anal. Chem. 2015, 3, 15–20. [Google Scholar]
- Wang, J.R.; Song, X.H.; Li, L.Y.; Gao, S.J.; Shang, F.H.; Zhang, X.M.; Yang, Y. Metabolomic analysis reveals dynamic changes in secondary metabolites of Sophora japonica L. during flower maturation. Front. Plant Sci. 2022, 13, 916410. [Google Scholar] [CrossRef]
- Salmela, L.; Rivals, E. LoRDEC: Accurate and efficient long read error correction. Bioinformatics 2014, 30, 3506–3514. [Google Scholar] [CrossRef]
- Fu, L.M.; Niu, B.F.; Zhu, Z.W.; Wu, S.T.; Li, W.Z. CD-HIT: Accelerated for clustering the next-generation sequencing data. Bioinformatics 2012, 28, 3150–3152. [Google Scholar] [CrossRef]
- Zheng, Y.; Jiao, C.; Sun, H.; Rosli, H.G.; Pombo, M.A.; Zhang, P.F.; Banf, M.; Dai, X.B.; Martin, G.B.; Giovannoni, J.J.; et al. ITAK: A Program for Genome-Wide Prediction and Classification of Plant Transcription Factors, Transcriptional Regulators, and Protein Kinases. Mol. Plant 2016, 9, 1667–1670. [Google Scholar] [CrossRef]
- Li, B.; Dewey, C.N. RSEM: Accurate Transcript Quantification from Rna-Seq Data with or Without a Reference Genome. BMC Bioinformatics 2011, 12, 323. [Google Scholar] [CrossRef]
- Love, M.I.; Huber, W.; Anders, S. Moderated estimation of fold change and dispersion for RNA-seq data with DESeq2. Genome Biol. 2014, 15, 550. [Google Scholar] [CrossRef]
- Young, M.D.; Wakefield, M.J.; Smyth, G.K.; Oshlack, A. Gene ontology analysis for RNA-seq: Accounting for selection bias. Genome Biol. 2010, 11, R14. [Google Scholar] [CrossRef] [PubMed]
- Bu, D.; Luo, H.; Huo, P.; Wang, Z.; Zhang, S.; He, Z.; Wu, Y.; Zhao, L.; Liu, J.; Guo, J.; et al. KOBAS-i: Intelligent prioritization and exploratory visualization of biological functions for gene enrichment analysis. Nucleic Acids Res. 2021, 49, W317–W325. [Google Scholar] [CrossRef]
- McCarthy, A. Third Generation DNA Sequencing: Pacific Biosciences’ Single Molecule Real Time Technology. Chem. Biol. 2010, 17, 675–676. [Google Scholar] [CrossRef] [PubMed]
- Rhoads, A.; Au, K.F. PacBio Sequencing and Its Applications. Genom. Proteom. Bioinf. 2015, 13, 278–289. [Google Scholar] [CrossRef]
- Wang, B.; Kumar, V.; Olson, A.; Ware, D. Reviving the Transcriptome Studies: An Insight into the Emergence of Single-Molecule Transcriptome Sequencing. Front. Genet. 2019, 10, 384. [Google Scholar] [CrossRef] [PubMed]
- Zhao, L.; Zhang, H.; Kohnen, M.V.; Prasad, K.V.S.K.; Gu, L.; Reddy, A.S.N. Analysis of Transcriptome and Epitranscriptome in Plants Using PacBio Iso-Seq and Nanopore-Based Direct RNA Sequencing. Front. Genet. 2019, 10, 253. [Google Scholar] [CrossRef]
- Madden, E.; McLachlan, C.; Oketch-Rabah, H.; Calderon, A.I. United States Pharmacopeia comprehensive safety review of Styphnolobium japonicum flower and flower bud. Phytother. Res. 2022, 36, 2061–2071. [Google Scholar] [CrossRef]
- Guo, Z.; Wu, X.; Zhao, X.; Fan, J.; Lu, X.; Wang, L. An edible antioxidant film of Artemisia sphaerocephala Krasch. gum with Sophora japonica extract for oil packaging. Food Packag. Shelf 2020, 24, 100460. [Google Scholar] [CrossRef]
- Vetrova, E.V.; Maksimenko, E.V.; Borisenko, S.N.; Lekar, A.V.; Borisenko, N.I.; Minkin, V.I. Extraction of Rutin and Quercetin Antioxidants from the Buds of Sophora Japonica (Sophora japonica L.) by Subcritical Water. Russ. J. Phys. Chem. B 2017, 11, 1202–1206. [Google Scholar] [CrossRef]
- Chua, L.S. A review on plant-based rutin extraction methods and its pharmacological activities. J. Ethnopharmacol. 2013, 150, 805–817. [Google Scholar] [CrossRef]
- Yang, X.; Zhang, X.S.; Mu, H.M. Research advances on medicinal ingredients and extraction method of Sophora japonica L. North. Hortic. 2011, 33, 175–178. [Google Scholar]
- Carvalho, D.; Paulino, M.; Polticelli, F.; Arredondo, F.; Williams, R.J.; Abin-Carriquiry, J.A. Structural evidence of quercetin multi-target bioactivity: A reverse virtual screening strategy. Eur. J. Phar. Sci. 2017, 106, 393–403. [Google Scholar] [CrossRef]
- Xiao, J.B.; Muzashvili, T.S.; Georgiev, M.I. Advances in the biotechnological glycosylation of valuable flavonoids. Biotechnol. Adv. 2014, 32, 145–1156. [Google Scholar] [CrossRef]
- Alizadeh, S.R.; Ebrahimzadeh, M.A. Quercetin derivatives: Drug design, development, and biological activities, a review. Eur. J. Phar. Sci. 2022, 229, 114068. [Google Scholar] [CrossRef] [PubMed]
- Kim, J.M.; Yun-Choi, H.S. Anti-platelet effects of flavonoids and flavonoid-glycosides from Sophora japonica. Arch. Pharm. Res. 2008, 31, 886–890. [Google Scholar] [CrossRef]
- Lo, Y.H.; Lin, R.D.; Lin, Y.P.; Liu, Y.L.; Lee, M.H. Active constituents from Sophora japonica exhibiting cellular tyrosinase inhibition in human epidermal melanocytes. J. Ethnopharmacol. 2009, 124, 625–629. [Google Scholar] [CrossRef] [PubMed]
- Wang, Z.L.; Wang, S.; Kuang, Y.; Hu, Z.M.; Qiao, X.; Ye, M. A comprehensive review on phytochemistry, pharmacology, and flavonoid biosynthesis of Scutellaria baicalensis. Pharm. Biol. 2018, 56, 465–484. [Google Scholar] [CrossRef] [PubMed]
- Barros, J.; Dixon, R.A. Plant Phenylalanine/Tyrosine Ammonia-lyases. Trends Plant Sci. 2020, 25, 66–79. [Google Scholar] [CrossRef] [PubMed]
- Liu, W.; Feng, Y.; Yu, S.; Fan, Z.; Li, X.; Li, J.; Yin, H. The flavonoid biosynthesis network in plants. Int. J. Mol. Sci. 2021, 22, 12824. [Google Scholar] [CrossRef] [PubMed]
- Julia, W.; Maike, P. Functional expression and characterization of cinnamic acid 4-hydroxylase from the hornwort Anthoceros agrestis in Physcomitrella patens. Plant Cell Rep. 2020, 39, 597–607. [Google Scholar]
- Lavhale, S.G.; Joshi, R.S.; Kumar, Y.; Giri, A.P. Functional insights into two Ocimum kilimandscharicum 4-coumarate-CoA ligases involved in phenylpropanoid biosynthesis. Int. J. Biol. Macromol. 2021, 181, 202–210. [Google Scholar] [CrossRef]
- Li, Y.; Kim, J.I.; Pysh, L.; Chapple, C. Four isoforms of Arabidopsis 4-Coumarate:CoA ligase have overlapping yet distinct roles in phenylpropanoid metabolism. Plant Physiol. 2015, 169, 2409–2421. [Google Scholar]
- Gao, S.; Yu, H.N.; Xu, R.X.; Cheng, A.X.; Lou, H.X. Cloning and functional characterization of a 4-coumarate CoA ligase from liverwort Plagiochasma appendiculatum. Phytochemistry 2015, 111, 48–58. [Google Scholar] [CrossRef]
- Pietrowskaborek, M.; Chadzinikolau, T.; Kozłowska, M. Effect of urban pollution on 4-coumarate:CoA ligase and flavonoid accumulation in Berberis thunbergii. Dendrobiology 2010, 64, 79–85. [Google Scholar]
- Feng, Q.; Gui-Gong, G.; Yang, Z.; Hui-Chun, X.; Lan, J.; Jun, S.; Zhi, C. Molecular cloning and expression profiling of a chalcone synthase gene from Lamiophlomis rotata. J. Genet. 2015, 94, 193–205. [Google Scholar] [CrossRef]
- Wu, Z.; Liu, H.; Zhan, W.; Yu, Z.; Qin, E.; Liu, S.; Yang, T.; Xiang, N.; Kudrna, D.; Chen, Y.; et al. The chromosome-scale reference genome of safflower (Carthamus tinctorius) provides insights into linoleic acid and flavonoid biosynthesis. Plant Biotechnol. J. 2021, 19, 1725–1742. [Google Scholar] [CrossRef]
- Nabavi, S.M.; Šamec, D.; Tomczyk, M.; Milella, L.; Russo, D.; Habtemariam, S.; Suntar, I.; Rastrelli, L.; Daglia, M.; Xiao, J.; et al. Flavonoid biosynthetic pathways in plants: Versatile targets for metabolic engineering. Biotechnol. Adv. 2020, 38, 107316. [Google Scholar] [CrossRef] [PubMed]
- Busche, M.; Acatay, C.; Martens, S.; Weisshaar, B.; Stracke, R. Functional characterisation of Banana (Musa spp.) 2-oxoglutarate-dependent dioxygenases involved in flavonoid biosynthesis. Front. Plant Sci. 2021, 12, 701780. [Google Scholar] [CrossRef] [PubMed]
- Dong, W.; Ma, H.; Chen, C.; Li, Y. Overexpression of the OvBAN gene enhances the proanthocyanidin content in transgenic alfalfa (Medicago sativa L.). Vitr. Cell. Dev. Biol.-Plant 2020, 56, 548–557. [Google Scholar] [CrossRef]
- Giampieri, F.; Gasparrini, M.; Forbes-Hernandez, T.Y.; Mazzoni, L.; Capocasa, F.; Sabbadini, S.; Alvarez-Suarez, J.M.; Afrin, S.; Rosati, C.; Pandolfini, T.; et al. Overexpression of the anthocyanidin synthase gene in strawberry enhances antioxidant capacity and cytotoxic effects on human hepatic cancer cells. J. Agric. Food Chem. 2018, 66, 581–592. [Google Scholar] [CrossRef] [PubMed]
- Li, Y.; Wang, L.J.; Han, Z.J.; Han, Z.J.; Jiang, Y.Z.; Zhao, L.L.; Liu, H.; Yang, L.; Yang, L.; Luo, K.M. Molecular cloning and characterization of PtrLAR3, a gene encoding leucoanthocyanidin reductase from Populus trichocarpa, and its constitutive expression enhances fungal resistance in transgenic plants. J. Exp. Bot. 2012, 63, 2513–2524. [Google Scholar]
- Li, S.; Zachgo, S. TCP3 interacts with R2R3-MYB proteins, promotes flavonoid biosynthesis and negatively regulates the auxin response in Arabidopsis thaliana. Plant J. 2013, 76, 901–913. [Google Scholar] [CrossRef] [PubMed]
- Lloyd, A.; Brockman, A.; Aguirre, L.; Campbell, A.; Bean, A.; Cantero, A.; Gonzalez, A. Advances in the MYB-bHLH-WD repeat (MBW) pigment regulatory model: Addition of a WRKY factor and co-option of an anthocyanin MYB for betalain regulation. Plant Cell Physiol. 2017, 58, 1431–1441. [Google Scholar] [CrossRef] [PubMed]
- Liu, J.; Osbourn, A.; Ma, P. MYB transcription factors as regulators of phenylpropanoid metabolism in plants. Mol. Plant 2015, 8, 689–708. [Google Scholar] [CrossRef]
- Pratyusha, D.S.; Sarada, D.L. MYB transcription factors-master regulators of phenylpropanoid biosynthesis and diverse developmental and stress responses. Plant Cell Rep. 2022, 41, 2245–2260. [Google Scholar] [CrossRef]
- Naing, A.H.; Kim, C.K. Roles of R2R3-MYB transcription factors in transcriptional regulation of anthocyanin biosynthesis in horticultural plants. Plant Mol. Biol. 2018, 98, 1–18. [Google Scholar] [CrossRef]
- Yan, H.; Pei, X.; Zhang, H.; Li, X.; Zhang, X.; Zhao, M.; Chiang, V.L.; Sederoff, R.R.; Zhao, X. MYB-Mediated Regulation of Anthocyanin Biosynthesis. Int. J. Mol. Sci. 2021, 22, 3103. [Google Scholar] [CrossRef]
- Yin, X.; Zhang, Y.; Zhang, L.; Wang, B.; Zhao, Y.; Irfan, M.; Chen, L.; Feng, Y. Regulation of MYB transcription factors of anthocyanin synthesis in lily flowers. Front. Plant Sci. 2021, 12, 761668. [Google Scholar] [CrossRef]
- Premathilake, A.T.; Ni, J.; Bai, S.; Tao, R.; Ahmad, M.; Teng, Y. R2R3-MYB transcription factor PpMYB17 positively regulates flavonoid biosynthesis in pear fruit. Planta 2020, 252, 59. [Google Scholar] [CrossRef]
- Zhao, Y.; Zhang, G.; Tang, Q.; Song, W.; Gao, Q.; Xiang, G.; Li, X.; Liu, G.; Fan, W.; Li, X.; et al. EbMYBP1, a R2R3-MYB transcription factor, promotes flavonoid biosynthesis in Erigeron breviscapus. Front. Plant Sci. 2022, 13, 946827. [Google Scholar] [CrossRef]
- Gao, Q.Q.; Song, W.L.; Li, X.; Xiang, C.F.; Chen, G.; Xiang, G.S.; Liu, X.Y.; Zhang, G.H.; Li, X.N.; Yang, S.C.; et al. Genome-wide identification of bHLH transcription factors: Discovery of a candidate regulator related to flavonoid biosynthesis in Erigeron breviscapus. Front. Plant Sci. 2022, 13, 977694. [Google Scholar] [CrossRef]
- Gao, Y.; Liu, J.; Chen, Y.; Tang, H.; Wang, Y.; He, Y.; Ou, Y.; Sun, X.; Wang, S.; Yao, Y. Tomato SlAN11 regulates flavonoid biosynthesis and seed dormancy by interaction with bHLH proteins but not with MYB proteins. Hortic. Res. 2018, 5, 27. [Google Scholar] [CrossRef]
- Wei, Z.; Cheng, Y.; Zhou, C.; Li, D.; Gao, X.; Zhang, S.; Chen, M. Genome-wide identification of direct targets of the TTG1–bHLH–MYB complex in regulating trichome formation and flavonoid accumulation in Arabidopsis thaliana. Int. J. Mol. Sci. 2019, 20, 5014. [Google Scholar] [CrossRef]
- Xiang, L.L.; Liu, X.F.; Li, X.; Yin, X.R.; Grierson, D.; Li, F.; Chen, K.S. A novel bHLH transcription factor involved in regulating anthocyanin biosynthesis in Chrysanthemums (Chrysanthemum morifolium Ramat.). PLoS ONE 2015, 10, e0143892. [Google Scholar] [CrossRef] [PubMed]
- Wang, P.; Su, L.; Gao, H.; Jiang, X.; Wu, X.; Li, Y.; Zhang, Q.; Wang, Y.; Ren, F. Genome-wide characterization of bHLH genes in grape and analysis of their potential relevance to abiotic stress tolerance and secondary metabolite biosynthesis. Front. Plant Sci. 2018, 9, 64. [Google Scholar] [CrossRef] [PubMed]
- Zhao, Y.; Zhang, Y.Y.; Liu, H.; Zhang, X.-S.; Ni, R.; Wang, P.Y.; Gao, S.; Lou, H.X.; Cheng, A.X. Functional characterization of a liverworts bHLH transcription factor involved in the regulation of bisbibenzyls and flavonoids biosynthesis. BMC Plant Biol. 2019, 19, 497. [Google Scholar] [CrossRef] [PubMed]
- Chen, C.; Xu, L.; Xia, W.; Qi, C.; Liu, J.; Hua, B.; Zhang, Z.; Qi, X.; Miao, M. Metabolomics and transcription profiling of pumpkin fruit reveals enhanced bioactive flavonoids and coumarins in giant pumpkin (Cucurbita maxima). J. Agric. Food Chem. 2023, 71, 10459–10469. [Google Scholar] [CrossRef] [PubMed]
- Zhu, J.; Guo, X.; Li, X.; Tang, D. Composition of flavonoids in the petals of freesia and prediction of four novel transcription factors involving in Freesia flavonoid pathway. Front. Plant Sci. 2021, 12, 756300. [Google Scholar] [CrossRef] [PubMed]

| Database | Annotated Number | Percentage |
|---|---|---|
| NR | 25,261 | 0.99 |
| SwissProt | 22,482 | 0.88 |
| KEGG | 25,175 | 0.99 |
| KOG | 16,474 | 0.65 |
| GO | 18,952 | 0.75 |
| NT | 25,116 | 0.99 |
| Pfam | 18,952 | 0.75 |
| Comparison Groups | Total Number | Upregulated | Downregulated |
|---|---|---|---|
| S1-vs.-S2 | 7964 | 5048 | 2916 |
| S1-vs.-S3 | 11,824 | 6570 | 5254 |
| S1-vs.-S4 | 12,768 | 7576 | 5192 |
| S2-vs.-S3 | 12,804 | 6558 | 6246 |
| S2-vs.-S4 | 12,278 | 6895 | 5383 |
| S3-vs.-S4 | 13,215 | 7439 | 5776 |
| Cluster Name | Enrichment Pathway Name | Gene Number | Gene Expression Patterns |
|---|---|---|---|
| Cluster 2 | Base excision repair | 41 | 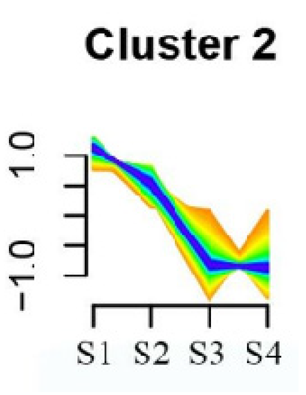 |
| Butanoate metabolism | |||
| Valine, leucine, and isoleucine biosynthesis | |||
| Linoleic acid metabolism | |||
| Homologous recombination | |||
| Synthesis and degradation of ketone bodies | |||
| Monobactam biosynthesis | |||
| Glycosphingolipid biosynthesis—ganglio series | |||
| Flavonoid biosynthesis | |||
| Cluster 5 | α-Linolenic acid metabolism | 172 |  |
| Glycolysis/Gluconeogenesis | |||
| Tyrosine metabolism | |||
| Fatty acid degradation | |||
| Taurine and hypotaurine metabolism | |||
| Isoflavonoid biosynthesis | |||
| Galactose metabolism | |||
| Linoleic acid metabolism | |||
| Cutin, suberine and wax biosynthesis | |||
| Ubiquinone and other terpenoid-quinone biosynthesis | |||
| Peroxisome | |||
| Pentose phosphate pathway | |||
| Cluster 7 | Aminoacyl-tRNA biosynthesis | 24 | 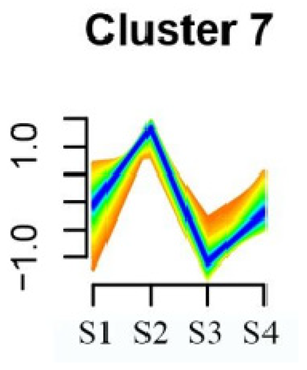 |
| Porphyrin and chlorophyll metabolism | |||
| Diterpenoid biosynthesis | |||
| Vitamin B6 metabolism | |||
| Ubiquinone and other terpenoid–quinone biosynthesis | |||
| Cluster 9 | Spliceosome | 58 | 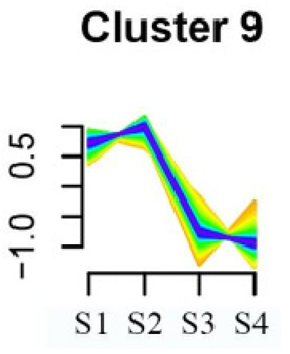 |
| Linoleic acid metabolism | |||
| Isoquinoline alkaloid biosynthesis | |||
| Flavonoid biosynthesis | |||
| Other glycan degradation | |||
| Sphingolipid metabolism | |||
| Carbon fixation in photosynthetic organisms | |||
| Cluster 13 | Fatty acid biosynthesis | 69 |  |
| Biotin metabolism | |||
| Starch and sucrose metabolism | |||
| Amino sugar and nucleotide sugar metabolism | |||
| Steroid biosynthesis | |||
| Tryptophan metabolism | |||
| Cluster 18 | Linoleic acid metabolism | 62 | 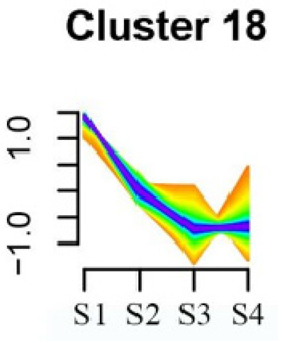 |
| DNA replication | |||
| α-Linolenic acid metabolism | |||
| Spliceosome | |||
| Flavonoid biosynthesis | |||
| Phenylpropanoid biosynthesis | |||
| Pyrimidine metabolism |
Disclaimer/Publisher’s Note: The statements, opinions and data contained in all publications are solely those of the individual author(s) and contributor(s) and not of MDPI and/or the editor(s). MDPI and/or the editor(s) disclaim responsibility for any injury to people or property resulting from any ideas, methods, instructions or products referred to in the content. |
© 2024 by the authors. Licensee MDPI, Basel, Switzerland. This article is an open access article distributed under the terms and conditions of the Creative Commons Attribution (CC BY) license (https://creativecommons.org/licenses/by/4.0/).
Share and Cite
Wu, M.; Zhang, Y.; Guo, P.; Liu, H.; Xia, L.; Wang, M.; Zeng, C.; Wang, H.; Shang, F. Full-Length Transcriptome Sequencing and Comparative Transcriptomic Analyses Provide Comprehensive Insight into Molecular Mechanisms of Flavonoid Metabolites Biosynthesis in Styphnolobium japonicum. Genes 2024, 15, 329. https://doi.org/10.3390/genes15030329
Wu M, Zhang Y, Guo P, Liu H, Xia L, Wang M, Zeng C, Wang H, Shang F. Full-Length Transcriptome Sequencing and Comparative Transcriptomic Analyses Provide Comprehensive Insight into Molecular Mechanisms of Flavonoid Metabolites Biosynthesis in Styphnolobium japonicum. Genes. 2024; 15(3):329. https://doi.org/10.3390/genes15030329
Chicago/Turabian StyleWu, Miao, Yu Zhang, Peng Guo, Huiyuan Liu, Linkui Xia, Mengyuan Wang, Chuqi Zeng, Hongwei Wang, and Fude Shang. 2024. "Full-Length Transcriptome Sequencing and Comparative Transcriptomic Analyses Provide Comprehensive Insight into Molecular Mechanisms of Flavonoid Metabolites Biosynthesis in Styphnolobium japonicum" Genes 15, no. 3: 329. https://doi.org/10.3390/genes15030329
APA StyleWu, M., Zhang, Y., Guo, P., Liu, H., Xia, L., Wang, M., Zeng, C., Wang, H., & Shang, F. (2024). Full-Length Transcriptome Sequencing and Comparative Transcriptomic Analyses Provide Comprehensive Insight into Molecular Mechanisms of Flavonoid Metabolites Biosynthesis in Styphnolobium japonicum. Genes, 15(3), 329. https://doi.org/10.3390/genes15030329