Article

An Identification of Functional Genetic Variants in B4GALNT2 Gene and Their Association with Growth Traits in Goats

1
Key Laboratory of Livestock and Poultry Multiomics, Ministry of Agriculture and Rural Affairs, College of Animal Science and Technology, Sichuan Agricultural University, Chengdu 611130, China
2
Xinjiang Yili Prelecture Animal Husbandry Station, Yining 835000, China
3
Sichuan Nanjiang Yellow Goat Breeding Farm, Nanjiang 635600, China
*
Author to whom correspondence should be addressed.
Genes 2024, 15(3), 330; https://doi.org/10.3390/genes15030330
Submission received: 24 January 2024 / Revised: 27 February 2024 / Accepted: 29 February 2024 / Published: 3 March 2024
(This article belongs to the Section Animal Genetics and Genomics)

Abstract

:
β-1,4-N-acetylgalactosamine transferase 2 (B4GALNT2) is a vital candidate gene that affects the growth traits in sheep. However, whether it has the same function in goats remains to be investigated further. This study selected 348 Nanjiang Yellow goats, screened all exons, and conserved non-coding regions of the B4GALNT2 gene for single-nucleotide polymorphisms (SNPs). Our results revealed the presence of a synonymous mutation, rs672215506, within the exon of the B4GALNT2 gene in the Nanjiang Yellow goat population. The mutation resulted in a decrease in the mRNA stability of the B4GALNT2 gene. The results of SNP detection of the conserved non-coding region of the B4GALNT2 gene showed five potential regulatory SNPs in the Nanjiang Yellow goat population. Except for rs66095343, the ~500 bp fragments of the other four SNPs (rs649127714, rs649573228, rs652899012, and rs639183528) significantly increased the luciferase activity both in goat skeletal muscle satellite cells (MuSCs) and 293T cells. The genetic diversity indexes indicated low or intermediate levels for all six SNPs analyzed, and the genotype frequencies were in Hardy–Weinberg equilibrium. Association analysis showed that rs660965343, rs649127714, and rs649573228 significantly correlate with growth traits in the later stage of growth and development of Nanjiang Yellow goats. The haplotype combinations of H2H3 and H2H2 had higher body weight and greater body size. Moreover, H2H2 haplotype combinations significantly correlated with the litter size of the Nanjiang Yellow goats. The results of our study demonstrate the potential role of the B4GALNT2 gene as a functional genetic marker in the breeding programs of Nanjiang Yellow goats.

1. Introduction

β-1,4-N-acetylgalactosamine transferase 2 (B4GALNT2) belongs to the family of N-acetyl galactosaminyl transferase (GalNAc-Tases), which is mainly involved in the formation of O-glycosylation [1]. O-glycosylation is intricately associated with cellular recognition, adhesion, immune response and other vital biological processes [2]. The B4GALNT2 gene is currently under extensive investigation for its involvement in animal immunology [1,3,4], gastrointestinal disorders [5,6,7,8,9], and its association with litter size. Additionally, B4GALNT2 has been identified as a potential candidate for the genetic regulation of FecL mutations in sheep [10]. Furthermore, the FecL gene and its fertile allele FecLL are among the critical genetic factors influencing ovulation in sheep [11]. Additionally, the B4GALNT2 gene has been implicated in congenital muscular dystrophy [12], and its expression in the muscles of mice is dynamic [13]. The manipulation of B4GALNT2 expression can affect the expression of several modifiers associated with muscular dystrophy, and the deletion of this gene exacerbates the severity of congenital muscular dystrophy in mice [14]. These findings suggest that B4GALNT2 plays a role in muscle development.
The majority of investigations on the impact of B4GALNT2 polymorphisms on animal production characteristics have primarily focused on sheep reproductive traits [15,16,17]. While B4GALNT2 is located on chromosome 19 in goats, studies describing B4GALNT2 variations associated with the number of lambs in Inner Mongolia White cashmere goats have been reported [18]. However, there is a lack of research investigating changes in goat B4GALNT2 performance, particularly regarding growth parameters.
Boer goats are known for their excellent growth rate and meat production performance, and the 37,020,001~37,180,000 region of chromosome 19 contains many highly selective SNPs, among which the B4GALNT2 gene and its non-coding region are located [19]. In our previous studies [20,21], this gene and its adjacent regions were strongly selective among Chinese native goat breeds with high reproductive performance and small body size (Meigu goat and Jianchang Black goat), which suggested that B4GALNT2 may be a candidate gene affecting the performance and growth traits in goats as well. Consequently, we postulated that genetic variations at the B4GALNT2 gene loci were associated with growth traits and litter size in goats.
Through this study, we aimed to establish a theoretical basis for selecting and breeding Nanjiang Yellow goats by identifying functional regions containing regulatory elements and investigating the association between these B4GALNT2 gene variants and growth traits at different stages of development, as well as litter size.

2. Materials and Methods

2.1. Animals and Samples Collection

The Nanjiang Yellow goat population (n = 348) used in the experiment originated exclusively from the Nanjiang Yellow goat stock farm. All goats were subjected to identical management practices and environmental conditions throughout this study. Grazing and appropriate supplementary feeding were employed to raise the goats, ensuring their dietary nutrient levels met their growth requirements. In total, 1.5 mL of whole blood was collected from each test goat via jugular vein puncture, anticoagulated with heparin sodium, and stored at −20 °C for subsequent genomic DNA extraction. Pregnant ewes were randomly selected (n = 3) (unrelated) and humanely sacrificed. Different tissues (longissimus dorsi muscle (LD), lung, heart, spleen, liver, and kidney) were obtained.

2.2. Skeletal Muscle Satellite Cells (MuSCs) Isolation and Identification

According to previous methods, the LD muscle of the 1-day-old goat (male) was successfully used to isolate the MuSCs for this study [20]. Then, we used the antibody against myogenic marker genes Pax7 (Santa Cruz, CA, USA) and MyHC (Santa Cruz, CA, USA) for immunofluorescence. We stored MuSCs in liquid nitrogen tanks. The identification results are shown in Figure S1.

2.3. Cell Culture and Transfection

MuSCs were cultured at 5% CO2 and 37 °C in growth medium containing 89% Dulbecco’s modified eagle medium (DMEM), 10% fetal bovine serum (FBS; Gibco, NY, USA), and 1% penicillin-streptomycin (Invitrogen, NY, USA) [21]. Plasmids were transfected into MuSCs using Lipofectamine 3000 (Life Technologies, Carlsbad, CA, USA).

2.4. Plasmid Construction and RNA Stability Assays

The CDS sequences of the B4GALNT2 (NM_001314262.1) gene were amplified with specific primers, and the full length of CDS was inserted into the pEGFP-N1 (Promega, WI, USA) vector using a homologous recombinant cloning kit (Vazyme, Nanjing, China) to construct overexpression plasmids. A site-directed mutagenesis kit (Vazyme, Nanjing, China) was used to obtain mutant sequences, and the vector was constructed in the same way. Primers were designed via single-fragment cloning (vazyme.com (1 May 2022)) CE Design and are listed in Tables S5 and S6.
Actinomycin D (AcTD, A1410, Sigma-Aldrich, St. Louis, MO, USA) was used on B4GALNT2-G or B4GALNT2-G MuSCs for 0 h, 1 h, 2 h, 4 h, and 6 h to inhibit global mRNA transcription [22].

2.5. Total RNA Isolation and qPCR

Total RNA was isolated from tissues and MuSCs using RNAiso Plus (Takara, Dalian, China). The cDNAs were obtained using the PrimeScript™ RT kit (Takara, Dalian, China). In addition, SYBR Premix Ex TaqTM II (Takara, Dalian, China) was used for qPCR. GAPDH was used as a reference gene and the 2−ΔΔCt method was applied to normalize relative RNA expression. Primers are shown in Table S3.

2.6. Luciferase Reporter Assays

The fragments containing five single-nucleotide polymorphism (SNP) sites (rs660965343, rs649127714, rs639183528, rs652899012 and rs649573228) were separately inserted into the pGL3-promoter vector (Knp I and Xho I were restriction sites). Wild-type (WT) and mutation-type (MUT) plasmids were transfected into H293T and MuSCs, respectively. The dual-luciferase reporter kit (Transgen, Beijing, China) was used to detect luciferase activity. Primers used for restricting enzyme digestion are shown in Table S7.

2.7. Extraction of Genomic DNA and Detection of DNA Quality

Goat genomic DNA was extracted with a routine blood genome extraction kit (Tiangen, Beijing, China) and then subjected to 1.5% agarose gel electrophoresis and ultraviolet imaging in gel image analyzer BIO-RAD ChemDOC XRS. The images were analyzed using Quality One 4.6.2 software to determine DNA integrity. The purity and concentration of DNA were determined using a nucleic acid protein detector (BIO-RAD, Hercules, CA, USA). The samples that met the requirements were stored at −20 °C for later use. Gel electrophoresis is shown in Figure S2.

2.8. PCR Amplification and Sequencing

Based on the SNP position, each SNP and its flanking sequences were retrieved from the Ensembl database, and primers were designed using the sequence as a template using Primer Premier 5.0 software and were synthesized by Sangon (Shanghai, China). The birth record table of each goat in the Nanjiang Yellow goat breeding farm was consulted, and 20 DNA samples were selected and diluted to a concentration of 20 ng/μL. From each sample, 2 μL of DNA was extracted and thoroughly mixed. The resulting mixed pool of DNA served as the template for PCR amplification. The PCR products were sent to Shanghai Sangon (Shanghai, China) for bidirectional Sanger sequencing. SnapGene6.0.2 software was used to verify the SNPS in the samples by comparing the sequencing results with the reference genome sequence and SNP sites. Primers are shown in Table S4.

2.9. MassARRAY Genotyping

In total, 348 Nanjiang Yellow goats were genotyped using the Sequenom MassARRAY genotyping technique. According to the information of 6 SNP sites in the DNA samples of 348 Nanjiang Yellow goats, SNP sites and the information of 100 bp upstream and downstream sequences were obtained through the Ensembl database. Subsequently, we amplified the fragments containing SNP sites with the single-base primer extension method, combined with MALDI-TOF, and distinguished genotypes according to their molecular weight. The blood genomic DNA of all samples was submitted to Fuyu Biotechnology (Beijing, China) for genotyping.

2.10. Growth Trait Determination

The birth weight, body weight (BW), body length (BL), body height (BH), and chest circumference (CC) of Nanjiang Yellow goats (n = 348) were measured using standard methods at the ages of 6 months, 12 months, and 18 months. Birth weight: weight taken within 12 h of birth; BW: body weight measured three times using the steelyard to take the average; BL: straight line distance from the leading edge of the scapula to the hip; BH: the vertical distance from the highest point of the girth to the ground; CC: the length around the chest from the back end of the shoulder blade. The primary data on the growth development and reproductive performance of Nanjiang Yellow goats are shown in Table S9.

2.11. Bioinformatics Analysis and Data Analysis

Jaspar (http://jaspar.genereg.net/ (accessed on 2 March 2022)) was used to predict changes in transcription factor binding at mutation sites in non-coding regions.
Haploview4.2 was used to calculate Hardy–Weinberg equilibrium and analyze linkage disequilibrium among SNPs. PHASE 2.1.1 software was used to construct haplotypes. SAS 9.4 software was used to analyze the association between genotypes of each locus and the growth traits of Nanjiang Yellow goats, and the GLM model in SAS 9.4 was used to establish the model. Yijkl = μ + Gi + Sj +Pk + Dl + eijkl, where Yijkl represented the phenotypic observations; μ was the averaged values; Gi was the fixed effect of genotype; Sj was the fixed effect of sex; Pk was the fixed effect of place; Dl was the fixed effect of date of birth (year and month); and eijkl was the random effect. All values were expressed as mean ± standard deviation. The results with p < 0.05 were considered statistically significant.

3. Results

3.1. The Synonymous Mutation rs672215506 Affected the mRNA Stability of B4GALNT2 Gene

We performed a qPCR to explore the expression profile of B4GALNT2 in goat tissues. (Figure 1A). Notably, a significantly higher expression level was observed in the uterus compared to other tissues (p < 0.01). This result suggests a potential correlation between this gene and reproductive traits in goats. Then, we screened all exonic SNPs through the utilization of the Ensembl online database and previously collected resequencing data from Nanjiang Yellow goats in our laboratory, resulting in a total discovery of 10 SNPs. Those SNPs were validated through mixed-pool PCR and sequencing in the Nanjiang Yellow goat population, resulting in the identification of only rs672215506, a synonymous mutation, in the 9 exons (Figure 1B).
To validate the function of the rs672215506 mutation, firstly, we predicted the secondary structure of B4GALNT2 mRNA. It revealed that there was only a slight change between the wild type and mutation type, which is shown in the red box (Figure 1C). Secondly, we calculated the free energy in both types; it was observed that after the mutation, there was a slight increase in the minimum free energy from −2087.40 kJ/mol to −2078.20 kJ/mol. Lastly, we tested its mRNA stability between wild type and mutant type. After successfully transfecting the B4GALNT2 gene, it either contained wild-type G or mutant-type A, in goat MuSCs, (Figure 1D), which was confirmed via the RT-qPCR method (Figure 1E). Moreover, we found that the expression of B4GALNT2 mRNA was significantly reduced after the addition of ACTD at 2 h and 4 h compared to the wild type (Figure 1F) (p < 0.05 or p < 0.01).

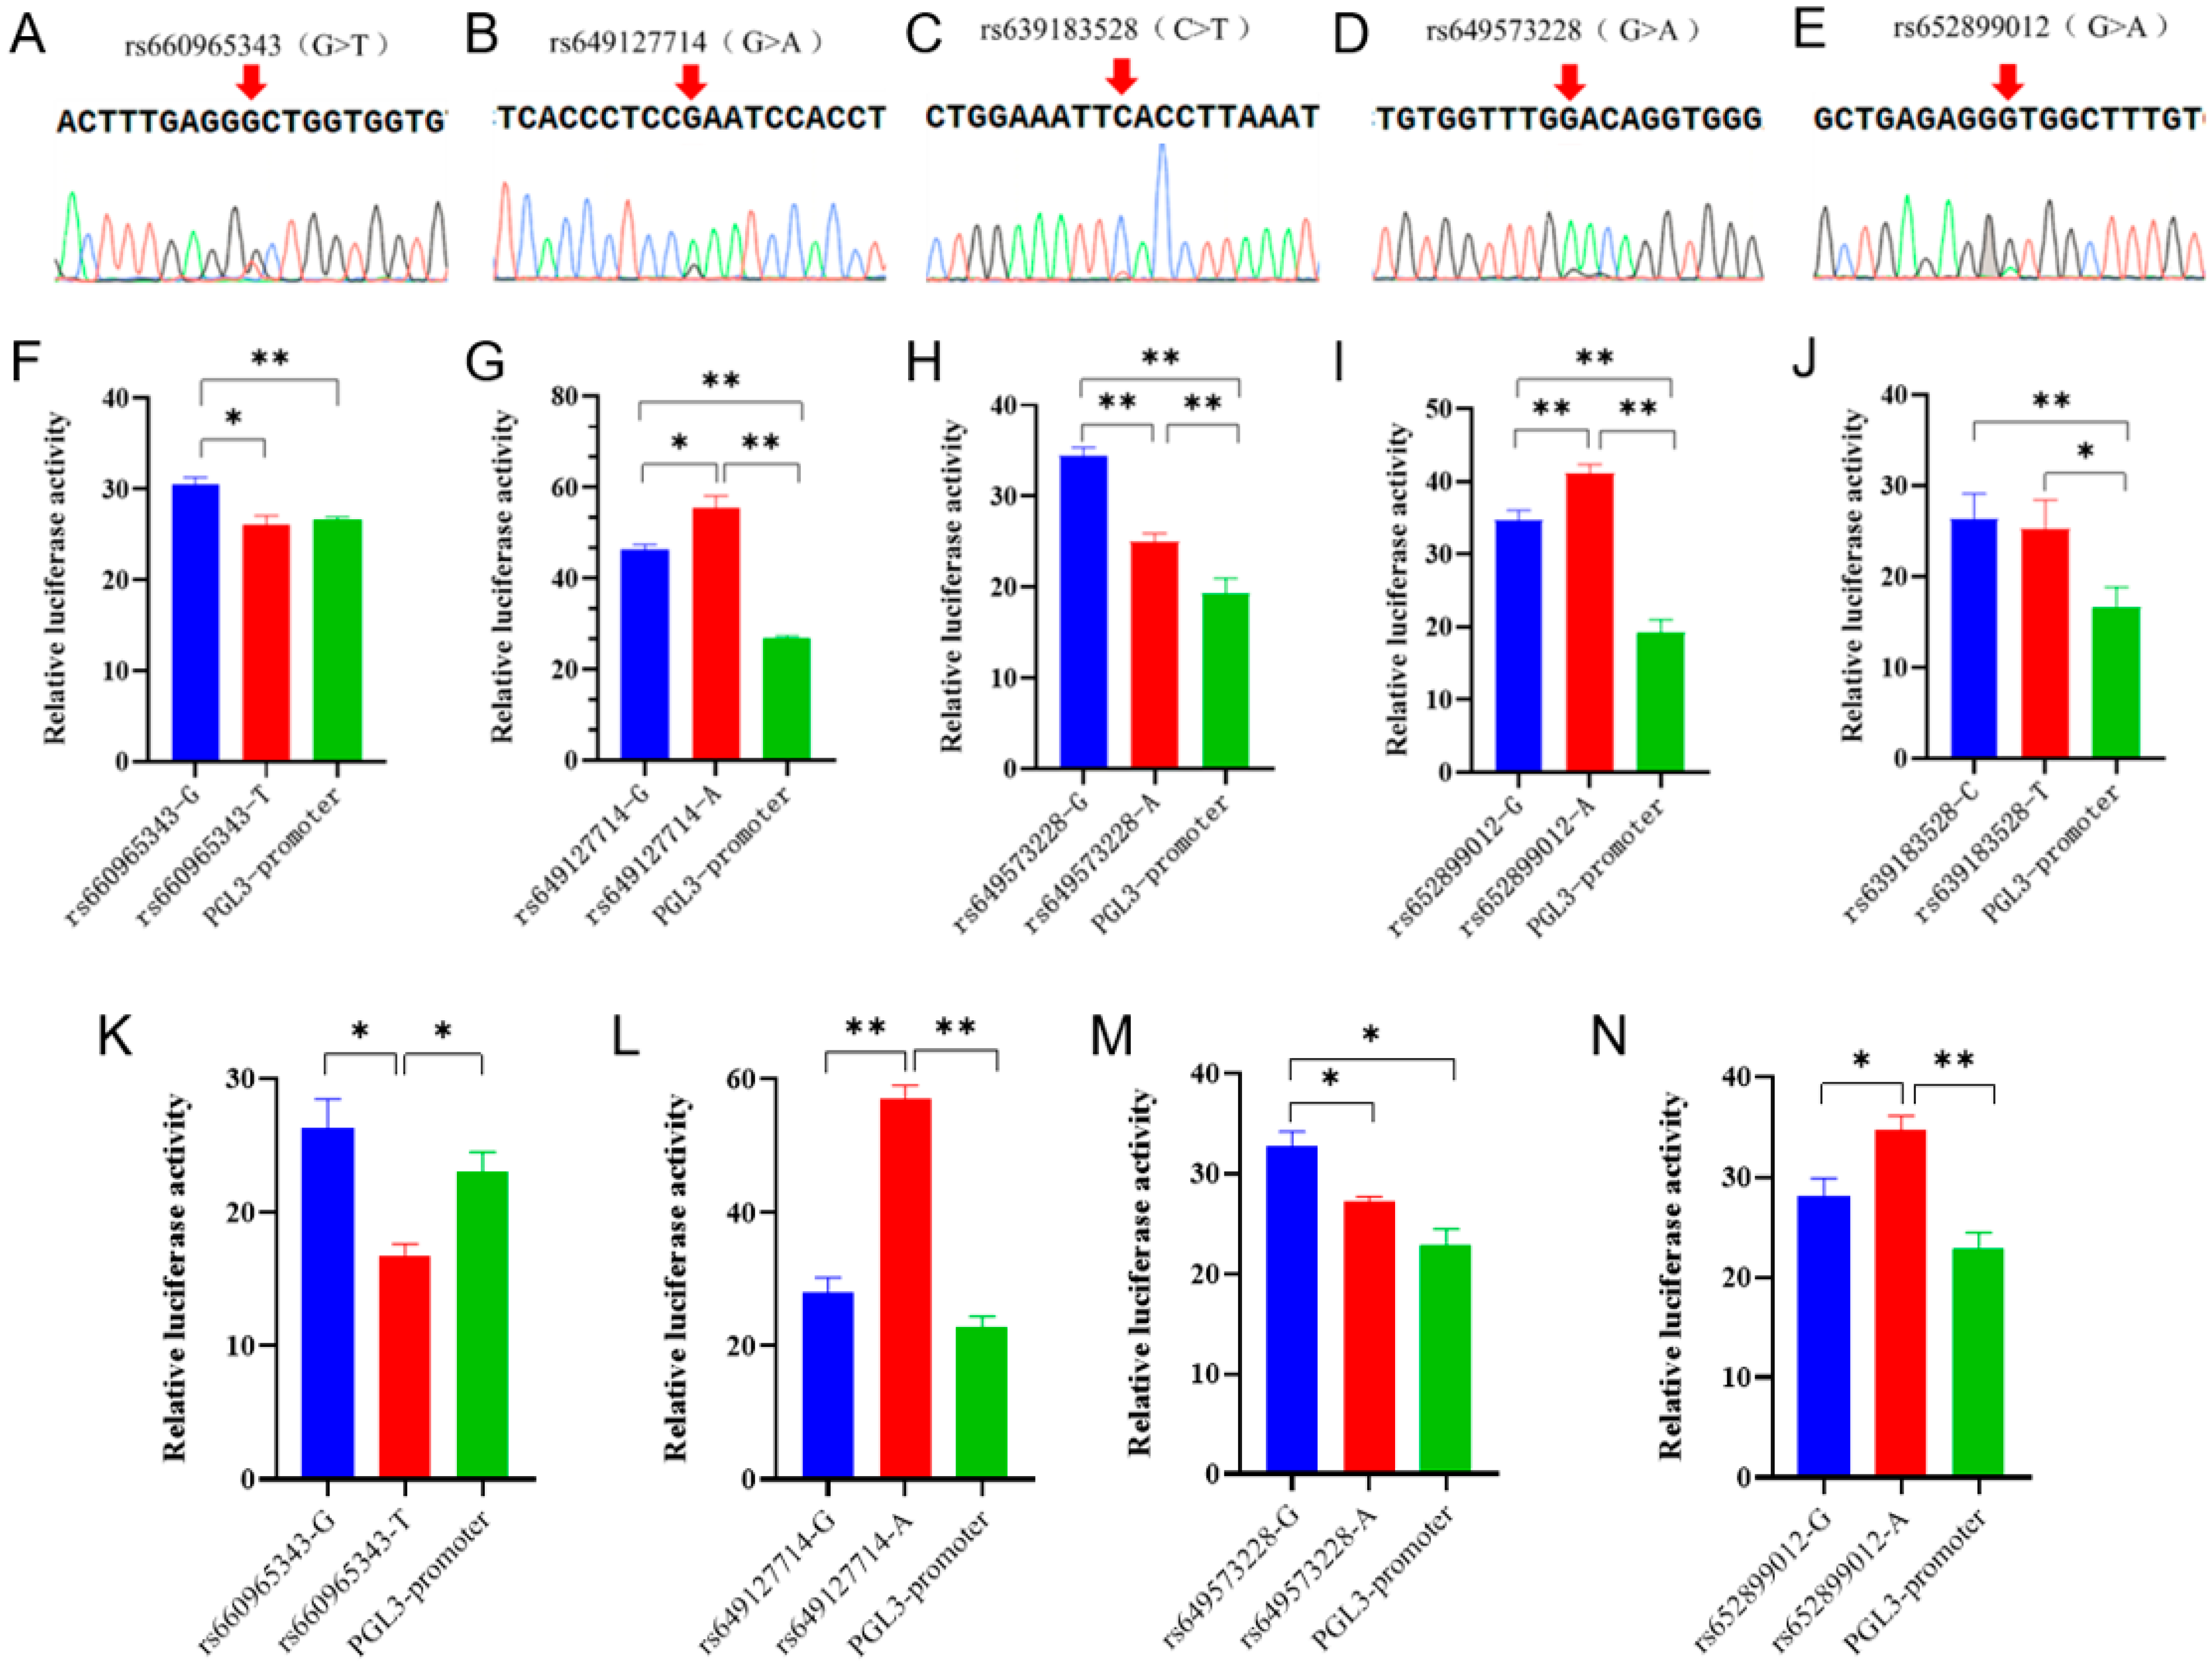
3.2. The Detection and Functional Verification of Non-Coding SNPs in B4GALNT2

In the Ensembl database, the SNPs in the non-coding region of the goat B4GALNT2 gene were analyzed with homology analysis with 42 other species, and 5 conserved SNPs were screened (Figure S3). Sanger sequencing results showed that these SNPs were present in the Nanjiang Yellow goat population (Figure 2A–E). Then, the analysis of transcription factor binding sites associated with these SNPs was conducted via Jaspar, and numerous transcription factors were found to significantly impact the binding affinity (Table S1). To further investigate the functionality of these sites, wild-type and mutant-type dual-luciferase reporter vectors were constructed for each site and subsequently transfected into 293T cells. The results showed that the dual-luciferase activity of the wild-type group at all five sites was extremely significantly higher than the control group, indicating that the fragment containing these SNPs had enhancer-like activity (Figure 2F–J). Specifically, both rs660965343 and rs649573228 mutations led to a significant reduction in luciferase activity (p < 0.05 or p < 0.01) (Figure 2F,H), whereas rs649127714 and rs652899012 mutations resulted in a significant increase (p < 0.05 or p < 0.01) (Figure 2G,I), while rs639183528 did not show any significant changes (p > 0.05) (Figure 2J). Furthermore, dual-fluorescent vectors exhibiting significant disparities in 293T cells were selected and transfected into MuSCs to investigate whether these motifs possess identical functionality in muscle cells. The results showed that the luciferase activity of the wild-type and mutant-type vectors showed a similar trend in both cell types (Figure 2K–N). It is interesting that the luciferase activity of the rs660965343 mutant in muscle cells exhibited a significant reduction, even surpassing that of the PGL3-promoter (control) group (p < 0.05). The implication of this finding is that this mutation may play a more significant role in the functionality of muscle cells.

3.3. Population Genetic Diversity Statistics of Six SNPs in Nanjiang Yellow Goat Population

From the results above, we identified one SNP located at nine exons and five SNPs in the non-coding region, totaling six SNPs in the B4GALNT2 genes. Then, we asked the question of whether they exist in the goats. The mass spectrometry method was applied to analyze the genetic distribution of these SNPs in 348 Nanjiang Yellow goats; the results showed that six SNPs all existed in the goat population (Figure 3A). Among them, rs652062749 had the highest homozygosity, and rs672215506 had the lowest homozygosity. The analysis of effective allele numbers for different SNPs revealed that the overall effective allele number is approximately 2, except for rs652062749, which shows relatively low values, indicating an even distribution of effective alleles within the population. The genetic statistics of the goat population showed that all mutations were moderately or weakly polymorphic in the Nanjiang Yellow goats (0.25 < PIC ≤ 0.5 or PIC ≤ 0.25). The Chi-squared fitness test showed that the SNP distribution was in Hardy–Weinberg equilibrium (p > 0.05, Table 1).

3.4. Analysis of Linkage Disequilibrium and Construction of Haplotypes

The presence of SNPs in linkage disequilibrium can provide additional insights into genetic information, and it was conducted based on the SNPs and genotyping information (Figure 3B). A strong linkage disequilibrium was observed between rs672215506 and rs660965343 (D′ = 1.000). Subsequently, two highly linked SNPs were used to construct three haplotypes, with the GG haplotype having the highest frequency (0.487). Additionally, six different combinations of these haplotypes were identified. Except for H1H1, all other haplotype combinations had frequencies higher than 5% (Table 2).

3.5. Association of SNPs and Haplotype Combinations with Growth Traits

To validate these SNPs’ function in vivo, we analyzed their association with growth traits both in a SNP locus and haplotype combination. For a single SNPs’ part, we found that the birth weight of those with the AA genotype was significantly higher than that of goats with the GG genotype in the rs672215506 site, (p < 0.05) (Table 3). However, the BH-6, BL-12, and BH-12 measurements in goats with the AA genotype were significantly lower compared to those with the GG genotype (p < 0.05 or p < 0.01). Individuals with the TT genotype at rs660965343 exhibited a significant advantage in terms of birth weight (p < 0.05), but demonstrated inferiority during subsequent periods (p < 0.05 or p < 0.01). The goats with the AA genotype of rs649127714 exhibited significantly larger body size or heavier body mass compared to goats with other genotypes at all periods (p < 0.05 or p < 0.01). The individuals with the CC genotype of rs639183528 exhibited significantly higher BL-6 levels compared to the TT genotype (p < 0.05). The rs649573228 locus did not exhibit any GG homozygous genotype. In goats with the AA genotype, BL, BH-6, CC-12, BL-12, BH-12, BL-18, BH-18, and CC-18 showed significantly better results compared to the GA genotype (p < 0.05 or p < 0.01). The rs652899012 AA genotype exhibited a significantly lower frequency compared to the AG genotype in BL-6, BH-6, CC-6, BL-12, and BH-12 (p < 0.05 or p < 0.01) (Table 4). For the haplotype combinations part, overall, H3H3 exhibited inferior performance in terms of body weight and body size compared to other haplotype combinations (p < 0.05 or p < 0.01, Table 5)

3.6. Association of SNPs and Haplotype Combinations with Lambing Number

The B4GALNT2 gene was well known for affecting lamb number in sheep, which was never tested in goat population—to the best of our best knowledge. Then, we investigated the association between six SNPs and lambing performance in primiparous and multiparous Nanjiang Yellow goat populations (Table S2). Even though the results showed no significant variations in lambing performance among different genotypes of each SNP in primiparous and multiparous ewes (p > 0.05), and no significant correlations between individual haplotype combinations and the number of primiparous lambs (p > 0.05), interestingly, the H2H2 haplotype combination exhibited a significantly higher multiparous lamb count than the other haplotype combinations (p < 0.05, Table 6).

4. Discussion

B4GALNT2, highly expressed in sheep’s ovaries [17], has received attention as a critical candidate gene affecting lamb birth and ovulation rate [22,23,24]. The B4GALNT2 protein of goats has close homology with that of sheep (Figure S4), and it has been reported that B4GALNT2 mRNA is expressed in the ovaries, uteri, and fallopian tubes of goats [25]. Consistent with this, we found that the expression of B4GALNT2 was highest in the uteri of the Nanjiang Yellow goats. These results suggest that B4GALNT2 may also be critical for goats, but this gene has been poorly studied in goats.
The B4GALNT2 gene and its non-coding region 37,020,001–37,180,000 on chromosome 19 of Boer goats have strong selection signals [19], and they are also strongly selected in small Chinese local goat breeds (Meigu goats and Jianchang goats) [26,27]. This suggests that this gene is closely related to the growth and development of goats. However, goats’ variations in the B4GALNT2 gene, especially those associated with growth traits, have not been extensively studied yet.
In this study, we identified six SNPs in the B4GALNT2 gene located in the conserved non-coding region and exons of the gene in 348 Nanjiang Yellow goats (known for their fast growth and high reproductive efficiency in China). We found significant associations between these SNPs and production traits and their number of lambs in Nanjiang Yellow goats, which provide insights for the further characterization of the production performance of livestock.
Synonymous mutations occurring in exons do not alter amino acid or protein sequences. However, they may regulate gene function by affecting codon bias during protein translation [28,29,30], and studies have shown that synonymous mutations can affect animal production performance by influencing the efficiency of transcription and translation of genes [31,32,33], for example, a synonym mutation on the IGF1 gene in Bama pigs altered the stability of IGF1 mRNA and protein [33]. In goats, a recent study found that GG and GA genotypes with a synonym mutation (g.37072289 G>A) in the B4GALNT2 gene had significantly higher lamb births than other genotypes [18]. In this study, a synonymous mutation rs672215506 (G>A) was identified in the B4GALNT2 gene of goats. Moreover, the birth weight of the AA genotype was significantly higher than that of the GG genotype. We also found that this synonym mutation decreased the mRNA stability of B4GALNT2 after a mutation, which might be why this site affected the birth weight of the Nanjiang Yellow goats.
SNPs in non-coding regions can indirectly regulate gene expression processes, thereby affecting animal phenotypes or reproductive performance [34,35]. The dual-luciferase reporter vector assay is a precise and dependable method for validating non-coding SNPs in research [36,37,38]. In this study, we carried out a dual-luciferase assay in two cell types, 293T and MuSCs. Interestingly, the rs660965343 mutant-type vector showed lower luciferase activity in MuSCs. This locus may have unique effects on muscle development, but further studies are needed.
The level of genetic variation within a population is the most direct expression of genetic diversity, and the level of genetic variation can directly affect the evolutionary potential of the population [39,40]. Population heterozygosity is an essential indicator for judging the genetic diversity of a certain population, which can reflect the degree of genetic diversity of a population [41]. All six SNPS in this study were in Hardy–Weinberg equilibrium, and there was rich genetic diversity within the Nanjiang Yellow goat population, which had good purification and selection potential [42]. In addition, all loci had low (PIC ≤ 0.25) or moderate polymorphism (0.25 < PIC ≤ 0.5), with some genetic variation potential [43,44].
The influence of genes on traits may be influenced by the linkage effect of multiple SNPs [45,46]. The linkage disequilibrium of SNPs can provide more comprehensive genetic information and enhance selection efficiency [47,48]. In this study, the haplotype combination of H2H3 and H2H2 was found to be beneficial for increasing body weight and size, while H2H2 showed advantages for increasing the number of multiparous lambs. In addition, the mean value of the multiparous lambing number was significantly higher than the number of primiparous lambing numbers, which was in line with the results of a previous study [49].

5. Conclusions

In conclusion, we identified five SNPs of B4GALNT2 which are strongly associated with growth traits in goats. Our findings contribute to a better understanding of the genetic mechanisms underlying growth traits in Nanjiang Yellow goats and emphasize the importance of the B4GALNT2 gene in breeding strategies aimed at enhancing productivity and performance in this economically valuable breed.

Supplementary Materials

The following supporting information can be downloaded at: https://www.mdpi.com/article/10.3390/genes15030330/s1, Table S1. Transcription factors prediction. Table S2. The association between six SNPs and lambing performance in primiparous and multiparous Nanjiang Yellow goat populations. Table S3. RT-qPCR primers’ information. Table S4. Primers for exon validation. Table S5. Primers’ information of homologous recombination. Table S6. Information of site-directed mutagenesis primers. Table S7. Primers’ information of non-coding-region SNPs of B4GALNT2. Table S8. The primers information of enzyme digestion sites. Table S9. Primers’ information of enzyme digestion sites. Table S10. Basic data of growth, development, and reproductive performance of Nanjiang Yellow goats. Figure S1. Identification results. Pax7 (red) and MyHC (red) immunofluorescence staining were performed in MuSCs. Figure S2. Gel electrophoresis of genomic DNA samples. M. DL2000 DNA maker; (1–6) Genomic DNA of Nanjiang Yellow goats. Figure S3. Homology analysis between 6 SNPs in the B4GALNT2 gene of goats and 42 other species. Figure S4. Phylogenetic tree of B4GALNT2.

Author Contributions

Conceptualization, L.X., H.Z., and J.C.; methodology, S.C.; software, Z.C.; validation, J.C.; formal analysis, Y.C. and J.G.; investigation, T.Z. and L.W.; resources, T.Z. and L.W.; data curation, L.X.; writing—original draft preparation, L.X.; writing—review and editing, J.C., S.Z., and L.L.; visualization, S.C. and Z.C.; supervision, J.C.; project administration, J.C.; funding acquisition, H.Z. and J.C. All authors have read and agreed to the published version of the manuscript.

Funding

This research was funded by the Young Scientists Fund of the National Natural Science Foundation of China, grant No. 31802048; the Natural Science Foundation of Sichuan Province, grant No. 2022NSFSC1611; and the Science and Technology Support for Returned Personnel of Sichuan Province (2021–2022).

Institutional Review Board Statement

Experimental protocols and sampling procedures were reviewed and approved by the Sichuan Agricultural University Animal Ethical and Welfare Committee (Sichuan, China, approval No. 20230037).

Informed Consent Statement

Not applicable.

Data Availability Statement

The data from this study are exhibited in this manuscript and Supplementary Materials.

Acknowledgments

The data related to the production of Nanjiang Yellow goats were obtained from the breeding farm of Nanjiang Yellow goats in Sichuan Province. We would like to thank researcher Yu Chen for her support.

Conflicts of Interest

Author Yu Chen was employed by the company Sichuan Nanjiang Yellow Goat Breeding Farm. The remaining authors declare that the research was conducted in the absence of any commercial or financial relationships that could be construed as a potential conflict of interest.

References

  1. Byrne, G.; Ahmad-Villiers, S.; Du, Z.; McGregor, C. B4GALNT2 and xenotransplantation: A newly appreciated xenogeneic antigen. Xenotransplantation 2018, 25, e12394. [Google Scholar] [CrossRef] [PubMed]
  2. Stwora-Wojczyk, M.M.; Kissinger, J.C.; Spitalnik, S.L.; Wojczyk, B.S. O-glycosylation in Toxoplasma gondii: Identification and analysis of a family of UDP-GalNAc:polypeptide N-acetylgalactosaminyltransferases. Int. J. Parasitol. 2004, 34, 309–322. [Google Scholar] [CrossRef] [PubMed]
  3. Zhao, C.; Cooper, D.K.C.; Dai, Y.; Hara, H.; Cai, Z.; Mou, L. The Sda and Cad glycan antigens and their glycosyltransferase, β1,4GalNAcT-II, in xenotransplantation. Xenotransplantation 2018, 25, e12386. [Google Scholar] [CrossRef] [PubMed]
  4. Duca, M.; Malagolini, N.; Dall’Olio, F. The story of the Sd(a) antigen and of its cognate enzyme B4GALNT2: What is new? Glycoconj. J. 2023, 40, 123–133. [Google Scholar] [CrossRef] [PubMed]
  5. Groux-Degroote, S.; Vicogne, D.; Cogez, V.; Schulz, C.; Harduin-Lepers, A. B4GALNT2 Controls Sd(a) and SLe(x) Antigen Biosynthesis in Healthy and Cancer Human Colon. Chembiochem Eur. J. Chem. Biol. 2021, 22, 3381–3390. [Google Scholar] [CrossRef] [PubMed]
  6. Galeev, A.; Suwandi, A.; Cepic, A.; Basu, M.; Baines, J.F.; Grassl, G.A. The role of the blood group-related glycosyltransferases FUT2 and B4GALNT2 in susceptibility to infectious disease. Int. J. Med. Microbiol. 2021, 311, 151487. [Google Scholar] [CrossRef] [PubMed]
  7. Groux-Degroote, S.; Wavelet, C.; Krzewinski-Recchi, M.A.; Portier, L.; Mortuaire, M.; Mihalache, A.; Trinchera, M.; Delannoy, P.; Malagolini, N.; Chiricolo, M.; et al. B4GALNT2 gene expression controls the biosynthesis of Sda and sialyl Lewis X antigens in healthy and cancer human gastrointestinal tract. Int. J. Biochem. Cell Biol. 2014, 53, 442–449. [Google Scholar] [CrossRef]
  8. Rausch, P.; Steck, N.; Suwandi, A.; Seidel, J.A.; Künzel, S.; Bhullar, K.; Basic, M.; Bleich, A.; Johnsen, J.M.; Vallance, B.A.; et al. Expression of the Blood-Group-Related Gene B4galnt2 Alters Susceptibility to Salmonella Infection. PLoS Pathog. 2015, 11, e1005008. [Google Scholar] [CrossRef]
  9. Pucci, M.; Gomes Ferreira, I.; Malagolini, N.; Ferracin, M.; Dall’Olio, F. The Sd(a) Synthase B4GALNT2 Reduces Malignancy and Stemness in Colon Cancer Cell Lines Independently of Sialyl Lewis X Inhibition. Int. J. Mol. Sci. 2020, 21, 6558. [Google Scholar] [CrossRef]
  10. Drouilhet, L.; Mansanet, C.; Sarry, J.; Tabet, K.; Bardou, P.; Woloszyn, F.; Lluch, J.; Harichaux, G.; Viguié, C.; Monniaux, D.; et al. The highly prolific phenotype of Lacaune sheep is associated with an ectopic expression of the B4GALNT2 gene within the ovary. PLoS Genet. 2013, 9, e1003809. [Google Scholar] [CrossRef]
  11. Drouilhet, L.; Lecerf, F.; Bodin, L.; Fabre, S.; Mulsant, P. Fine mapping of the FecL locus influencing prolificacy in Lacaune sheep. Anim. Genet. 2009, 40, 804–812. [Google Scholar] [CrossRef]
  12. Thomas, P.J.; Xu, R.; Martin, P.T. B4GALNT2 (GALGT2) Gene Therapy Reduces Skeletal Muscle Pathology in the FKRP P448L Mouse Model of Limb Girdle Muscular Dystrophy 2I. Am. J. Pathol. 2016, 186, 2429–2448. [Google Scholar] [CrossRef] [PubMed]
  13. Xu, R.; Singhal, N.; Serinagaoglu, Y.; Chandrasekharan, K.; Joshi, M.; Bauer, J.A.; Janssen, P.M.; Martin, P.T. Deletion of Galgt2 (B4Galnt2) reduces muscle growth in response to acute injury and increases muscle inflammation and pathology in dystrophin-deficient mice. Am. J. Pathol. 2015, 185, 2668–2684. [Google Scholar] [CrossRef] [PubMed]
  14. Cramer, M.L.; Xu, R.; Martin, P.T. Soluble Heparin Binding Epidermal Growth Factor-Like Growth Factor Is a Regulator of GALGT2 Expression and GALGT2-Dependent Muscle and Neuromuscular Phenotypes. Mol. Cell. Biol. 2019, 39, e00140-19. [Google Scholar] [CrossRef] [PubMed]
  15. Gao, Y.; Wang, J.; Chao, L.-M.; Cang, M.; Yu, H.; Wang, J.; Bao, S.-Q.; Liu, Y.-B.; Zhang, W.-G.; Ma, Q.; et al. Association analysis of B4GALNT2 gene polymorphisms with the number of lambs in Mongolian and Uzhumuqin sheep. J. Agric. Biotechnol. 2022, 30, 1510–1523. [Google Scholar]
  16. Rong, X.; Shao, S.; Liang, P.; Zhang, T.-W.; Zou, S.; Meng, K.; Qiang, H.; Feng, D.Z. Polymorphisms of B4GALNT2 and ESR1 genes and their association with the number of lambs in sheep. China Anim. Sci. Vet. 2021, 48, 3332–3342. [Google Scholar] [CrossRef]
  17. Guo, X.; Wang, X.; Liang, B.; Di, R.; Liu, Q.; Hu, W.; He, X.; Zhang, J.; Zhang, X.; Chu, M. Molecular Cloning of the B4GALNT2 Gene and Its Single Nucleotide Polymorphisms Association with Litter Size in Small Tail Han Sheep. Animals 2018, 8, 160. [Google Scholar] [CrossRef]
  18. Sa, C.; Wu, T.; Ma, Y.; He, Y.-M.; Ju, L.; He, T.; Wu, Y.; Liu, B. Polymorphisms of four candidate genes for multifetal traits and their association with the number of lambs in cashgoat. China Anim. Sci. Vet. 2023, 50, 1037–1047. [Google Scholar] [CrossRef]
  19. Yang, B.G.; Yuan, Y.; Zhou, D.K.; Ma, Y.H.; Mahrous, K.F.; Wang, S.Z.; He, Y.M.; Duan, X.H.; Zhang, W.Y.; E, G. Genome-wide selection signal analysis of Australian Boer goat reveals artificial selection imprinting on candidate genes related to muscle development. Anim. Genet. 2021, 52, 550–555. [Google Scholar] [CrossRef]
  20. Zhao, W.; Chen, L.; Zhong, T.; Wang, L.; Guo, J.; Dong, Y.; Feng, J.; Song, T.; Li, L.; Zhang, H. The differential proliferation and differentiation ability of skeletal muscle satellite cell in Boer and Nanjiang brown goats. Small Rumin. Res. 2018, 169, 99–107. [Google Scholar] [CrossRef]
  21. Zhao, S.; Cao, J.; Sun, Y.; Zhou, H.; Zhu, Q.; Dai, D.; Zhan, S.; Guo, J.; Zhong, T.; Wang, L.; et al. METTL3 Promotes the Differentiation of Goat Skeletal Muscle Satellite Cells by Regulating MEF2C mRNA Stability in a m6A-Dependent Manner. Int. J. Mol. Sci. 2023, 24, 14115. [Google Scholar] [CrossRef] [PubMed]
  22. Chu, M.X.; Liu, Z.H.; Jiao, C.L.; He, Y.Q.; Fang, L.; Ye, S.C.; Chen, G.H.; Wang, J.Y. Mutations in BMPR-IB and BMP-15 genes are associated with litter size in Small Tailed Han sheep (Ovis aries). J. Anim. Sci. 2007, 85, 598–603. [Google Scholar] [CrossRef] [PubMed]
  23. Hanrahan, J.P.; Gregan, S.M.; Mulsant, P.; Mullen, M.; Davis, G.H.; Powell, R.; Galloway, S.M. Mutations in the genes for oocyte-derived growth factors GDF9 and BMP15 are associated with both increased ovulation rate and sterility in Cambridge and Belclare sheep (Ovis aries). Biol. Reprod. 2004, 70, 900–909. [Google Scholar] [CrossRef] [PubMed]
  24. Crawford, J.L.; Heath, D.A.; Reader, K.L.; Quirke, L.D.; Hudson, N.L.; Juengel, J.L.; McNatty, K.P. Oocytes in sheep homozygous for a mutation in bone morphogenetic protein receptor 1B express lower mRNA levels of bone morphogenetic protein 15 but not growth differentiation factor 9. Reproduction 2011, 142, 53–61. [Google Scholar] [CrossRef] [PubMed]
  25. Liu, S.; Lu, J.-Y.; Ma, L.; Xia, W.; Hu, L.; Luo, B.; Yang, K. cDNA cloning and tissue expression of goat B4GALNT2 gene. J. Anim. Sci. Vet. Med. 2016, 1, 47–51. [Google Scholar]
  26. Guo, J.; Tao, H.; Li, P.; Li, L.; Zhong, T.; Wang, L.; Ma, J.; Chen, X.; Song, T.; Zhang, H. Whole-genome sequencing reveals selection signatures associated with important traits in six goat breeds. Sci. Rep. 2018, 8, 10405. [Google Scholar] [CrossRef] [PubMed]
  27. Sun, X.; Guo, J.; Li, L.; Zhong, T.; Wang, L.; Zhan, S.; Lu, J.; Wang, D.; Dai, D.; Liu, G.E.; et al. Genetic Diversity and Selection Signatures in Jianchang Black Goats Revealed by Whole-Genome Sequencing Data. Animals 2022, 12, 2365. [Google Scholar] [CrossRef] [PubMed]
  28. Chaney, J.L.; Clark, P.L. Roles for Synonymous Codon Usage in Protein Biogenesis. Annu. Rev. Biophys. 2015, 44, 143–166. [Google Scholar] [CrossRef]
  29. Otsuka, H.; Sasai, H.; Nakama, M.; Aoyama, Y.; Abdelkreem, E.; Ohnishi, H.; Konstantopoulou, V.; Sass, J.O.; Fukao, T. Exon 10 skipping in ACAT1 caused by a novel c.949G>A mutation located at an exonic splice enhancer site. Mol. Med. Rep. 2016, 14, 4906–4910. [Google Scholar] [CrossRef]
  30. Plotkin, J.B.; Kudla, G. Synonymous but not the same: The causes and consequences of codon bias. Nat. Rev. Genet. 2011, 12, 32–42. [Google Scholar] [CrossRef]
  31. Szewczuk, M.; Zych, S.; Wojcik, J.; Czerniawska-Piatkowska, E. Association of two SNPs in the coding region of the insulin-like growth factor 1 receptor (IGF1R) gene with growth-related traits in Angus cattle. J. Appl. Genet. 2013, 54, 305–308. [Google Scholar] [CrossRef] [PubMed]
  32. Cui, C.; Jiang, H.; Liang, Y.-J.; Xiao, C.; Liu, Y.; Jin, J.-G.; Cao, Y. HLF gene polymorphism and its association with muscle fatty acid and amino acid content in sheep. Heilongjiang Anim. Husb. Vet. Med. 2022, 11, 45–49. [Google Scholar]
  33. Cheng, Y.; Liu, S.; Wang, G.; Wei, W.; Huang, S.; Yang, R.; Geng, H.; Li, H.; Song, J.; Sun, L.; et al. Porcine IGF1 synonymous mutation alter gene expression and protein binding affinity with IGF1R. Int. J. Biol. Macromol. 2018, 116, 23–30. [Google Scholar] [CrossRef]
  34. Jolma, A.; Yan, J.; Whitington, T.; Toivonen, J.; Nitta, K.R.; Rastas, P.; Morgunova, E.; Enge, M.; Taipale, M.; Wei, G.; et al. DNA-binding specificities of human transcription factors. Cell 2013, 152, 327–339. [Google Scholar] [CrossRef] [PubMed]
  35. Hoogendoorn, B.; Coleman, S.L.; Guy, C.A.; Smith, S.K.; O’Donovan, M.C.; Buckland, P.R. Functional analysis of polymorphisms in the promoter regions of genes on 22q11. Hum. Mutat. 2004, 24, 35–42. [Google Scholar] [CrossRef] [PubMed]
  36. Zhang, Z.; Liu, C.; Hao, W.; Yin, W.; Ai, S.; Zhao, Y.; Duan, Z. Novel Single Nucleotide Polymorphisms and Haplotype of MYF5 Gene Are Associated with Body Measurements and Ultrasound Traits in Grassland Short-Tailed Sheep. Genes 2022, 13, 483. [Google Scholar] [CrossRef] [PubMed]
  37. Chen, W.; Xu, H.; Chen, X.; Liu, Z.; Zhang, W.; Xia, D. Functional and Activity Analysis of Cattle UCP3 Promoter with MRFs-Related Factors. Int. J. Mol. Sci. 2016, 17, 682. [Google Scholar] [CrossRef] [PubMed]
  38. Wang, D. Analysis of Transcriptional Regulation in Non-Coding Region of FSHR Gene in Huyang Sheep. Master’s Thesis, Nanjing Agricultural University, Nanjing, China, 2017. [Google Scholar]
  39. Kamarudin, N.J.; Wang, V.C.; Tan, X.T.; Ramesh, A.; Ling, M.H. A Simulation Study on the Effects of Founding Population Size and Number of Alleles Per Locus on the Observed Population Genetic Profile: Implications to Broodstock Management. EC Vet. Sci. 2020, 5, 176–180. [Google Scholar]
  40. Barrandeguy, M.E.; García, M. The Sensitiveness of Expected Heterozygosity and Allelic Richness Estimates for Analyzing Population Genetic Diversity. In Genetic Diversity; Working Title; IntechOpen: London, UK, 2021. [Google Scholar]
  41. Silió, L.; Rodríguez, M.C.; Fernández, A.; Barragán, C.; Benítez, R.; Óvilo, C.; Fernández, A.I. Measuring inbreeding and inbreeding depression on pig growth from pedigree or SNP-derived metrics. J. Anim. Breed. Genet. 2013, 130, 349–360. [Google Scholar] [CrossRef]
  42. Penedo, M.; Weisenberger, M.E.; Boyce, W.M.; Johnson, C.K. Wildlife translocation: The conservation implications of pathogen exposure and genetic heterozygosity. BMC Ecol. 2011, 11, 5. [Google Scholar]
  43. Botstein, D.; White, R.L.; Skolnick, M.; Davis, R.W. Construction of a genetic linkage map in man using restriction fragment length polymorphisms. Am. J. Hum. Genet. 1980, 32, 314. [Google Scholar]
  44. Jiang, Y.; Wang, S.; Zhu, L.; Yang, H.; Hong, Q. Polymorphism analysis of myostatin gene in Yunshangmontenegrin sheep. Chin. Herbiv. Sci. 2020, 40, 5–7. [Google Scholar]
  45. Ma, X.; Du, L.; Zhang, L.; Xuan, J.; Wang, H.; Yuan, Z.; Wu, M.; Zhu, C.; Liu, R. Association between RIPK2 gene polymorphism and growth traits in Ujumuqin sheep. Chin. J. Agric. Sci. 2016, 49, 17. [Google Scholar]
  46. Peng, Y.; Liu, J.; Zhao, S.; Xu, Z.; Zuo, B. Detection of SNPs of RXRB gene in pigs and its association with growth, fattening and reproductive traits. J. Anim. Husb. Vet. Sci. 2021, 52, 596–609. [Google Scholar]
  47. Meng, K.; Zhang, T.; Liang, P.; Shao, S.; Zou, S.; Rong, X.; Qiang, H.; Feng, D. Analysis of MYF5 gene polymorphism and its association with growth traits in sheep. J. Agric. Biotechnol. 2022, 30, 496–505. [Google Scholar]
  48. Wu, S.-B.; Franks, T.K.; Hunt, P.; Wirthensohn, M.G.; Gibson, J.P.; Sedgley, M. Discrimination of SNP genotypes associated with complex haplotypes by high resolution melting analysis in almond: Implications for improved marker efficiencies. Mol. Breed. 2009, 25, 351–357. [Google Scholar] [CrossRef]
  49. Li, L.; Zhang, H.P.; Wu, D. Correlation analysis of LH-β gene polymorphism and reproductive performance in Nanjiang yellow sheep. Anim. Husb. Vet. Med. 2006, 38, 3–5. [Google Scholar]
Figure 1. The expression pattern of the B4GALNT2 gene in various tissues and the effects of B4GALNT2 synonymous mutation on mRNA stability. (A) B4GALNT2 gene expression profile in different tissues of goats. (B) SNPs sequencing peak of B4GALNT2 exons. The base indicated by the arrow in the figure represents the genomic locus of the corresponding SNP. A double peak indicates the presence of this SNP within the Nanjiang Yellow goat population. (C) Prediction of the secondary structure of B4GALNT2 mRNA. Only those in the red boxes were altered, and the arrows represent the mutated mRNA secondary structure. (D) The transfection efficiencies of wild-type and mutant-type overexpression vectors in goat MuSCs were assessed. Cells carrying green fluorescence represent successful transfection. (E) The expression levels of the G and A genotype overexpression vectors of the B4GALNT2 (B4GALNT2-G and B4GALNT2-A) were detected in goat MuSCs. (F) The relative expression levels of the wild type and mutant type of the B4GALNT2 gene in goat MuSCs were evaluated after treatment with actinomycin D for different times. Results are represented as mean ± SEM, * p < 0.05, ** p < 0.01.
Genes 15 00330 g001
Figure 2. Five SNPs sequencing results and the effects of mutations on enhancer activity. (AE) Five SNPs sequencing results of mixed pool samples, which were located at the non-coding region of B4GALNT2 gene. The base indicated by the arrow in the figure represents the genomic locus of the corresponding SNP. A double peak indicates the presence of this SNP within the Nanjiang Yellow goat population. (FJ) Effects of mutations on enhancer activity. Blue represents the mutant type, red represents the wild type, and green represents control. They were transfected into 293T cells. (KN) Effects of mutations on enhancer activity. They were transfected into MuSCs cells. The results are expressed as mean ± SEM (n = 3 or 4) in arbitrary units based on firefly luciferase activity normalized against Renilla luciferase activity. A t-test was conducted using SPSS 25.0 to detect the differences. Bars represent mean ± SEM of at least three repeats. * p < 0.05; ** p < 0.01.
Genes 15 00330 g002
Figure 3. Mass spectrometry results and linkage disequilibrium analysis. (A) SNP genotyping results are shown as scatter plots, with different colored dots representing different genotypes. (B) Linkage disequilibrium analysis of six SNPs in Nanjiang Yellow goat population.
Genes 15 00330 g003
Table 1. Genetic parameters and Hardy–Weinberg equilibrium test of six SNPs in the goat population.
LocusGenotypeGenotype FrequencyAllele FrequencyHoHeNepPIC
rs672215506 (G>A)AA0.280.51 (A)0.50.520.160.37
GA0.460.49 (G)
GG0.26
rs660965343 (G>T)GG0.40.64 (G)0.540.461.8510.35
GT0.460.36 (T)
TT0.14
rs649127714 (G>A)GG0.080.29 (G)0.590.411.70.580.33
GA0.430.71 (A)
AA0.49
rs639183528 (C>T)CC0.620.77 (C)0.650.351.540.070.29
CT0.310.23 (T)
TT0.07
rs649573228 (G>A)AA0.890.95 (A)0.90.11.110.750.1
GA0.110.05 (G)
rs652899012 (G>A)GG0.58 0.650.351.540.090.29
AG0.390.77 (G)
AA0.030.23 (A)
Note: Ho, He, Ne, and PIC represent homozygosity, heterozygosity, effective number of alleles, and polymorphism information content, respectively; p > 0.05 indicates the locus was under Hardy–Weinberg equilibrium.
Table 2. Haplotype and haplotype combination construction.
Haplotype and Haplotype CombinationTypeGenotypeFrequency
HaplotypeH1GG0.487
H2AG0.141
H3AT0.372
H1H3GGAT0.379
Haplotype combinationH2H2GGGG0.241
H3H3ATAT0.124
H2H3AGAT0.118
H1H2GGAG0.112
H1H1AGAG0.026
Table 3. Association analysis of six SNPs with birth weight in Nanjiang Yellow goat population.
LocusGenotypeNumberBirth Weight
rs672215506 (G>A)AA922.29 ± 0.28 a
GA1492.26 ± 0.29 ab
GG842.20 ± 0.31 b
rs660965343 (G>T)TT432.29 ± 0.26 a
GT1512.27 ± 0.33 ab
GG1322.22 ± 0.27 b
rs649127714 (G>A)AA1612.27 ± 0.34
GA1402.24 ± 0.24
GG252.22 ± 0.30
rs639183528 (C>T)CC2002.26 ± 0.32
CT1012.24 ± 0.26
TT232.23 ± 0.25
rs649573228 (G>A)AA2872.25 ± 0.31
GA352.24 ± 0.24
AA112.26 ± 0.26
rs652899012 (G>A)AG1252.22 ± 0.27
GG1862.27 ± 0.32
Note: Different small letters in the same group mean significant difference (p < 0.05).
Table 4. Association analysis of six SNPs with various body size traits for different amounts of months in the Nanjiang Yellow goat population.
Locusrs672215506 (G>A)rs660965343 (G>T)rs649127714 (G>A)
GenotypeAAGAGGTTGTGGAAGAGG
Number6088492689821008215
BW-625.99 ± 3.8725.83 ± 4.4526.28 ± 4.5825.42 ± 3.67 b25.99 ± 4.16 ab26.17 ± 4.64 a26.66 ± 4.42 A25.26 ± 3.91 B25.53 ± 5.03 B
BL-658.85 ± 5.2159.06 ± 5.4259.73 ± 5.5358.00 ± 4.43 B59.16 ± 5.23 A59.54 ± 5.79 A59.79 ± 5.59 A58.37 ± 4.98 B59.33 ± 5.77 AB
BH-655.80 ± 4.44 B56.11 ± 4.96 A56.11 ± 4.96 A55.23 ± 3.92 B56.21 ± 4.79 A56.43 ± 4.80 A56.71 ± 4.99 A55.50 ± 4.24 B56.27 ± 4.67 AB
CC-665.19 ± 4.0265.06 ± 4.5665.71 ± 4.8364.37 ± 3.65 B65.17 ± 4.23 AB65.65 ± 4.92 A65.89 ± 4.69 Aa64.54 ± 4.09 Bb65.07 ± 4.48 ABb
BW-1234.08 ± 4.5434.22 ± 5.0434.49 ± 5.3133.37 ± 4.18 Bb34.37 ± 4.80 ABa34.39 ± 5.33 Aa35.02 ± 5.23 A33.38 ± 4.33 B33.83 ± 5.55 B
BL-1265.70 ± 4.76 Bb66.11 ± 5.14 ABb66.80 ± 5.65 Aa64.73 ± 4.19 Bc66.13 ± 5.01 Ab66.63 ± 5.54 Aa66.72 ± 5.46 A65.44 ± 4.68 B66.33 ± 5.39 AB
BH-1262.75 ± 4.04 b63.13 ± 4.55 b63.73 ± 4.71 a62.15 ± 3.56 Bb63.08 ± 4.37 ABa63.57 ± 4.74 Aa63.61 ± 4.69 a62.55 ± 4.03 b63.53 ± 4.70 a
CC-1274.86 ± 4.9375.26 ± 5.2875.87 ± 5.2074.12 ± 4.73 Bb75.23 ± 4.92 ABa75.73 ± 5.49 Aa75.76 ± 5.5174.76 ± 4.7475.10 ± 4.73
BW-1847.23 ± 6.4348.39 ± 7.6248.20 ± 7.4546.33 ± 6.08 B48.20 ± 7.37 A48.29 ± 7.39 A48.67 ± 7.79 a47.10 ± 6.08 b48.30 ± 8.80 ab
BL-1872.78 ± 4.8073.56 ± 5.4273.53 ± 5.6571.35 ± 4.23 B73.48 ± 5.11 A73.76 ± 5.68 A73.77 ± 5.58 a72.82 ± 4.84 b73.00 ± 5.66 b
BH-1869.17 ± 3.9569.30 ± 4.3169.41 ± 4.3868.38 ± 3.42 B69.25 ± 4.22 AB69.61 ± 4.40 A69.69 ± 4.43 A68.70 ± 3.69 AB69.80 ± 5.10 B
CC-1885.52 ± 4.6685.85 ± 5.1085.71 ± 4.8884.46 ± 4.34 B85.93 ± 4.62 A85.88 ± 5.33 A86.32 ± 5.13 a85.04 ± 4.37 b85.37 ± 5.80 b
Locusrs639183528 (C > T)rs649573228 (G>A)rs652899012 (G>A)
GenotypeCCCTTTAA GAAAAGGG
Number1196315174 21771117
BW-626.38 ± 4.4525.47 ± 3.8525.10 ± 4.6926.14 ± 4.28 24.86 ± 4.5625.71 ± 5.1925.19 ± 4.0026.46 ± 4.41
BL-659.45 ± 5.54 a58.89 ± 5.03 ab58.00 ± 5.57 b59.30 ± 5.41 A 58.05 ± 5.31 B60.14 ± 6.15 A58.49 ± 5.09 B59.56 ± 5.52 AB
BH-656.45 ± 4.9755.76 ± 4.0855.67 ± 4.8256.32 ± 4.70 A 55.14 ± 4.67 B57.29 ± 5.22 A55.48 ± 4.16 B56.53 ± 4.97 AB
CC-665.55 ± 4.7264.92 ± 4.0764.40 ± 3.9665.44 ± 4.47 A 64.00 ± 4.42 B65.71 ± 4.03 a64.65 ± 4.23 b65.62 ± 4.64 ab
BW-1234.60 ± 5.1733.79 ± 4.4733.30 ± 5.0234.43 ± 4.95 A 32.67 ± 4.91 B34.07 ± 5.7633.48 ± 4.4834.71 ± 5.18
BL-1266.39 ± 5.3465.87 ± 4.7665.47 ± 5.4466.29 ± 5.22 A 65.24 ± 4.82 B66.57 ± 6.16 a65.58 ± 4.72 b66.51 ± 5.39 ab
BH-1263.34 ± 4.6662.86 ± 3.9563.00 ± 4.7763.29 ± 4.46 A 62.24 ± 4.41 B63.86 ± 5.24 a62.65 ± 4.01 b63.43 ± 4.67 ab
CC-1275.45 ± 5.3475.30 ± 5.0273.97 ± 3.9575.41 ± 5.18 74.52 ± 5.0675.36 ± 5.0274.80 ± 4.8075.58 ± 5.40
BW-1848.41 ± 7.5847.40 ± 6.4247.10 ± 7.6648.14 ± 7.34 47.05 ± 6.4547.79 ± 8.3247.20 ± 6.6348.53 ± 7.55
BL-1873.61 ± 5.5272.98 ± 4.9172.40 ± 5.0373.40 ± 5.32 a 73.00 ± 5.2 b73.29 ± 5.8872.77 ± 4.9673.7 ± 5.48
BH-1869.47 ± 4.3468.94 ± 3.8269.27 ± 4.7669.4 ± 4.24 A 68.57 ± 4.01 B68.71 ± 4.8268.83 ± 3.8169.55 ± 4.34
CC-1886.02 ± 5.1085.33 ± 4.5384.87 ± 4.8185.84 ± 4.92 A 84.60 ± 4.91 B85.00 ± 4.9385.08 ± 4.7286.13 ± 5.03
Note: Values are shown as means ± standard deviation; a,b,c means with different superscripts are significantly different (p < 0.05); A,B means with different superscripts are very significantly different (p < 0.01); body weight for six months (BW-6), body length for six months (BL-6), body height for six months (BH-6), chest circumference for six months (CC-6), and so on.
Table 5. Association analysis between haplotype combination and growth traits of Nanjiang Yellow goats.
Combined HaplotypesH2H3H3H3H1H2H1H3H2H2
Number2726267549
BW-626.30 ± 3.63 a25.42 ± 3.67 b25.77 ± 4.67 ab25.66 ± 4.42 ab26.28 ± 4.58 ab
BL-659.52 ± 5.4 Aa58 ± 4.43 Bb59.19 ± 6.06 Aa58.8 ± 5.29 ABab59.73 ± 5.53 Aa
BH-656.11 ± 4.46 Aa55.23 ± 3.92 Bb55.77 ± 5.04 ABa56.07 ± 5.02 ABa56.73 ± 4.51 Aa
CC-665.70 ± 3.71 Aa64.37 ± 3.65 Bc65.35 ± 4.91 Aab64.74 ± 4.40 ABbc65.71 ± 4.83 Aab
BW-1234.33 ± 4.46 a33.37 ± 4.18 b33.83 ± 5.30 ab34.14 ± 4.95 ab34.49 ± 5.31 a
BL-1266.07 ± 4.82 Aab64.73 ± 4.19 Bc66.00 ± 5.29 Aab66.02 ± 5.09 Ab66.80 ± 5.65 Aa
BH-1262.85 ± 4.03 ABa62.15 ± 3.56 Bb63.00 ± 4.67 ABa63.01 ± 4.47 ABb63.73 ± 4.71 Aa
CC-1275.35 ± 4.90 Aa74.12 ± 4.73 Bb75.46 ± 6.05 Aa74.88 ± 4.94 Bb75.87 ± 5.20 Aa
BW-1847.76 ± 6.53 Aa46.33 ± 6.08 Bb48.38 ± 7.45 Aa47.93 ± 7.45 Ba48.20 ± 7.45 Aa
BL-1873.56 ± 4.55 Aab71.35 ± 4.23 Bc73.81 ± 5.64 Aa73.2 ± 5.22 Ab73.53 ± 5.65 Aab
BH-1869.52 ± 4.05 Aab68.38 ± 3.42 Bc69.69 ± 4.34 Aa69.03 ± 4.16 Ab69.41 ± 4.38 Aab
CC-1886.33 ± 4.07 Aa84.46 ± 4.34 Bb86.08 ± 5.73 Aa85.61 ± 4.88 ABab85.71 ± 4.88 ABa
Note: Values are shown as means ± standard deviation; a,b,c means with different superscripts are significantly different (p < 0.05); A,B means with different superscripts are very significantly different (p < 0.01); body weight for six months (BW-6), body length for six months (BL-6), body height for six months (BH-6), chest circumference for six months (CC-6), and so on.
Table 6. Association analysis between haplotype combination and lambing number of Nanjiang Yellow goats.
Combined HaplotypesNumberPrimiparityMultiparity
H2H3211.52 ± 0.511.82 ± 0.26 Cc
H3H3231.74 ± 0.451.95 ± 0.15 BCb
H1H2181.67 ± 0.491.94 ± 0.24 BCb
H1H3471.57 ± 0.541.98 ± 0.21 Bb
H2H2341.65 ± 0.542.13 ± 0.17 Aa
Note: Values are shown as means ± standard deviation; a,b,c means with different superscripts are significantly different (p < 0.05); A,B,C means with different superscripts are very significantly different (p < 0.01).
Disclaimer/Publisher’s Note: The statements, opinions and data contained in all publications are solely those of the individual author(s) and contributor(s) and not of MDPI and/or the editor(s). MDPI and/or the editor(s) disclaim responsibility for any injury to people or property resulting from any ideas, methods, instructions or products referred to in the content.

