Article

Genome-Wide Identification of the IQM Gene Family and Their Transcriptional Responses to Abiotic Stresses in Kiwifruit (Actinidia eriantha)

1
National Engineering Laboratory of Crop Stress Resistance Breeding, School of Life Sciences, Anhui Agricultural University, Hefei 230036, China
2
College of Food and Bioengineering, Bengbu University, Bengbu 233030, China
*
Author to whom correspondence should be addressed.
Genes 2024, 15(2), 147; https://doi.org/10.3390/genes15020147
Submission received: 2 January 2024 / Revised: 20 January 2024 / Accepted: 22 January 2024 / Published: 23 January 2024
(This article belongs to the Special Issue Abiotic Stress in Plants: Genetics and Genomics)

Abstract

:
IQM is a plant-specific calcium-binding protein that plays a pivotal role in various aspects of plant growth response to stressors. We investigated the IQM gene family and its expression patterns under diverse abiotic stresses and conducted a comprehensive analysis and characterization of the AeIQMs, including protein structure, genomic location, phylogenetic relationships, gene expression profiles, salt tolerance, and expression patterns of this gene family under different abiotic stresses. Based on phylogenetic analysis, these 10 AeIQMs were classified into three distinct subfamilies (I–III). Analysis of the protein motifs revealed a considerable level of conservation among these AeIQM proteins within their respective subfamilies in kiwifruit. The genomic distribution of the 10 AeIQM genes spanned across eight chromosomes, where four pairs of IQM gene duplicates were associated with segmental duplication events. qRT-PCR analysis revealed diverse expression patterns of these AeIQM genes under different hormone treatments, and most AeIQMs showed inducibility by salt stress. Further investigations indicated that overexpression of AeIQMs in yeast significantly enhanced salt tolerance. These findings suggest that AeIQM genes might be involved in hormonal signal transduction and response to abiotic stress in Actinidia eriantha. In summary, this study provides valuable insights into the physiological functions of IQMs in kiwifruit.

1. Introduction

Various stresses influence plant growth and development [1]. Notably, abiotic stressors, including high temperature, salinity, drought, and cold, are widely recognized as primary factors contributing to global crop yield reduction [2,3,4,5]. Soil salinization, in particular, is a widespread problem, altering soil characteristics, reducing moisture content, and compacting the soil, resulting in hindered plant growth and development [2]. Unlike animals, plants cannot relocate to avoid unfavorable conditions. However, during the process of evolution, they have developed special adaptation mechanisms to cope with these rapidly changing stressors [6,7,8]. Many signaling pathways are involved in plants’ responses to abiotic stresses. Among them, calcium ions (Ca2+) play a crucial role as an important second messenger in plants’ adaptation to external stimuli [9,10,11].
Plants primarily monitor spatial and temporal changes in cytosolic Ca2+ levels through specific Ca2+ sensors and convert these Ca2+ level changes into a series of downstream effects [12]. Ca2+ sensors are divided into four classes based on the number of Ca2+-binding helix–loop–helix EF-hand motifs they contain, such as calmodulins (CaMs), calcineurin B-like proteins (CBLs), calcium-dependent protein kinases (CDPKs), and calmodulin-like proteins (CMLs) [9,13,14]. Among them, calmodulin is a highly conserved, small, acidic protein. CaM itself lacks enzymatic activity but undergoes conformational changes upon Ca2+ binding, thereby activating downstream target proteins, including kinases, metabolic enzymes, cytoskeletal proteins, and transcription factors, and participating in various cellular processes [9,12,15]. CaM-binding proteins can be categorized into two types: Ca2+-dependent and Ca2+-independent. Ca2+-independent types include CaM-binding proteins containing IQ motifs. In plants, based on differences in structural domains and the number of IQ motifs present, these CaM-binding proteins are classified into five families: the IQ motif-containing protein (IQM) [16], IQ67-domain-containing protein (IQD) [17], cyclic nucleotide-gated channel (CNGC) [18], calmodulin-binding transcription activator (CAMTA) [19], and myosin families [20].
The IQM family is a very important class of calmodulin-binding protein family genes, which are widely present in various organs of plants [16,21,22]. IQM contains a single IQ motif that binds to calmodulin, located at the N-terminus of the amino acid sequence [16]. Previous research has demonstrated marked variations in the expression profiles of IQMs across diverse tissues and responses to various stress conditions. These dynamic expression patterns denote their potential involvement in various physiological regulatory processes associated with plant growth, development, and stress responses. The IQM gene family has been successfully identified in some plant species, including Arabidopsis [23], soybean [21], and rice [22]. Arabidopsis has six IQM gene family members (AtIQM1-AtIQM6), with IQM1 being involved in regulating stomatal movement, root growth, jasmonic acid methyl ester biosynthesis, and defense against gray mold [23,24]. IQM4 plays a role in seed dormancy, germination, and growth [25]. Mutations in IQM5 can result in altered flowering time phenotypes [26]. Eight OsIQM gene family members have been reported in rice, and studies have shown that OsIQMs participate in regulating various pathways through interaction with IQ motifs in OsCaMs. Additionally, almost all OsIQMs genes are responsive to ABA and MeJA [22].
However, despite notable progress in the identification and characterization of IQM gene family members across some plant species, comprehensive knowledge regarding their presence and structural attributes in kiwifruit remains limited. Therefore, the present study endeavors to conduct an extensive analysis of the IQM gene family in kiwifruit. This investigation encompasses genome-wide scale methodologies, as well as molecular biology techniques, to unravel essential aspects such as phylogenetic relationships, conserved motifs, chromosome localization, gene structure, and expression profiles in response to both abiotic stressors and hormonal stimuli within the AeIQM family. Moreover, kiwifruit is highly susceptible to changes in soil salt content, which can disrupt cellular ion balance, hinder enzyme functions, and hamper metabolic networks, consequently affecting cell growth and development [27,28,29,30]. Prior studies have demonstrated that kiwifruit growth and development are adversely affected even by soil salt contents as low as 0.14%, resulting in diminished accumulation of organic matter and shorter internode lengths. Furthermore, a salt content of 0.54% exerts a further deleterious impact, leading to reduced yield and lower tree survival rates [31]. Building upon these findings, we conducted a subsequent investigation focusing on examining the expression levels of the IQM gene family under salt stress conditions. Additionally, we employed the strategy of overexpressing IQM genes in yeast to ascertain their responsiveness to salt stress. By providing significant theoretical insights into the structural characteristics and potential functionalities of IQM genes in kiwifruit, this study holds exceptional importance for advancing our understanding and enhancing kiwifruit’s ability to flourish in salt-stress environments.

2. Materials and Methods

2.1. Identification of Kiwifruit IQM Proteins

The A. eriantha (White) genome sequences were downloaded from the Kiwifruit Genome Database (https://kiwifruitgenome.org/, accessed on 17 November 2023). The Arabidopsis and Oryza sativa IQM protein sequences were retrieved from the Phytozome v13 database (http://phytozome-next.jgi.doe.gov, accessed on 17 November 2023) [32]. The six AtIQM and eight OsIQM protein sequences were used as query sequences to search against the kiwifruit protein databases using the BLASTP program, with an e-value of 1 × e−50 as the threshold. The conserved domains of candidate sequences were annotated using the SMART (http://smart.emblheidelberg.de/, accessed on 20 November 2023) [33] and Pfamscan (https://www.ebi.ac.uk/Tools/pfa/pfamscan/, accessed on 20 November 2023) databases [34]. Members of the kiwifruit IQM family were identified based on the presence of the complete IQ motif. Information on AeIQM genes, including genome sequences, location coordinates, ORF lengths, amino acid numbers, and molecular weight, were obtained from the kiwifruit genome database. The physicochemical characteristics of the AeIQMs were generated via ExPASy (http://web.expasy.org/protparam/, accessed on 20 November 2023), a comprehensive resource for protein analysis [35].

2.2. Phylogenetic Analysis

To investigate the evolutionary relationships of AeIQMs within and between species, we obtained predicted IQM protein sequences from corresponding databases for multiple species. Specifically, we retrieved IQM protein sequences from kiwifruit (A. eriantha, White), rice (Oryza sativa-IRGSP-1.0), and Arabidopsis thaliana from the kiwifruit genome database and Phytozome v13 database. The phylogenetic tree was constructed using the neighbor-joining (NJ) method via MEGA software (v11), applying the P-distance substitution model. Bootstrap analysis was performed using 1000 replicates [36]. The generated phylogenetic tree was visualized using Chiplot (https://www.chiplot.online/, accessed on 20 December 2023).

2.3. Chromosomal Localization and Gene Duplication

The TBtools software (v2.027) was utilized to determine the chromosomal distribution and gene duplication events of AeIQM genes [37] based on their positional information obtained from the kiwifruit genome database. To investigate the evolutionary divergence of duplicated genes, the non-synonymous substitution rate (Ka) and synonymous substitution rate (Ks) were computed using the TBtools software. To establish the evolutionary relationships, the genome databases and gene annotation files of kiwifruit were subjected to analysis using the MCScanX function, which facilitated the identification of homologous gene pairs [38]. Subsequently, the Ka/Ks function was employed for the purpose of calculating the evolutionary divergence.

2.4. Analysis of the Gene Structures, Conserved Motifs, and Cis-Acting Elements of AeIQM

To analyze the structure of AeIQM genes, we downloaded the coding sequence (CDS) and gff3 format files of AeIQM genes from the kiwifruit genome database. Subsequently, we utilized TBtools software to analyze the exon/intron structure for each IQM gene. To identify conserved motifs within AeIQM proteins, we utilized Multiple Expectation Maximization for Motif Elicitation (MEME, http://meme.nbcr.net/meme/cgibin/meme.cgi, accessed on 20 November 2023) to analyze the complete encoded AeIQM amino acid sequences [39], setting the maximum number of motifs as 15. Additionally, we obtained the 2 kbp promoter sequences of AeIQM genes from the kiwifruit genome database. Subsequently, the obtained sequences were subjected to analysis using the PlantCARE Database website (https://bioinformatics.psb.ugent.be/webtools/plantcare/html/, accessed on 27 November 2023) to predict the presence of cis-acting elements. The obtained results were visualized using TBtools software (v2.027) [37].

2.5. Plant Materials’ Growth Conditions, Hormones, and Abiotic Treatments

The kiwifruit seedlings were cultured in a soil mixture of perlite and sand (3:1, v/v) under specific conditions of 24 °C, 14 h light and 10 h dark, and a relative humidity of 60–80%. To evaluate the changes in the expression levels of AeIQM genes in response to diverse hormone and abiotic stress stimuli, seedlings (plant height: 25–30 cm) were randomly divided into six groups for stress treatments. For hormone treatments, after acquiring each hormone from Sigma (Sigma-Aldrich, St. Louis, MO, USA), aqueous solutions of 300 μM abscisic acid (ABA), 100 μM gibberellin (GA), 100 μM salicylic acid (SA), and 50 μM methyl jasmonate (MeJA) were sprayed onto the leaves of the kiwifruit (both sides of the leaves), respectively [7]. The treated seedlings were harvested at various time points following the treatment, including at 0, 6, 12, 24, and 48 h. Regarding the application of salt and drought stresses, plants 25–30 cm in height were immersed in 0.6% NaCl solution for 6 consecutive days, and the drought stress (direct drought treatment by stopping water supply) involved drying the seedlings for 14 days [40]. The control group consisted of untreated seedlings (CK).

2.6. RNA Isolation, Quantitative Real-Time PCR, and Heatmap

Total RNA was extracted from various kiwifruit samples (samples taken before and after each hormone/stress treatment) using the RNA Midi Kit (OMEGA, Guangzhou, China), following the manufacturer’s protocols. RNA extraction was conducted in triplicate using three biological replicates. Subsequently, reverse transcription was carried out using the First-Strand cDNA Synthesis Kit (Vazyme, Nanjing, China). For quantitative real-time PCR (qRT-PCR), the Thermo Scientific Pikoreal Cycler 96 Real-Time PCR system was employed with SYBR Green Master Mix (Vazyme, Nanjing, China). The internal control for mRNA was AeActin1, and the relative expression levels of genes were determined using the 2−∆∆CT method [41]. All experiments were performed in triplicate. Detailed information about the primer sequences can be found in Supplementary Materials Table S1. A heatmap was generated from real-time quantitative PCR analysis of AeIQM genes after hormone treatment. Values are the mean of three technical measurements. TBtools software (v2.027) normalized the data to obtain relative intensity values, with red indicating high expression levels and blue indicating low expression levels [38].

2.7. Salt Stress Tolerance Assays of IQM Genes in Yeast

The open reading frame (ORF) of IQM genes was amplified from the A. eriantha cDNA library through the utilization of primers designed with BamHI and EcoRI sites incorporated. The PCR-amplified products were then digested and inserted into the corresponding sites of the yeast expression vector pYES2-NT B, which harbors the URA3 selection marker controlled by a GAL1 promoter. The resulting recombinant plasmids (pYES2-AeIQMs) were separately transformed into Saccharomyces cerevisiae strain INVSC1. Yeast strains were incubated in SG-Ura liquid medium at 30 °C on a shaker for 24 h to induce AeIQM gene expression. Subsequently, the optical density (OD600) of the yeast cultures was measured using a multifunctional enzyme marker (PerkinElmer EnSpire, Waltham, MA, USA), and the cultures were adjusted to an equal cell density. The yeast cells were then collected for stress assays. To examine the growth of yeast cells under stress conditions, the collected yeast cells were treated with 1.0 M NaCl for 6 h. A volume of 2.0 μL of yeast cells was spotted onto solid SG-Ura medium supplemented with 1.0 M NaCl, followed by incubation at 30 °C for 3–4 days using Memmert Incubator IN75. The growth of yeast cells was assessed based on the observed phenotypes. Furthermore, to evaluate the survival rates of yeast cells after salt stress, the cell densities were measured after incubation. The yeast cells were adjusted to an equal cell density and then cultured in 0.5 M, 1 M, and 2 M NaCl at 30 °C with shaking for 24 h. The cell densities were measured following each treatment.

2.8. Statistical Analysis

The data presented are the means of three replicates analyzed using Student’s t-test in Prism software (v9.5.0), with error bands indicating standard deviations. Asterisks above columns indicate significant differences between rows (* p < 0.05, ** p < 0.01, *** p < 0.001).

3. Results

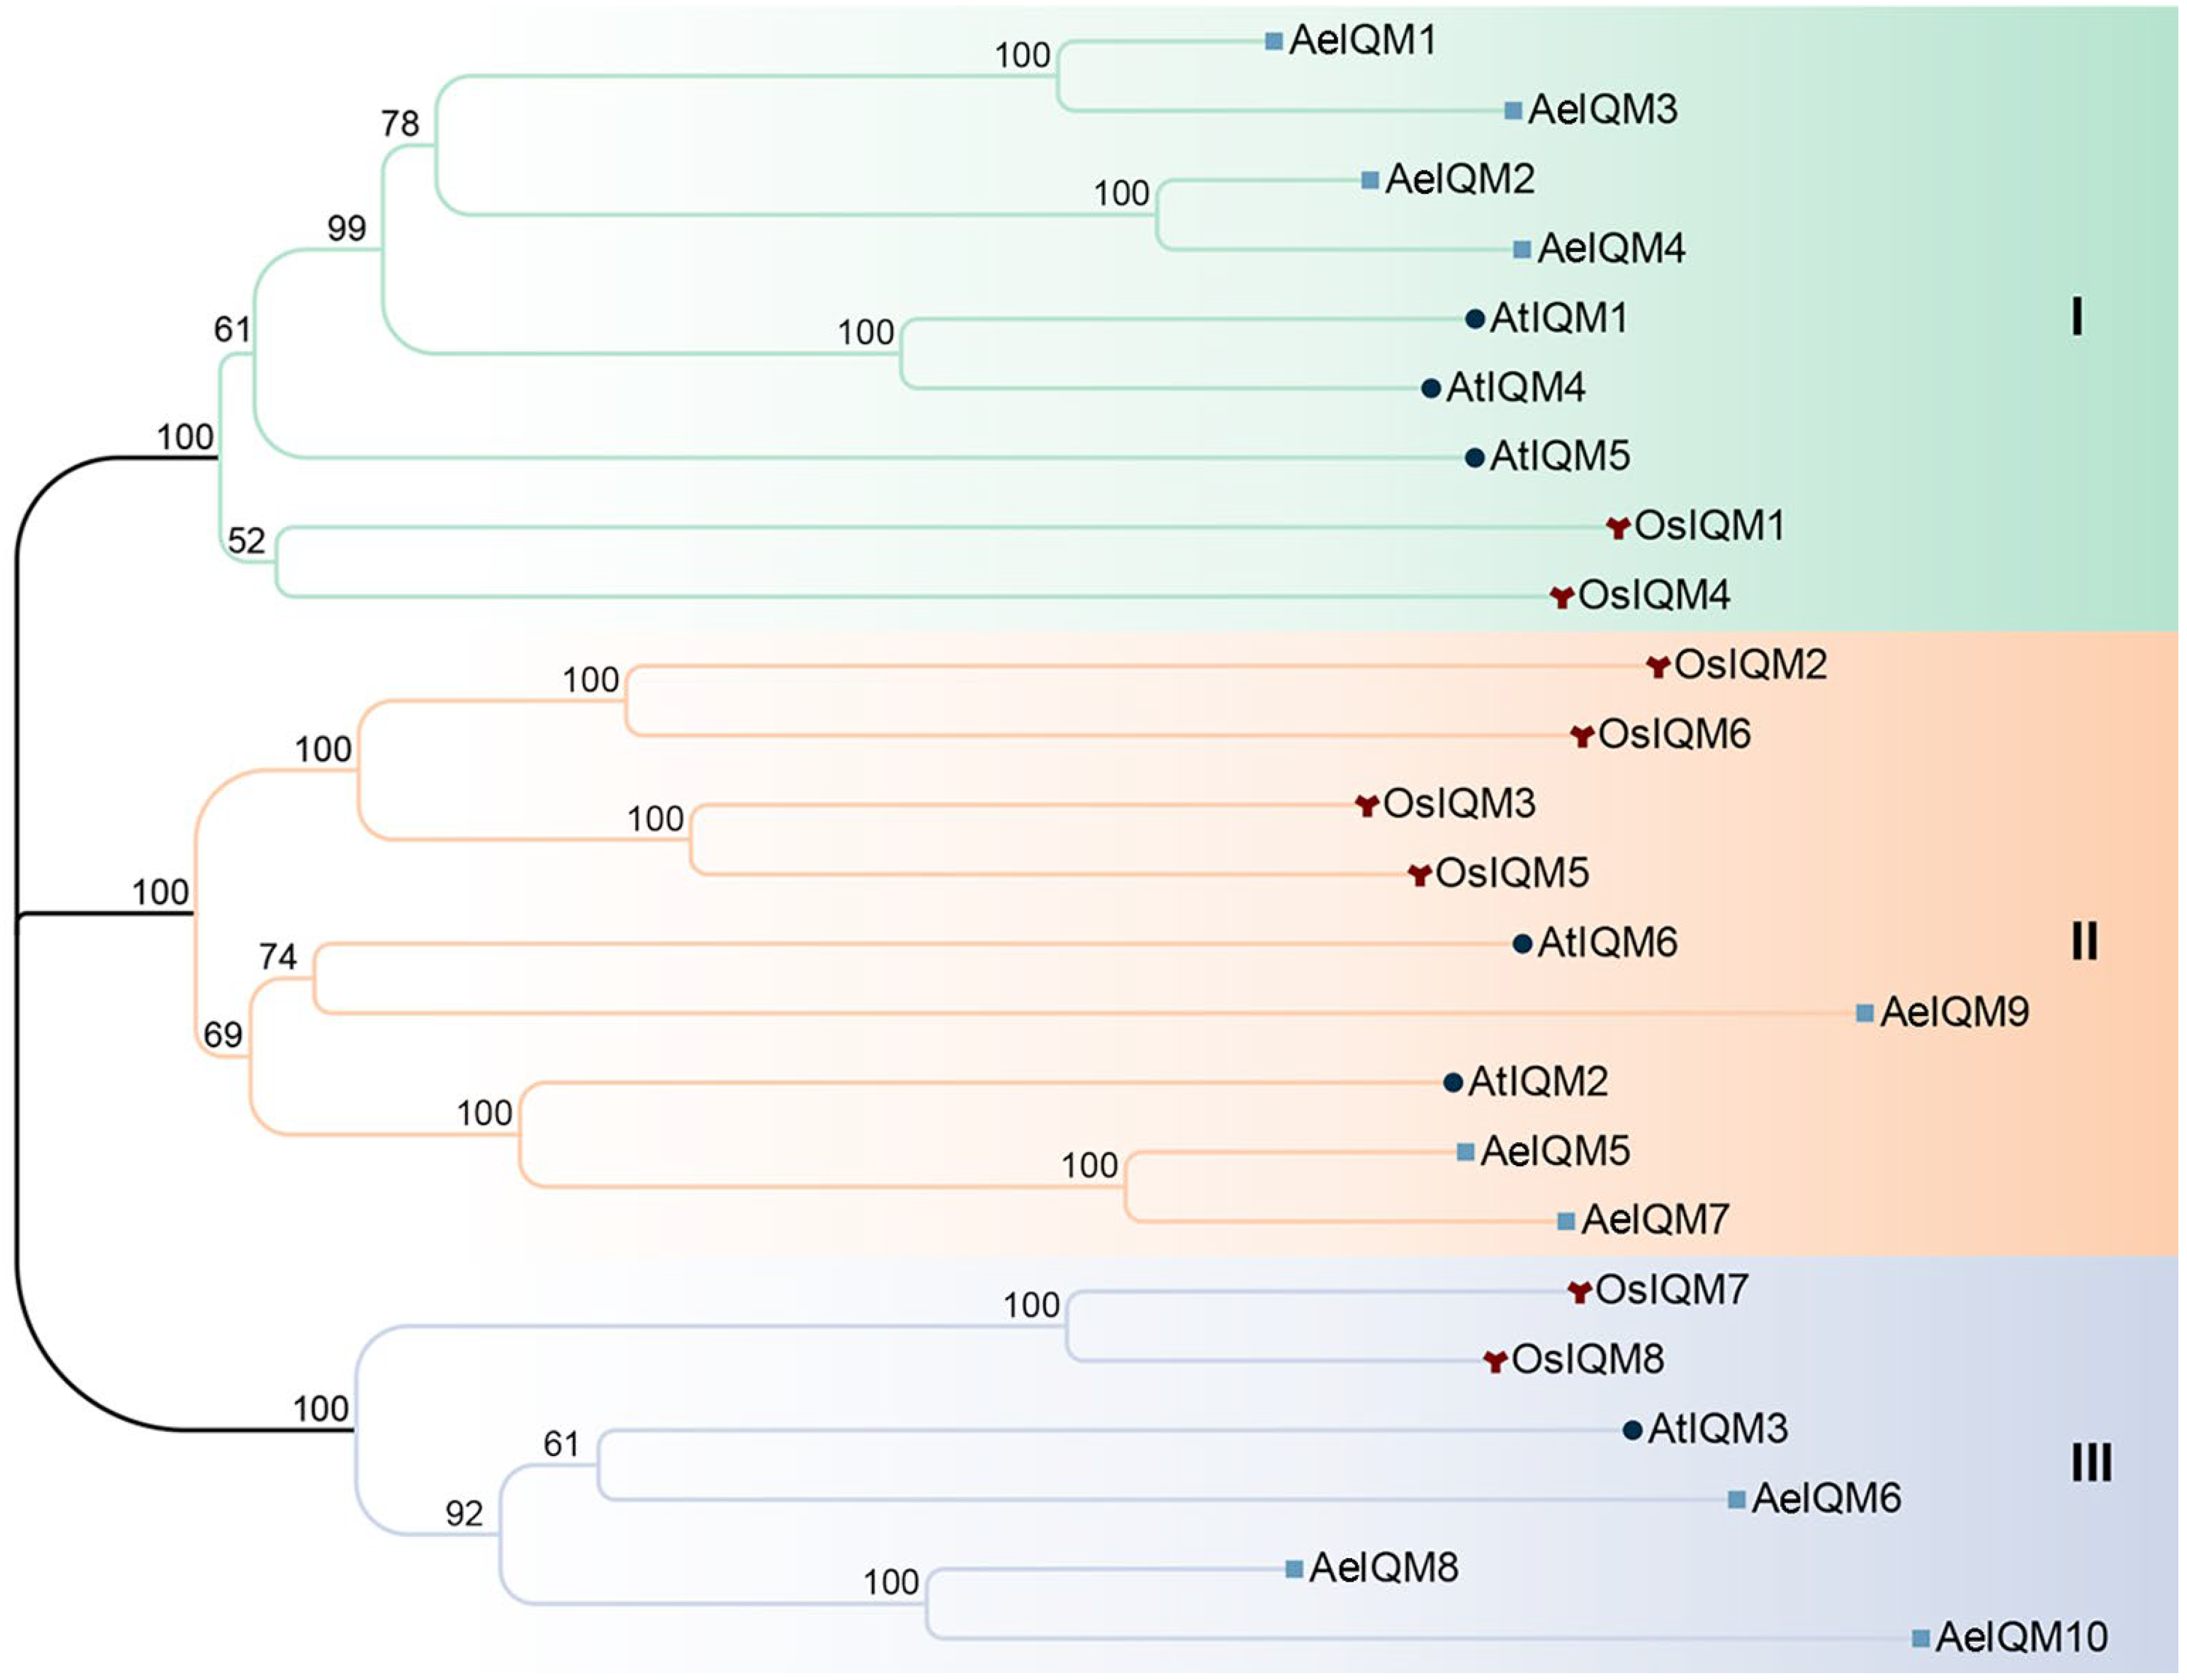
3.1. Identification and Phylogenetic Analyses of IQM Gene Family in Kiwifruit

IQM proteins are plant-specific, calmodulin-binding proteins that are independent of calcium signaling and are characterized by the presence of a single IQ motif [16]. In this study, a comprehensive search was carried out using the known sequences of AtIQM and OsIQM proteins as a reference, and 10 AeIQM proteins containing characteristic IQ motifs were identified. The lengths of CDS ranged from 1026 to 1889 bps, and the encoded proteins exhibited diverse lengths, ranging from 341 to 632 amino acids, as recorded in Table 1. Accordingly, their predicted molecular weights ranged from 38.22 to 71.54 kDa. Interestingly, the majority of these proteins displayed theoretical isoelectric point (pI) values that fell within the alkaline range, ranging from 7.99 to 9.10. However, it is worth highlighting that AeIQM5 exhibited a slightly lower pI value of 6.98, while AeIQM6 and AeIQM9 demonstrated even lower pI values of 6.63 and 5.32, respectively.
To gain deeper insights into the evolutionary patterns and phylogenetic relationships, a phylogenetic tree was constructed for the IQM protein members derived from A. eriantha, A. thaliana, and O. sativa. The phylogenetic tree revealed the presence of three distinct subfamilies (I, II, and III) encompassing all the IQM members (Figure 1). Notably, subfamilies I and II emerged as the most prominent clades, each comprising nine IQMs. Collectively, these two subfamilies accounted for 37.5% of the total IQM genes under consideration.

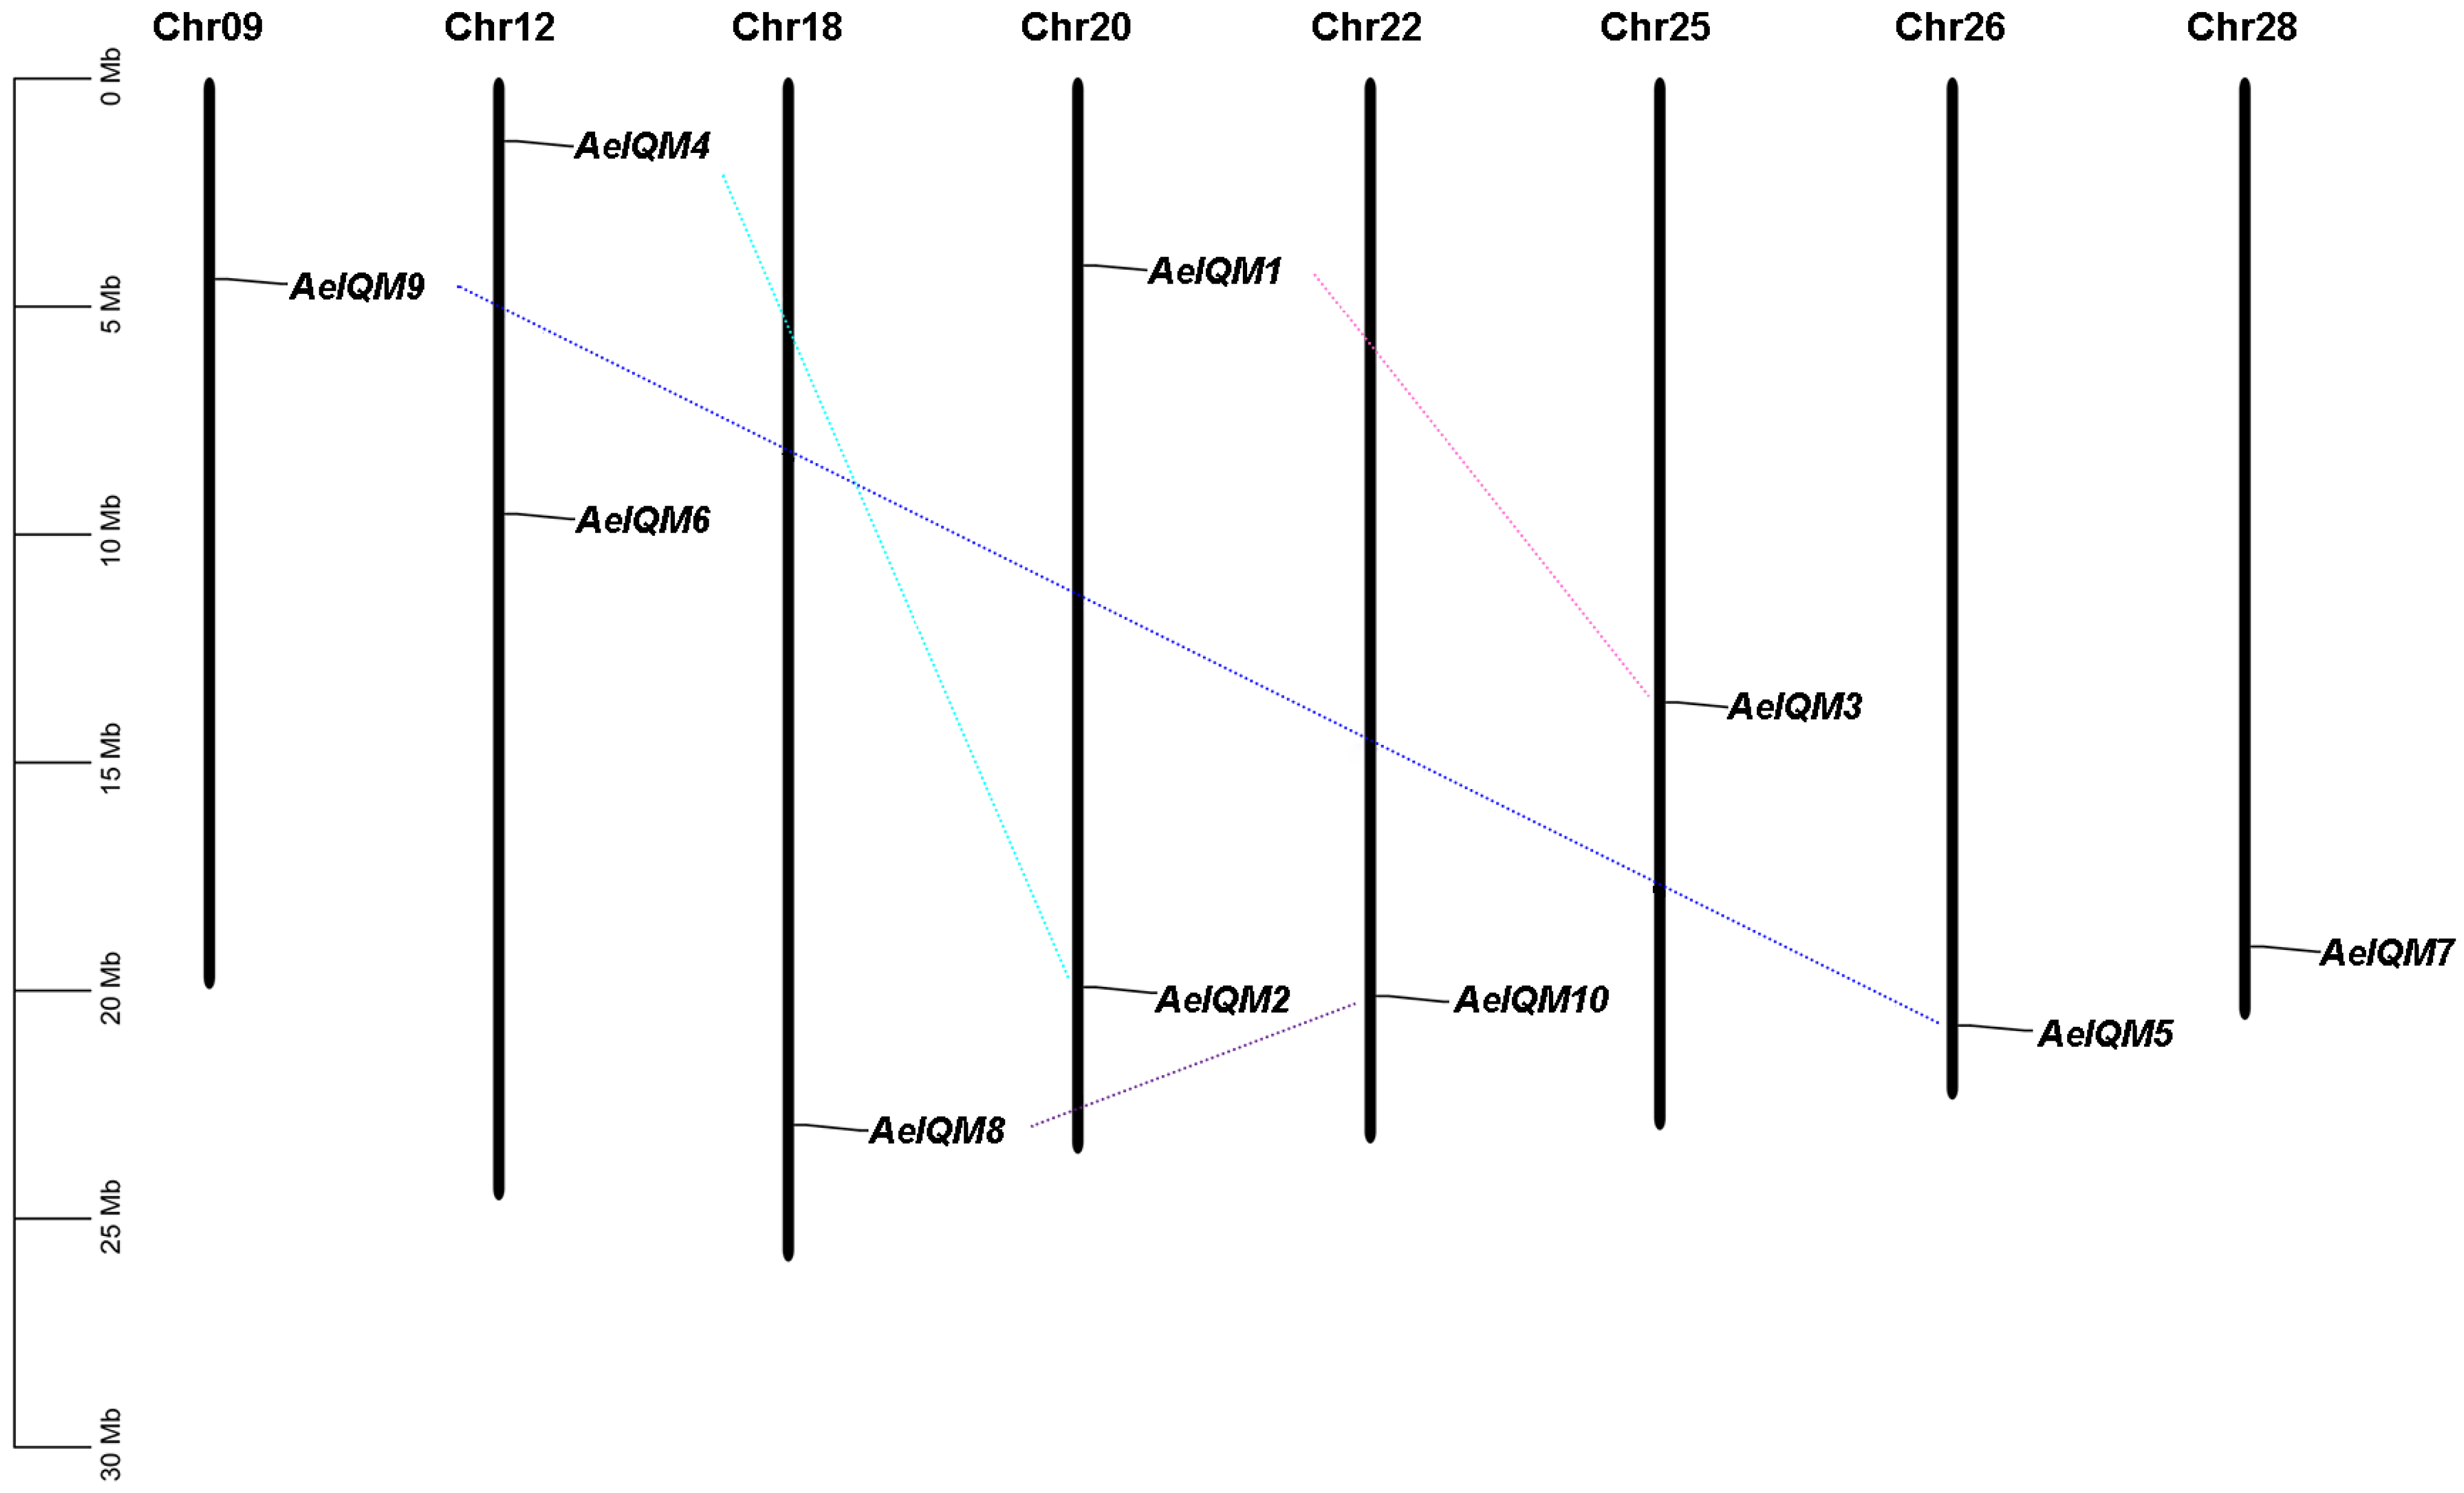
3.2. Chromosomal Locations and Gene Duplication

To accurately determine the chromosomal orientation of the 10 IQM genes in kiwifruit, we constructed a collinearity map using location information obtained from the kiwifruit database (Figure 2). These AeIQM genes were mapped onto eight different chromosomes, namely, chromosomes 9, 12, 18, 20, 22, 25, 26, and 28. Notably, chromosomes 12 and 20 demonstrated the presence of two IQM genes each, while the remaining chromosomes encompassed one IQM gene each. This non-random pattern of IQM gene distribution aligns with the observations made in previous studies [21].
Gene duplication, which is considered a crucial mechanism driving biological evolution, occurs in three main ways: transposition, tandem duplication, and segmental duplication [42,43]. Notably, segmental duplication has been identified as a major driver for the amplification of numerous gene families [40,44,45]. In this study, we investigated gene duplication events to gain further insights into the expansion mechanisms of the IQM family in kiwifruit. A total of four segmental duplication events, AeIQM1/AeIQM3, AeIQM2/AeIQM4, AeIQM7/AeIQM9, and AeIQM8/AeIQM10, were detected in the kiwifruit genome based on the Ka/Ks analysis and the chromosomal distribution of the AeIQM genes (Figure 2, Table 2). Among the four AeIQM gene pairs, no pair of AeIQM genes was clustered on the same chromosome, suggesting that segmental duplication is the mechanism responsible for generating these duplicated gene pairs. Therefore, segmental duplication plays a significant role in the amplification and evolution of the IQM gene family in kiwifruit.

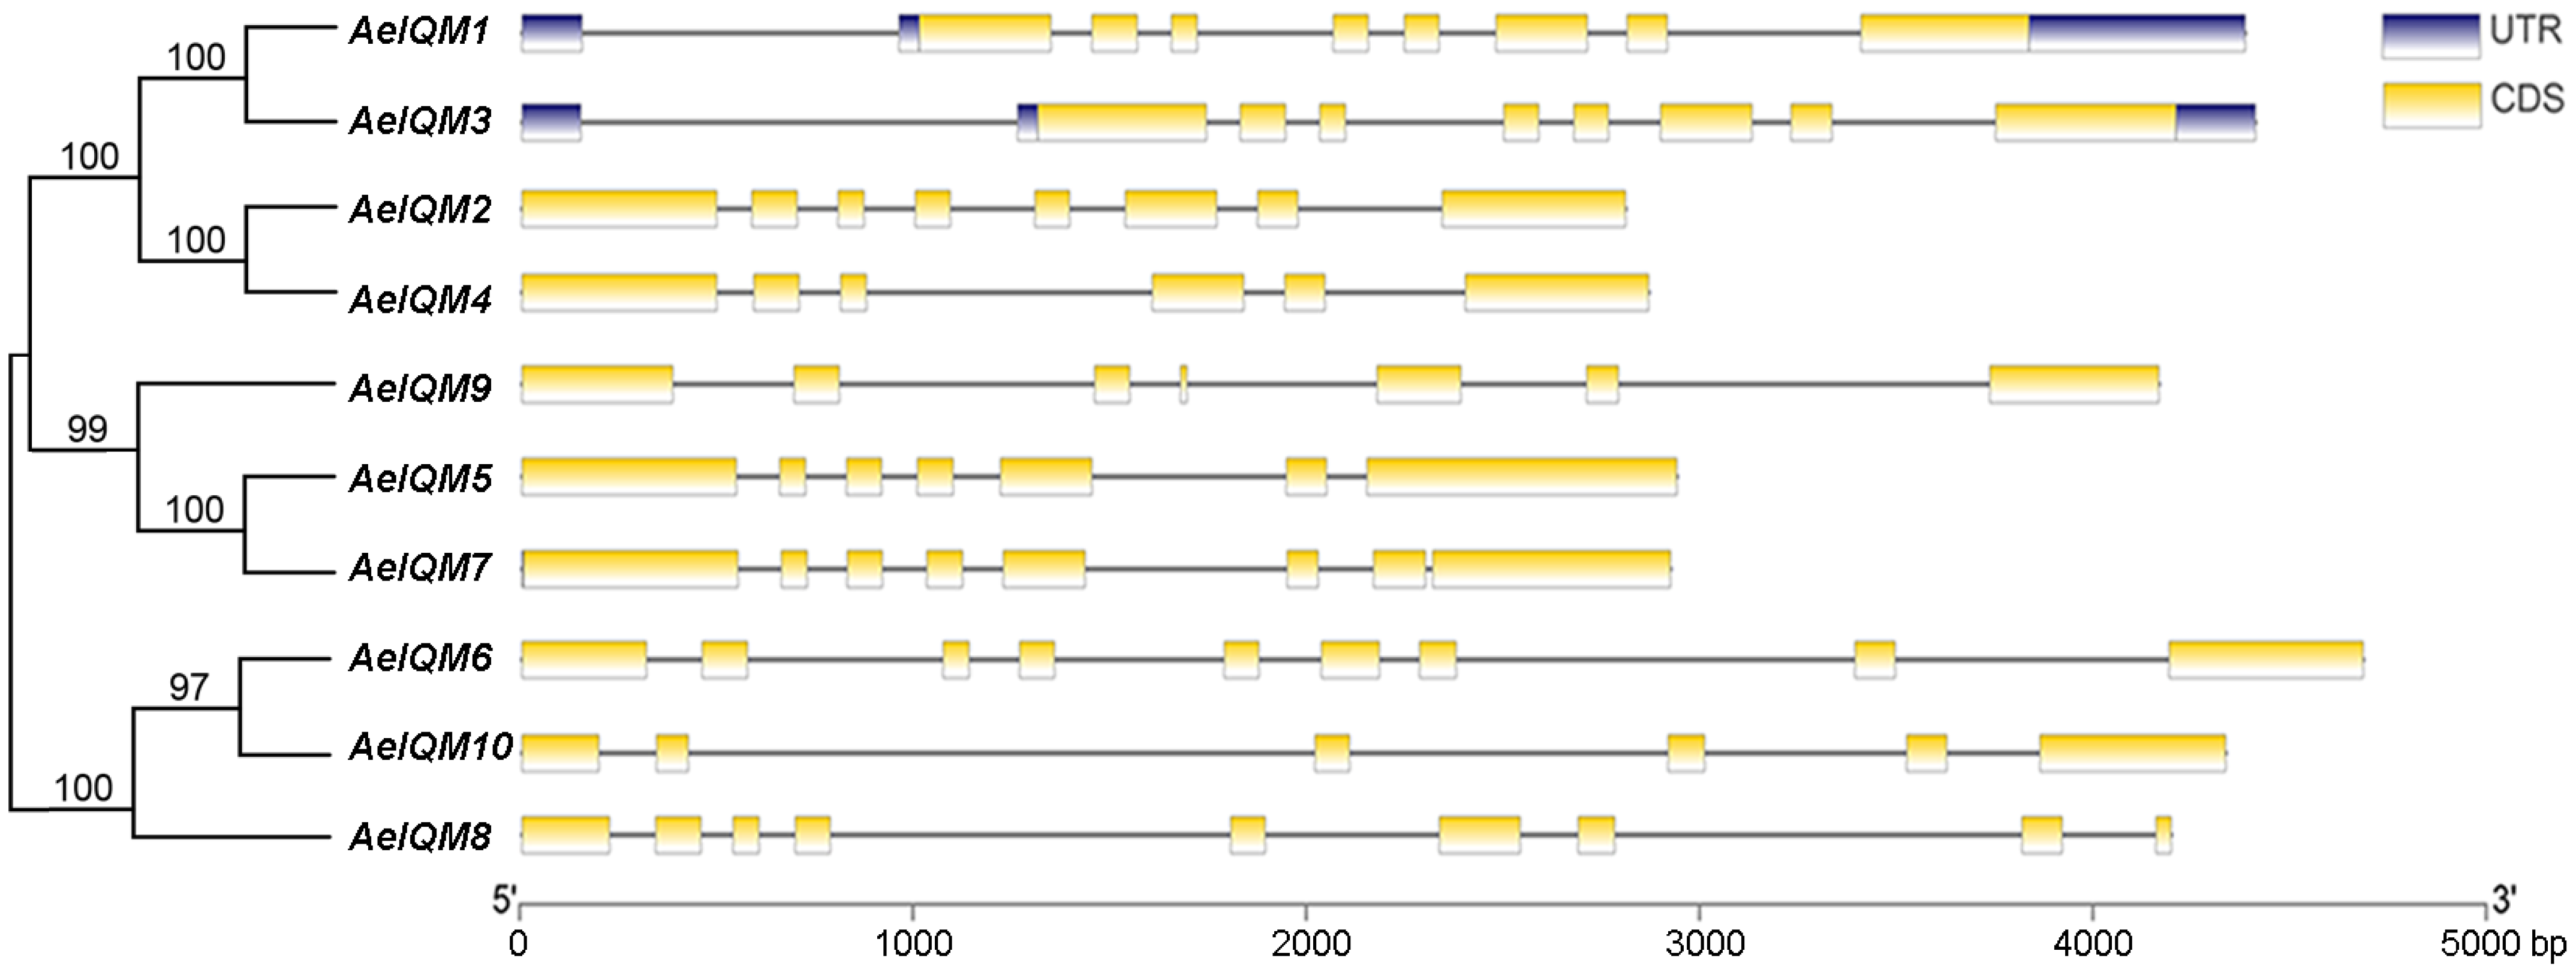
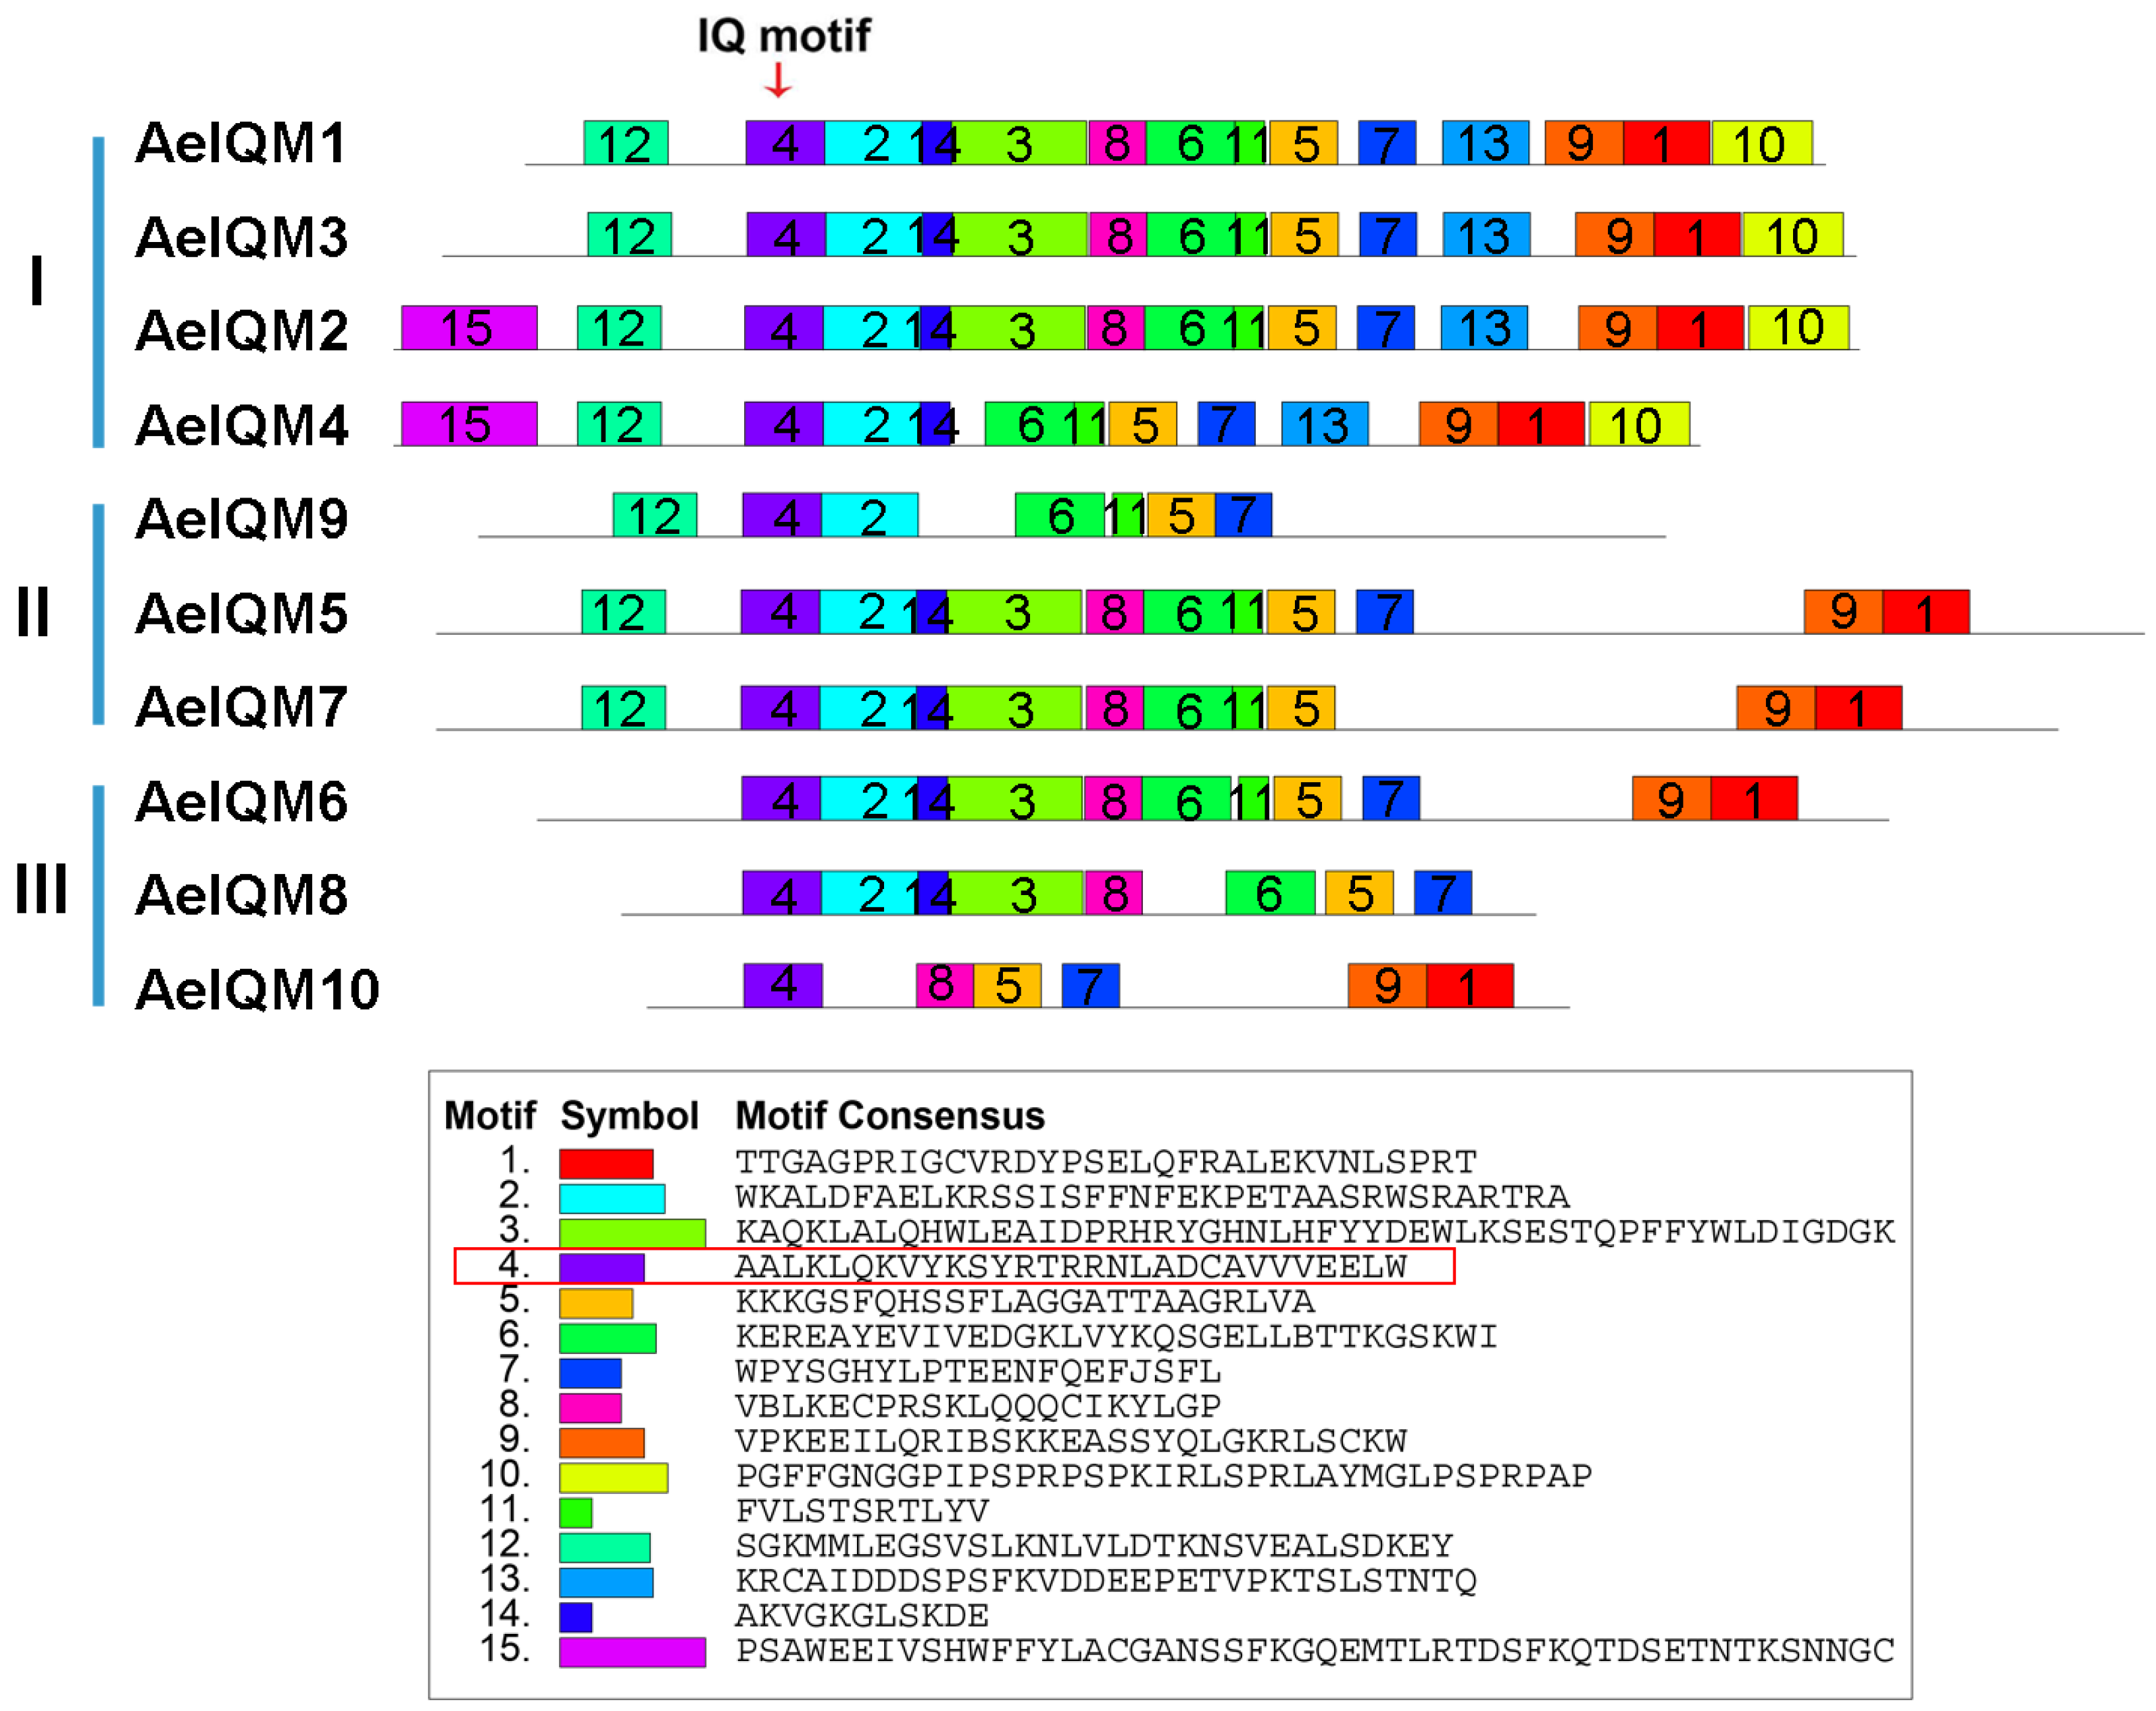
3.3. Gene Structure and Conserved Motifs of Kiwifruit IQM Proteins

The diversity in gene structure serves as a fundamental aspect of the classification of gene families. To further investigate the gene features of AeIQM genes, an analysis of their exon/intron organization was performed (Figure 3). The structural diagram revealed that the majority of AeIQM genes exhibited variable numbers of exons, ranging from five to eight. Importantly, it should be noted that among the IQM gene family, genes 1 and 3 were observed to contain the UTR region, whereas the remaining genes lacked this feature. Moreover, within each subfamily, closely related AeIQM genes displayed consistent gene structures, either in terms of the number or length of introns/exons.
The conserved motifs of 10 AeIQM proteins and a total of 15 potentially conserved motifs, named motifs 1–15 (Figure 4), were examined. Motif 4, after being subjected to a comprehensive search of the Pfamscan and SMART databases, was annotated to encode the IQ motif. It is worth noting that all AeIQM proteins were found to possess motifs 4, 5, and 7. Among the identified motifs, AeIQM2 exhibited the highest number, encompassing motifs 1–15, while AeIQM10 displayed the smallest number of motifs, consisting of only 6 motifs (motifs 1, 4, 5, 7, 8, and 9). Furthermore, certain motifs were found to be specific to particular subfamilies. For instance, motifs 10 and 13 were uniquely present in subfamily I, while motif 12 was absent in subfamily II. Moreover, motif 15 was exclusively observed in AeIQM2 and AeIQM4. These distinct motifs may contribute to functional differentiation among the IQM proteins in kiwifruit.

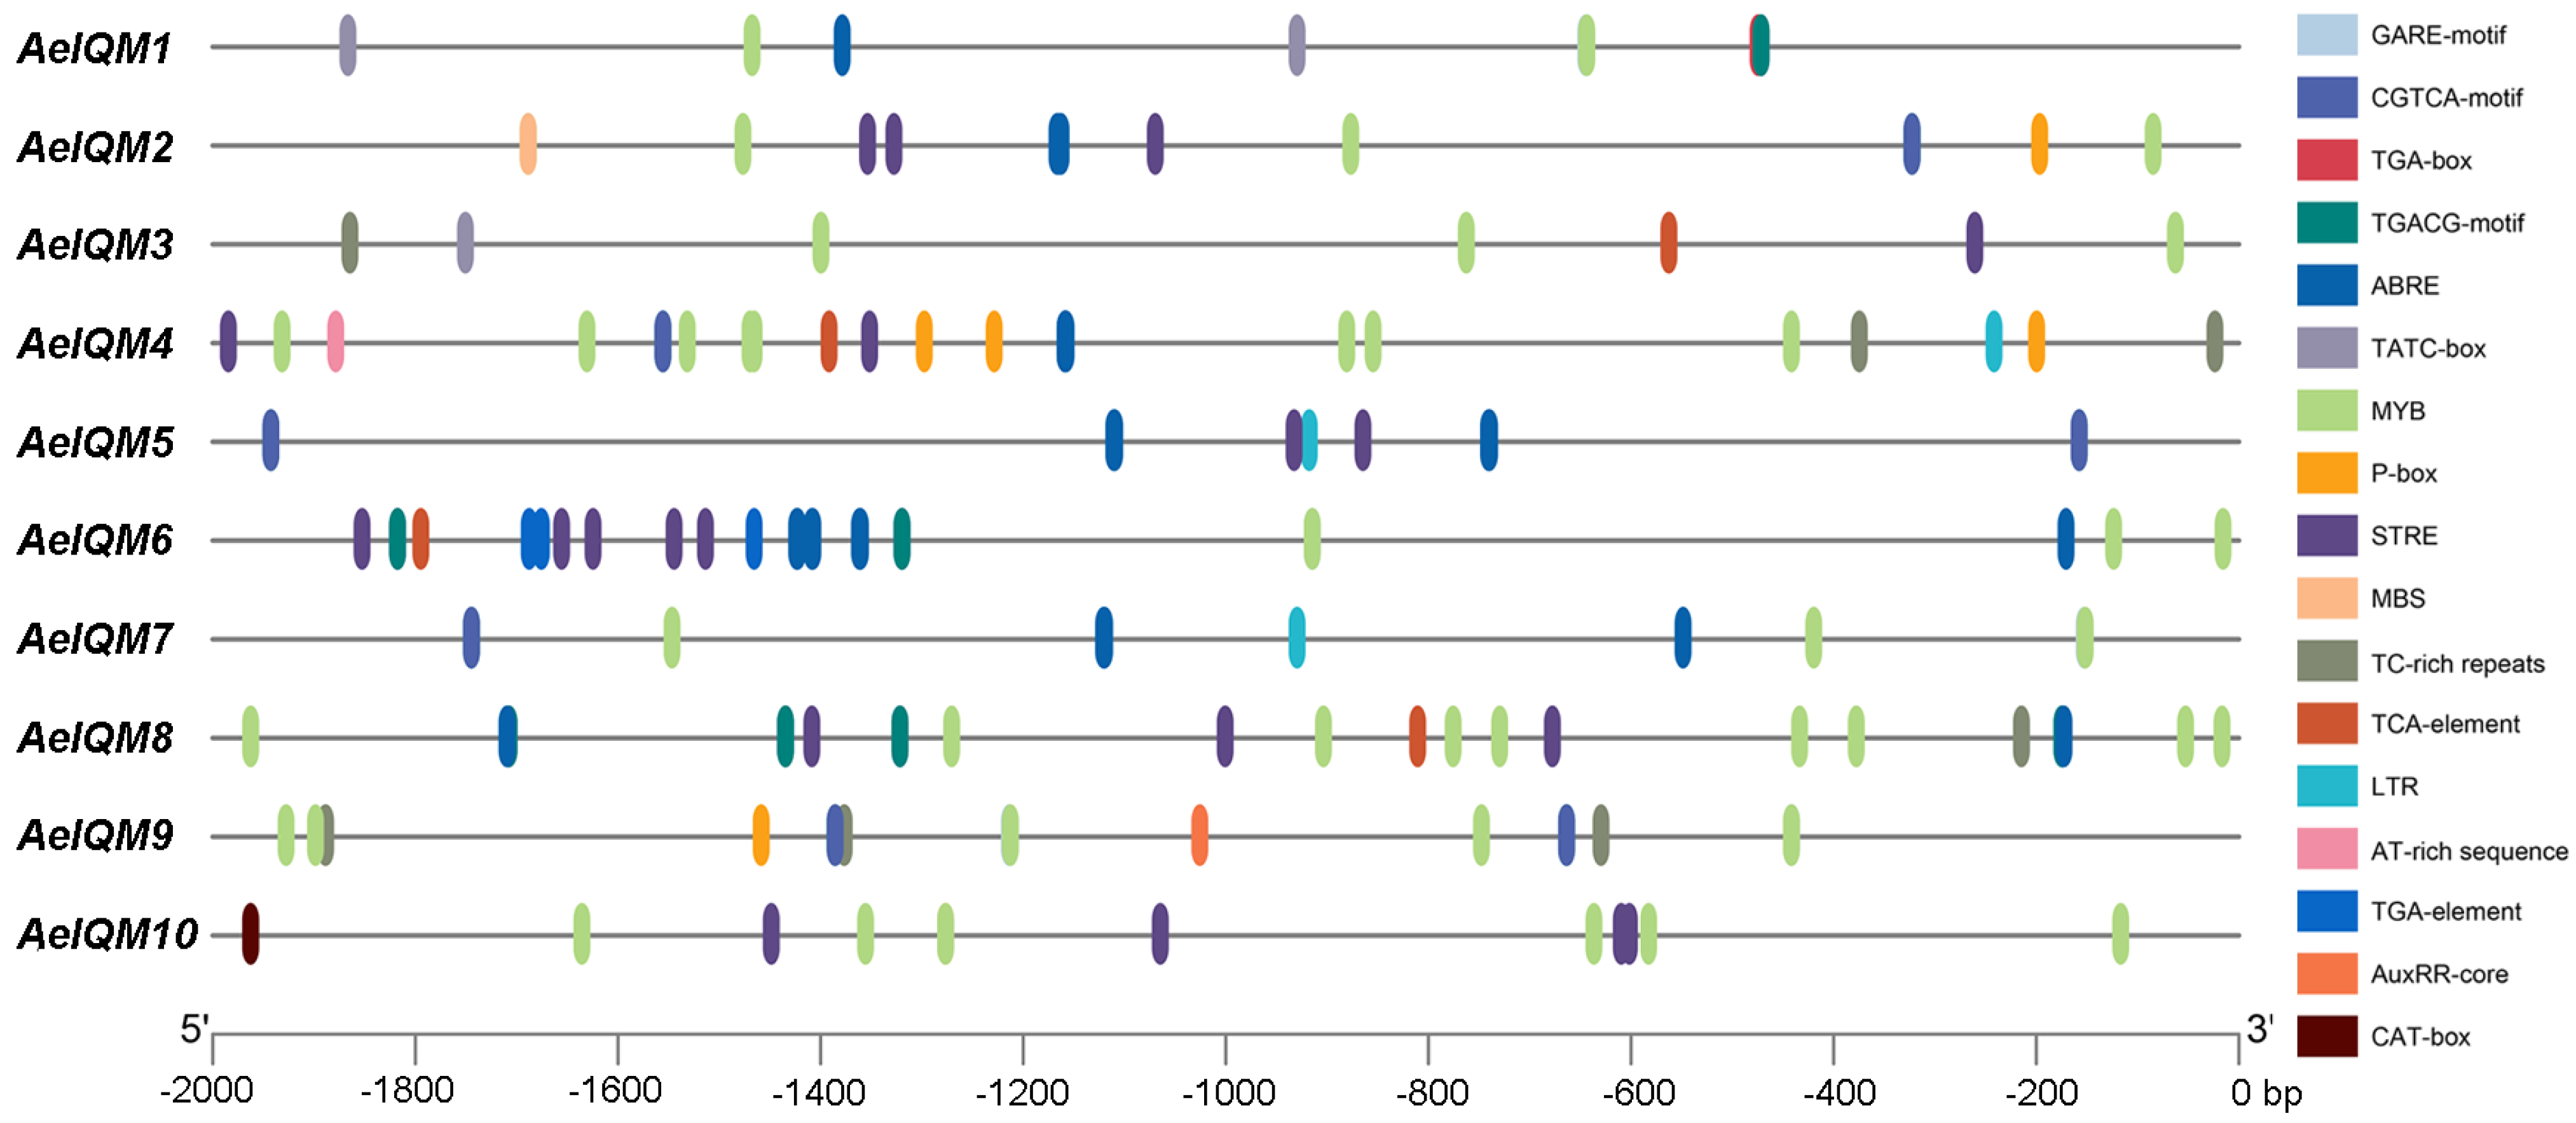
3.4. Analysis of Cis-Acting Elements of AeIQM Gene Promoters

The role of cis-acting elements in gene promoters, including their type and number, is widely recognized in determining gene function. In this study, the promoter of the AeIQM gene in kiwifruit was analyzed. The results showed that the AeIQM gene promoter contains six different classes of cis-acting elements associated with hormonal and stress responses (Figure 5). Figure 5 displays significant variations in the composition and abundance of response elements among the AeIQM genes. Among these elements, defense and stress-responsive elements (LTR, TC-rich repeats, MYB, MBS, and STRE) were the most prevalent, with a total of 75 occurrences. These were followed by MeJA-responsive elements (CGTCA-motif and TGACG-motif), of which there were 28 occurrences. ABA response elements (ABRE) were identified in 25 occurrences, while gibberellin-responsive elements (TATC-box, P-box, and GARE-motif) were observed in 13 occurrences. Auxin-responsive elements (AuxRR-core and TGA-element) were present in five occurrences, whereas salicylic-acid-responsive elements (TCA-element) were found in four occurrences. Furthermore, the number of other cis-elements present in AeIQM genes varied from 7 to 24, with AeIQM4, AeIQM6, and AeIQM8 having 24 cis-elements, while AeIQM3 possessed a minimum of 7 elements. Consequently, different members within the AeIQM gene family may exhibit distinct functions in mediating kiwifruit’s responses to both hormones and abiotic stresses.

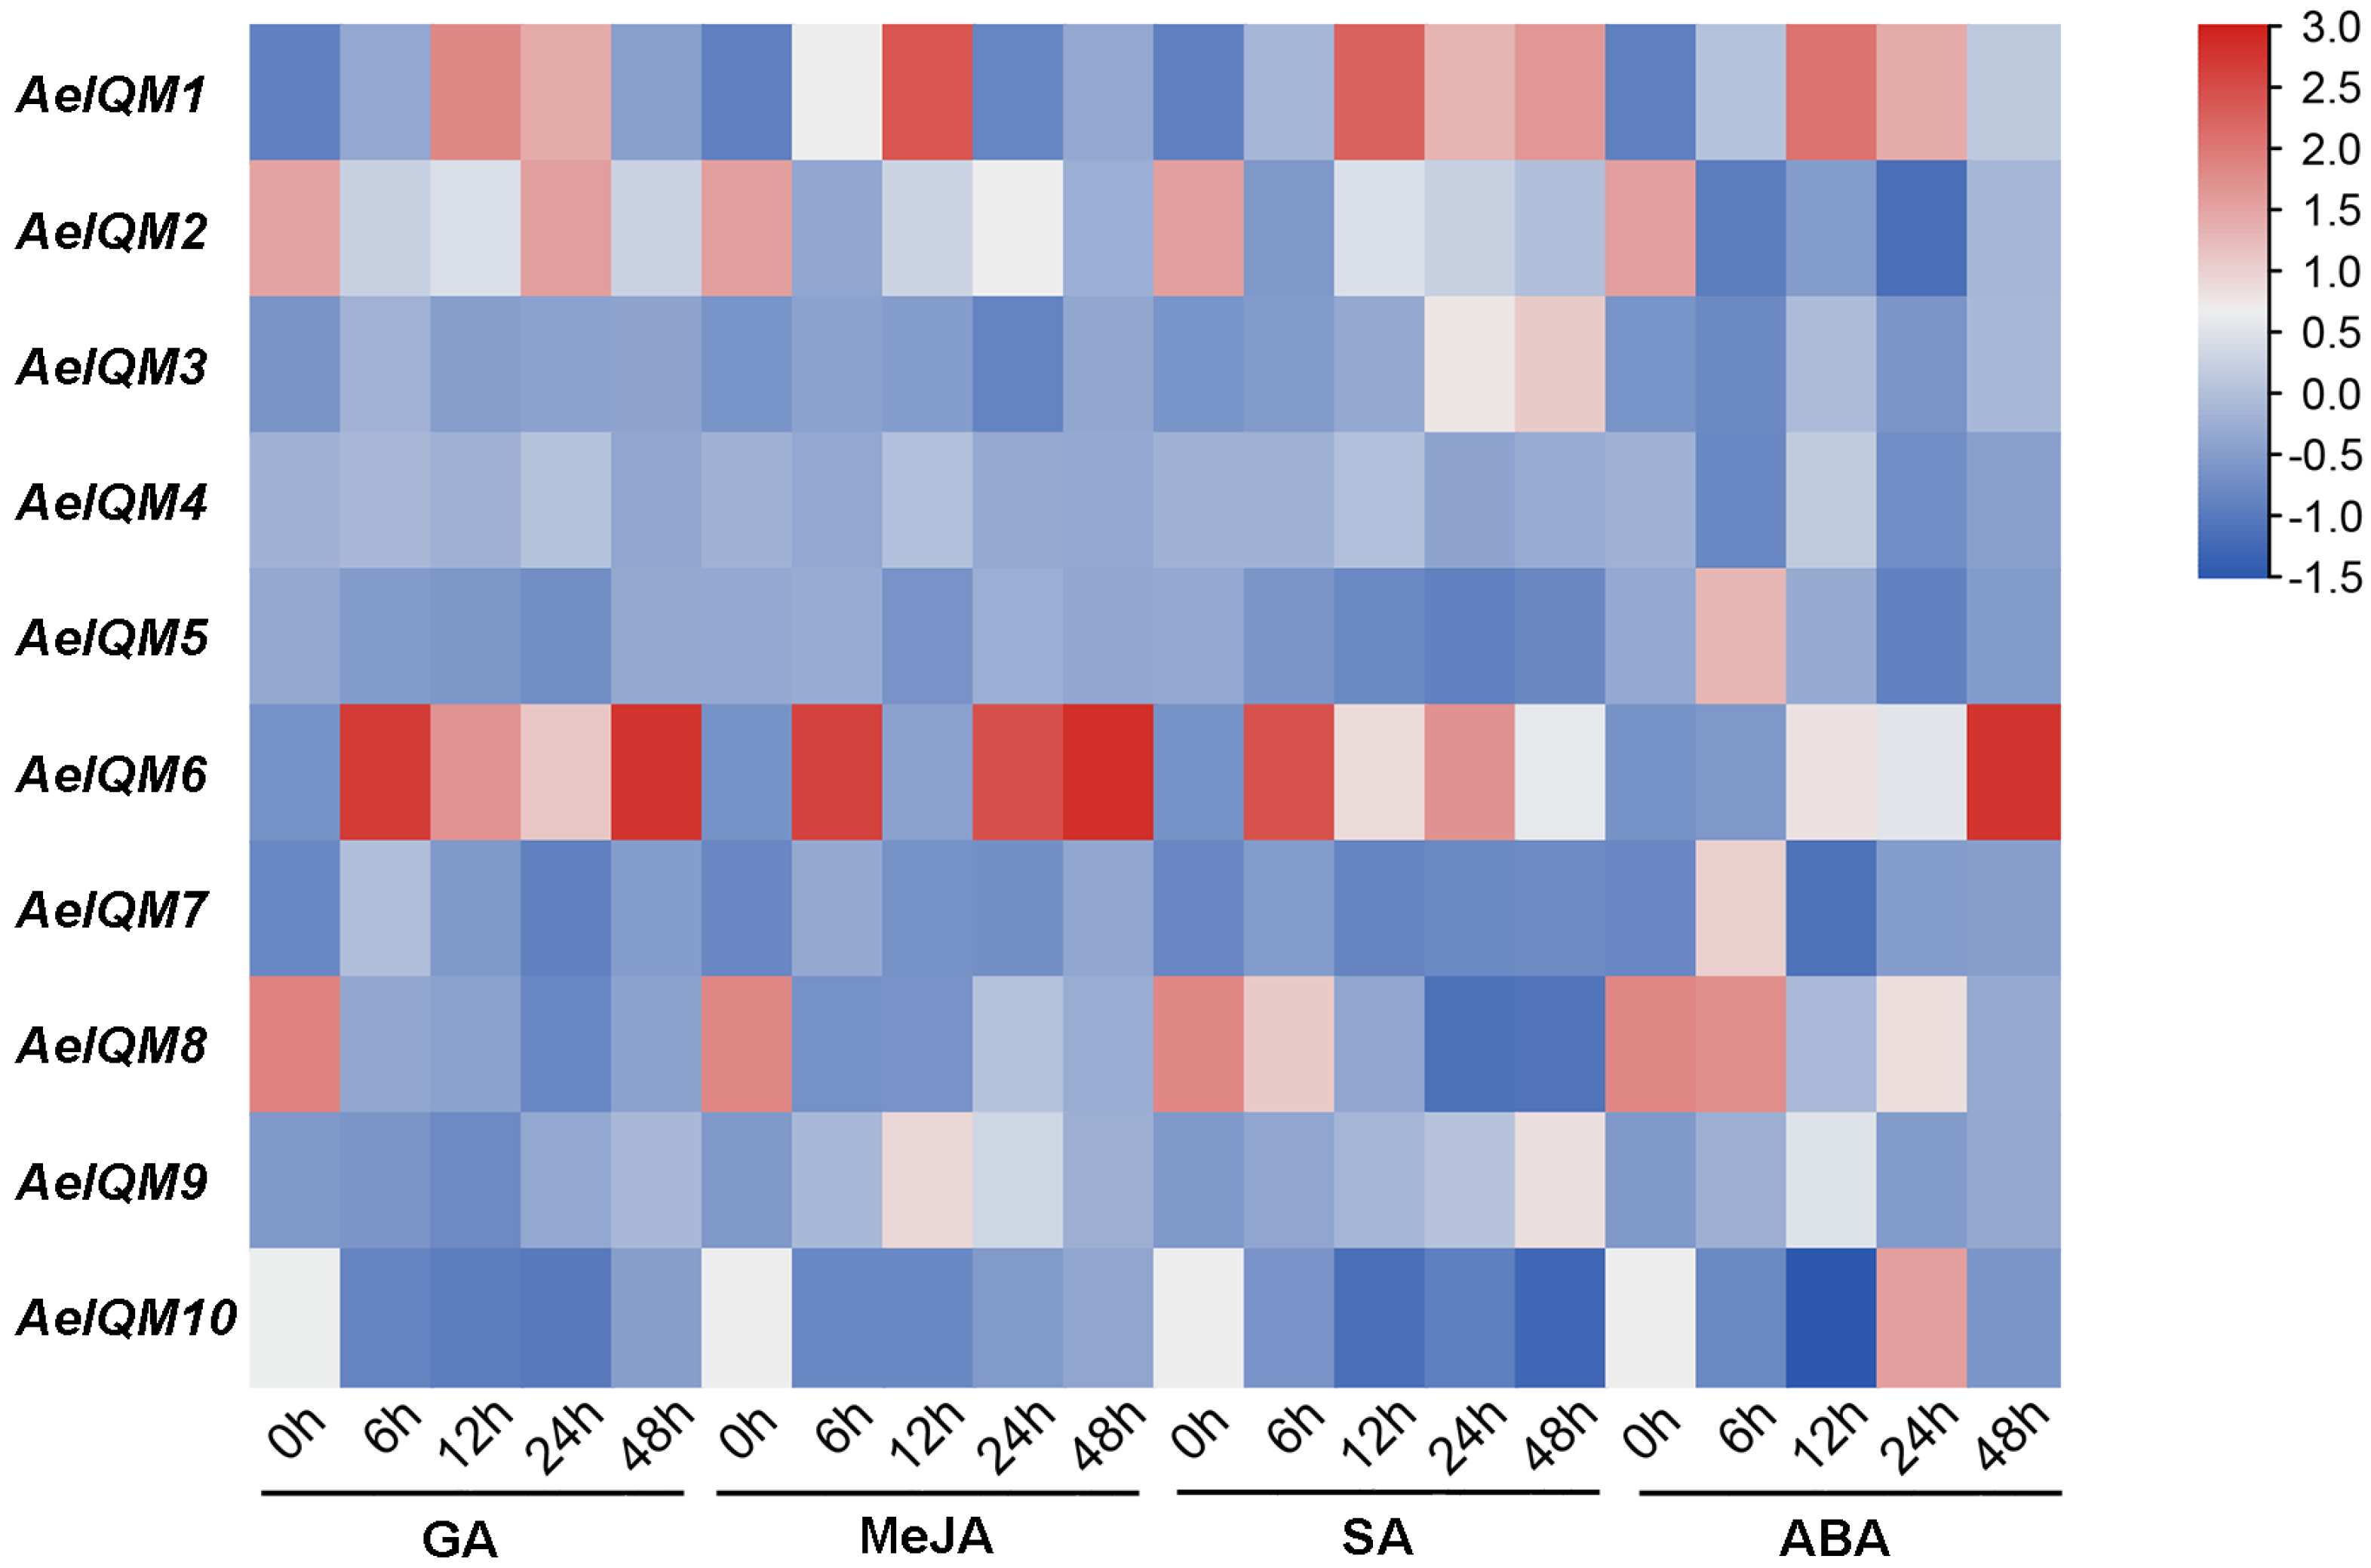
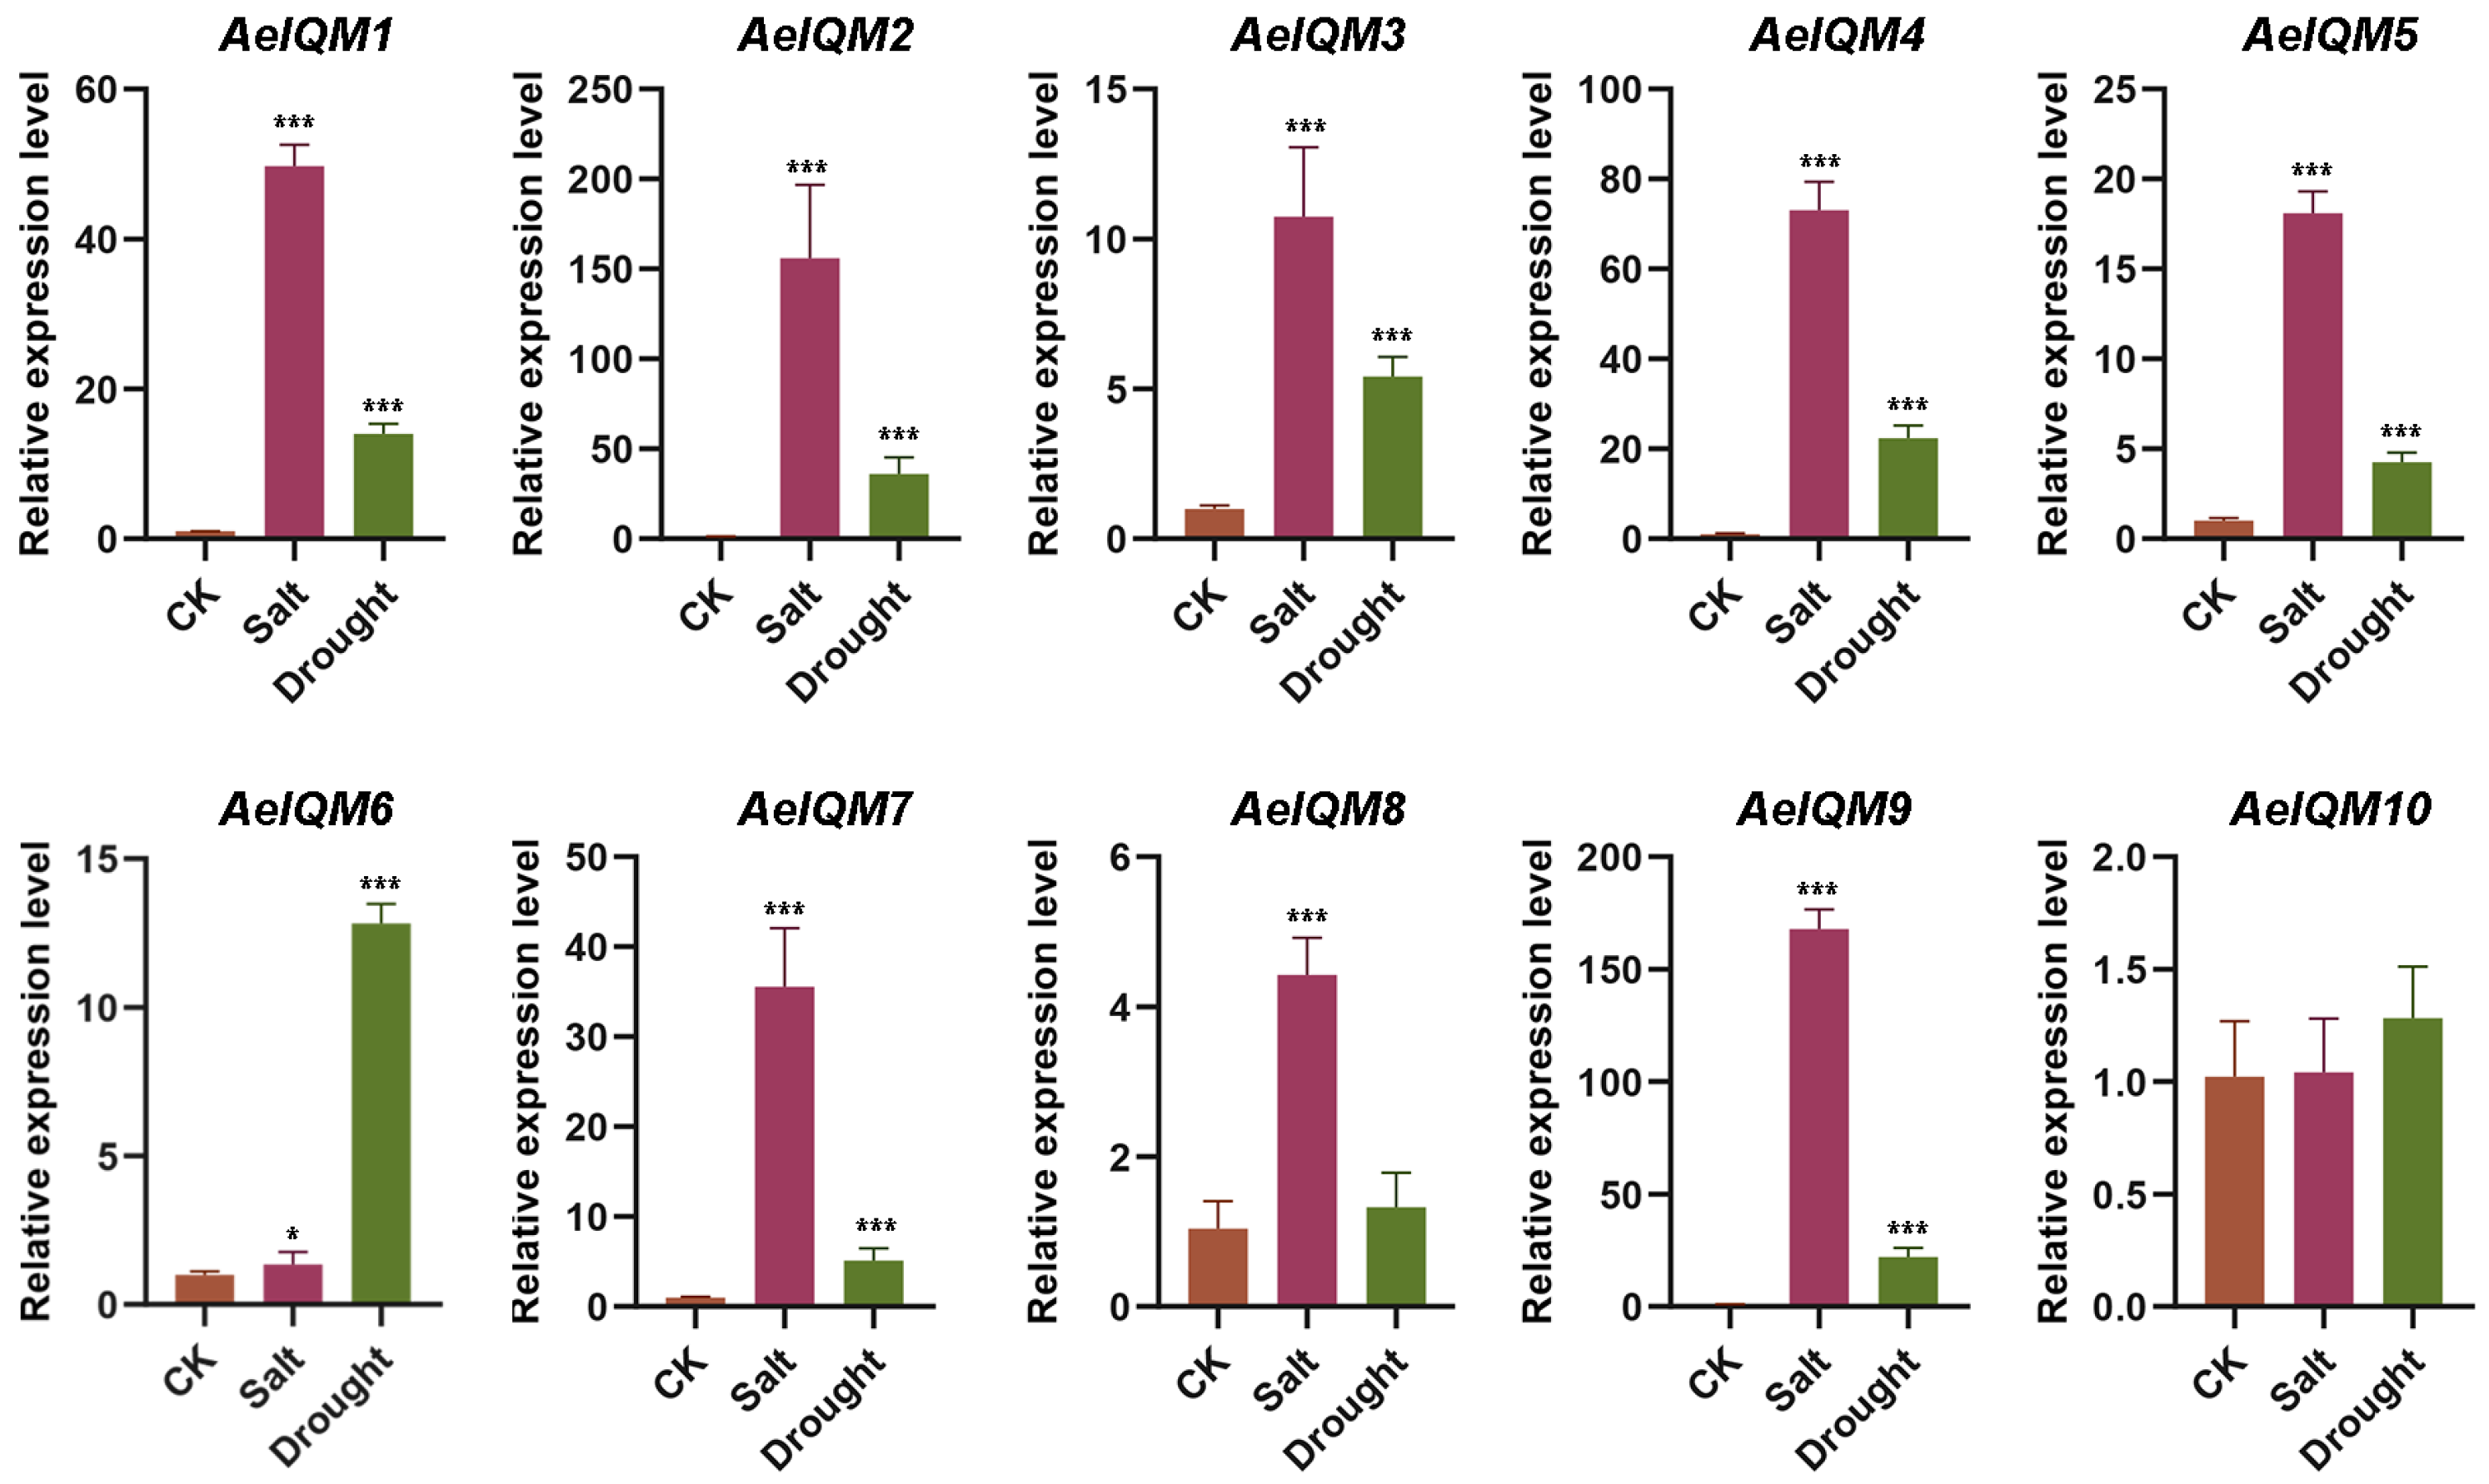
3.5. Effects of Abiotic Stress on AeIQM Gene Expression

Based on the above analysis of cis-acting elements in promoters, it is likely that the regulation of IQM genes in kiwifruit is influenced by hormonal stimuli and abiotic stresses. To further confirm the functionality of the AeIQMs, a series of experiments involving various hormonal treatments (GA, MeJA, SA, and ABA), as well as salt and drought stresses, was conducted on A. eriantha. As depicted in Figure 6, analysis of gene expression profiling revealed that most AeIQM genes were prompted by hormonal treatments. Specifically, after GA treatment, AeIQM1, AeIQM2, AeIQM4, and AeIQM6 exhibited high expression levels, while five AeIQM genes (AeIQM1, 2, 4, 6, 9) were upregulated under JA stress. Apart from AeIQM6 and AeIQM10, the other eight AeIQM genes demonstrated relatively high expression levels following SA stress. Additionally, all AeIQM genes demonstrated responsiveness to ABA stress. Furthermore, certain differences were observed among these genes. For instance, AeIQM1 and AeIQM6 displayed strong expression levels under each hormone treatment. AeIQM3 exhibited an increase in expression only under SA and ABA stress, while AeIQM5’s expression level increased solely under ABA stress.
Except for AeIQM10, all genes demonstrated significant upregulation under salt stress (Figure 7). Likewise, the gene expression patterns observed under drought stress resembled those obtained from salt treatment, except for AeIQM8 (Figure 7). However, it is noteworthy that salt treatment elicited more pronounced alterations in gene transcripts compared to drought treatment. These findings suggest a crucial involvement of specific AeIQM genes in governing the responses to ABA, IAA, MeJA, and high salinity stress in kiwifruit.

3.6. Salt Stress Resistance Analysis of AeIQM Genes in Yeast

To investigate the impact of salt stress on pYES2-AeIQMs yeast cell growth, two groups of yeast cells were assessed: one group harboring empty pYES2 plasmids and the other group harboring pYES2-AeIQM plasmids. Following treatment with NaCl, the growth performance of these yeast cells was evaluated. The findings demonstrated that, under normal conditions, all yeast cells exhibited similar growth rates and thrived well. However, notable differences were observed after NaCl treatment (Figure 8A). In the presence of NaCl, yeast cells transformed with AeIQMs exhibited significantly enhanced growth compared to the control group. Furthermore, to evaluate the survival rates of yeast cells after salt stress, the yeast cells were adjusted to an equal cell density and then cultured in 0.5 M, 1 M, and 2 M NaCl at 30 °C with shaking for 24 h. The results revealed that the amount of yeast decreased with increasing salt concentration. However, it was observed that the number of yeast cells expressing AeIQMs was significantly higher than the control group (Figure 8B). These results imply that AeIQMs confer salinity tolerance to transgenic yeast cells, thereby suggesting their involvement in salinity tolerance mechanisms.

4. Discussion

During the process of evolution, plants have developed diverse physiological mechanisms to effectively combat stress. Notably, previous investigations have highlighted the indispensable role of calcium ions (Ca2+) as a pivotal second messenger in mediating the responses of plants to various environmental stimuli [12,46,47,48]. As key components of plant-specific calcium signaling pathways, IQM genes are believed to play a crucial role in mediating the crosstalk between multiple signaling pathways in the context of plant growth [23,24]. While studies exploring the IQM gene family have been conducted in some species, including rice [22], Arabidopsis [16], and soybean [21], there is currently a dearth of published research about the IQM gene family in kiwifruit. In this study, a comprehensive analysis was conducted to identify and investigate the IQM gene family in kiwifruit. A total of 10 IQM genes were identified, and subsequent bioinformatics approaches were employed to analyze these genes at the whole-genome level. The members of the AeIQM gene family displayed a range of encoded protein lengths, varying from 341 to 632 amino acids. The MW of these proteins was within the range of 38.22 to 71.54 kDa. Interestingly, the majority of the proteins exhibited high theoretical pI, ranging from 7.99 to 9.1. Based on their phylogenetic relationships with IQM proteins from O. sativa and Arabidopsis, these AeIQM genes were categorized into three distinct subfamilies, namely, subfamily I, subfamily II, and subfamily III. Notably, subfamilies I and II contained the most members, with each subfamily comprising nine IQMs, accounting for 37.5% of the total IQM proteins count in kiwifruit, a finding that is consistent with previous reports in other plant species [16,21,22]. Members within the same subfamily exhibited close similarity in terms of phylogenetic relationships (Figure 1), exon–intron structure (Figure 3), and motif distribution (Figure 4), thereby supporting the reliability of the subfamily classification. These results suggest that the AeIQM protein family has undergone relatively conserved evolution and that IQMs within each subfamily may share similar functions. In our study, by comparing the IQM protein sequences of multiple species, the IQM proteins from three distinct subfamilies were further divided into two groups: dicots (Arabidopsis, kiwifruit) and monocots (rice). In addition, 10 AeIQMs from kiwifruit were clustered in the same clade as Arabidopsis, indicating that AeIQM and AtIQM are more closely related than OsIQMs from rice. This also indicates the sequence conservation and significant divergence in monocots and dicots.
In comparison to Arabidopsis, which possesses six members of the IQM gene family, kiwifruit exhibits a significantly larger IQM gene family with a total of ten members. This increase in gene number is a pattern that has already been reported in numerous gene families in kiwifruit. For instance, in A. eriantha, the gene family of growth-regulating factors (GRFs) comprises 26 members, surpassing the 9 members found in Arabidopsis [45]. Similarly, the gene family of heat shock transcription factors (HSFs) consists of 20 members in Arabidopsis and 41 members in kiwifruit [40]. The phenomenon of expanded gene numbers in kiwifruit can be attributed to genome-wide duplication (WGD) events that have occurred in its evolutionary history. WGD, which is a common occurrence in plants, leads to the duplication of gene copies within the genome. Kiwifruit has undergone at least two WGD events, estimated to have taken place approximately 27 and 80 million years ago, leading to the establishment of the duplicated genome [49,50]. The kiwifruit genome has likely experienced a greater expansion of IQM genes in comparison to other species. Our analysis reveals the presence of four paralogous pairs among the ten AeIQM genes, all of which arose from segmental duplication rather than tandem duplication (Table 2). The identified results provide evidence suggesting that segmental duplication has played a prominent role in the extensive evolutionary history of the IQM gene family in kiwifruit. Notably, analysis of the Ka/Ks ratio for all four identified pairs of duplicated genes demonstrated values below 1 (Table 2), indicating the prevalence of purifying selection acting upon these gene pairs [51].
The presence of the IQ motif is crucial for the functional involvement of IQM genes in calcium-signaling processes [23]. Through the utilization of MEME analysis in our study, it was revealed that motif 4, motif 5, and motif 7 were consistently observed across almost all members of the AeIQM gene family, with motif 4 notably containing the IQ motif. Notably, there were variations in the number and distribution of motifs among different AeIQM proteins. For instance, AeIQM2 exhibited the highest number of motifs (motifs 1–15), while AeIQM10 displayed the fewest motifs, comprising only 6 motifs. Furthermore, specific motifs were observed to be exclusive to certain subfamilies. For example, motifs 10 and 13 were identified solely within subfamily I, while motif 12 was absent in subfamily II. Additionally, motif 15 was uniquely present in AeIQM2 and AeIQM4. These observations regarding variations in motif number and distribution among the proteins align with previous research findings [16]. Consequently, it can be postulated that these divergent motifs may contribute to functional divergence among the IQM proteins in kiwifruit.
Previous studies on Arabidopsis have revealed diverse functionalities of AtIQM genes. For instance, AtIQM1 has been demonstrated to regulate stomatal movement by modulating reactive oxygen species (ROS) levels, and it also contributes to plant disease response signaling through the promotion of JA synthesis [23,24]. In contrast, AtIQM4 plays a role in positively regulating seed dormancy and germination by modulating ABA levels [25]. Additionally, AtIQM5 is involved in the regulation of flowering by modulating the transition from the juvenile to the adult phase. Furthermore, it interacts with IAAs, which are key auxin signaling repressors, to promote lateral root and callus formation [26]. However, the functional characterization of IQM genes in kiwifruit remains unexplored, as their specific roles and activities have not yet been elucidated. In the current investigation, we sought to elucidate the functional characteristics of the AeIQM gene promoters by assessing the presence of different types and numbers of cis-acting elements. Phytohormones exert a prominent influence on plant growth regulation and the adaptation of plants to diverse abiotic stresses [7,52,53]. The promoter’s analysis revealed that the AeIQM gene promoter encompasses six distinct categories of cis-acting elements, including IAA, ABA, SA, MeJA, GA, and defense and stress-responsive elements. To further confirm the function of AeIQM genes, we subjected kiwifruit to different hormone stress, salt stress, and drought stress factors. Consequently, all AeIQM genes exhibited significant increases in expression levels in response to hormonal treatments. Particularly, following the application of GA treatment, four AeIQM genes displayed elevated expression levels, whereas, under JA stress, five AeIQM genes were upregulated. Moreover, it was observed that all AeIQM genes possessed the capacity to respond to ABA stress. Except for AeIQM10, all genes demonstrated significant upregulation under salt stress. Likewise, the gene expression patterns observed under drought stress resembled those obtained from salt treatment, except for AeIQM8. However, it is noteworthy that salt treatment elicited more pronounced alterations in gene transcripts compared to drought treatment. These findings suggest a crucial involvement of specific AeIQM genes in governing the responses to ABA, IAA, MeJA, and high salinity stress in kiwifruit. Consequently, the various members within the AeIQM gene family may fulfill unique roles in mediating kiwifruit’s responses to abiotic stresses.
Soil salinization, characterized as a highly detrimental abiotic factor, exerts adverse effects on seed germination, crop growth, and overall productivity [27,31,54]. Salinity stress has proven to be a notable and influential factor that substantially affects kiwifruit quality and yield [27]. The IQM gene family assumes crucial regulatory functions across various aspects of plant growth and adaptation to abiotic stressors. Nevertheless, comprehensive exploration of the IQM gene family’s involvement in kiwifruit’s response to diverse abiotic stresses, particularly salt stress, remains limited. In this study, the data presented in Figure 7 demonstrate the IQM genes can be induced by salt stress, suggesting their potential participation in salt stress response. To further investigate their role in salt stress, we conducted stress experiments in yeast. Under normal conditions, all yeast cells exhibited similar growth rates and thrived well. However, notable differences were observed following exposure to NaCl treatment, as depicted in Figure 8. These findings imply that AeIQMs confer salinity tolerance to transgenic yeast cells, thereby implicating their involvement in mechanisms associated with salinity tolerance.

5. Conclusions

In conclusion, a total of ten AeIQM genes have been successfully identified in kiwifruit and classified into three different subfamilies (I–III). The AeIQM genes are distributed on eight chromosomes, of which four pairs of AeIQM gene duplications are associated with segmental repeat events. These genes exhibit diverse structural features and encompass a range of functions. Specifically, their expression patterns under various hormone treatments indicate that most AeIQM genes can be induced by abiotic stresses such as salt and drought. Furthermore, overexpression of AeIQM in yeast significantly enhances the salt tolerance of yeast. Therefore, the study of AeIQM is considered to be of great significance. The comprehensive analysis of the kiwifruit IQM gene family conducted herein establishes a solid theoretical basis.

Supplementary Materials

The following supporting information can be downloaded at: https://www.mdpi.com/article/10.3390/genes15020147/s1, Table S1: All primers used for qRT-PCR and vector construction.

Author Contributions

Investigation, M.X. and C.L.; data curation, Z.Z. and Y.J.; writing—original draft preparation, M.X.; writing—review and editing, M.X. and X.Z.; funding acquisition, X.Z. All authors have read and agreed to the published version of the manuscript.

Funding

This research was funded by the Anhui Provincial Natural Science Foundation (2308085MC73).

Institutional Review Board Statement

The study did not require ethical approval.

Informed Consent Statement

Not applicable.

Data Availability Statement

All data are displayed in the manuscript and Supplementary File.

Conflicts of Interest

The authors declare no conflicts of interest.

References

  1. Zhu, J.-K. Abiotic stress signaling and responses in plants. Cell 2016, 167, 313–324. [Google Scholar] [CrossRef] [PubMed]
  2. Liang, W.; Ma, X.; Wan, P.; Liu, L. Plant salt-tolerance mechanism: A review. Biochem. Biophys. Res. Commun. 2018, 495, 286–291. [Google Scholar] [CrossRef]
  3. Bartels, D.; Sunkar, R. Drought and salt tolerance in plants. CRC Crit. Rev. Plant Sci. 2005, 24, 23–58. [Google Scholar] [CrossRef]
  4. Hu, S.; Ding, Y.; Zhu, C. Sensitivity and responses of chloroplasts to heat stress in plants. Front. Plant Sci. 2020, 11, 375. [Google Scholar] [CrossRef] [PubMed]
  5. Manasa, S.; Lekshmi; Planography, M.; Panigrahi, K.C.S.; Rout, G.R. Overview of cold stress regulation in plants. Bot. Rev. 2022, 88, 359–387. [Google Scholar] [CrossRef]
  6. Gong, Z.; Xiong, L.; Shi, H.; Yang, S.; Herrera-Estrella, L.R.; Xu, G.; Chao, D.-Y.; Li, J.; Wang, P.Y.; Qin, F.; et al. Plant abiotic stress response and nutrient use efficiency. Sci. China Life Sci. 2020, 63, 635–674. [Google Scholar] [CrossRef]
  7. Mustafin, Z.S.; Zamyatin, V.I.; Konstantinov, D.K.; Doroshkov, A.V.; Lashin, S.A.; Afonnikov, D.A. Phylostratigraphic analysis shows the earliest origination of the abiotic stress associated genes in A. thaliana. Genes 2019, 10, 963. [Google Scholar] [CrossRef] [PubMed]
  8. Gill, S.S.; Tuteja, N. Reactive oxygen species and antioxidant machinery in abiotic stress tolerance in crop plants. Plant Physiol. Biochem. 2010, 48, 909–930. [Google Scholar] [CrossRef]
  9. Aldon, D.; Mbengue, M.; Mazars, C.; Galaud, J.-P. Calcium signalling in plant biotic interactions. Int. J. Mol. Sci. 2018, 19, 665. [Google Scholar] [CrossRef]
  10. Hu, W.; Yan, Y.; Tie, W.; Ding, Z.; Wu, C.; Ding, X.; Wang, W.; Xia, Z.; Guo, J.; Peng, M. Genome-wide analyses of calcium sensors reveal their involvement in drought stress response and storage roots deterioration after harvest in Cassava. Genes 2018, 9, 221. [Google Scholar] [CrossRef]
  11. Carafoli, E.; Krebs, J. Why calcium? How calcium became the best communicator. J. Biol. Chem. 2016, 291, 20849–20857. [Google Scholar] [CrossRef] [PubMed]
  12. Hetherington, A.M.; Brownlee, C. The generation of Ca2+ signals in plants. Annu. Rev. Plant Biol. 2004, 55, 401–427. [Google Scholar] [CrossRef] [PubMed]
  13. Chin, D.; Means, A.R. Calmodulin: A prototypical calcium sensor. Trends Cell Biol. 2000, 10, 322–328. [Google Scholar] [CrossRef] [PubMed]
  14. DeFalco, T.A.; Bender, K.W.; Snedden, W.A. Breaking the code: Ca2+ sensors in plant signalling. Biochem. J. 2009, 425, 27–40. [Google Scholar] [CrossRef]
  15. Yang, T.; Poovaiah, B.W. Calcium/calmodulin-mediated signal network in plants. Trends Plant Sci. 2003, 8, 505–512. [Google Scholar] [CrossRef]
  16. Zhou, Y.; Chen, Y.; Yamamoto, K.T.; Duan, J.; Tian, C.-E. Sequence and expression analysis of the Arabidopsis IQM family. Acta Physiol. Plant. 2010, 32, 191–198. [Google Scholar] [CrossRef]
  17. Abel, S.; Savchenko, T.; Levy, M. Genome-wide comparative analysis of the IQD gene families in Arabidopsis thaliana and Oryza sativa. BMC Evol. Biol. 2005, 5, 72. [Google Scholar] [CrossRef]
  18. Talke, I.N.; Blaudez, D.; Maathuis, F.J.M.; Sanders, D. CNGCs: Prime targets of plant cyclic nucleotide signalling? Trends Plant Sci. 2003, 8, 286–293. [Google Scholar] [CrossRef]
  19. Bouché, N.; Scharlat, A.; Snedden, W.; Bouchez, D.; Fromm, H. A novel family of calmodulin-binding transcription activators in multicellular organisms. J. Biol. Chem. 2002, 277, 21851–21861. [Google Scholar] [CrossRef]
  20. Reddy, A.S.N.; Day, I.S. Analysis of the myosins encoded in the recently completed Arabidopsis thaliana genome sequence. Genome Biol. 2001, 2, research0024. [Google Scholar] [CrossRef]
  21. Lv, T.; Liu, Q.; Xiao, H.; Fan, T.; Zhou, Y.; Wang, J.; Tian, C.-e. Genome-wide identification and analysis of the IQM gene family in soybean. Front. Plant Sci. 2023, 13, 1093589. [Google Scholar] [CrossRef]
  22. Fan, T.; Lv, T.; Xie, C.; Zhou, Y.; Tian, C. Genome-wide analysis of the IQM gene family in rice (Oryza sativa L.). Plants 2021, 10, 1949. [Google Scholar] [CrossRef] [PubMed]
  23. Zhou, Y.-P.; Duan, J.; Fujibe, T.; Yamamoto, K.T.; Tian, C.-E. AtIQM1, a novel calmodulin-binding protein, is involved in stomatal movement in Arabidopsis. Plant Mol. Biol. 2012, 79, 333–346. [Google Scholar] [CrossRef] [PubMed]
  24. Lv, T.; Li, X.; Fan, T.; Luo, H.; Xie, C.; Zhou, Y.; Tian, C.E. The calmodulin-binding protein IQM1 interacts with CATALASE2 to affect pathogen defense. Plant Physiol. 2019, 181, 1314–1327. [Google Scholar] [CrossRef] [PubMed]
  25. Zhou, Y.P.; Wu, J.H.; Xiao, W.H.; Chen, W.; Chen, Q.H.; Fan, T.; Xie, C.P.; Tian, C.-E. Arabidopsis IQM4, a novel calmodulin-binding protein, is involved with seed dormancy and germination in Arabidopsis. Front. Plant Sci. 2018, 9, 721. [Google Scholar] [CrossRef]
  26. Gong, L.-P.; Cheng, J.-Z.; Zhou, Y.-P.; Huang, X.-L.; Tian, C.-E. Disruption of IQM5 delays flowering possibly through modulating the juvenile-to-adult transition. Acta Physiol. Plant. 2016, 39, 21. [Google Scholar] [CrossRef]
  27. Chartzoulakis, K.S.; Therios, I.N.; Misopolinos, N.D.; Noitsakis, B.I. Growth, ion content and photosynthetic performance of salt-stressed kiwifruit plants. Irrig. Sci. 1995, 16, 23–28. [Google Scholar] [CrossRef]
  28. Sotiropoulos, T.E.; Therios, I.N.; Dimassi, K.N. Uptake of boron by kiwifruit plants under various levels of shading and salinity. J. Plant Nutr. 2005, 27, 1979–1989. [Google Scholar] [CrossRef]
  29. Klages, K.; Boldingh, H.; Smith, G.S. Accumulation of myo-inositol in Actinidia seedlings subjected to salt stress. Ann. Bot. 1999, 84, 521–527. [Google Scholar] [CrossRef]
  30. Zhong, Y.P.; Qi, X.-J.; Chen, J.-Y.; Li, Z.; Bai, D.-F.; Wei, C.-G.; Fang, J.-B. Growth and physiological responses of four kiwifruit genotypes to salt stress and resistance evaluation. J. Integr. Agric. 2019, 18, 83–95. [Google Scholar] [CrossRef]
  31. Abid, M.; Zhang, Y.J.; Li, Z.; Bai, D.F.; Zhong, Y.P.; Fang, J.B. Effect of salt stress on growth, physiological and biochemical characters of four kiwifruit genotypes. Sci. Hortic. 2020, 271, 109473. [Google Scholar] [CrossRef]
  32. Goodstein, D.M.; Shu, S.; Howson, R.; Neupane, R.; Hayes, R.D.; Fazo, J.; Mitros, T.; Dirks, W.; Hellsten, U.; Putnam, N.; et al. Phytozome: A comparative platform for green plant genomics. Nucleic Acids Res. 2012, 40, D1178–D1186. [Google Scholar] [CrossRef] [PubMed]
  33. Lei, B.; Song, M.; Li, X.; Dang, X.; Qin, R.; Zhu, S.; An, X.; Liu, Q.; Yao, X.; Nie, Y.; et al. SMART v1.0: A database for small molecules with functional implications in plants. Interdiscip. Sci. 2022, 14, 279–283. [Google Scholar] [CrossRef] [PubMed]
  34. Mistry, J.; Chuguransky, S.; Williams, L.; Qureshi, M.; Salazar, G.A.; Sonnhammer, E.L.L.; Tosatto, S.C.E.; Paladin, L.; Raj, S.; Richardson, L.J.; et al. Pfam: The protein families database in 2021. Nucleic Acids Res. 2021, 49, D412–D419. [Google Scholar] [CrossRef] [PubMed]
  35. Duvaud, S.; Gabella, C.; Lisacek, F.; Stockinger, H.; Ioannidis, V.; Durinx, C. Expasy, the Swiss bioinformatics resource portal, as designed by its users. Nucleic Acids Res. 2021, 49, W216–W227. [Google Scholar] [CrossRef] [PubMed]
  36. Tamura, K.; Stecher, G.; Kumar, S. MEGA11: Molecular evolutionary genetics analysis version 11. Mol. Biol. Evol. 2021, 38, 3022–3027. [Google Scholar] [CrossRef] [PubMed]
  37. Chen, C.; Chen, H.; Zhang, Y.; Thomas, H.R.; Frank, M.H.; He, Y.; Xia, R. TBtools: An integrative toolkit developed for interactive analyses of big biological data. Mole. Plant 2020, 13, 1194–1202. [Google Scholar] [CrossRef]
  38. Wang, Y.; Tang, H.; DeBarry, J.D.; Tan, X.; Li, J.; Wang, X.; Lee, T.-h.; Jin, H.; Marler, B.; Guo, H.; et al. MCScanX: A toolkit for detection and evolutionary analysis of gene synteny and collinearity. Nucleic Acids Res. 2012, 40, e49. [Google Scholar] [CrossRef]
  39. Bailey, T.L.; Williams, N.; Misleh, C.; Li, W.W. MEME: Discovering and analyzing DNA and protein sequence motifs. Nucleic Acids Res. 2006, 34, W369–W373. [Google Scholar] [CrossRef]
  40. Ling, C.; Liu, Y.; Yang, Z.; Xu, J.; Ouyang, Z.; Yang, J.; Wang, S. Genome-wide identification of HSF gene family in kiwifruit and the function of AeHSFA2b in salt tolerance. Int. J. Mol. Sci. 2023, 24, 15638. [Google Scholar] [CrossRef]
  41. Livak, K.J.; Schmittgen, T.D. Analysis of relative gene expression data using real-time quantitative PCR and the 2−ΔΔCT method. Methods 2001, 25, 402–408. [Google Scholar] [CrossRef] [PubMed]
  42. Flagel, L.E.; Wendel, J.F. Gene duplication and evolutionary novelty in plants. New Phytol. 2009, 183, 557–564. [Google Scholar] [CrossRef] [PubMed]
  43. Panchy, N.; Lehti-Shiu, M.; Shiu, S.-H. Evolution of gene duplication in plants. Plant Physiol. 2016, 171, 2294–2316. [Google Scholar] [CrossRef] [PubMed]
  44. Yang, J.; Ling, C.; Liu, Y.; Zhang, H.; Hussain, Q.; Lyu, S.; Wang, S.; Liu, Y. Genome-wide expression profiling analysis of kiwifruit GolS and RFS genes and identification of AcRFS4 function in raffinose accumulation. Int. J. Mol. Sci. 2022, 23, 8836. [Google Scholar] [CrossRef]
  45. Abid, M.; Wang, Z.; Feng, C.; Luo, J.; Zhang, Y.; Tu, J.; Cai, X.; Gao, P. Genome-wide identification and structural characterization of growth-regulating factors (GRFs) in Actinida eriantha and Actinidia chinensis. Plants 2022, 11, 1633. [Google Scholar] [CrossRef]
  46. Pandey, G.K.; Cheong, Y.H.; Kim, K.N.; Grant, J.J.; Li, L.; Hung, W.; D’Angelo, C.; Weinl, S.; Kudla, J.; Luan, S. The calcium sensor calcineurin B-like 9 modulates abscisic acid sensitivity and biosynthesis in Arabidopsis. Plant Cell 2004, 16, 1912–1924. [Google Scholar] [CrossRef]
  47. Dodd, A.N.; Kudla, J.; Sanders, D. The language of calcium signaling. Annu. Rev. Plant Biol. 2010, 61, 593–620. [Google Scholar] [CrossRef]
  48. Yuan, F.; Yang, H.; Xue, Y.; Kong, D.; Ye, R.; Li, C.; Zhang, J.; Theprungsirikul, L.; Shrift, T.; Krichilsky, B.; et al. OSCA1 mediates osmotic-stress-evoked Ca2+ increases vital for osmosensing in Arabidopsis. Nature 2014, 514, 367–371. [Google Scholar] [CrossRef]
  49. Huang, S.; Ding, J.; Deng, D.; Tang, W.; Sun, H.; Liu, D.; Zhang, L.; Niu, X.; Zhang, X.; Meng, M.; et al. Draft genome of the kiwifruit Actinidia chinensis. Nat. Commun. 2013, 4, 2640. [Google Scholar] [CrossRef]
  50. Wang, J.-P.; Yu, J.-G.; Li, J.; Sun, P.-C.; Wang, L.; Yuan, J.-Q.; Meng, F.-B.; Sun, S.-R.; Li, Y.-X.; Lei, T.-Y.; et al. Two likely auto-tetraploidization events shaped kiwifruit genome and contributed to establishment of the actinidiaceae family. iScience 2018, 7, 230–240. [Google Scholar] [CrossRef]
  51. Hurst, L.D. The Ka/Ks ratio: Diagnosing the form of sequence evolution. Trends Genet. 2002, 18, 486–487. [Google Scholar] [CrossRef] [PubMed]
  52. Wani, S.H.; Kumar, V.; Shriram, V.; Sah, S.K. Phytohormones and their metabolic engineering for abiotic stress tolerance in crop plants. Crop J. 2016, 4, 162–176. [Google Scholar] [CrossRef]
  53. Kohli, A.; Sreenivasulu, N.; Lakshmanan, P.; Kumar, P.P. The phytohormone crosstalk paradigm takes center stage in understanding how plants respond to abiotic stresses. Plant Cell Rep. 2013, 32, 945–957. [Google Scholar] [CrossRef] [PubMed]
  54. Zhao, C.; Zhang, H.; Song, C.; Zhu, J.K.; Shabala, S. Mechanisms of plant responses and adaptation to soil salinity. Innovation 2020, 1, 100017. [Google Scholar] [CrossRef]
Figure 1. Phylogenetic analysis of proteins from A. eriantha (AeIQMs), O. sativa (OsIQMs), and A. thaliana (AtIQMs). The construction of the tree employed the neighbor-joining method with 1000 bootstrap replicates using MEGA11.0. Node reliability, based on 1000 bootstrap verifications, is represented by the numbers on the branches. Classification results are indicated by different colors: green—subfamily (I); orange—subfamily (II); blue—subfamily (III). To differentiate IQM proteins from the same species, distinctive geometric patterns were implemented: circle—A. thaliana; wye—O. sativa; square—A. eriantha.
Genes 15 00147 g001
Figure 2. Chromosomal distribution and segmental duplication events of IQM genes in kiwifruit. Ten AeIQM genes are mapped to eight chromosomes. The duplicated paralogous pairs of AeIQM genes are connected with lines. Each chromosome is labeled with its respective numeric identifier displayed at the top. The length of each chromosome is represented on the left scale, measured in megabases (Mb).
Genes 15 00147 g002
Figure 3. Phylogenetic relationships and gene structures of AeIQM genes. The unrooted phylogenetic tree of AeIQM proteins was constructed using the NJ method with 1000 bootstrap replicates. The CDS and untranslated regions (UTRs) are visually represented by yellow and blue boxes, respectively, while black lines indicate the introns. The scale provided at the bottom facilitates the estimation of the size of each IQM gene.
Genes 15 00147 g003
Figure 4. The distribution of motifs in AeIQM proteins. The identification of motifs was performed using the online MEME program. Each motif is denoted by a distinct colored box, with its assigned serial number positioned in the center of the box. The location of the IQ motif is indicated by an arrow positioned above the diagram, while the amino acid sequence of the IQ motif is depicted in the red box in the diagram.
Genes 15 00147 g004
Figure 5. The cis-acting elements in the promoter sequences located 2000 bp upstream of AeIQM genes, which were predicted using PlantCARE. Distinct cis-acting elements are visualized through the utilization of various colored rectangles.
Genes 15 00147 g005
Figure 6. Expression profile of AeIQM genes under different hormone treatments. The expression levels of AeIQM genes in leaf tissues under different hormone treatments were analyzed via real-time quantitative PCR, with three biological and technical replicates. The resulting data were visualized in a heat map format using TBtools software. The color bar located to the right of the Figure represents the relative signal intensity values.
Genes 15 00147 g006
Figure 7. Expression levels of AeIQM genes under salt and drought stress. Three biological and technical replicates were used to calculate the error bars. Asterisks are used to indicate significant upregulation of the corresponding genes as determined by a t-test analysis (* p < 0.05, *** p < 0.001).
Genes 15 00147 g007
Figure 8. The growth activity of INVSC1 (pYES2) and INVSC1(pYES2-AeIQM) under salt treatment. (A) The growth of yeast cells under stress conditions. The yeast cells were adjusted to an equal cell density and then treated with 2.0 M NaCl for 6 h. A volume of 2.0 μL of yeast cells was spotted onto solid SG-Ura medium supplemented with 2.0 M NaCl, followed by incubation at 30 °C for 3 days. The growth of yeast cells was assessed based on the observed phenotypes. (B) The survival rates of yeast cells after salt stress. The yeast cells were adjusted to an equal cell density and then cultured in 0.5 M, 1 M, and 2 M NaCl at 30 °C with shaking for 24 h. The cell densities were measured following each treatment. Asterisks were used to indicate significant upregulation of the corresponding genes as determined by a t-test analysis (* p < 0.05, ** p < 0.01).
Genes 15 00147 g008
Table 1. The information on AeIQM genes identified in kiwifruit (A. eriantha).
NameGene IDChr.Location CoordinatesCDS
Length (bp)
Protein
Length (aa)
Molecular
Weight (kDa)
pI
AeIQM1DTZ79_20g03230Chr204097436–4101769 (−)144648153.968.57
AeIQM2DTZ79_20g13100Chr2019923399–19926174 (+)164454761.588.39
AeIQM3DTZ79_25g04840Chr2513677555–13681914 (−)157252358.308.70
AeIQM4DTZ79_12g01010Chr121370000–1372833 (−)146748854.249.10
AeIQM5DTZ79_26g12800Chr2620764403–20767307 (+)189963271.546.98
AeIQM6DTZ79_12g06920Chr129544437–9549067 (−)150350056.056.63
AeIQM7DTZ79_28g12820Chr2819031981–19034869 (+)180660168.158.71
AeIQM8DTZ79_18g12720Chr1822944547–22948694 (+)101733839.157.99
AeIQM9DTZ79_09g03830Chr094394286–4398402 (−)132043950.555.32
AeIQM10DTZ79_22g10670Chr2220117392–20121676 (+)102634138.228.98
Table 2. The divergence between paralogous IQM gene pairs in kiwifruit.
NO.Paralogous PairsKaKsKa/KsDuplicate Type
1AeIQM1–AeIQM30.0816806380.2098791710.389179342Segmental duplication
2AeIQM2–AeIQM40.0517406680.1523385580.339642625Segmental duplication
3AeIQM7–AeIQM90.4121845261.8155572590.227029208Segmental duplication
4AeIQM8–AeIQM100.1526496130.2108816970.723863739Segmental duplication
Disclaimer/Publisher’s Note: The statements, opinions and data contained in all publications are solely those of the individual author(s) and contributor(s) and not of MDPI and/or the editor(s). MDPI and/or the editor(s) disclaim responsibility for any injury to people or property resulting from any ideas, methods, instructions or products referred to in the content.

