1. Introduction
Hepatocellular carcinoma (HCC) is a common malignant tumor of the digestive system. Its occurrence and development are complex processes involving multiple factors, steps, and stages. According to the latest statistics, HCC ranks second in the mortality rate of tumor-related diseases in China [
1]. HCC is characterized by its insidious onset, high malignancy, rapid progression, and poor prognosis, posing a serious threat to the lives and health of the Chinese population and even the global population. It has become an urgent and significant public health issue in need of a solution.
Antisense RNA is a widely existing endogenous regulatory RNA in humans and mice [
1,
2]. It is also known as natural antisense transcripts (NATs). By forming double-stranded RNA (dsRNA) with sense transcripts (STs), it regulates the levels of mRNA and plays an important role in regulation [
3]. Many NATs, or antisense RNA, are classified as long non-coding RNA (lncRNA) [
4]. The study by Gao et al. discovered that the lncRNA HOTAIR is aberrantly expressed in tumors [
5]. Interaction with the PRC2 or LSD1 protein complex induces the demethylation of histone H3K4me2 in tumor-associated genes at the gene level, thereby promoting malignant proliferation, suppressing apoptosis, and facilitating metastasis of tumor cells. Overall, antisense RNA regulates important events such as the growth, apoptosis, and migration of tumor cells by affecting the expression of sense genes [
6,
7]. However, little is known about the role and molecular mechanisms of antisense RNA in the occurrence and development of tumors.
In recent years, the important role of activation of oncogenes and inactivation of tumor suppressor genes in the process of tumor development has gradually been revealed. Among them, the inactivation of tumor suppressor genes mainly occurs through three pathways: gene abnormal methylation changes, gene deletion, and gene mutation. Modern tumor theory suggests that at the genetic level, the formation of tumors can be explained by genetic and epigenetic mechanisms. The oncogene Neuroblastoma ras sarcoma homolog (NRAS) is located on human chromosome 1 and is an important member of the ras sarcoma (RAS) family of proto-oncogenes. It belongs to the small GTPase protein family. NRAS gene mutations are common in various tumor diseases, such as multiple myeloma, subcutaneous melanoma, colorectal cancer, and adult acute myeloid leukemia (AML), and play an important role in the occurrence and development of these tumors [
8,
9].
Research has reported the occurrence of NRAS mutations in adult patients with acute myeloid leukemia (AML). According to the FAB (France, American, Britain) classification, these mutations are mainly observed in the M5 subtype, and patients have shown improved survival rates after initial induction therapy [
10]. Chen et al. found that upregulating NRAS expression by relieving its inhibition activates the MAPK signaling pathway, promoting melanoma cell proliferation, inhibiting apoptosis, and facilitating cell migration and invasion [
11]. In colorectal cancer, the mutation rate of KRAS reaches 40–50%, while the mutation rate of NRAS is approximately 5–9%. Studies have found that tumors with NRAS mutations exhibit resistance to EGFR treatment [
12]. Therefore, NRAS can regulate the growth, migration, invasion, and other activities of tumor cells through multiple pathways, including the activation of PI3K/AKT and NF-κB signaling pathways [
13]. Although the role of NRAS has been extensively studied in various malignant tumor diseases, research on its role in the occurrence and development of HCC is relatively scarce.
It is known that epigenetic modifications play a crucial role in the occurrence and development of HCC. As a key epigenetic regulatory method, DNA methylation often affects the expression of numerous genes, including some oncogenes and tumor suppressor genes that are closely related to tumorigenesis. 5-aza-2′-deoxycytidine (AZA) is a classic and effective DNA methylation inhibitor. It can reverse the abnormal hypermethylated state of DNA by inhibiting the activity of DNA methyltransferases, thus potentially enabling genes that were previously silenced due to hypermethylation to resume expression. We speculate that in HCC, there may be some regulatory RNAs related to tumor progression that are under the control of methylation and are in a state of low expression or have not yet been discovered. Therefore, we introduced AZA to try to explore whether it could induce the expression of potentially important functional RNAs and then uncover their mechanism of action in HCC. Secondly, many previous studies have reported that in research on other types of tumors, after treatment with AZA, some new non-coding RNAs with the function of regulating the biological behaviors of tumor cells were discovered. These successful precedents suggest to us that in HCC research, we can also utilize AZA as a powerful tool to search for key RNA molecules that may be involved in the functional regulation of HCC cells.
This study selected HCC, one of the main malignant tumors in China, as the research subject. By ingeniously using DNA methylation inhibitor AZA to treat HCC cells and constructing a double-stranded cDNA library, along with utilizing methods such as genome-wide high-throughput sequencing, the antisense RNA NRAS-AS was identified for the first time. Preliminary studies have found that DNA methylation inhibitors inhibit the activity of DNA methyltransferase, alleviate the inhibition based on methylation, reverse abnormal DNA hypermethylation, affect the expression of NRAS-AS, and then affect the expression of NRAS and inhibit the occurrence and development of HCC. This discovery holds promise for the early diagnosis, treatment, and prognosis evaluation of HCC and has significant implications for both basic research and clinical medical research.
2. Materials and Methods
2.1. Patients and Samples
A total of 45 HCC patients who underwent surgical resection in the Hepatobiliary Surgery Department of the Chinese PLA General Hospital from February 2018 to July 2020 were selected for this study. Among them, there were 28 males and 17 females, ranging in age from 49 to 80 years old, with tumor diameters ranging from 2 to 20 cm. All subjects included in the study had not received radiotherapy, chemotherapy, or other anti-tumor treatment before surgery. Tissue samples were collected in a manner that did not affect clinical diagnosis, and both adjacent non-cancerous and cancerous tissues were collected and stored for future use. The survival information of the matched HCC paraffin samples was recorded for 5 years. All samples were histologically diagnosed by two pathologists. The collection of samples has been reviewed by the Ethics Committee of the Chinese PLA General Hospital, and informed consent forms have been signed.
2.2. Cell Lines
The HCC cell lines HepG2 (RRID: CVCL_0027) and SMMC-7721 (RRID: CVCL_0534) were obtained from the cell repository of the Chinese Academy of Sciences (Shanghai), while the HEK293 cell line (RRID: CVCL_0045) was obtained from the American Type Culture Collection (ATCC). The aforementioned cells were cultured in DMEM medium (Gibco, Grand Island, NY, USA) supplemented with 10% fetal bovine serum FBS (Gibco) and 1% penicillin/streptomycin (Gibco) and incubated in a constant temperature cell culture incubator at 37 °C and 5% CO2.
2.3. Establishment of HepG2 Cell Double-Stranded cDNA Library
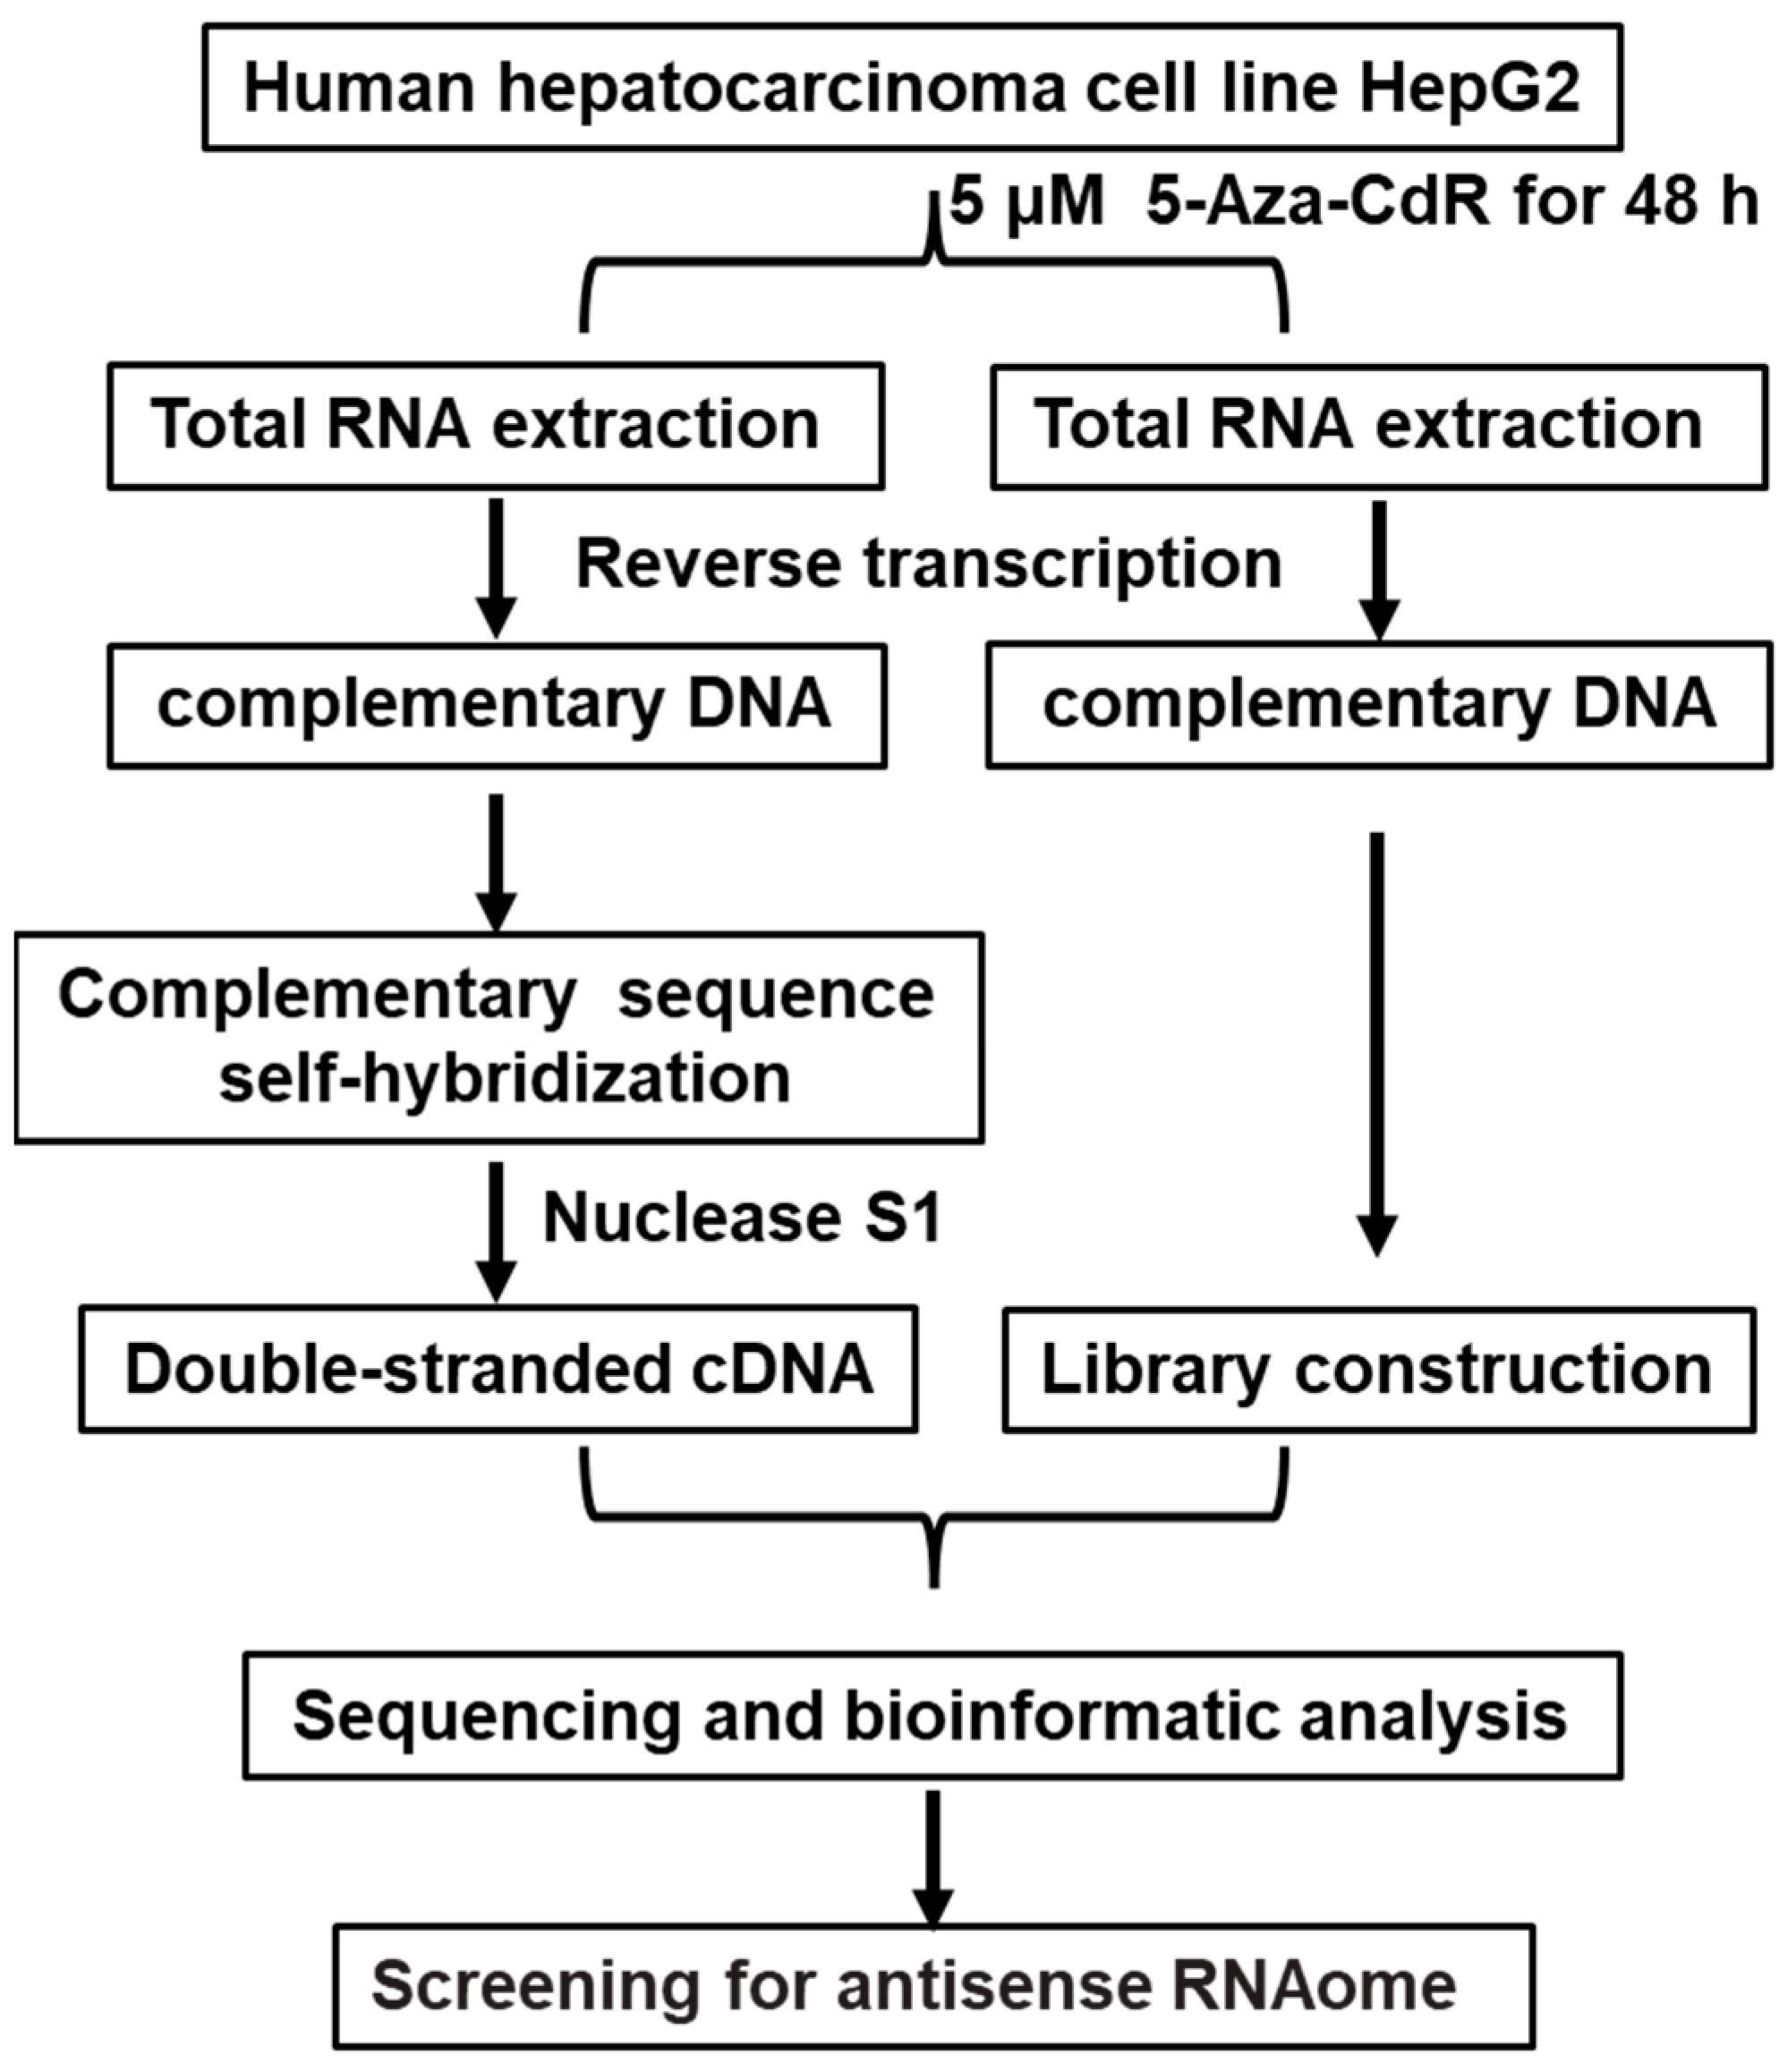
HepG2 cells were treated with AZA, and RNA was extracted. This was followed by reverse transcription to synthesize cDNA and further processes, including DNA nucleotide kinase S1 treatment, resulting in the construction of a double-stranded cDNA library for HepG2 cells. The control group was treated with DMSO. This method can be used for the identification of novel antisense RNA in liver cancer. The flowchart is shown in
Figure 1.
2.4. Establishment of a Double-Stranded cDNA Library for HepG2 Liver Cancer Cells and High-Throughput Genomic Sequencing Analysis
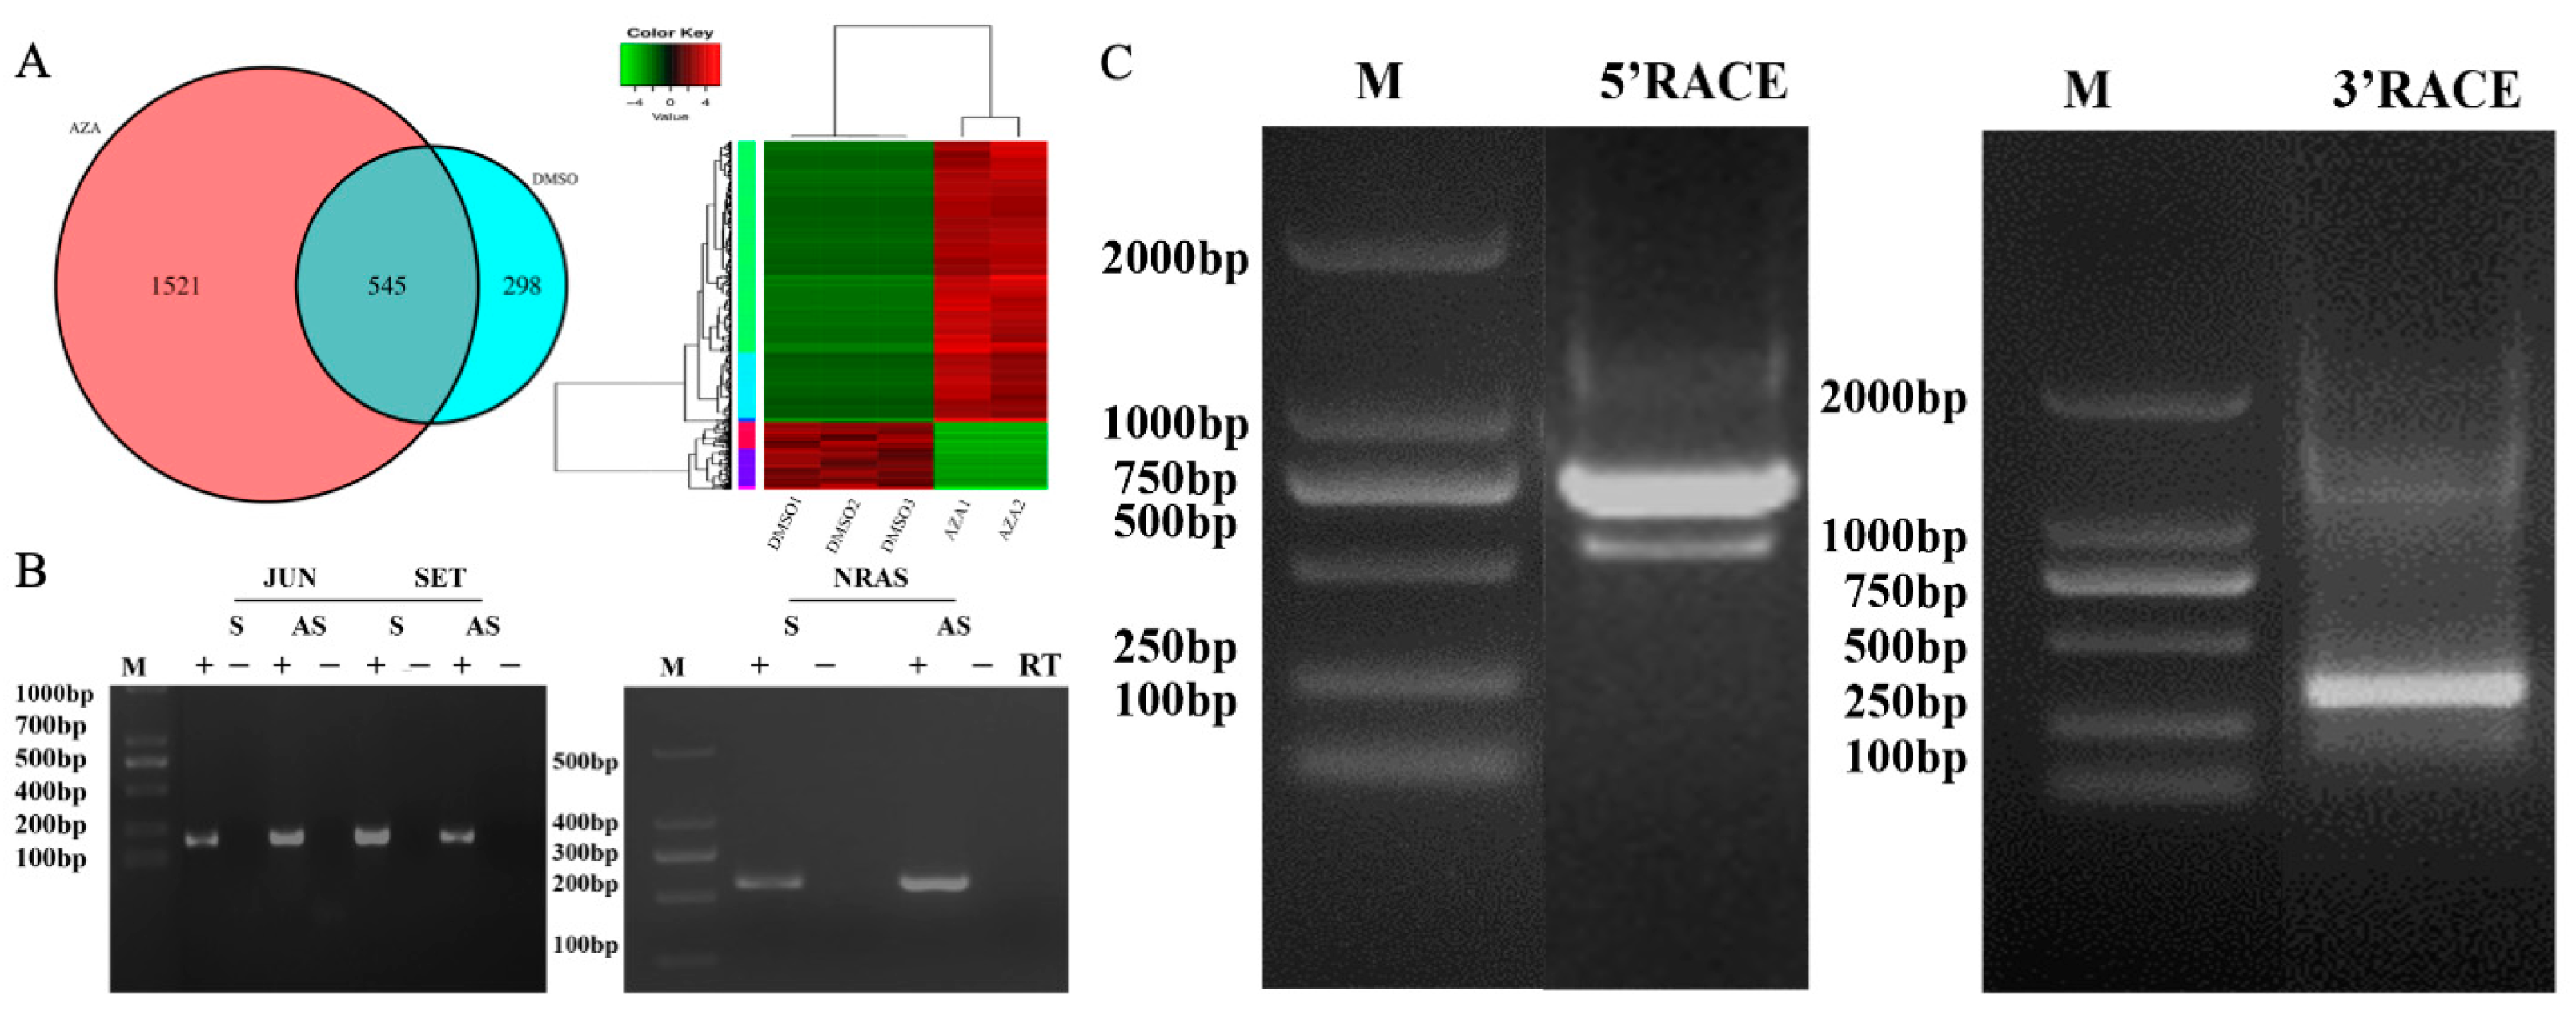
HepG2 cell was treated with a DNA methylation inhibitor, AZA (at a concentration of 5 μM), and Dimethyl Sulfoxide (DMSO) for 48 h. Total RNA was extracted from the HepG2 cell after treatment with DNase I to remove genomic DNA. Subsequently, cDNA was synthesized through reverse transcription, and RNase H was used to remove RNA from the samples. The samples were incubated overnight at 55 °C for self-hybridization of complementary sequences. Then, Nuclease S1 was used to remove all single-stranded DNA, generating double-stranded cDNA from HepG2 cells. The double-stranded cDNA libraries of the AZA treatment group and the DMSO control group HepG2 cells were subjected to next-generation genomic sequencing analysis by Suzhou Genewiz Intelligent Company, with three biological replicates for each group. Sequencing results were processed and optimized using software such as CASAVA, Trimmomatic, and Fast QC to identify image base recognition, optimize data, and evaluate quality. From these results, liver cancer-related genes with carcinogenic effects were selected, and the presence of sense and antisense RNA in their sequences was determined. Finally, gene functional annotation and enrichment pathway analysis were performed using tools such as Gene Ontology (GO) and Pathway analysis.
2.5. Identification of the Full-Length Sequence of NRAS-AS Using RACE Technology
The rapid amplification of cDNA ends (RACE) technique was employed to identify the full-length sequence of NRAS-AS. The SMARTer® RACE 5′/3′Kit from Takara was used to perform the RACE experiment. Firstly, total RNA was extracted using TRIzol® Reagent, Using the SMART Scribe Reverse Transcriptase, 1μg of genomic DNA-free RNA was reverse transcribed to generate 5′ or 3′ RACE products. The amplification was then carried out using the universal primer UPM and gene-specific primers (5′-GSP or 3′-GSP primers), and the antisense transcript end sequence was obtained through cloning and sequencing. Each RACE experiment was performed in triplicate, and the sequencing was done for at least three independent clones to ensure the reliability of the results.
2.6. Vector Construct
The lentiviral vector expressing NRAS-AS was constructed, and primers containing NehI and BamHI restriction sites were designed. The pcDNA3.1-NRAS-AS plasmid was used as a template to PCR-amplify the full-length sequence of NRAS-AS. The PCR product was then ligated into the lentiviral vector pCDH-CMV-MCS-EF1-Puro after restriction digestion to construct the pCDH-NRAS-AS vector. Subsequently, lentiviral packaging was performed in HEK-293T cells using a four-plasmid co-transfection system to generate the pLV-NRAS-AS lentivirus. The virus solution was used to infect HepG2 and SMMC-7721 cells, and stable expression cell lines were selected with puromycin. The NRAS-AS monoclonal cell line was selected by the dilution method, and its DNA, RNA, and protein were extracted and analyzed. Finally, PCR and Sanger sequencing were used to verify the integration and expression of NRAS-AS in the monoclonal cell line.
2.7. RT-qPCR
Total RNA from all tissues and cells was extracted using Trizol reagent, and cDNA was synthesized with the Vazyme gDNA removal reverse transcription kit. The strand-specific primers for NRAS and NRAS-AS, as well as the primers for real-time fluorescence quantitative PCR, were designed and synthesized. The strand-specific primers were diluted to a 25-fold concentration, and the RT-qPCR primers were diluted to a 10-fold concentration. The RT-qPCR reaction system was prepared using Vazyme SYBR Premix Ex Taq II, which contained 10 μL of SYBR Green Master Mix, 1 μL of forward primer (10 μM), 1 μL of reverse primer (10 μM), and 1 μL of cDNA template, with the final volume adjusted to 20 μL. Amplification was carried out according to the reaction program of pre-denaturation at 95 °C for 30 s, followed by 35 cycles, each cycle consisting of denaturation at 95 °C for 5 s, annealing, and extension at 60 °C for 30 s. Subsequently, the cycle threshold method (ΔΔCt) was adopted to analyze the RNA expression levels, with GAPDH and U6 as the normalization reference standards. After PCR amplification, the melting curve data were analyzed using the BIO-RAD CFX ConnectTM real-time PCR system. Each sample was subjected to three biological replicates to ensure the reliability of the results.
2.8. Cell Proliferation
The cells were inoculated into 96-well plates; each well was added with 10 μL CCK-8 solution (Vazyme) and incubated at 37 °C for 2 h. The light absorption value at 450 nm was measured for six consecutive days, and the growth curve was drawn. In addition, both groups of cells were evenly seeded into a 6-well culture plate until clones appeared, at which point the culture was immediately stopped. The cells fixed with 4% neutral formaldehyde were stained with crystal violet solution for 15 min, photographed, and the number of clone formations was calculated.
2.9. Flow Cytometry
Logarithmically growing cells were resuspended in 100 µL of 1× Binding Buffer. Then, 5 µL of Annexin V-FITC and 5 µL of PI Staining Solution (Vazyme) were added, and the mixture was incubated in the dark for 10 to 15 min. Then, 400 µL of 1× Binding Buffer was added and gently mixed. Cell apoptosis was detected using a flow cytometer with an excitation wavelength of 488 nm. In addition, cells were fixed with pre-chilled 70% ethanol for 2 h. Then, 500 µL of PI staining solution (Vazyme, Nanjing, China) was added to the tested cell samples. After thorough mixing, the samples were incubated in the dark at 37 °C for 30 min. Cell cycle analysis was performed using a flow cytometer, and subsequently, Modfit analysis software was used to analyze cell DNA content and light scattering.
2.10. Cell Migration Experiment
Cells were seeded into pre-marked six-well plates, and when the cells reached approximately 95% confluence, a cell scratch was made. 1.5 mL of serum-free DMEM medium was added to each well, and the distance between the cells on both sides of the scratch was observed at different time points, such as 0 h, 24 h, 48 h, and 72 h, to compare the migration of NRAS-AS. In addition, 100 μL of cell suspension with a concentration of 10 × 106 cells/mL was slowly added to the upper chamber coated with Matrigel Matrix, and 600 μL of complete medium containing 10% FBS was added to the lower chamber. After 48 h of incubation, the upper chamber of the transwell was removed, and the cells were fixed with anhydrous methanol. Crystal violet staining solution was added, and the cells were stained for 20 min at room temperature. The cells were observed and photographed under a microscope, and the number of invaded cells was counted.
2.11. Animal Experiment
Twelve four-week-old BALB/C-Nu nude mice were purchased from the Experimental Animal Center of Yangzhou University and housed in an SPF-level animal facility. The experiment was divided into a control group and an experimental group, each consisting of six mice. Both groups were inoculated with a cell concentration of 2 × 10⁷ cells/mL. In the control group, HepG2-GFP was subcutaneously injected into the right forelimb axilla of nude mice, while in the experimental group, HepG2-NRAS-AS was injected. The injection volume for each mouse was 200 μL. The nude mice in both the control and experimental groups were observed every other day for the occurrence of tumors. After tumor formation, the size of the tumor was measured, and the volume was calculated for further analysis. Within four weeks after inoculation, the nude mice were sacrificed, and subcutaneous tumor tissues were collected. The tumor tissues were then fixed with formalin, embedded in paraffin, and used for immunohistochemical staining. The remaining half of the tumor tissue was used for protein extraction and subjected to Western blot analysis.
2.12. Immunohistochemical
The tumor tissues of the two groups were sequentially fixed, dehydrated, embedded, sliced, antigen repair, and antigen-binding (1:500 Anti-NRAS antibodies were added overnight at 4 °C), followed by DAB staining and neutral glue sealing, etc. Finally, the images were photographed under a microscope, and the comprehensive optical density (IOD) of the images was analyzed by IPP software 6.0.
2.13. Western Blotting
The tumor tissue protein was extracted, and its concentration was determined. After gel electrophoresis, membrane transfer, sealing, adding 1:500 diluent of NRAS primary antibody, incubation at 4 °C overnight, then adding 1:500 sealing solution to dilute HRP labeled secondary antibody, incubation at room temperature for 1 h. Then, the quantitative analysis was carried out by using Image J software 1.8.0 through chemiluminescence visualization and other methods.
2.14. Statistical Analysis
Data were analyzed using SPSS 26.0 software. In this study, t-tests and analysis of variance (ANOVA) were used for intergroup comparisons of quantitative data. The chi-square test was used for intergroup comparisons of qualitative data to analyze the correlation between gene expression and clinical pathological characteristics. The prognosis and survival of HCC patients were analyzed using methods such as Kaplan-Meier and log-rank tests. p < 0.05 was considered statistically significant.
4. Discussion
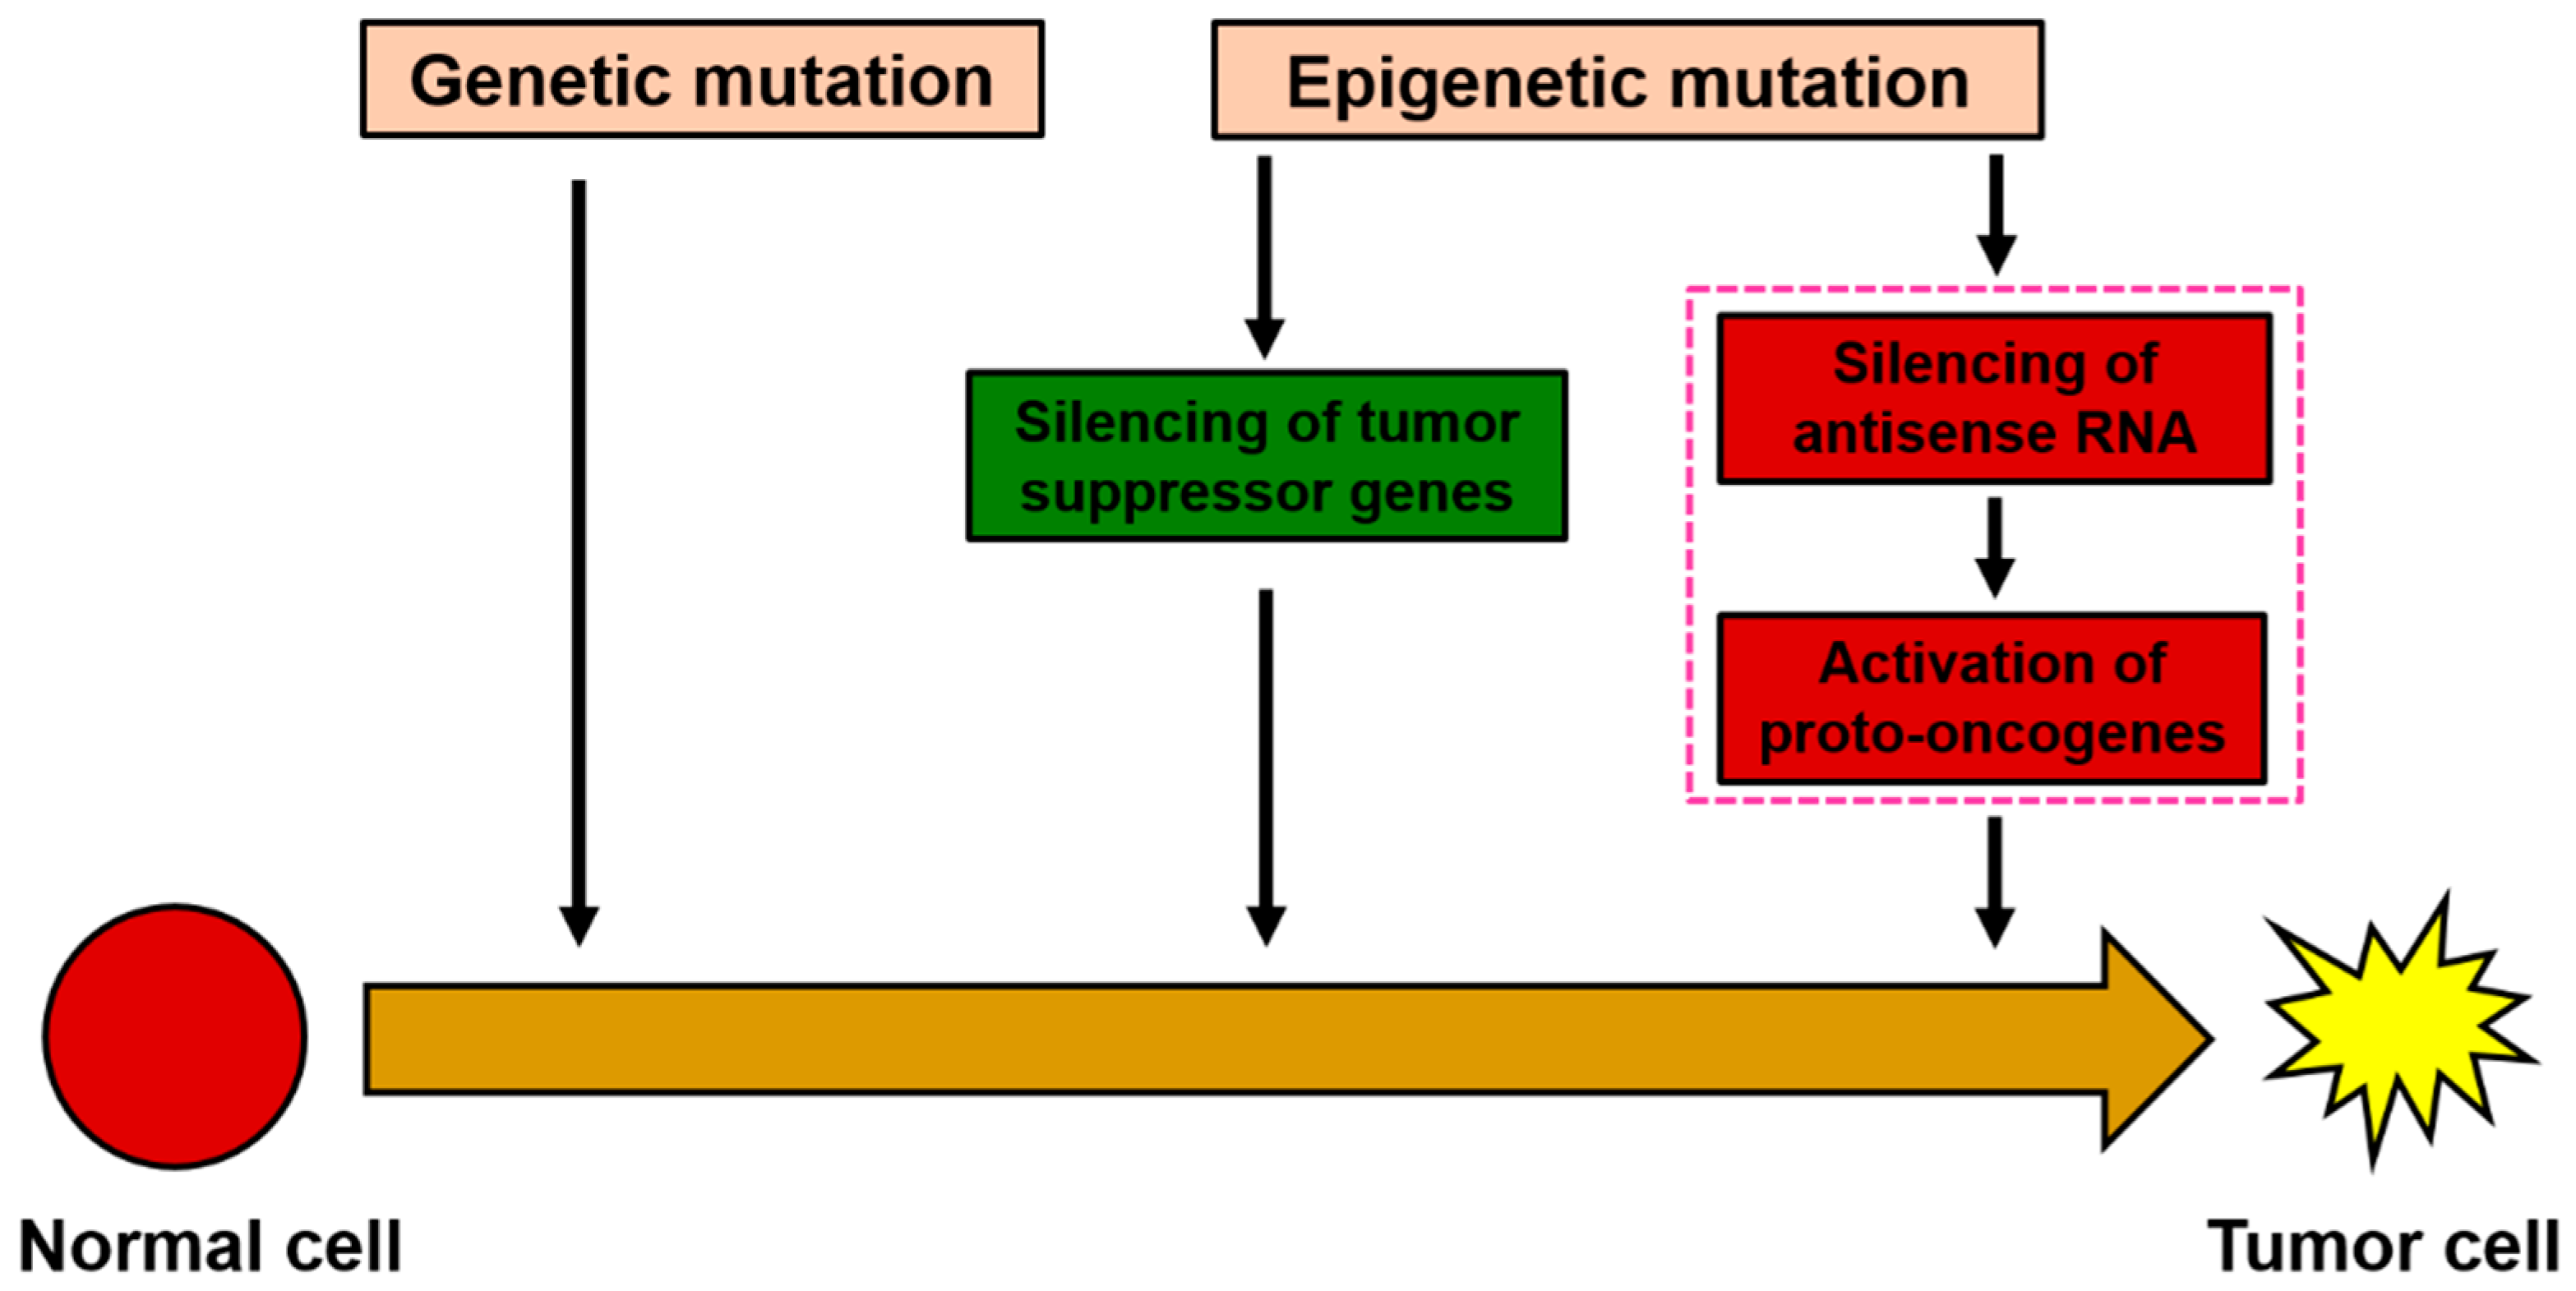
Although it is known that genetic mutations are associated with tumor formation, increasing evidence suggests that epigenetic variations are also closely related to the occurrence, development, and metastasis of tumors [
14]. Current research data shows that the molecular mechanisms of epigenetic silencing of tumor suppressor genes have been widely revealed [
15]. However, regarding the mechanistic role of oncogenes in the abnormal activation of tumor cells, apart from reports related to genetic mutations, no relevant reports have been found at the level of epigenetic mechanisms. The discovery of epigenetic silencing of tumor suppressor genes has introduced epigenetic drugs as a method for clinical treatment. For example, AZA and its analog 5-Azacytidine, as inhibitors of DNA methylation, have been used in clinical research for the treatment of leukemia and certain solid tumors [
16,
17]. With the rapid development of high-throughput sequencing technology, research on antisense RNA and its role in tumor occurrence, development, and treatment has attracted widespread attention in the medical field. In this study, the oncogene NRAS was chosen as an effective target gene, hoping to explore its potential value in inhibiting tumor growth, excessive proliferation, and antisense RNA therapy by studying the inhibition or knockout of abnormally expressed NRAS oncogene in tumor cells.
In this study, the AZA demethylation regulation and induction of antisense RNA expression were used to construct a double-stranded cDNA library of HepG2 cells for high-throughput genome sequencing. Simultaneously, combining bioinformatics and chain-specific fluorescent quantitative PCR technology, the presence of the NRAS-AS gene was screened and identified for the first time. After obtaining the sequencing sequence of NRAS, the complete NRAS-AS cDNA of the 5′ and 3′ ends was amplified from liver cancer cells using RACE technology, with a total length of 804 bp. Compared with the homology reported in GenBank for liver cancer NRAS, the homology reached over 99.88%. Therefore, we named it NRAS-AS. The acquisition of the full-length sequence of NRAS-AS provides an important basis for further study of its biological functions.
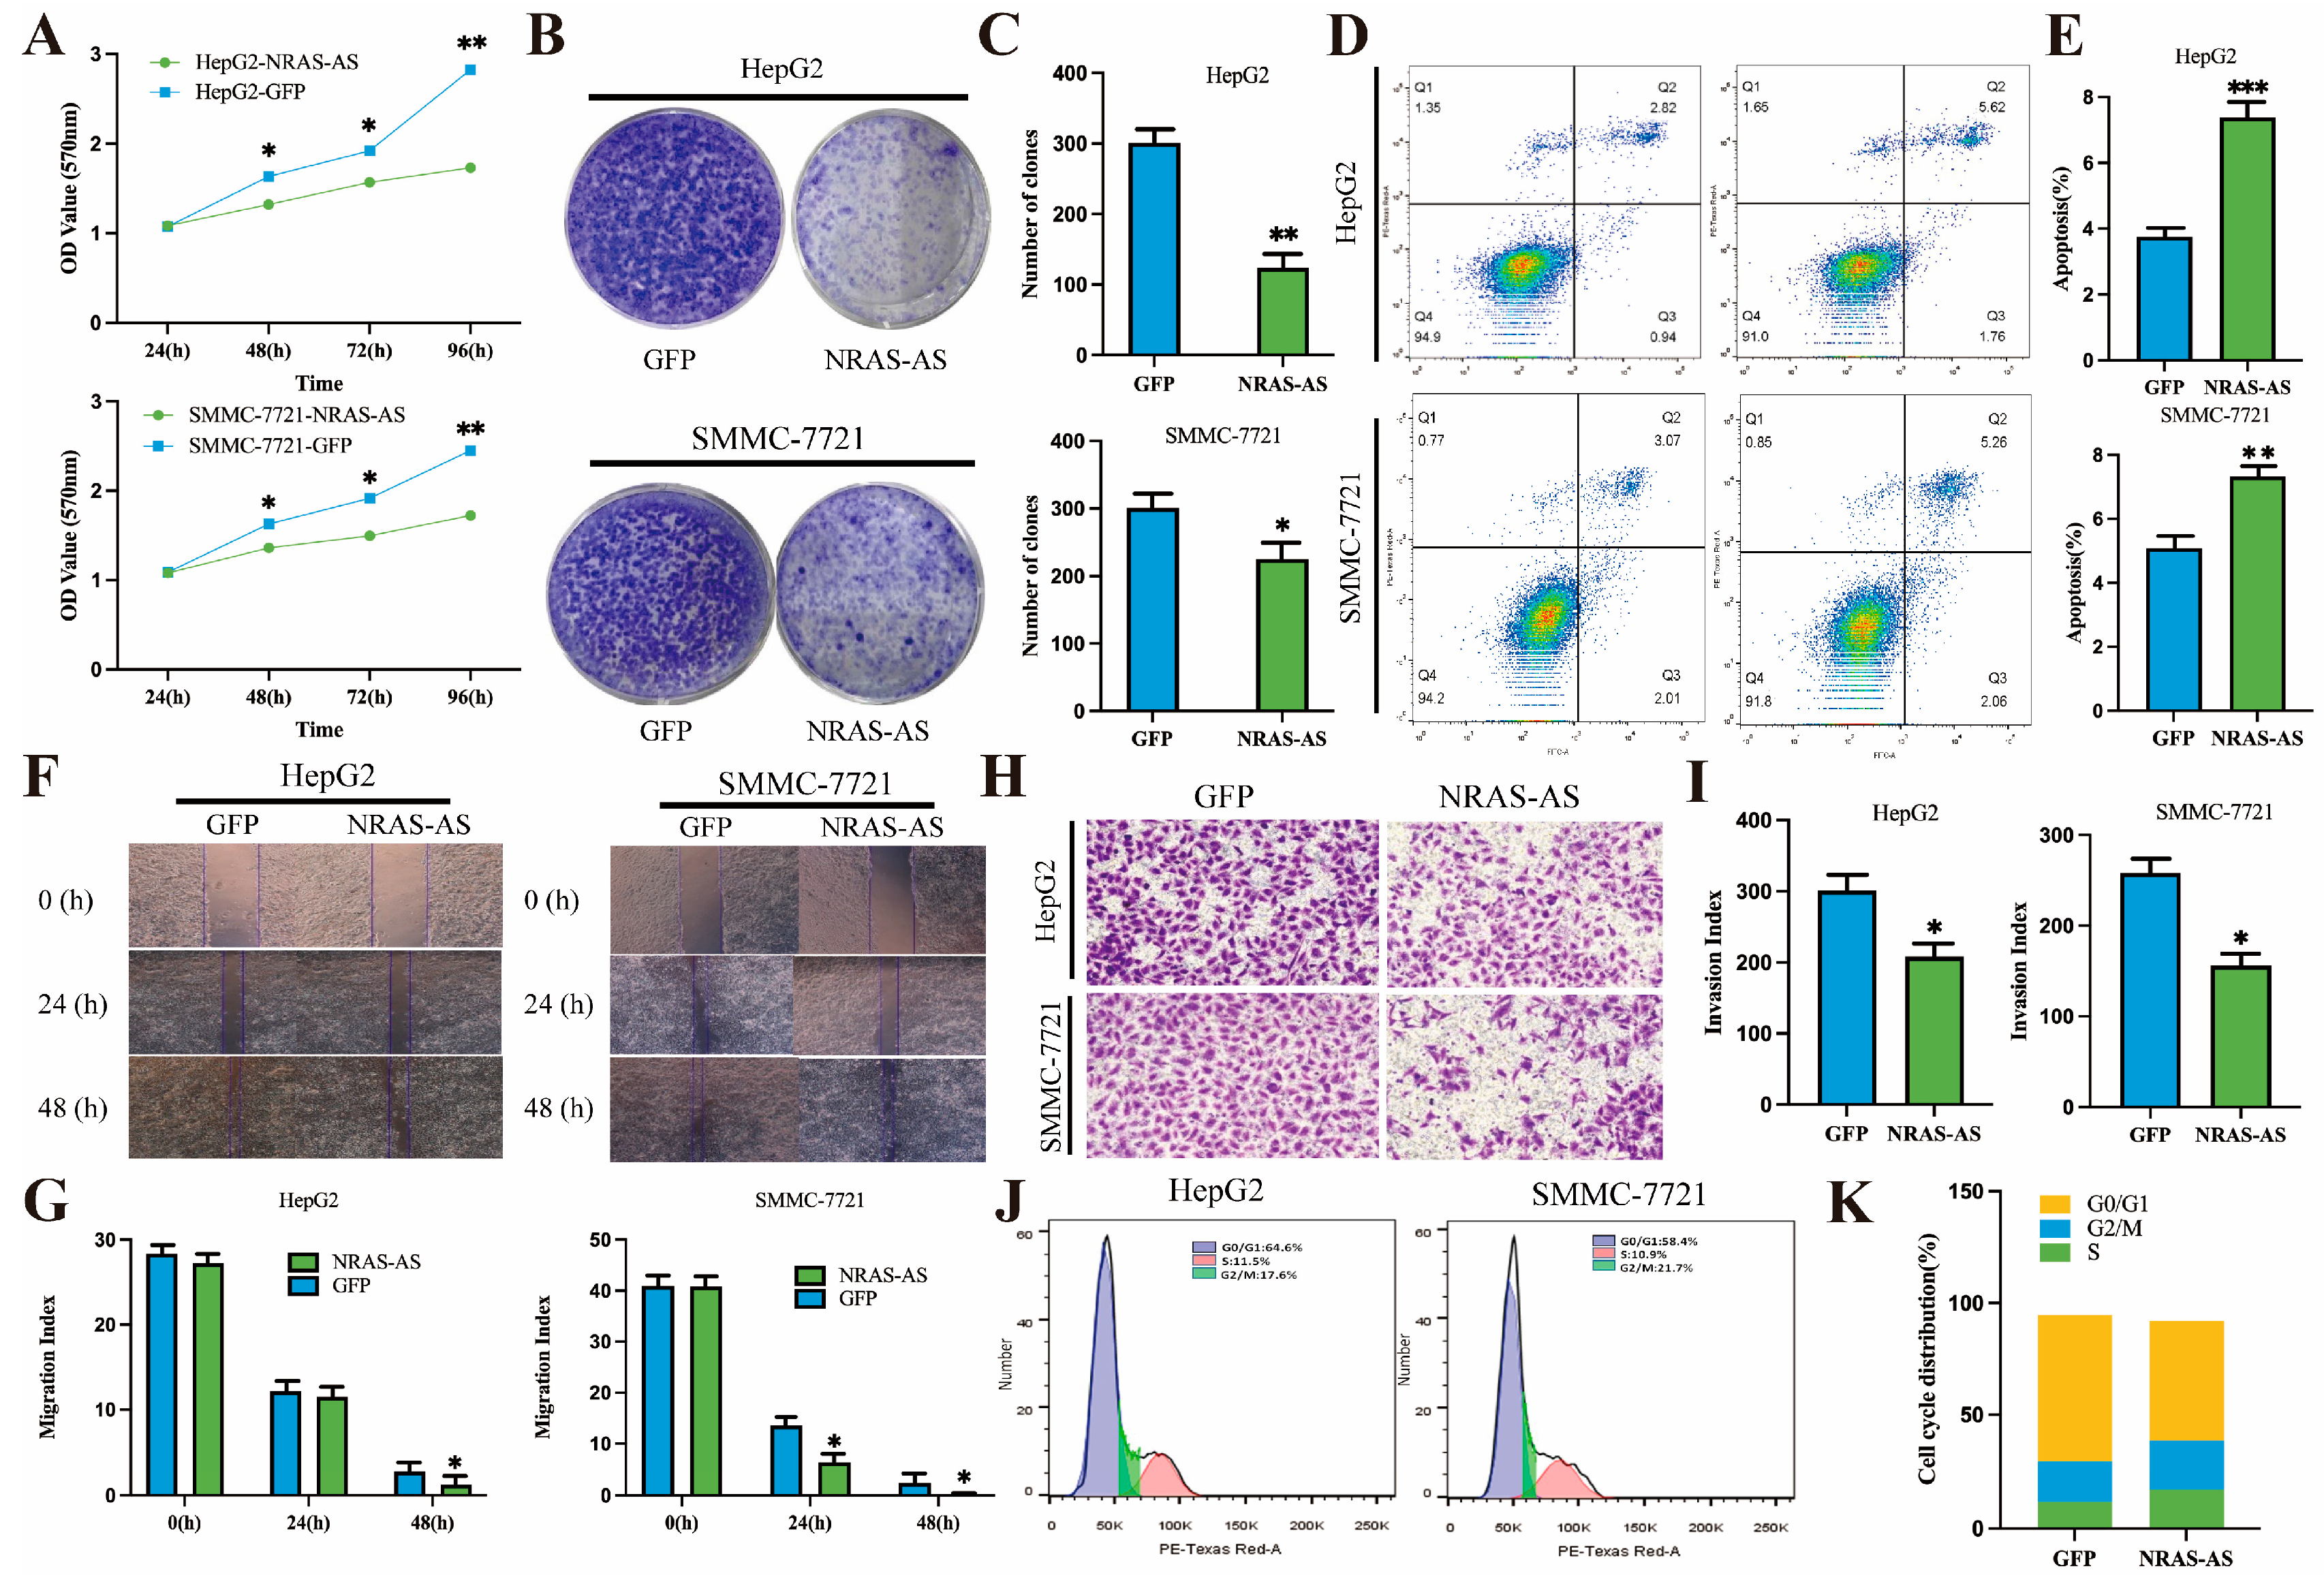
In this study, overexpression of NRAS-AS was found to inhibit the proliferation, invasion, and migration capabilities of HCC cells and promote apoptosis. Research has shown that NRAS plays an important role in cell proliferation and migration by binding with GTP/GDP and GTPase. Under normal physiological conditions,
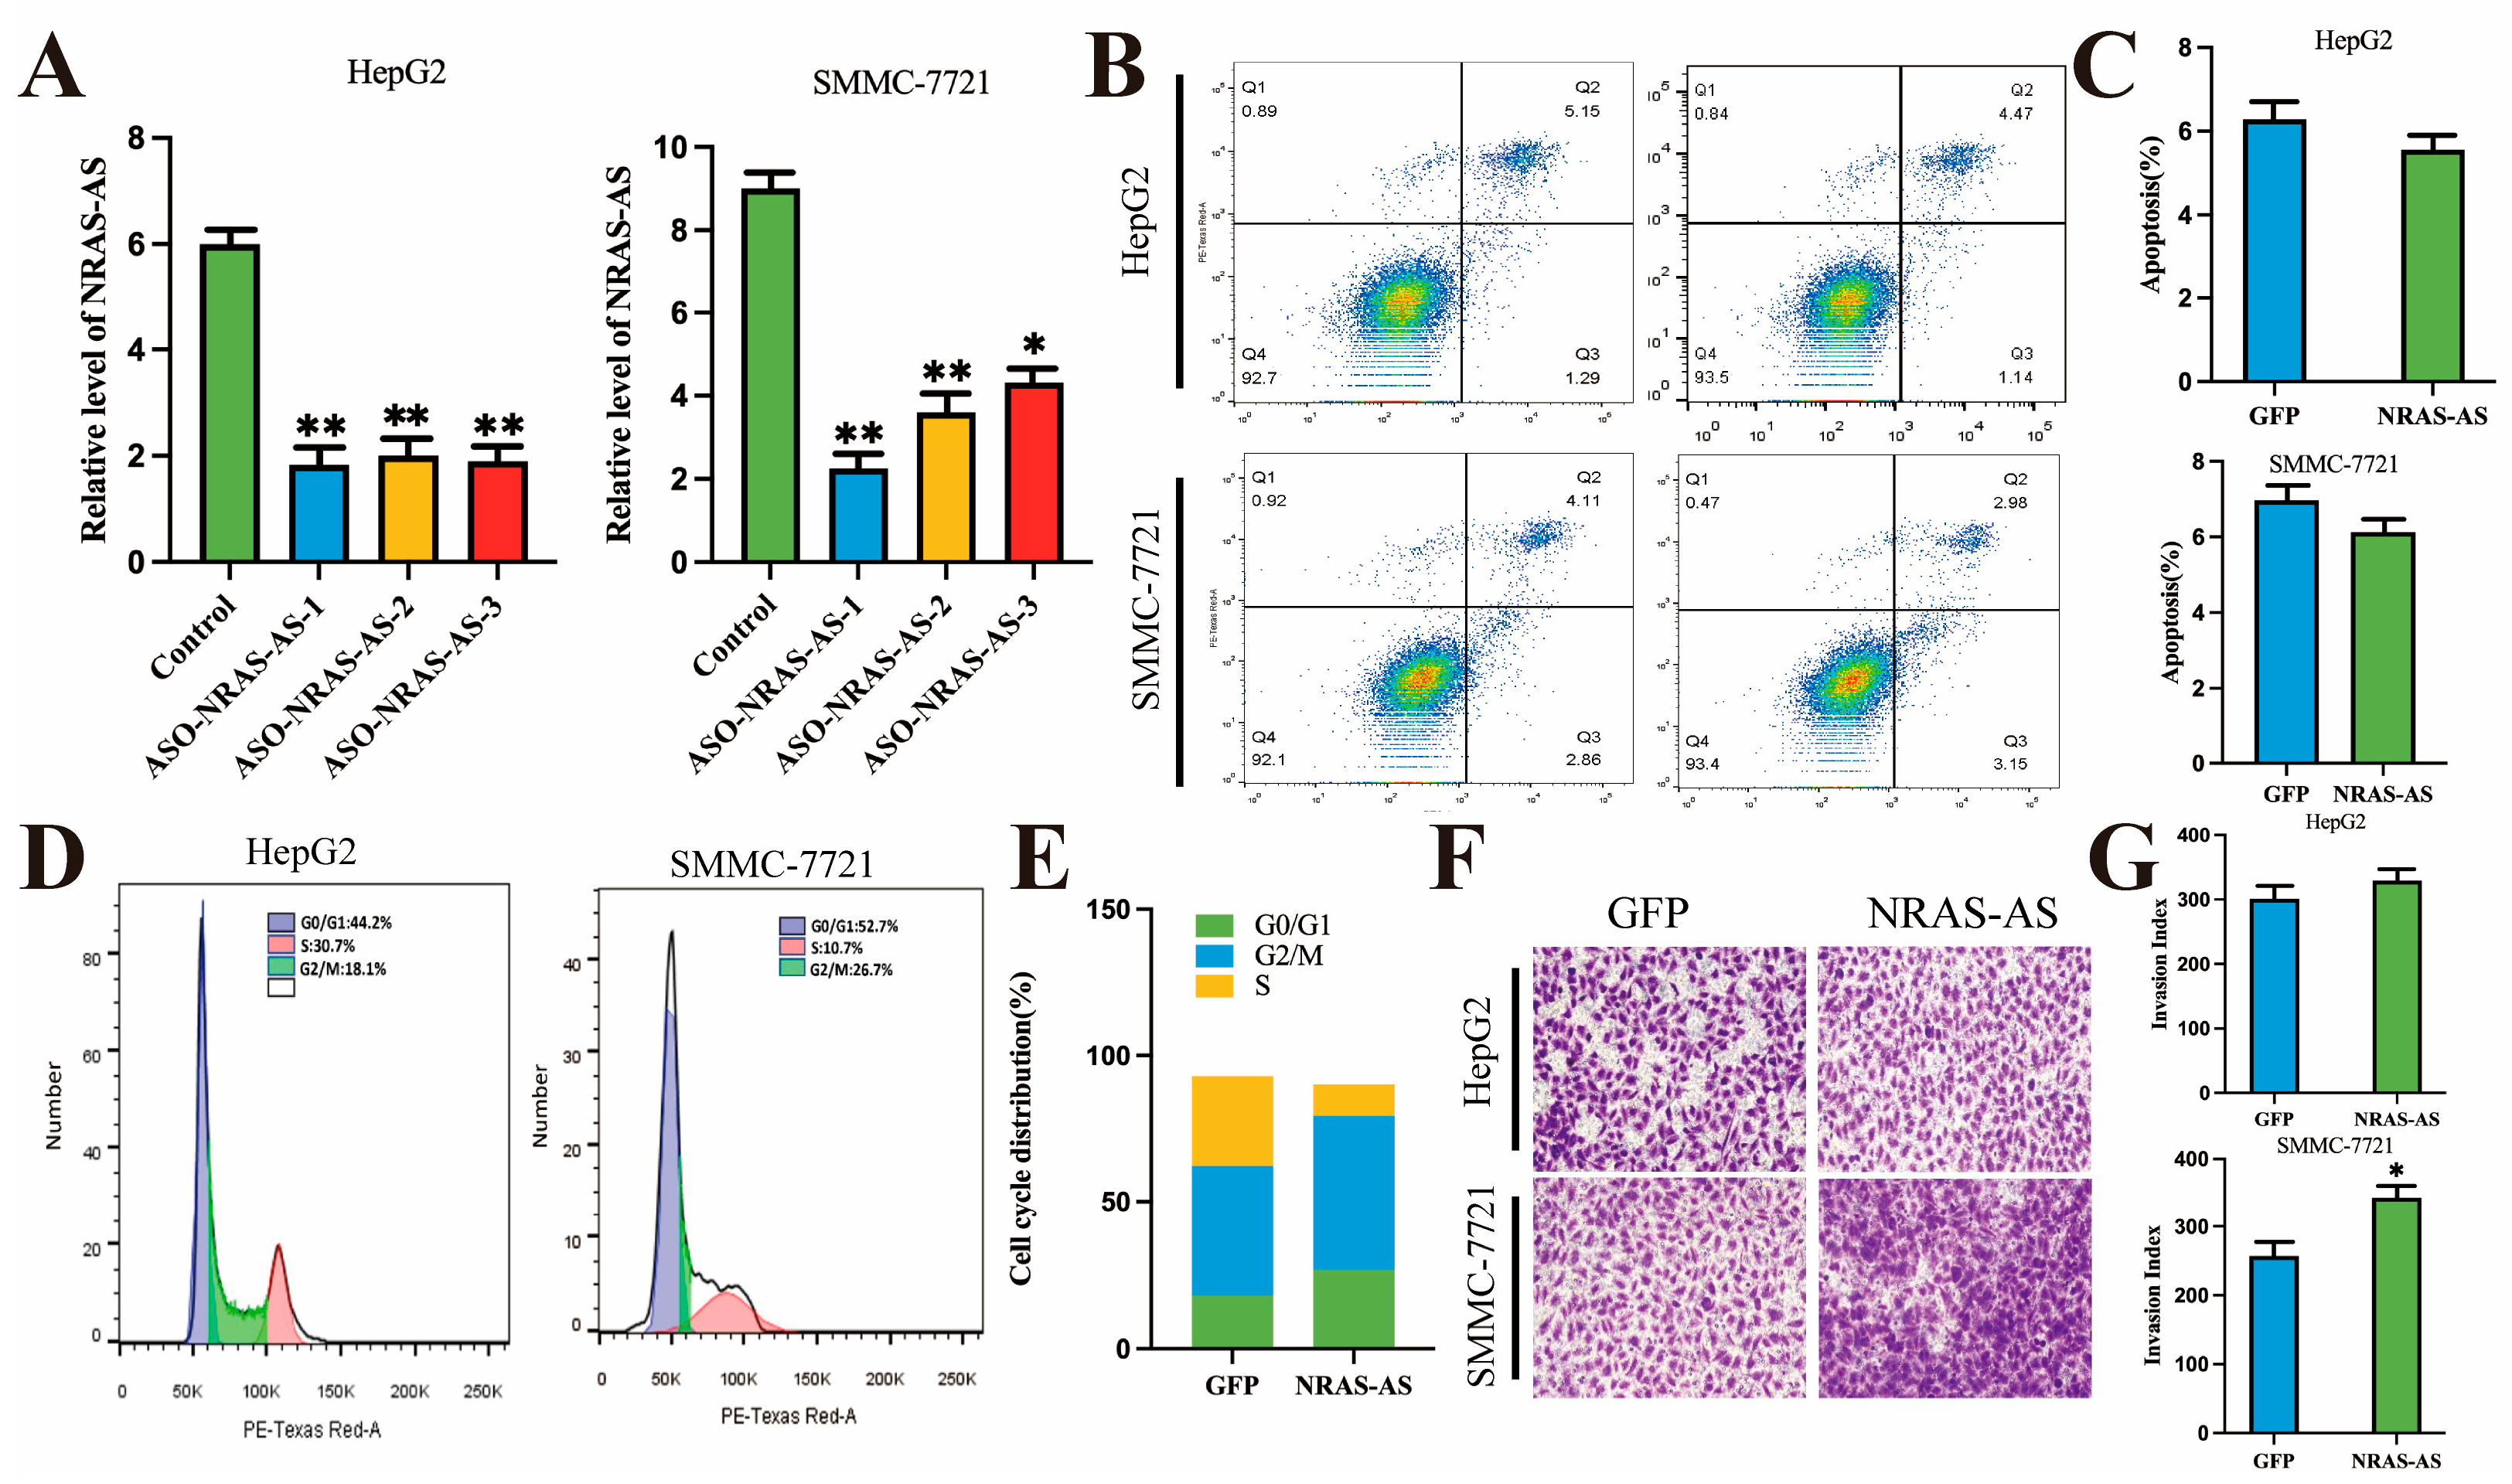
NRAS can also control cell proliferation and migration by activating the RAS/RAF/MAPK and PIK3CA/AKT signaling pathways downstream of the Epidermal Growth Factor Receptor (EGFR), which in turn can lead to carcinogenesis. Transwell and wound healing assays showed that overexpression of NRAS-AS in HepG2 and SMMC-7721 cells resulted in decreased invasiveness and significantly reduced migration capabilities of HCC cells, consistent with findings in breast cancer studies. Conversely, interference with NRAS-AS increased the invasiveness of HCC cells. This study also found that NRAS-AS plays a regulatory role in the cell cycle of HepG2 cells. The use of nude mouse tumor models, which can stably reflect the biological and genetic characteristics of primary tumors, has been widely used in tumor treatment and related research, offering advantages such as high tumor formation rates and good uniformity [
18,
19].
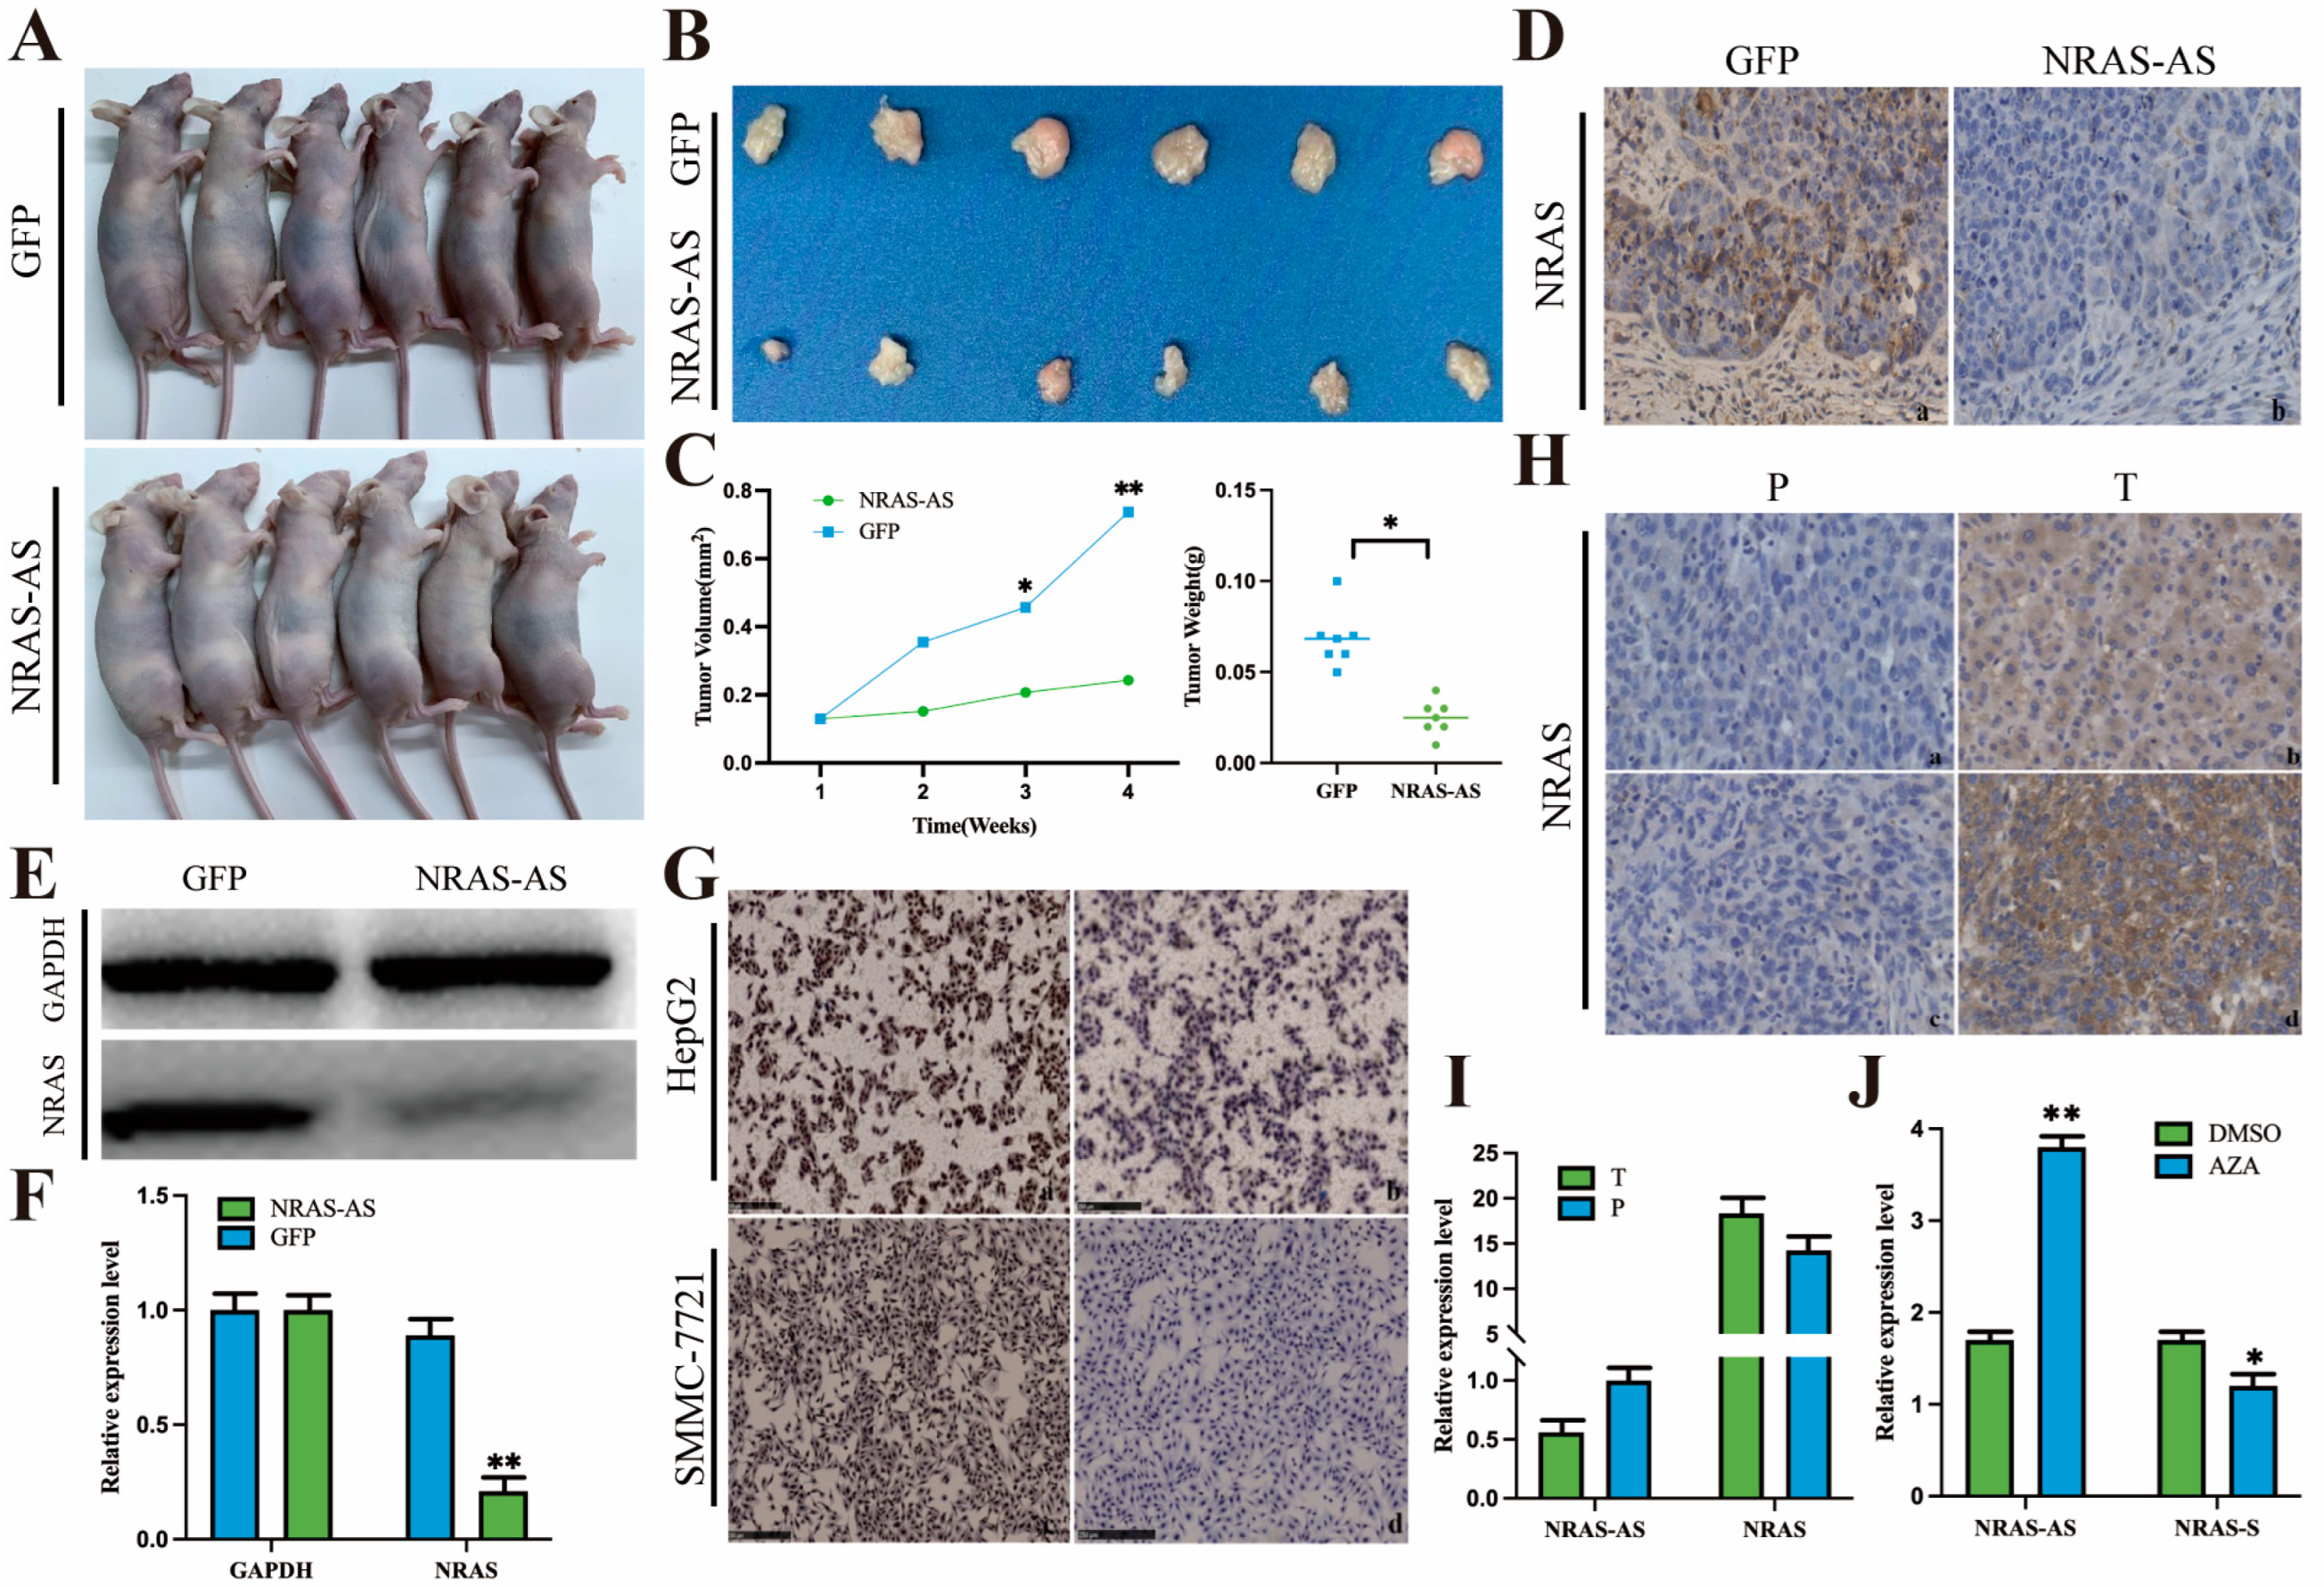
We constructed a nude mouse subcutaneous tumor model and plotted the tumor volume growth curve. The results showed that the subcutaneous tumors formed by overexpressing NRAS-AS in HepG2 cells were significantly smaller and lighter in mass. Immunohistochemical staining and Western blotting of the tumor tissues also showed a significant decrease or even absence of NRAS protein expression in the NRAS-AS overexpression group. Similar trends were observed in the cells as well. These results preliminarily confirmed the inhibitory effect of NRAS-AS on the tumorigenic ability of HepG2 cells in vivo, demonstrating its strong anti-tumor potential. In vitro, NRAS-AS was found to participate in various physiological activities such as cell proliferation, migration, and apoptosis, inhibiting the growth process of HepG2 cells. It is predicted that NRAS-AS may regulate the occurrence and development of tumors by controlling the expression of NRAS protein, laying the foundation for further research into the specific molecular regulatory mechanisms.
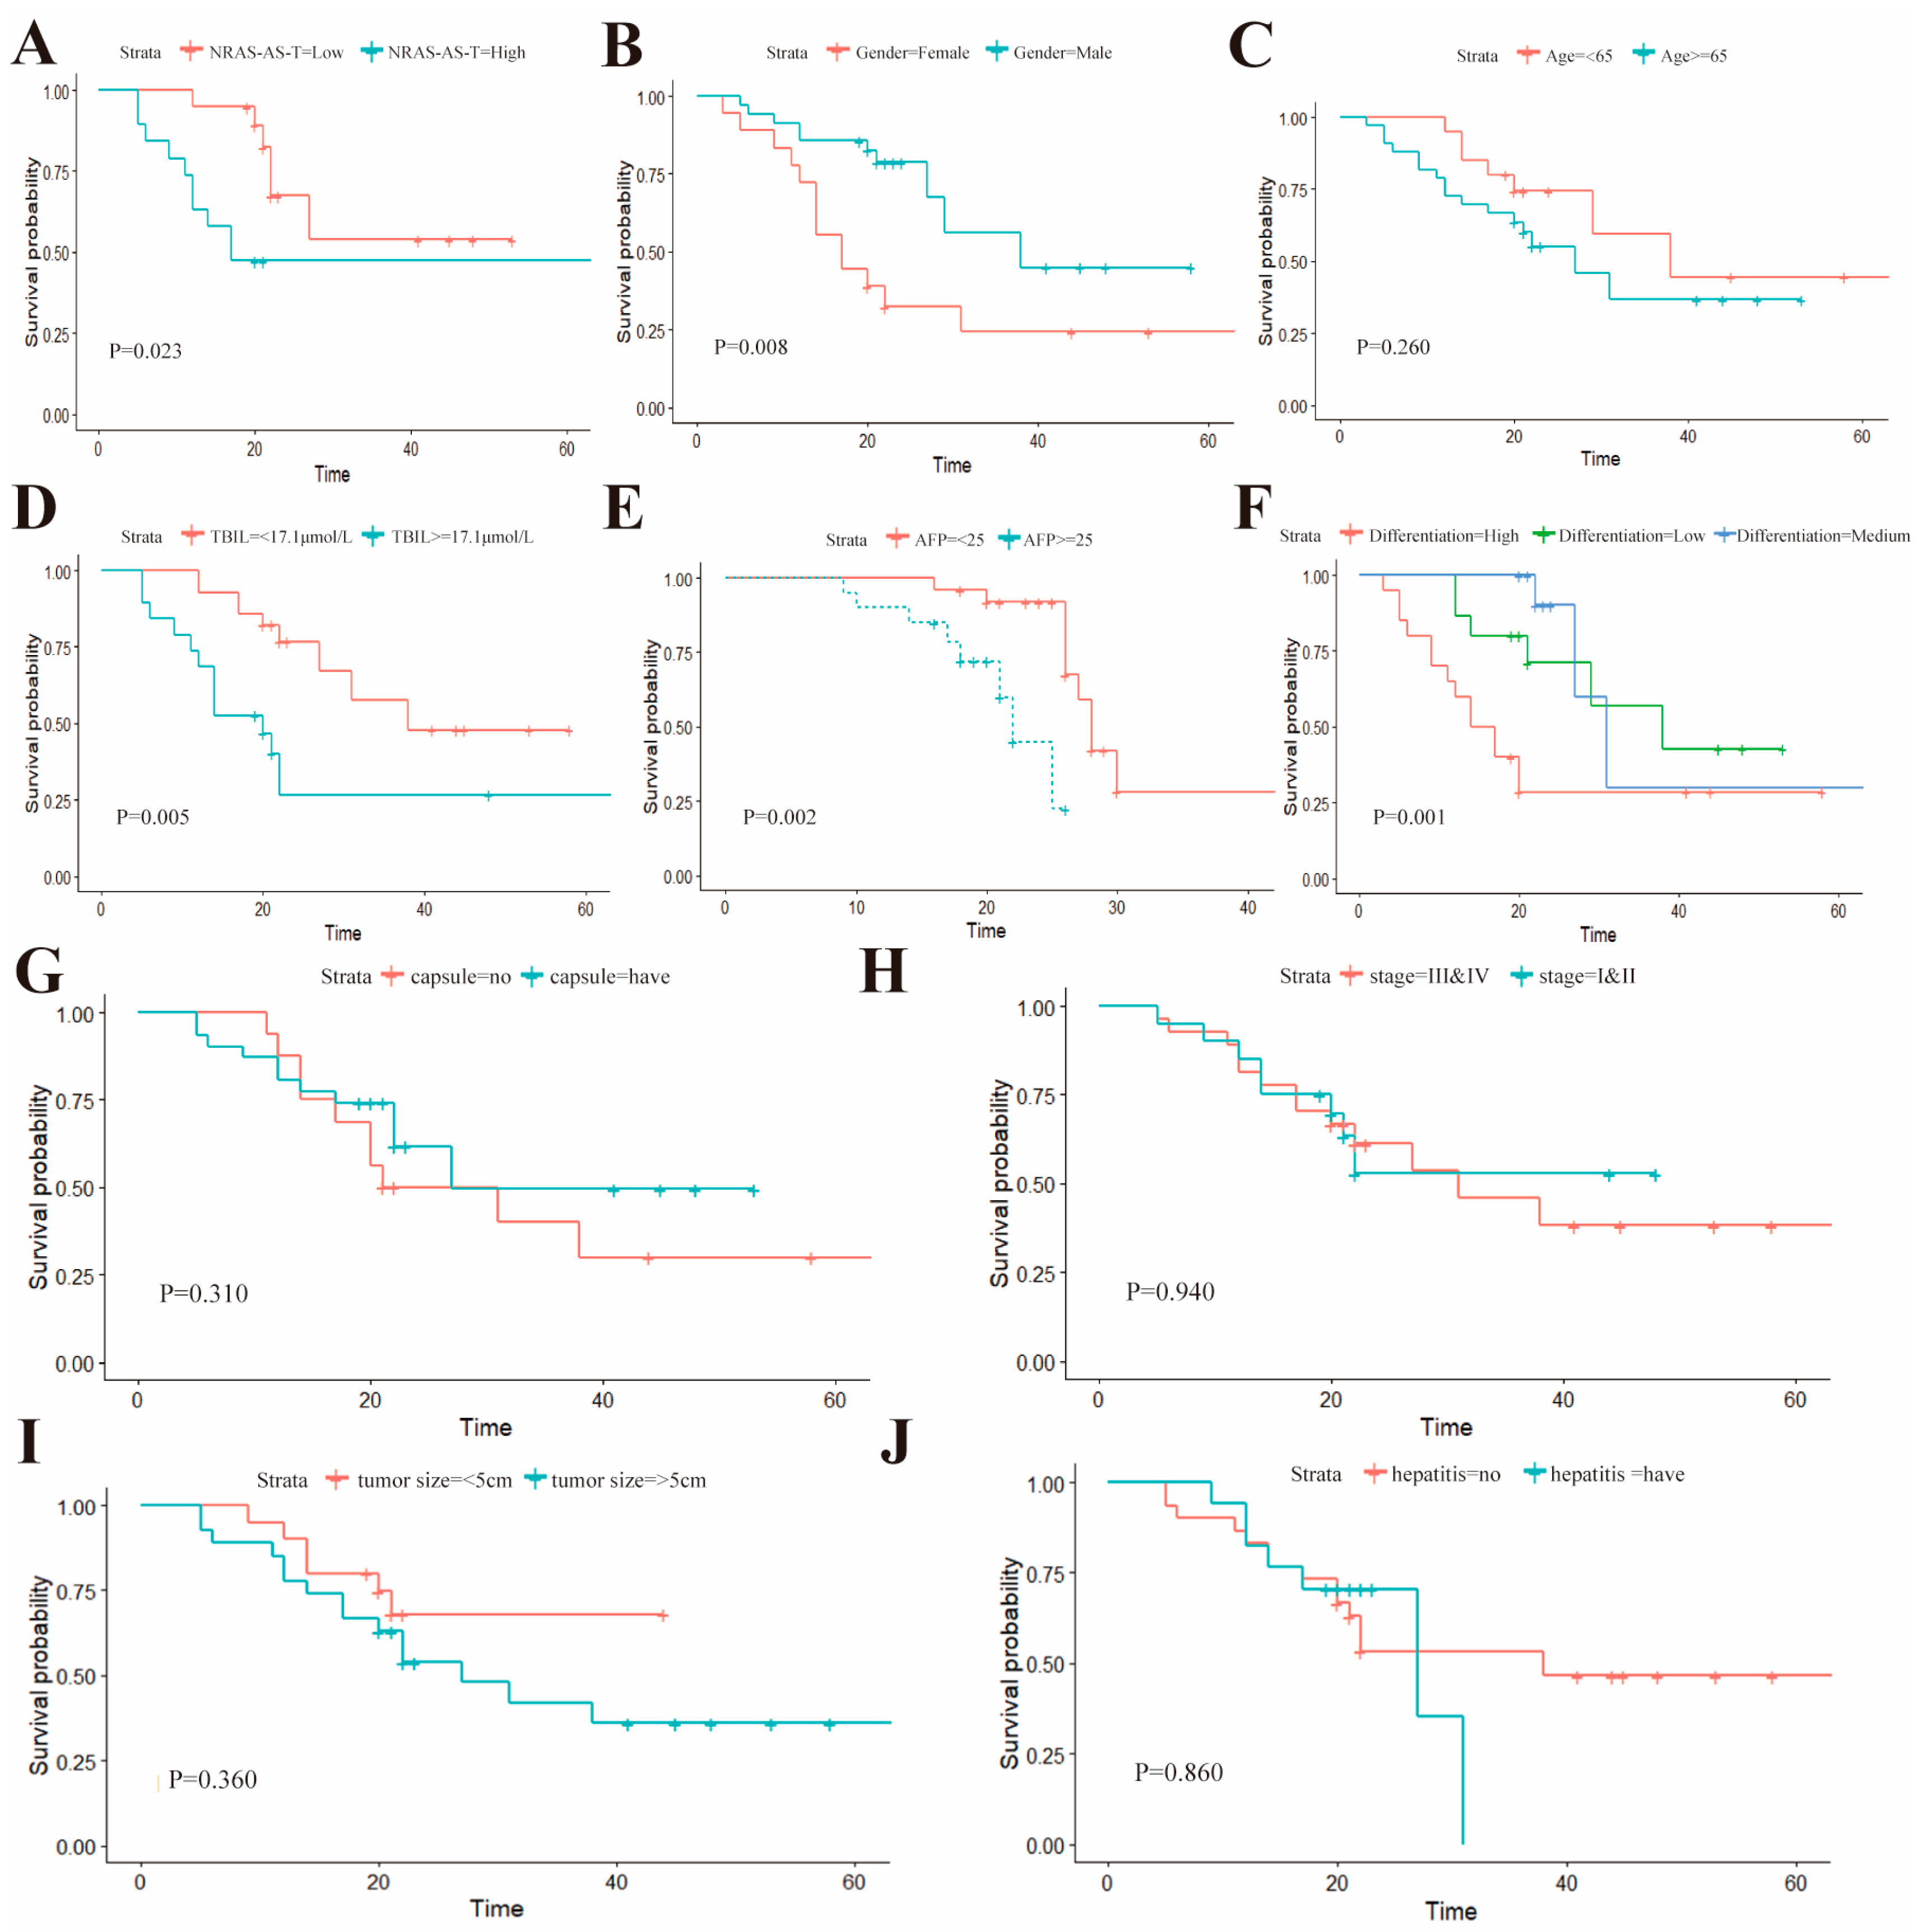
To evaluate the relationship between the expression levels of NRAS-AS and the occurrence of HCC, this study first analyzed the correlation between NRAS-AS and the clinical characteristics of HCC patients, suggesting that NRAS-AS plays an important role in the pathological staging of liver cancer. The survival analysis results showed that patients with high expression of NRAS-AS had a significantly higher five-year postoperative survival rate than those with low expression of NRAS-AS (
p = 0.023). The survival rate of female patients was significantly lower than that of male patients (
p = 0.0079), and the survival rate of patients with total bilirubin level > 17.1μmol/L was significantly lower than that of patients with ≤17.1 μmol/L (
p = 0.0051). The survival rate of patients with AFP ≥ 25 μg/L was significantly lower than that of patients with AFP < 25 μg/L (
p = 0.0019). Additionally, the lower the tissue differentiation degree, the worse the survival rate (
p = 0.0012), while there was no difference with age (
p = 0.26) or tumor size (
p = 0.36). RT-qPCR results showed a negative correlation between the expression of NRAS-AS and NRAS (
Figure 5I). Histologically, the expression level of NRAS protein in HCC tissues was higher than that in adjacent tissues. We collected HepG2 cells treated with AZA and found that the expression level of NRAS-AS was significantly upregulated (
p < 0.01), while the expression of
NRAS showed a downward trend (
p < 0.05) (
Figure 6). Based on the above results, DNA methyltransferase inhibitors can inhibit the activity of DNA methyltransferase, alleviate the inhibition based on methylation, reverse abnormal DNA hypermethylation, affect the expression of NRAS-AS, and then affect the expression of
NRAS and inhibit the occurrence and development of HCC. It is speculated that AZA can affect the expression of oncogene
NRAS by affecting the antisense RNA NRAS-AS, thereby inhibiting the development of liver cancer (
Figure 7).
NRAS and its antisense RNA NRAS-AS play a key role in tumor development and may affect the immune response of HCC by regulating the expression of NRAS protein. NRAS-AS not only changes the biological behavior of tumor cells, such as the expression of immune molecules, and interferes with the immune escape mechanism but also may affect the function and activity of immune cells in the tumor microenvironment, including the polarization direction of macrophages and the activity of NK cells, thereby breaking the immune balance. In addition, NRAS-AS may also interfere with the immune surveillance process, allowing tumors to evade recognition by the immune system and further break the immune regulatory balance. Although current studies focus on the direct effects of NRAS-AS on HCC cells, its immunoregulatory role deserves further exploration, which may provide a new perspective for HCC treatment and immune strategies.
Although this study systematically analyzed the effects of NRAS-AS on the behavior and mechanisms of HCC cells, there are some limitations. First, the limited clinical sample size may miss potential associations or introduce bias. Therefore, larger multicenter studies are needed to verify the value of NRAS-AS in the diagnosis, prognosis, and treatment of HCC. Furthermore, in vitro and in vivo models have limitations in representing human disease. Results from cell lines and mouse models alone do not always translate to clinical outcomes in HCC patients, especially given the heterogeneity of human cancers. In conclusion, despite the valuable findings, more comprehensive studies are needed to elucidate the role of NRAS-AS in HCC and its potential as a therapeutic target and diagnostic marker.
In fact, this study also demonstrated the significant role of NRAS-AS in the proliferation, apoptosis, and invasion of liver cancer cells in in vitro experiments. However, due to the relatively small number of clinical samples included in this study, with only 45 cases, the experimental results have a certain degree of singularity and limitations. In the future, it is necessary to expand the sample size and further explore the expression of NRAS-AS in liver cancer, as well as the relationship between NRAS-AS and the regulation of NRAS protein expression in the occurrence and development of liver cancer, in order to elucidate the anti-cancer molecular regulatory mechanisms of antisense RNA NRAS-AS in the process of liver cancer occurrence and development.
