
Optical Genome Mapping for Detection of BCR::ABL1—Another Tool in Our Toolbox

 ,
, 
 , , ,
, , ,  and
and
Abstract
1. Introduction
2. Materials and Methods
2.1. Case Selection
2.2. Chromosomal Analysis
2.3. FISH Analysis
2.4. Quantitative BCR::ABL1 RT-PCR Assay
2.5. Optical Genome Mapping (OGM) Analysis
3. Results
3.1. Patient Information
3.2. Chromosomal Analysis Results
3.3. FISH Analysis Results
3.4. Quantitative RT-PCR Analysis Results
3.5. Optical Genome Mapping (OGM) Analysis Results
4. Discussion
5. Conclusions
Author Contributions
Funding
Institutional Review Board Statement
Informed Consent Statement
Data Availability Statement
Acknowledgments
Conflicts of Interest
References
- Khoury, J.D.; Solary, E.; Abla, O.; Akkari, Y.; Alaggio, R.; Apperley, J.F.; Bejar, R.; Berti, E.; Busque, L.; Chan, J.K.C.; et al. The 5th edition of the World Health Organization Classification of Haematolymphoid Tumours: Myeloid and Histiocytic/Dendritic Neoplasms. Leukemia 2022, 36, 1703–1719. [Google Scholar] [CrossRef] [PubMed]
- Alaggio, R.; Amador, C.; Anagnostopoulos, I.; Attygalle, A.D.; Araujo, I.B.O.; Berti, E.; Bhagat, G.; Borges, A.M.; Boyer, D.; Calaminici, M.; et al. The 5th edition of the World Health Organization Classification of Haematolymphoid Tumours: Lymphoid Neoplasms. Leukemia 2022, 36, 1720–1748. [Google Scholar] [CrossRef] [PubMed]
- Arber, D.A.; Orazi, A.; Hasserjian, R.P.; Borowitz, M.J.; Calvo, K.R.; Kvasnicka, H.M.; Wang, S.A.; Bagg, A.; Barbui, T.; Branford, S.; et al. International Consensus Classification of Myeloid Neoplasms and Acute Leukemias: Integrating morphologic, clinical, and genomic data. Blood 2022, 140, 1200–1228. [Google Scholar] [CrossRef]
- Campo, E.; Jaffe, E.S.; Cook, J.R.; Quintanilla-Martinez, L.; Swerdlow, S.H.; Anderson, K.C.; Brousset, P.; Cerroni, L.; de Leval, L.; Dirnhofer, S.; et al. The International Consensus Classification of Mature Lymphoid Neoplasms: A report from the Clinical Advisory Committee. Blood 2022, 140, 1229–1253. [Google Scholar] [CrossRef]
- Arber, D.A.; Brunning, R.D.; Le Beau, M.M.; Falini, B.; Vardiman, J.W.; Porwit, A.; Thiele, J.; Foucar, K.; Doehner, H.; Bloomfield, C.D. Acute Myeloid Leukemia with Recurrent Genetic Abnormalities; International Agency for Research on Cancer: Lyon, France, 2017. [Google Scholar]
- Tang, Z.; Toruner, G.A.; Tang, G.; Cameron Yin, C.; Wang, W.; Hu, S.; Thakral, B.; Wang, S.A.; Miranda, R.N.; Khoury, J.D.; et al. Chronic myeloid leukemia with insertion-derived BCR-ABL1 fusion: Redefining complex chromosomal abnormalities by correlation of FISH and karyotype predicts prognosis. Modern Pathol. 2020, 33, 2035–2045. [Google Scholar] [CrossRef]
- Mikhail, F.M.; Heerema, N.A.; Rao, K.W.; Burnside, R.D.; Cherry, A.M.; Cooley, L.D. Section E6.1-6.4 of the ACMG technical standards and guidelines: Chromosome studies of neoplastic blood and bone marrow-acquired chromosomal abnormalities. Genet. Med. 2016, 18, 635–642. [Google Scholar] [CrossRef] [PubMed]
- Mascarello, J.T.; Hirsch, B.; Kearney, H.M.; Ketterling, R.P.; Olson, S.B.; Quigley, D.I.; Rao, K.W.; Tepperberg, J.H.; Tsuchiya, K.D.; Wiktor, A.E. Section E9 of the American College of Medical Genetics technical standards and guidelines: Fluorescence in situ hybridization. Genet. Med. 2011, 13, 667–675. [Google Scholar] [CrossRef]
- Zhen, C.; Wang, Y.L. Molecular monitoring of chronic myeloid leukemia: International standardization of BCR-ABL1 quantitation. J. Mol. Diagn. 2013, 15, 556–564. [Google Scholar] [CrossRef]
- Lestringant, V.; Duployez, N.; Penther, D.; Luquet, I.; Derrieux, C.; Lutun, A.; Preudhomme, C.; West, M.; Ouled-Haddou, H.; Devoldere, C.; et al. Optical genome mapping, a promising alternative to gold standard cytogenetic approaches in a series of acute lymphoblastic leukemias. Genes Chromosom. Cancer 2021, 60, 657–667. [Google Scholar] [CrossRef]
- Lühmann, J.L.; Stelter, M.; Wolter, M.; Kater, J.; Lentes, J.; Bergmann, A.K.; Schieck, M.; Göhring, G.; Möricke, A.; Cario, G.; et al. The Clinical Utility of Optical Genome Mapping for the Assessment of Genomic Aberrations in Acute Lymphoblastic Leukemia. Cancers 2021, 13, 4388. [Google Scholar] [CrossRef]
- Neveling, K.; Mantere, T.; Vermeulen, S.; Oorsprong, M.; van Beek, R.; Kater-Baats, E.; Pauper, M.; van der Zande, G.; Smeets, D.; Weghuis, D.O.; et al. Next-generation cytogenetics: Comprehensive assessment of 52 hematological malignancy genomes by optical genome mapping. Am. J. Hum. Genet. 2021, 108, 1423–1435. [Google Scholar] [CrossRef] [PubMed]
- Gerding, W.M.; Tembrink, M.; Nilius-Eliliwi, V.; Mika, T.; Dimopoulos, F.; Ladigan-Badura, S.; Eckhardt, M.; Pohl, M.; Wünnenberg, M.; Farshi, P.; et al. Optical genome mapping reveals additional prognostic information compared to conventional cytogenetics in AML/MDS patients. Int. J. Cancer 2022, 150, 1998–2011. [Google Scholar] [CrossRef]
- Rack, K.; De Bie, J.; Ameye, G.; Gielen, O.; Demeyer, S.; Cools, J.; De Keersmaecker, K.; Vermeesch, J.R.; Maertens, J.; Segers, H.; et al. Optimizing the diagnostic workflow for acute lymphoblastic leukemia by optical genome mapping. Am. J. Hematol. 2022, 97, 548–561. [Google Scholar] [CrossRef]
- Smith, A.C.; Neveling, K.; Kanagal-Shamanna, R. Optical genome mapping for structural variation analysis in hematologic malignancies. Am. J. Hematol. 2022, 97, 975–982. [Google Scholar] [CrossRef]
- Yang, H.; Garcia-Manero, G.; Sasaki, K.; Montalban-Bravo, G.; Tang, Z.; Wei, Y.; Kadia, T.; Chien, K.; Rush, D.; Nguyen, H.; et al. High-resolution structural variant profiling of myelodysplastic syndromes by optical genome mapping uncovers cryptic aberrations of prognostic and therapeutic significance. Leukemia 2022, 36, 2306–2316. [Google Scholar] [CrossRef] [PubMed]
- Levy, B.; Baughn, L.B.; Akkari, Y.; Chartrand, S.; LaBarge, B.; Claxton, D.; Lennon, P.A.; Cujar, C.; Kolhe, R.; Kroeger, K.; et al. Optical genome mapping in acute myeloid leukemia: A multicenter evaluation. Blood Adv. 2023, 7, 1297–1307. [Google Scholar] [CrossRef]
- Valkama, A.; Vorimo, S.; Kumpula, T.A.; Räsänen, H.; Savolainen, E.R.; Pylkäs, K.; Mantere, T. Optical Genome Mapping as an Alternative to FISH-Based Cytogenetic Assessment in Chronic Lymphocytic Leukemia. Cancers 2023, 15, 1294. [Google Scholar] [CrossRef]
- Vieler, L.M.; Nilius-Eliliwi, V.; Schroers, R.; Vangala, D.B.; Nguyen, H.P.; Gerding, W.M. Optical Genome Mapping Reveals and Characterizes Recurrent Aberrations and New Fusion Genes in Adult ALL. Genes 2023, 14, 686. [Google Scholar] [CrossRef]
- McGowan-Jordan, J.; Hastings, R.J.; Moore, S. ISCN (2020): An International System for Human Cytogenetic Nomenclature; S. Kager AG: Basel, Switzerland, 2020. [Google Scholar]
- Brandes, D.; Yasin, L.; Nebral, K.; Ebler, J.; Schinnerl, D.; Picard, D.; Bergmann, A.K.; Alam, J.; Köhrer, S.; Haas, O.A.; et al. Optical Genome Mapping Identifies Novel Recurrent Structural Alterations in Childhood ETV6::RUNX1+ and High Hyperdiploid Acute Lymphoblastic Leukemia. Hemasphere 2023, 7, e925. [Google Scholar] [CrossRef]
- Soler, G.; Ouedraogo, Z.G.; Goumy, C.; Lebecque, B.; Aspas Requena, G.; Ravinet, A.; Kanold, J.; Véronèse, L.; Tchirkov, A. Optical Genome Mapping in Routine Cytogenetic Diagnosis of Acute Leukemia. Cancers 2023, 15, 2131. [Google Scholar] [CrossRef]
- Wagener, R.; Brandes, D.; Jung, M.; Huetzen, M.A.; Bergmann, A.K.; Panier, S.; Picard, D.; Fischer, U.; Jachimowicz, R.D.; Borkhardt, A.; et al. Optical genome mapping identifies structural variants in potentially new cancer predisposition candidate genes in pediatric cancer patients. Int. J. Cancer 2023, 154, 607–614. [Google Scholar] [CrossRef] [PubMed]
- Brown, P.A.; Shah, B.; Advani, A.; Aoun, P.; Boyer, M.W.; Burke, P.W.; DeAngelo, D.J.; Dinner, S.; Fathi, A.T.; Gauthier, J.; et al. Acute Lymphoblastic Leukemia, Version 2.2021, NCCN Clinical Practice Guidelines in Oncology. J. Natl. Compr. Cancer Netw. JNCCN 2021, 19, 1079–1109. [Google Scholar] [CrossRef] [PubMed]
- Wierda, W.G.; Brown, J.; Abramson, J.S.; Awan, F.; Bilgrami, S.F.; Bociek, G.; Brander, D.; Chanan-Khan, A.A.; Coutre, S.E.; Davis, R.S.; et al. NCCN Guidelines® Insights: Chronic Lymphocytic Leukemia/Small Lymphocytic Lymphoma, Version 3.2022. J. Natl. Compr. Cancer Netw. JNCCN 2022, 20, 622–634. [Google Scholar] [CrossRef] [PubMed]
- Narlı Özdemir, Z.; Kılıçaslan, N.A.; Yılmaz, M.; Eşkazan, A.E. Guidelines for the treatment of chronic myeloid leukemia from the NCCN and ELN: Differences and similarities. Int. J. Hematol. 2023, 117, 3–15. [Google Scholar] [CrossRef] [PubMed]
- Pollyea, D.A.; Altman, J.K.; Assi, R.; Bixby, D.; Fathi, A.T.; Foran, J.M.; Gojo, I.; Hall, A.C.; Jonas, B.A.; Kishtagari, A.; et al. Acute Myeloid Leukemia, Version 3.2023, NCCN Clinical Practice Guidelines in Oncology. J. Natl. Compr. Cancer Netw. JNCCN 2023, 21, 503–513. [Google Scholar] [CrossRef]
- Deininger, M.W.; Shah, N.P.; Altman, J.K.; Berman, E.; Bhatia, R.; Bhatnagar, B.; DeAngelo, D.J.; Gotlib, J.; Hobbs, G.; Maness, L.; et al. Chronic Myeloid Leukemia, Version 2.2021, NCCN Clinical Practice Guidelines in Oncology. J. Natl. Compr. Cancer Netw. JNCCN 2020, 18, 1385–1415. [Google Scholar] [CrossRef]
- Verma, D.; Kantarjian, H.M.; Jones, D.; Luthra, R.; Borthakur, G.; Verstovsek, S.; Rios, M.B.; Cortes, J. Chronic myeloid leukemia (CML) with P190 BCR-ABL: Analysis of characteristics, outcomes, and prognostic significance. Blood 2009, 114, 2232–2235. [Google Scholar] [CrossRef]
- Chen, Z.; Hu, S.; Wang, S.A.; Konopleva, M.; Tang, Z.; Xu, J.; Li, S.; Toruner, G.; Thakral, B.; Medeiros, L.J.; et al. Chronic myeloid leukemia presenting in lymphoblastic crisis, a differential diagnosis with Philadelphia-positive B-lymphoblastic leukemia. Leuk. Lymphoma 2020, 61, 2831–2838. [Google Scholar] [CrossRef]
- Abdelmagid, M.G.; Litzow, M.R.; McCullough, K.B.; Gangat, N.; Pardanani, A.; Murthy, H.S.; Foran, J.M.; Ketterling, R.P.; Viswanatha, D.; Begna, K.H.; et al. Chronic phase CML with sole P190 (e1a2) BCR::ABL1: Long-term outcome among ten consecutive cases. Blood Cancer J. 2022, 12, 103. [Google Scholar] [CrossRef]
- Mulas, O.; Caocci, G.; Annunziata, M.; Martino, B.; Luciano, L.; Castagnetti, F.; Pregno, P.; Galimberti, S.; Albano, F.; Orlandi, E.M.; et al. Favorable outcome of chronic myeloid leukemia co-expressing e13a2 and e14a2 transcripts, treated with nilotinib. Hematol. Oncol. 2020, 38, 607–610. [Google Scholar] [CrossRef]
- Marcé, S.; Xicoy, B.; García, O.; Cabezón, M.; Estrada, N.; Vélez, P.; Boqué, C.; Sagüés, M.; Angona, A.; Teruel-Montoya, R.; et al. Impact of BCR-ABL1 Transcript Type on Response, Treatment-Free Remission Rate and Survival in Chronic Myeloid Leukemia Patients Treated with Imatinib. J. Clin. Med. 2021, 10, 3146. [Google Scholar] [CrossRef]
- Salmon, M.; White, H.E.; Zizkova, H.; Gottschalk, A.; Motlova, E.; Cerveira, N.; Colomer, D.; Coriu, D.; Franke, G.N.; Gottardi, E.; et al. Impact of BCR::ABL1 transcript type on RT-qPCR amplification performance and molecular response to therapy. Leukemia 2022, 36, 1879–1886. [Google Scholar] [CrossRef] [PubMed]
- Gao, Q.; Liang, W.W.; Foltz, S.M.; Mutharasu, G.; Jayasinghe, R.G.; Cao, S.; Liao, W.W.; Reynolds, S.M.; Wyczalkowski, M.A.; Yao, L.; et al. Driver Fusions and Their Implications in the Development and Treatment of Human Cancers. Cell Rep. 2018, 23, 227–238.e223. [Google Scholar] [CrossRef] [PubMed]
- Yoshihara, K.; Wang, Q.; Torres-Garcia, W.; Zheng, S.; Vegesna, R.; Kim, H.; Verhaak, R.G. The landscape and therapeutic relevance of cancer-associated transcript fusions. Oncogene 2015, 34, 4845–4854. [Google Scholar] [CrossRef] [PubMed]
- Hu, X.; Wang, Q.; Tang, M.; Barthel, F.; Amin, S.; Yoshihara, K.; Lang, F.M.; Martinez-Ledesma, E.; Lee, S.H.; Zheng, S.; et al. TumorFusions: An integrative resource for cancer-associated transcript fusions. Nucleic Acids Res. 2018, 46, D1144–D1149. [Google Scholar] [CrossRef]
- Roberts, K.G.; Morin, R.D.; Zhang, J.; Hirst, M.; Zhao, Y.; Su, X.; Chen, S.C.; Payne-Turner, D.; Churchman, M.L.; Harvey, R.C.; et al. Genetic alterations activating kinase and cytokine receptor signaling in high-risk acute lymphoblastic leukemia. Cancer Cell 2012, 22, 153–166. [Google Scholar] [CrossRef]
- Roberts, K.G.; Li, Y.; Payne-Turner, D.; Harvey, R.C.; Yang, Y.L.; Pei, D.; McCastlain, K.; Ding, L.; Lu, C.; Song, G.; et al. Targetable kinase-activating lesions in Ph-like acute lymphoblastic leukemia. N. Engl. J. Med. 2014, 371, 1005–1015. [Google Scholar] [CrossRef]
- Gu, Z.; Churchman, M.; Roberts, K.; Li, Y.; Liu, Y.; Harvey, R.C.; McCastlain, K.; Reshmi, S.C.; Payne-Turner, D.; Iacobucci, I.; et al. Genomic analyses identify recurrent MEF2D fusions in acute lymphoblastic leukaemia. Nat. Commun. 2016, 7, 13331. [Google Scholar] [CrossRef]
- Fazio, G.; Bresolin, S.; Silvestri, D.; Quadri, M.; Saitta, C.; Vendramini, E.; Buldini, B.; Palmi, C.; Bardini, M.; Grioni, A.; et al. PAX5 fusion genes are frequent in poor risk childhood acute lymphoblastic leukaemia and can be targeted with BIBF1120. EBioMedicine 2022, 83, 104224. [Google Scholar] [CrossRef]
- Akkari, Y.M.N.; Baughn, L.B.; Dubuc, A.M.; Smith, A.C.; Mallo, M.; Dal Cin, P.; Diez Campelo, M.; Gallego, M.S.; Granada Font, I.; Haase, D.T.; et al. Guiding the global evolution of cytogenetic testing for hematologic malignancies. Blood 2022, 139, 2273–2284. [Google Scholar] [CrossRef]
- Eckardt, J.N.; Stasik, S.; Röllig, C.; Petzold, A.; Sauer, T.; Scholl, S.; Hochhaus, A.; Crysandt, M.; Brümmendorf, T.H.; Naumann, R.; et al. Mutated IKZF1 is an independent marker of adverse risk in acute myeloid leukemia. Leukemia 2023, 37, 2395–2403. [Google Scholar] [CrossRef] [PubMed]
- Paolino, J.; Tsai, H.K.; Harris, M.H.; Pikman, Y. IKZF1 Alterations and Therapeutic Targeting in B-Cell Acute Lymphoblastic Leukemia. Biomedicines 2024, 12, 89. [Google Scholar] [CrossRef] [PubMed]
- Pieters, R.; de Groot-Kruseman, H.; Fiocco, M.; Verwer, F.; Van Overveld, M.; Sonneveld, E.; van der Velden, V.; Beverloo, H.B.; Bierings, M.; Dors, N.; et al. Improved Outcome for ALL by Prolonging Therapy for IKZF1 Deletion and Decreasing Therapy for Other Risk Groups. J. Clin. Oncol. 2023, 41, 4130–4142. [Google Scholar] [CrossRef] [PubMed]


| Case # | Sex | Age (Year) | Diagnosis | Blast | Treatments | Follow-Up (Month) /Outcome | Outcome |
|---|---|---|---|---|---|---|---|
| 1 | M | 53 | CML-CP | 2% | dasatinib, ponatinib, asciminib | 6 | progression |
| 2 | F | 36 | CML, CP | 1% | dasatinib | 9 | PCyR |
| 3 | M | 38 | CML, CP | 2% | ponatinib | 12 | Died |
| 4 | M | 66 | CML, CP * | 15% | ponatinib | 4 | DMR |
| 5 | F | 62 | CML-BP | 90% | imatinib, nilotinib, bosutinib, ponatinib, bosutinib | 10 | CCyR |
| 6 | F | 65 | CML-BP | 93% | dasatinib | 10 | CCyR |
| 7 | M | 68 | CML-BP | 33% | mini-Hyper-CVD, blinatumomab, dasatinib | 1 | CR |
| 8 | F | 64 | B-ALL, Ph+ | 90% | blinatumomab, ponatinib. | 6 | PR |
| 9 | F | 45 | B-ALL, Ph+ | 85% | blinatumomab, ponatinib. | 10 | CR |
| 10 | M | 73 | B-ALL, Ph+ | 95% | blinatumomab, ponatinib. | 9 | CR |
| 11 | F | 60 | B-ALL, Ph+ | 67% | mini-Hyper-CVD, blinatumomab, dasatinib | 5 | CR |
| 12 | F | 41 | B-ALL, Ph+ | 95% | blinatumomab, ponatinib. | 1.5 | CR |
| Case | Karyotype | FISH Results | RT-PCR (Isoform, Level) | SVs by OGM | CNVs by OGM |
|---|---|---|---|---|---|
| 1 | 46,XY,t(9;22)(q34;q11.2)[20] | (ABL1,BCR)x2(ABL1 con BCRx1)[186/200] | e13a2 + e14a2/p210, 31.73% | t(9;22)(q34.12;q11.23)/BCR::ABL1 | 9q34.11q34.12(129120861_130847453)x1 |
| 2 | 46,XX,t(9;22)(q34;q11.2)[20] | (ABL1x3,BCRx2)(ABL1 con BCRx1)[177/200] | e13a2 + e14a2/p210, >100% | t(9;22)(q34.12;q11.23)/BCR::ABL1 | No |
| 3 | 46,XY,t(9;22)(q34;q11.2)[20] | (ABL1x3,BCRx2)(ABL1 con BCRx1)[181/200] | e13a2/p210, >100% | t(9;22)(q34.12;q11.23)/BCR::ABL1 | No |
| 4 | 46,XY,t(9;22)(q34;q11.2)[20] | (ABL1,BCR)x2(ABL1 con BCRx1)[184/200] | e13a2 + e14a2/p210, >100% | t(9;22)(q34.12;q11.23)/BCR::ABL1 | 9q34.11q34.12((128703248_130135561)x1 22q11.23q12.1(23592450_26715684)x1 |
| 5 | 46,XX,t(9;22)(q34;q11.2)[20] | (ABL1x3,BCRx2)(ABL1 con BCRx1)[182/200] | e13a2/p210, >100% | t(9;22)(q34.12;q11.23)/BCR::ABL1 | 2p12p11.2(80212101_84371148)x1 |
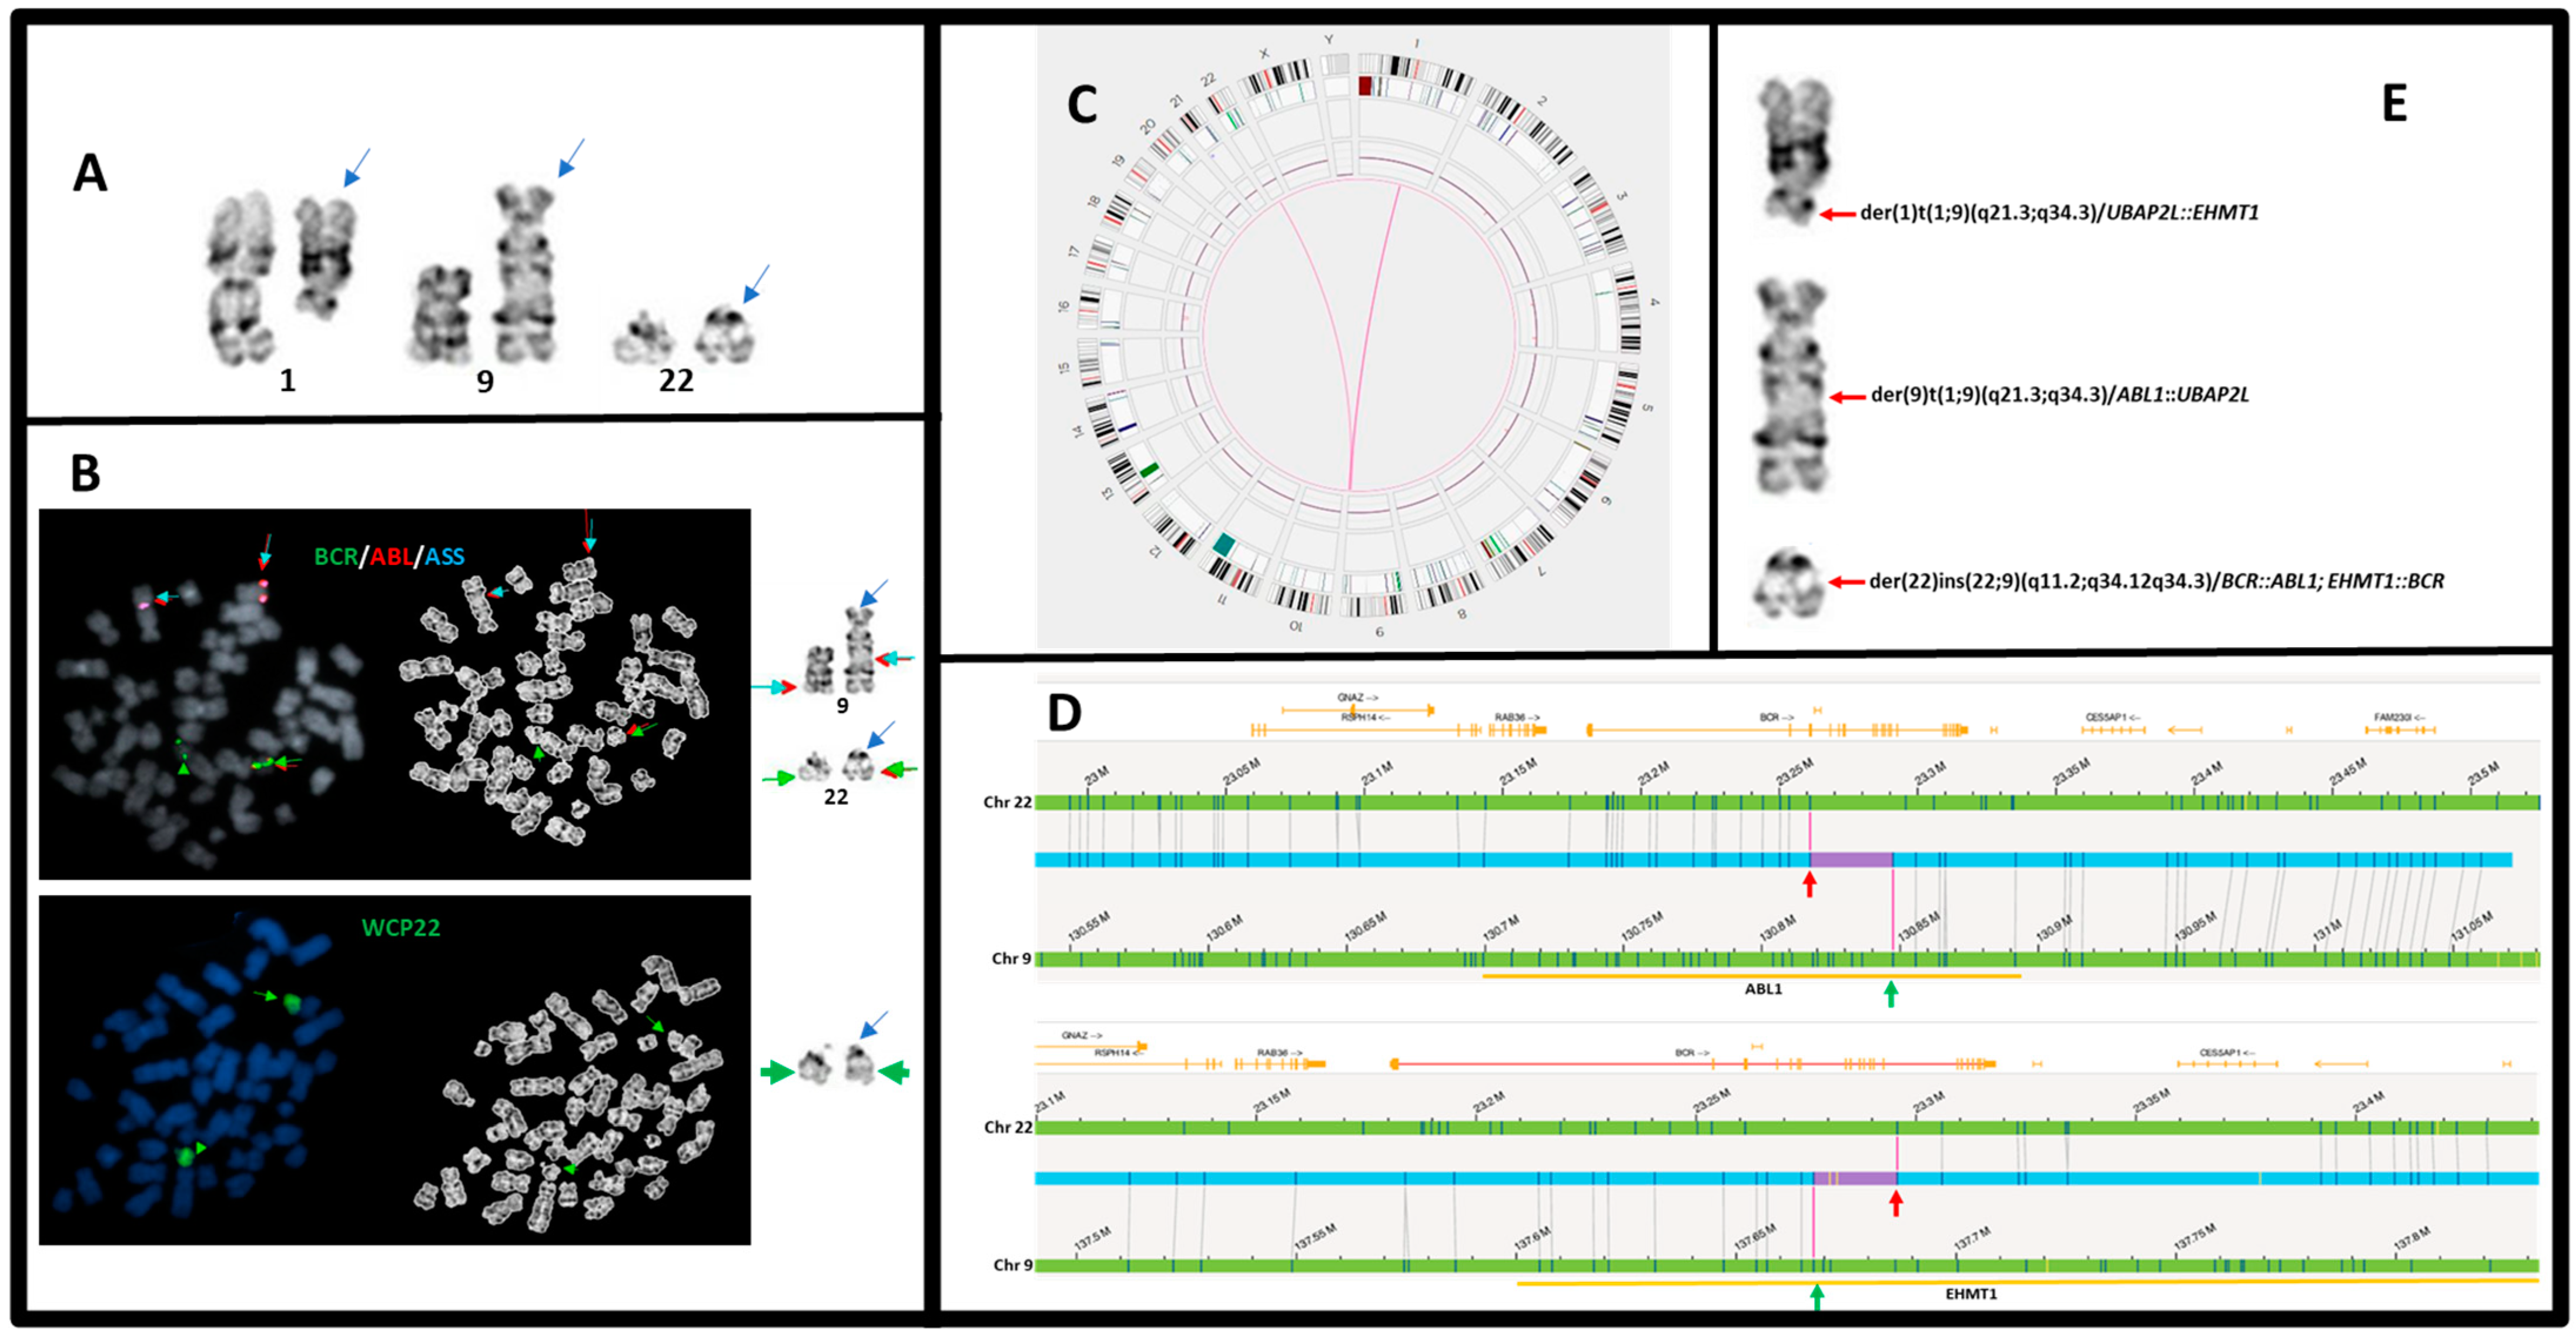
| 6 | 46,XX,der(1)t(1;9)(q21;q34),der(9)t(1;9)(q21;q34),der(22)ins(22;9)(q11.2;q34q34)[20] | (ABL1x3,BCRx2)(ABL1 con BCRx1)[186/200] | e13a2/p210, >100% | t(9;22)(q34.12;q11.23)/BCR::ABL1 t(1;9)(q21.3;q34.12)/UBAP2L::ABL1 t(1;9)(q21.3;q34.3)/UBAP2L::EHMT1 | 16q11.1q11.2(38277017_46457433)x1 |
| 7 | 45,XY,t(9;22)(q34;q11.2),psu dic(13;12)(q34;p11.1)[19]/46,XY[1] | (ABL1,BCR)x3(ABL1 con BCRx2)[150/200] | e1a2/p190, >100% | t(9;22)(q34.12;q11.23)/BCR::ABL1 t(5;12)(q33.3;p11.1)/EBF1::SYT10 t(5;13)(q33.3;q34) | 5q35.1q35.3(172452581_181472714)x1 7p12.2p12.2(50348483_50399656)x1 12p13.2p11.1(11630322_33424504)x1 |
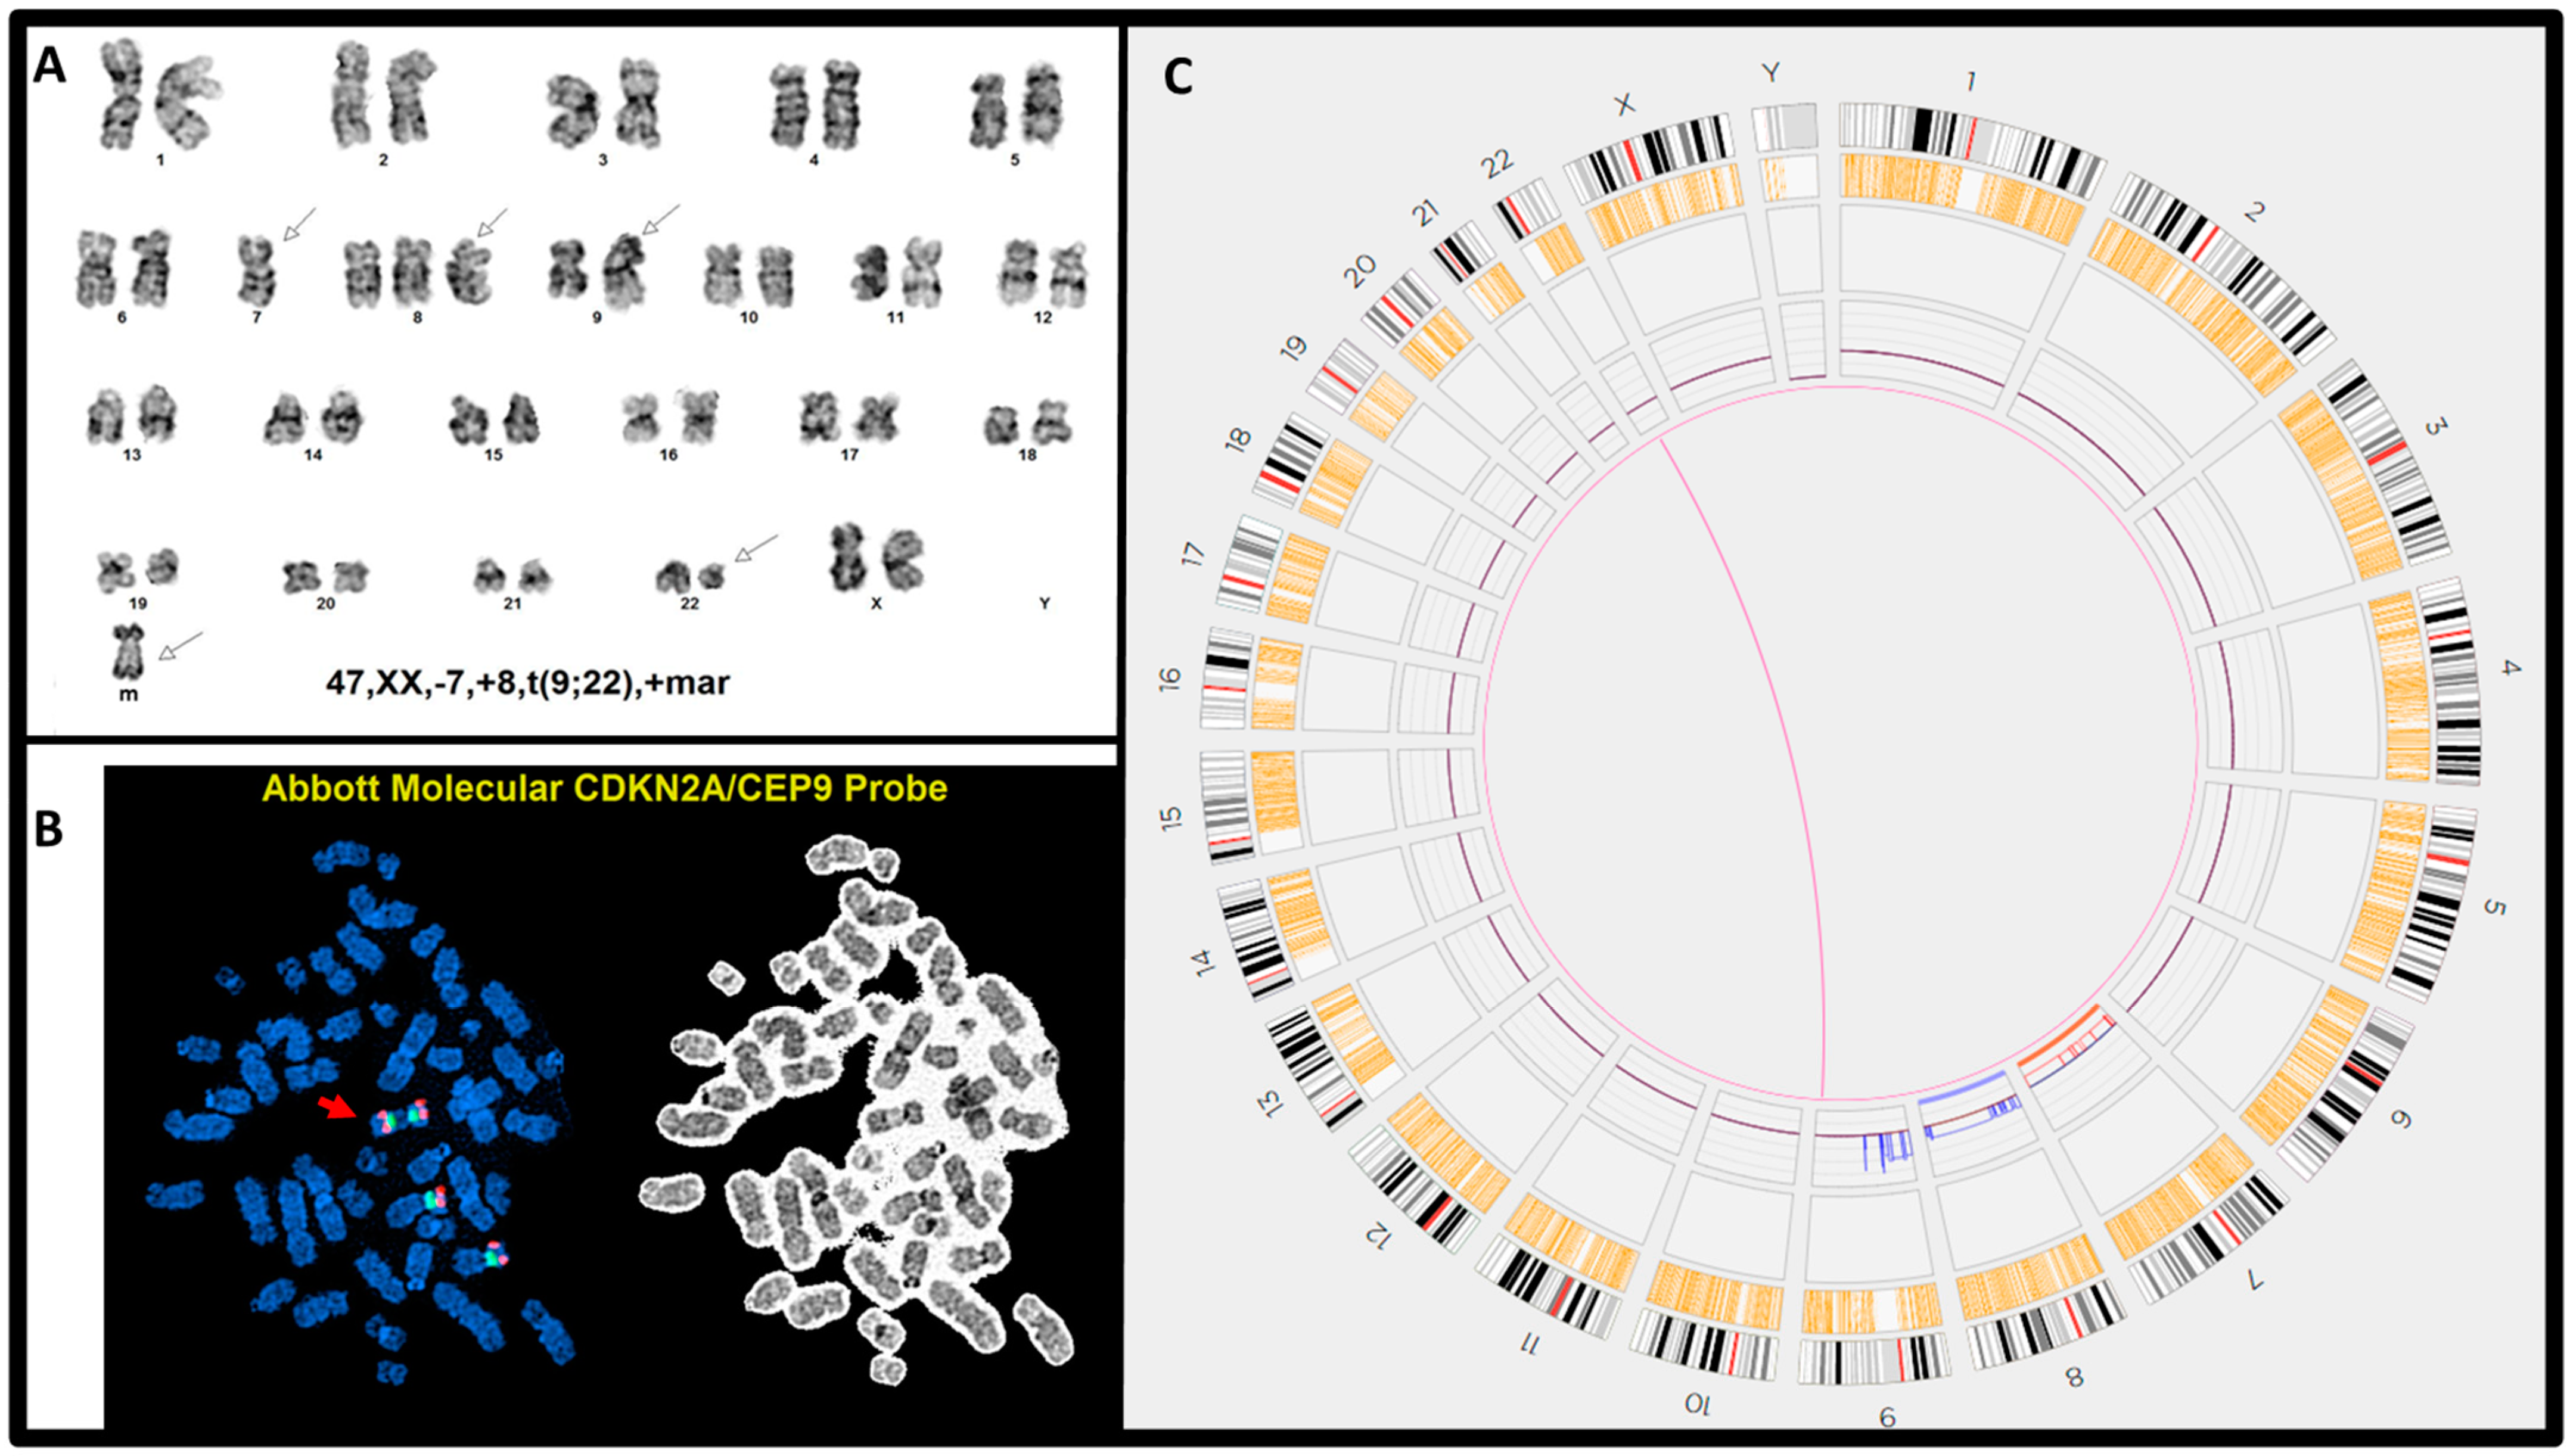
| 8 | 47,XX,-7,+8,t(9;22)(q34;q11.2),+mar[20] | (ABL1,BCR)x3(ABL1 con BCRx2)[189/200] (CDKN2A,CEP9)x4[194/200] | E1a3/p190, >100% | t(9;22)(q34.12;q11.23)/BCR::ABL1 | (7)x1 (8)x3 9p24.3q13(14566_64960054)x4 |
| 9 | 46,XX,r(7)[19]/46,XX,del(7)(q11.2q32)[1] | (ABL1,BCR)x3(ABL1 con BCRx1)[164/200] (D7Z1x2,D7S522x1)[92/200] | e1a2/p190, >100% | ins(22;9)(q11.23;q34.12q934.12)/BCR::ABL1 chromoanagenesis (7) | Numerous segmental loss on chr7 |
| 10 | 48,XY,del(6)(q13q23),der(9)del(9)(p13)t(9;22)(q34;q11.2),+21,der(22)t(9;22),+der(22)t(9;22)[9]/48~49,idem,+der(22)t(9;22),+mar[cp9]/46,XY[2] | (ABL1x5,BCRx4)(ABL1 con BCRx3)[118/200]/ (ABL1x4,BCRx3)(ABL1 con BCRx2)[75/200] | e14a2/p210, >100% | t(9;22)(q34.12;q11.23)/BCR::ABL1 chromoanagenesis (7,8) | 6p25.3q14.1(76216_77720354)x3 6q14.1q21(77721612_105275332)x1 8q12.3q24.3(64448847_140421018)x3 9p24.3p21.1(14566_31847914)x1 9p21.1p13.1(31858561_38843343)x0 9q34.12q34.3(130755223_138334464)x4 15q14q15.3(33563820_43499262)x1,(21)x3 22q11.21q11.23(18746350_23133605)x4 |
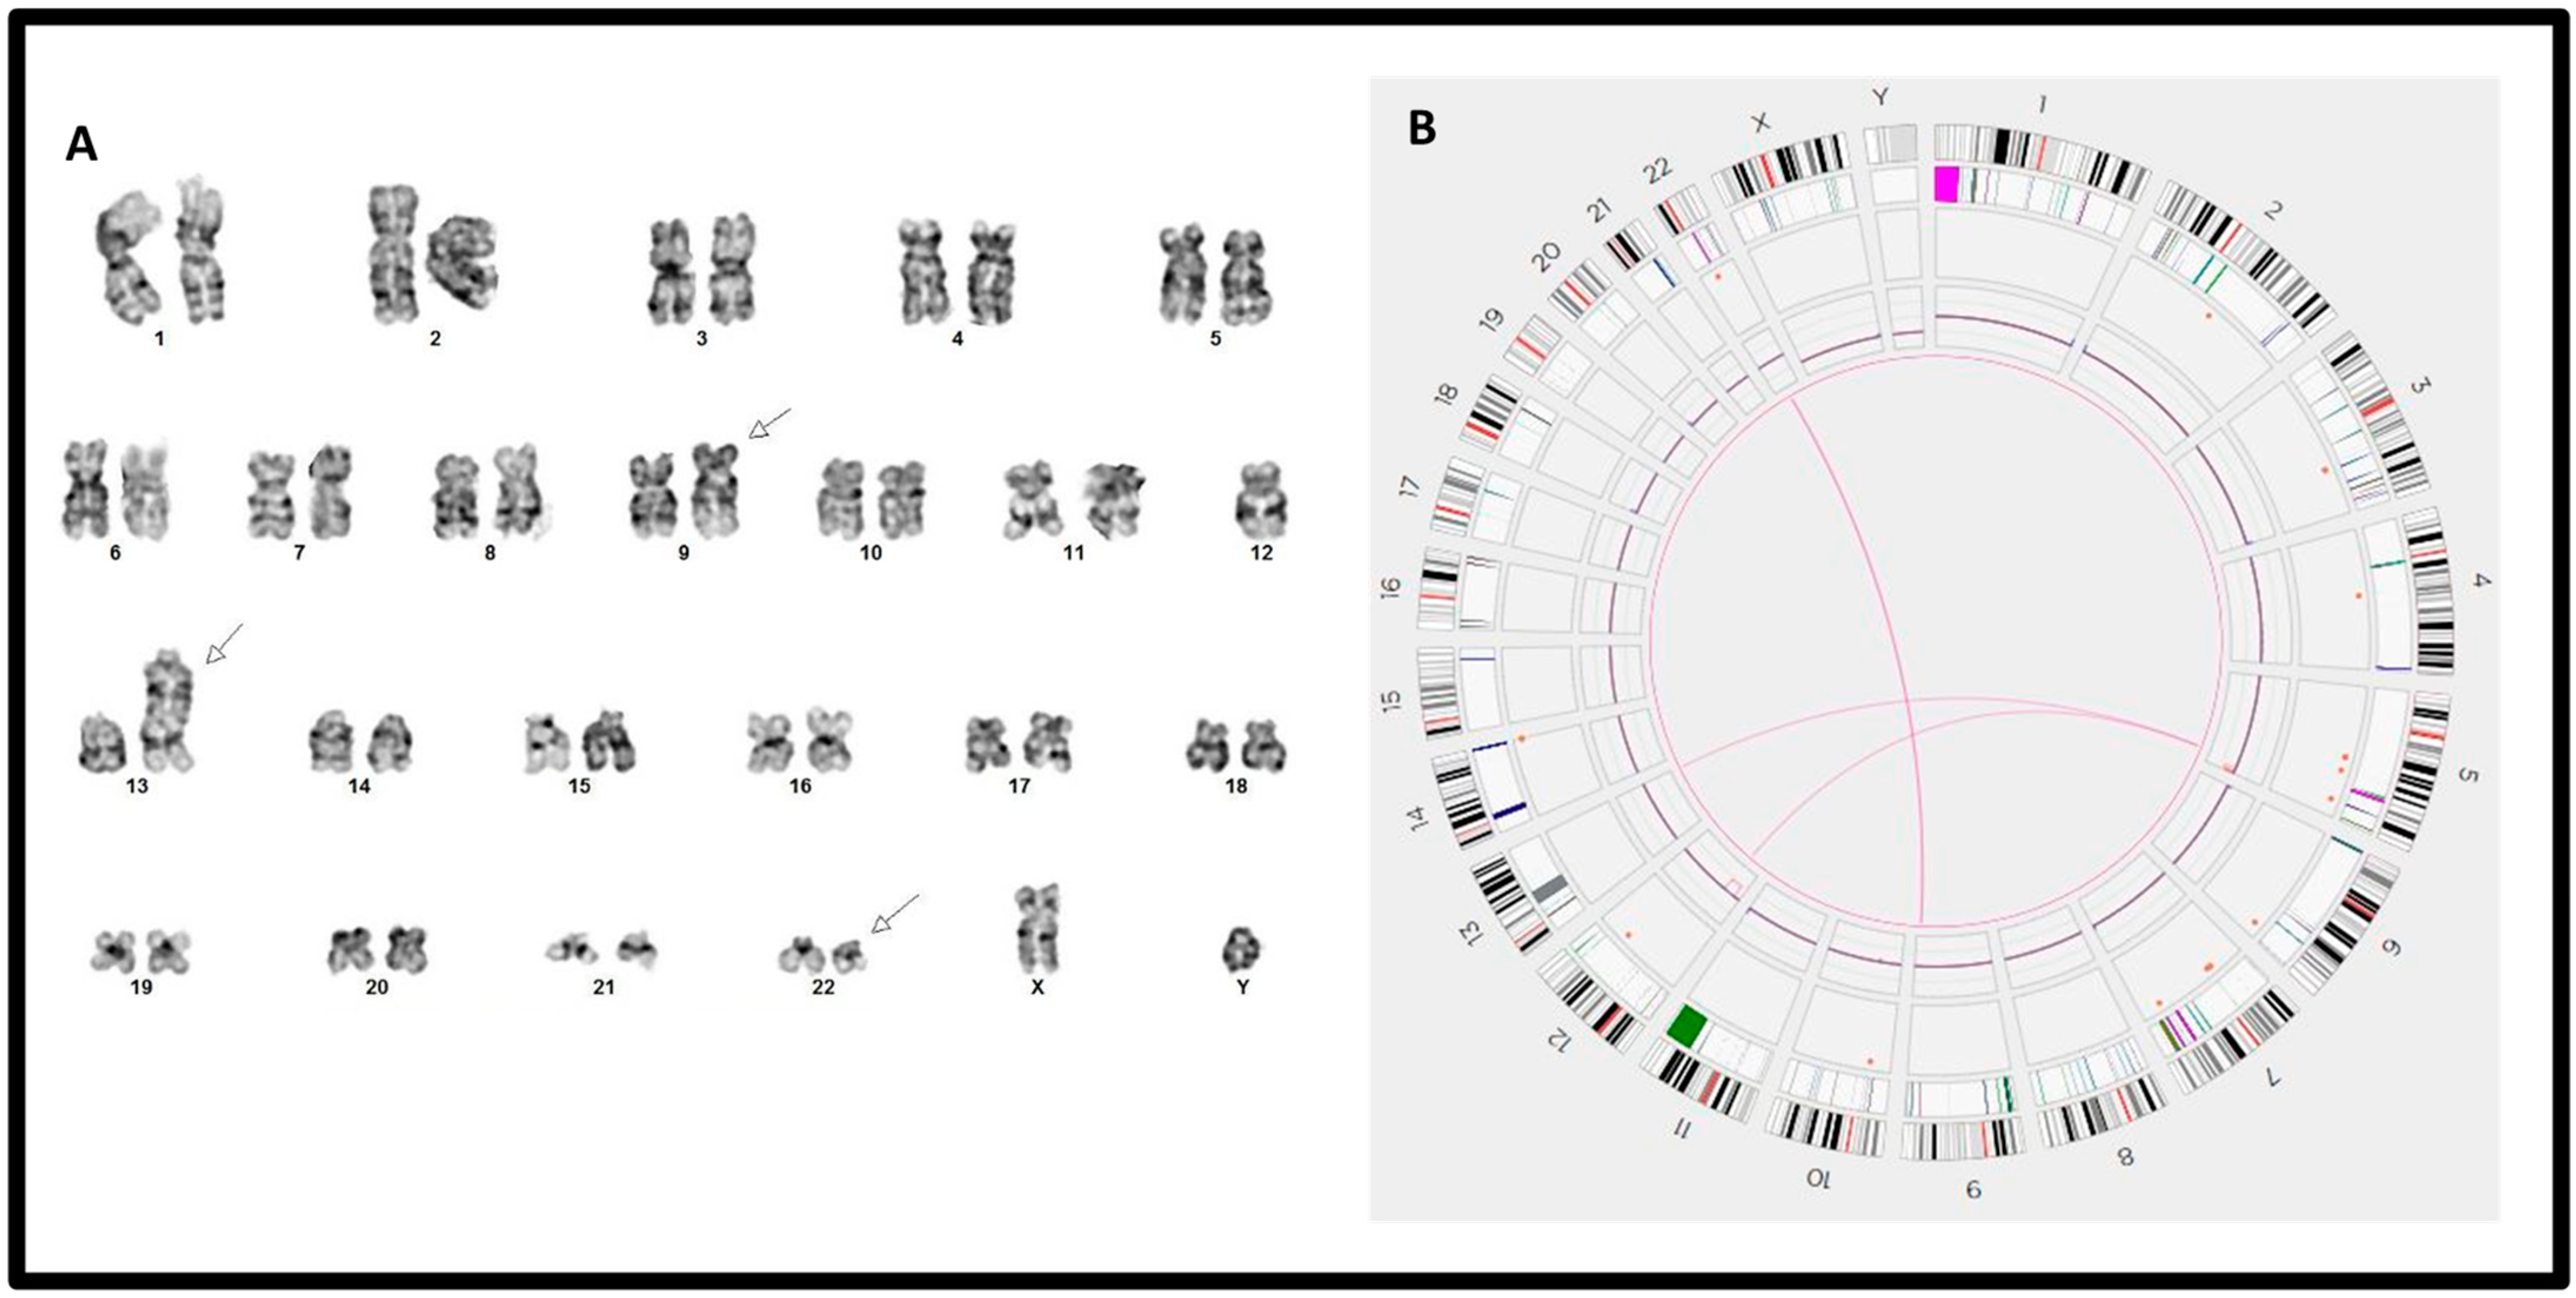
| 11 | 46,XX,t(9;22)(q34;q11.2)[10]/46,idem,del(20)(q11.2q13.1)[8]/46,idem,t(X;6)(q22;p23)[2] | (ABL1,BCR)x3(ABL1 con BCRx2)[184/200] | e1a2/p190, >100% | t(9;22)(q34.12;q11.23)/BCR::ABL1 t(X;6)(q22.1;p24.1)/TRMT2B t(3;15)(p25.2;q11.2)/RAF1 fus(6;6)(p24.3;p22.3) | 17q22q25(57433782_83246392)x3 20q11.23q13.33(31182877_61861320)x1 |
| 12 | 46,XX,der(8;9)(q10;q10),t(9;22)(q34;q11.2),+der(22)t(9;22)[20] | (ABL1,BCR)x4(ABL1 con BCRx3)[177/200]/ (ABL1,BCR)x3(ABL1 con BCRx2)[16/200] | e1a2/p190, >100% | t(9;22)(q34.12;q11.23)/BCR::ABL1 | 7p12.2p12.2(50273770_50399656)x1 8p23.3p11.2(61805_42571510)x1 9p24.3p12(14566_39591818)x1 9q34.12q34.3(130777258_138334464)x3 22p11.1q12.1(14545087_25515764)x3 |
| Case # | Aberrations | Chr. Involved * | Breakpoints of #1 Chr. | Breakpoints of #2 Chr. | Orientation | Confidence ** | VAF | Putative Gene Fusion | Putative BCR::ABL1 Isoform | Self Molecule Counts | ISCN | |||
|---|---|---|---|---|---|---|---|---|---|---|---|---|---|---|
| #1 | #2 | Breakpoint (bp) | Position in Gene | Breakpoint (bp) | Position in Gene | |||||||||
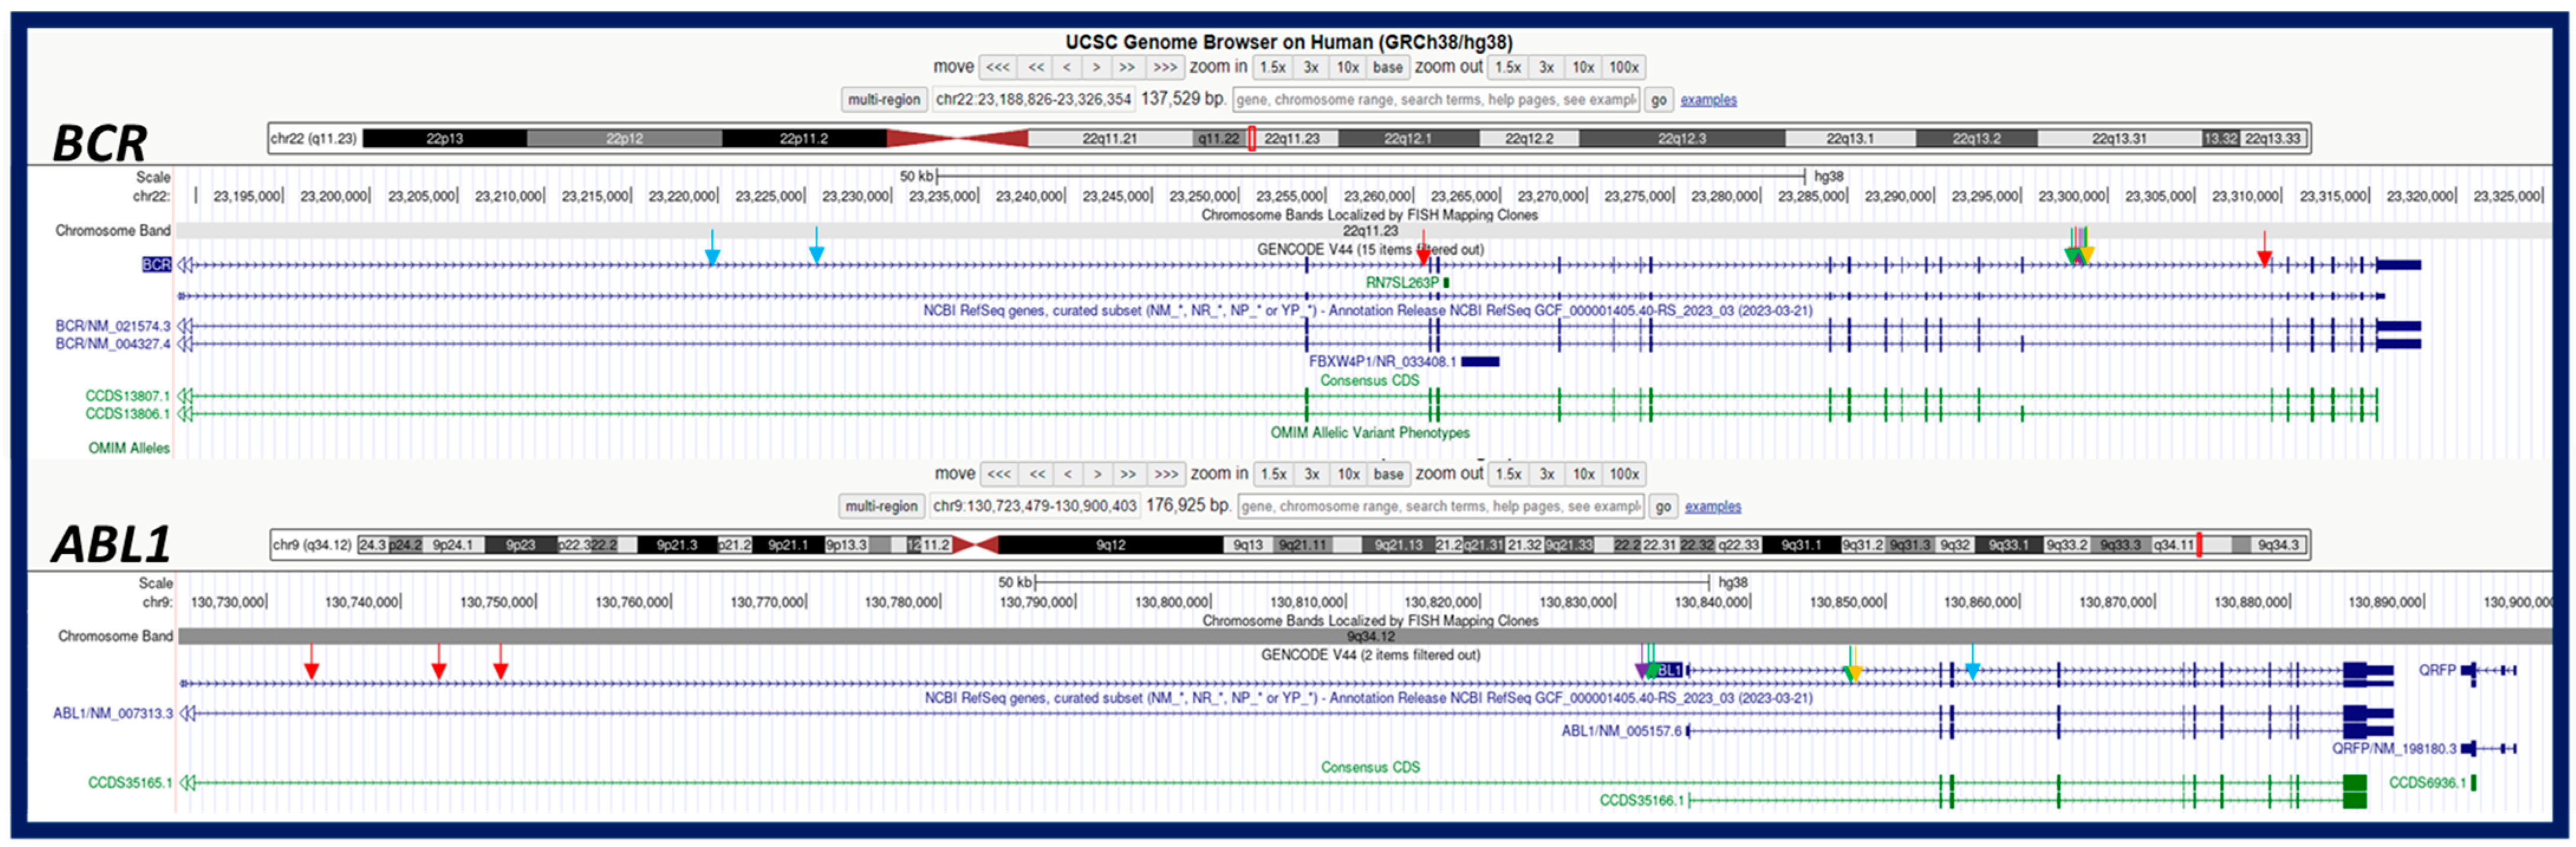
| 1 | transl._interchr. | 9 | 22 | 129,130,483 | PTPA: intron 4 | 23,295,730 | BCR1: intron 15 | +/+ | 0.87 | 0.38 | PTPA::BCR | N/A | 84 | ogm[GRCh38] t(9;22)(q34.11;q11.23) |
| transl._interchr. | 9 | 22 | 130,832,617 | ABL1: intron 1 | 23,295,730 | BCR1: intron 15 | +/+ | 0.98 | 0.53 | ABL1::BCR | e14a2/p210 | 84 | ogm[GRCh38] t(9;22)(q34.12;q11.23) | |
| deletion | 9 | 9 | 129,120,861 | PTPA: intron 1 | 130,847,453 | ABL1: intron 1 | N/A | 0.99 | 0.44 | - | N/A | 80 | ogm[GRCh38] 9q34.11q34.12(129120861_130847453)x1 | |
| 5 | transl._interchr. | 9 | 22 | 130,836,231 | ABL1: intron 1 | 23,295,730 | BCR1: intron 15 | +/+ | 1 | 0.5 | ABL1::BCR | e14a2/p210 | 83 | ogm[GRCh38] t(9;22)(q34.12;q11.23) |
| transl._interchr. | 9 | 22 | 130,847,453 | ABL1: intron 1 | 23,295,730 | BCR1: intron 15 | +/+ | 0.84 | 0.44 | ABL1::BCR | e14a2/p210 | 77 | ogm[GRCh38] t(9;22)(q34.12;q11.23) | |
| 6 | transl._interchr. | 9 | 1 | 137,686,151 | EHMT1: intron 1 | 154,225,651 | UBAP2L: intron 2 | +/+ | 0.95 | 0.28 | UBAP2L::EHMT1 | N/A | 72 | ogm[GRCh38] t(1;9)(q21.3;q34.3) |
| transl._interchr. | 9 | 1 | 137,732,949 | EHMT11: intron 4 | 154,225,651 | UBAP2L: intron 2 | +/+ | 0.97 | 0.28 | UBAP2L::EHMT1 | N/A | 95 | ogm[GRCh38] t(1;9)(q21.3;q34.3) | |
| transl._interchr. | 9 | 1 | 130,836,231 | ABL1: intron 1 | 154,231,851 | UBAP2L: intron 4 | +/+ | 0.98 | 0.51 | UBAP2L::ABL1 | N/A | 128 | ogm[GRCh38] t(1;9)(q21.3;q34.12) | |
| transl._interchr. | 9 | 22 | 130,847,453 | ABL1: intron 1 | 23,261,125 | BCR1: intron 3 | +/+ | 0.98 | 0.63 | ABL1::BCR | E2a2 | 110 | ogm[GRCh38] t(9;22)(q34.12;q11.23) | |
| transl._interchr. | 9 | 22 | 137,667,566 | EHMT1: intron 4 | 23,295,730 | BCR1: intron 15 | +/+ | 0.89 | 0.48 | EHMT1::BCR | N/A | 114 | ogm[GRCh38] t(9;22)(q34.3;q11.23) | |
| 8 | transl._interchr. | 9 | 22 | 130,847,453 | ABL1: intron 1 | 23,225,934 | BCR1: intron 1 | +/+ | 0.99 | 0.59 | ABL1::BCR | e2a2/p210 | 122 | ogm[GRCh38] t(9;22)(q34.12;q11.23) |
| transl._interchr. | 9 | 22 | 130,855,697 | ABL1: intron 3 | 23,219,177 | BCR1: intron 1 | +/+ | 0.96 | 0.61 | ABL1::BCR | e1a4/? | 88 | ogm[GRCh38] t(9;22)(q34.12;q11.23) | |
| 10 | transl._interchr. | 9 | 22 | 130,732,573 | ABL1: intron 1 | 23,295,730 | BCR1: intron 15 | +/+ | 0.93 | 0.48 | ABL1::BCR | e14a2/p210 | 64 | ogm[GRCh38] t(9;22)(q34.12;q11.23) |
| transl._interchr. | 9 | 22 | 130,743,975 | ABL1: intron 1 | 23,261,125 | BCR1: intron 3 | +/+ | 0.98 | 0.34 | ABL1::BCR | e3a2/? | 187 | ogm[GRCh38] t(9;22)(q34.12;q11.23) | |
| transl._interchr. | 9 | 22 | 130,747,294 | ABL1: intron 1 | 23,305,888 | BCR1: intron 15 | +/+ | 0.6 | 0.34 | ABL1::BCR | e14a2/p210 | 61 | ogm[GRCh38] t(9;22)(q34.12;q11.23) | |
| Chr Analysis | FISH | RT-PCR | OGM | |
|---|---|---|---|---|
| Detection power | ||||
| BCR::ABL1 fusion | Yes | Yes | Yes | Yes |
| Isoforms | No | p210 vs. p190 | Yes | Questionable |
| ACAs on der(9) | Yes | Yes | No | Yes |
| ACAs on der(22) | Yes | Yes | No | Yes |
| Other ACAs * | Yes | No | No | Yes |
| Translocation vs. insertion | Likely | Metaphase FISH | No | Likely |
| Sensitivity | 5% | 0.5–2% | 0.001–0.0001% | 10% |
| Single cell level | Yes | Yes | No | No |
| Turn-around time | 3–5 d | 4 h | 1–7 d | 5–7 d |
| Cost-effectiveness | Yes | Yes | Yes | No |
| Clinical application | ||||
| Initial diagnosis | Yes | Yes, quick result | Yes, isoform | Yes |
| Follow-up studies | Yes | Yes | Yes | Not for MRD |
| Refractory/Relapse | Yes | Yes | Yes | Yes |
Disclaimer/Publisher’s Note: The statements, opinions and data contained in all publications are solely those of the individual author(s) and contributor(s) and not of MDPI and/or the editor(s). MDPI and/or the editor(s) disclaim responsibility for any injury to people or property resulting from any ideas, methods, instructions or products referred to in the content. |
© 2024 by the authors. Licensee MDPI, Basel, Switzerland. This article is an open access article distributed under the terms and conditions of the Creative Commons Attribution (CC BY) license (https://creativecommons.org/licenses/by/4.0/).
Share and Cite
Tang, Z.; Wang, W.; Toruner, G.A.; Hu, S.; Fang, H.; Xu, J.; You, M.J.; Medeiros, L.J.; Khoury, J.D.; Tang, G. Optical Genome Mapping for Detection of BCR::ABL1—Another Tool in Our Toolbox. Genes 2024, 15, 1357. https://doi.org/10.3390/genes15111357
Tang Z, Wang W, Toruner GA, Hu S, Fang H, Xu J, You MJ, Medeiros LJ, Khoury JD, Tang G. Optical Genome Mapping for Detection of BCR::ABL1—Another Tool in Our Toolbox. Genes. 2024; 15(11):1357. https://doi.org/10.3390/genes15111357
Chicago/Turabian StyleTang, Zhenya, Wei Wang, Gokce A. Toruner, Shimin Hu, Hong Fang, Jie Xu, M. James You, L. Jeffrey Medeiros, Joseph D. Khoury, and Guilin Tang. 2024. "Optical Genome Mapping for Detection of BCR::ABL1—Another Tool in Our Toolbox" Genes 15, no. 11: 1357. https://doi.org/10.3390/genes15111357
APA StyleTang, Z., Wang, W., Toruner, G. A., Hu, S., Fang, H., Xu, J., You, M. J., Medeiros, L. J., Khoury, J. D., & Tang, G. (2024). Optical Genome Mapping for Detection of BCR::ABL1—Another Tool in Our Toolbox. Genes, 15(11), 1357. https://doi.org/10.3390/genes15111357