Article

Selection and Verification of Standardized Reference Genes of Angelica dahurica under Various Abiotic Stresses by Real-Time Quantitative PCR

1
College of Horticulture, Hunan Agricultural University, Changsha 410128, China
2
College of Bioscience and Biotechnology, Hunan Agricultural University, Changsha 410128, China
*
Authors to whom correspondence should be addressed.
These authors contributed equally to this work.
Genes 2024, 15(1), 79; https://doi.org/10.3390/genes15010079
Submission received: 13 December 2023 / Revised: 4 January 2024 / Accepted: 6 January 2024 / Published: 7 January 2024
(This article belongs to the Special Issue Genomics and Genetics of Medicinal Plants)

Abstract

:
In traditional Chinese medicine, Angelica dahurica is a valuable herb with numerous therapeutic applications for a range of ailments. There have not yet been any articles on the methodical assessment and choice of the best reference genes for A. dahurica gene expression studies. Real-time quantitative PCR (RT-qPCR) is widely employed as the predominant method for investigating gene expression. In order to ensure the precise determination of target gene expression outcomes in RT-qPCR analysis, it is imperative to employ stable reference genes. In this study, a total of 11 candidate reference genes including SAND family protein (SAND), polypyrimidine tract-binding protein (PTBP), glyceraldehyde-3-phosphate dehydrogenase (GAPDH), actin (ACT), TIP41-like protein (TIP41), cyclophilin 2 (CYP2), elongation factor 1 α (EF1α), ubiquitin-protein ligase 9 (UBC9), tubulin β-6 (TUB6), thioredoxin-like protein YLS8 (YLS8), and tubulin-α (TUBA) were selected from the transcriptome of A. dahurica. Subsequently, three statistical algorithms (geNorm, NormFinder, and BestKeeper) were employed to assess the stability of their expression patterns across seven distinct stimulus treatments. The outcomes obtained from these analyses were subsequently amalgamated into a comprehensive ranking using RefFinder. Additionally, one target gene, phenylalanine ammonia-lyase (PAL), was used to confirm the effectiveness of the selected reference genes. According to the findings of this study, the two most stable reference genes for normalizing the expression of genes in A. dahurica are TIP41 and UBC9. Overall, our research has determined the appropriate reference genes for RT-qPCR in A. dahurica and provides a crucial foundation for gene screening and identifying genes associated with the biosynthesis of active ingredients in A. dahurica.

1. Introduction

A. dahurica (Fisch. ex Hoffm.) Benth. & Hook. f. ex Franch. & Sav. is a perennial herb of the genus Angelica in the Apiaceae family, which has spread extensively throughout North, East, and Southeast Asia [1]. Numerous phytochemical studies of on this particular herb have revealed a variety of bioactive components, such as coumarins, volatile oils, glycosides, alkaloids, etc., with coumarins being the predominant compounds [1]. Latest pharmacological research has demonstrated that these components possess antibacterial, antioxidant, nerve-protection, and analgesic effects [2,3,4]. These chemical substances are often in low concentrations in plants since they are secondary metabolites produced during healthy growth or under stress conditions [5]. In order to augment their production, it is imperative to first elucidate the biosynthesis pathways involved and conduct a comprehensive profiling of gene expression pertaining to the synthesis of secondary metabolites [6,7]. This will help to provide a deeper understanding of gene functions [8]. In order to identify the transcription level of genes and improve our understanding of functional gene expression profiles, notably for coumarin production, its metabolic pathways, and regulatory mechanisms under various abiotic stresses, the identification of appropriate reference genes is urgently required.
Real-time quantitative PCR (RT-qPCR), which possesses high sensitivity, a simple operating system, and a broad range of mRNA abundance, has been extensively employed in the investigation of gene expression analysis [9]. However, several factors can impact the accuracy and reliability of RT-qPCR, such as RNA quality, the reverse transcription efficiency of cDNA, and PCR amplification efficiency [10,11]. The use of a suitable reference gene can reduce these possible inaccuracies, enabling the normalization of quantitative data across various samples. Ranking candidate reference gene expression stability under particular stresses and selecting the best candidate as the reference gene is the most dependable approach for selecting reference genes [12].
Typically, reference genes are chosen for their involvement in fundamental biochemical metabolism or the maintenance of the cytoskeleton include elongation factor 1 α (EF1α) [13], α-tubulin (TUB) [14], actin (ACT) [15], and glyceraldehyde 3-phosphate dehydrogenase (GAPDH) [16], and they are frequently selected as reference genes. However, these conventional reference genes are not always stably expressed under different conditions [17,18,19,20]. Therefore, it is essential to select suitable reference genes that maintain a steady level of expression under specific conditions. To make up for the deficiencies in traditional reference genes, some new reference genes have gradually been discovered and identified as candidate genes for standardization, such as TIP41-like protein (TIP41) [17], thioredoxin-like protein YLS8 (YLS8) [21], and SAND family protein (SAND) [22], among others. Nevertheless, a systematic evaluation of reference gene selection in A. dahurica under abiotic stress remains unreported, underscoring the necessity of identifying and validating stable reference genes in A. dahurica to facilitate the accurate normalization of target gene expression.
Moreover, previous studies have indicated that plants subjected to abiotic stress exhibit increased yields of secondary metabolites, accompanied by changes in the expression levels of relevant biosynthetic genes [23,24,25]. It has been demonstrated that the application of methyl jasmonate (MeJA) leads to an augmentation in the synthesis and accumulation of tanshinones and phenolic acids within the hairy roots of Salvia miltiorrhiza. This effect is achieved through the upregulation of genes associated with ketone and phenolic acid biosynthesis [24]. After UV-C treatment, the physiological and biochemical parameters of cherry plants were found to have undergone significant changes, with the most notable impact on gene expression occurring in the phenylalanine metabolic pathway. This treatment stimulated the accumulation of flavonoids, anthocyanins, phenolic acids, and other related substances, thereby enhancing the antioxidant activity and nutritional value of the cherries [25]. Presently, there exists a dearth of research pertaining to the selection and evaluation of suitable reference genes in A. dahurica under abiotic stress conditions.
The use of unverified reference genes may lead to completely wrong conclusions. In previous studies, it has been common practice to select functional genes associated with the biosynthesis pathway for expression analysis and verification, thereby ensuring the precision of experimental outcomes [7,11,13]. Within the phenylpropane metabolism pathway, phenylalanine ammonia-lyase (PAL) serves as the principal and rate-limiting enzyme responsible for governing the anabolic processes involved in the synthesis of coumarin, flavonoids, and alkaloids [26,27,28]. As a result, the target gene is AdPAL, whose expression provides evidence for the validity of the selected reference gene.
In this study, 11 reference genes were selected based on the transcriptome data of A. dahurica to investigate the candidate genes most suitable for gene standardization. To comprehensively assess the stability of these genes, various external experimental treatments were applied to the plants. The original RT-qPCR data was analyzed using three statistical algorithms: geNorm, NormFinder, and BestKeeper. The comprehensive stability of these reference genes was sorted by RefFinder. To verify the suitability of the chosen candidate genes and ensure the integrity of the results, the most stable and unstable reference genes found in this study were used to measure the relative expression levels of AdPAL utilizing RT-qPCR. In summary, the findings lay the foundation for future investigations into the expression patterns and regulatory mechanisms of the gene for coumarin biosynthesis under various abiotic stresses.

2. Materials and Methods

2.1. Plant Materials and Stress Treatments

The experimental plants were potted and cultivated in the greenhouse of the medicinal botanical garden at Hunan Agricultural University (HUNAU). One-year-old A. dahurica plants were selected as the experimental subjects. For different hormone treatments, 100 μM methyl jasmonate (MeJA), 100 μM salicylic acid (SA), 100 μM abscisic acid (ABA), and 100 μM ethylene (ETH) were used to treat the plants’ leaves. Drought stress was simulated by treating the plant leaves with 100 μM mannitol. Salt stress was induced by treating plant leaves with 100 μM sodium chloride (NaCl). For heavy metal stress, 100 μM copper sulfate (CuSO4) was applied to the plants. A sterile water-treated plant was used as a control. Afterward, the leaves were sampled separately at 24 h for subsequent expression analysis. Prior to use, all samples were promptly filtered with double distilled water, frozen in liquid nitrogen, and placed in an −80 °C freezer. Each group of samples included three biological replicates.

2.2. Total RNA Isolation and cDNA Synthesis

The Prep Pure Kit (Tiangen Biotech, Beijing, China) was used to extract RNA from approximately 100 mg of the various frozen samples. The determination of both the quality and purity of the extracted total RNA was conducted using Micro-volume spectrophotometer (Shanghai BIO-DL Science Instrument Co., Ltd., Shanghai, China), while the integrity of the RNA was confirmed through electrophoresis on a 1% agarose gel. For the next experiment, only RNA samples with A260/280 ratio of 1.8 to 2.2 and A260/230 ratio higher than 2.0 were used. Then, in order to dispose of contamination genomic DNA, the RNA samples (300 ng) were processed with RNase-free DNase I (U) (Takara, Dalian, China). For qPCR, the HiScript Q RT SuperMix (Vazyme, Nanjing, China) was utilized to generate first-strand cDNA using oligo (dT) as a primer. The final cDNA samples were diluted by a factor of five using RNase-free water, resulting in a final volume of 100 μL. These diluted samples were subsequently stored at −20 °C.

2.3. Selection of Candidate Reference Genes and Primer Design

The transcriptome data of A. dahurica were used to determine a total of 11 reference genes (NCBI accession number: SRP289220). Using the BioEdit Sequence Alignment Editor (v7.0.9) program, potential single genes were screened and selected through local BLAST (TBLASTN). Matching homologues of these reference genes were obtained from Arabidopsis Information Resource (TAIR) database (http://www.arabidopsis.org, accessed on 25 September 2023). Single genes were chosen for additional examination based on their higher scores and lower E values. The Beacon Design tool (v7.9.1) was employed to design primers for each gene, with specific characteristics such as an amplicon length between 90 and 200 bp, GC content ranging from 40% to 60%, primer length of 18 to 24 bp, temperature difference between forward and reverse primers less than 1 °C, and melting temperature (Tm) between 40 °C and 55 °C. To determine optimal primer pair combination, all primers were tested by standard PCR, and the products were examined using 1.0% agarose gel electrophoresis. Furthermore, the standard curves was determined with five distinct cDNA dilutions. The formula for calculating the PCR amplification efficiency (E) was E = [10(−1/slope) − 1] × 100% [29]. Table 1 provides a list of all gene-specific primer pairs designed for the RT-qPCR analysis.

2.4. RT-qPCR Conditions

The RT-qPCR analysis was carried out utilizing a SYBR Green Premix Pro Taq HS qPCR Kit (High Rox Plus) (Accurate Biotechnology (Hunan) Co., Ltd., Changsha, China) on a 96-well plate with an ABI 7300 real-time PCR system (Applied Biosystems). Each reaction’s final volume was 10 μL with the following ingredients: 0.5 μL diluted cDNA template, 5 μL 2X SYBR Green Pro Taq HS Premix (High Rox Plus), 0.5 μL forward primer (2.5 μM), 0.5 μL reverse primer (2.5 μM), and 3.5 μL ddH2O (double distilled H2O). The reaction was conducted under the following conditions: 95 °C for 3 min, followed by 40 cycles of denaturation at 95 °C for 10 sec, and annealing/extension at 60 °C for 30 s. The melting curve was obtained by melting the amplified template from 65 to 95 °C whilst increasing the temperature by 0.5 °C per cycle. Each RT-qPCR analysis included three technical replicates.

2.5. Stability Evaluation of Candidate Reference Genes

The average Ct values from three biological replicates were utilized for data analysis, and all results are shown as the mean ± standard error of the mean (SEM). Consequently, the t-test was used to conduct a statistical analysis. The stability of candidate reference genes was evaluated using geNorm (ver.3.5) [30], NormFinder (ver.0.953) [31], and BestKeeper (ver.1.0) [32] according to the manufacturer’s instructions. To assess the relative expression level for each gene in geNorm and NormFinder, the mean Ct value of three biological replicates was obtained using the formula 2−ΔCt (ΔCt being the Ct value of each sample minus the lowest Ct value) [33]. BestKeeper directly utilized the mean Ct values in the analysis. Ultimately, a thorough stability ranking analysis was carried out with the aid of RefFinder (https://www.heartcure.com.au/reffinder/, accessed on 25 September 2023) [34,35].

2.6. Validation of Reference Gene Stability

To identify the stability of the selected reference genes, the expression level of AdPAL, which is involved in coumarin biosynthesis in A. dahurica [36], was determined using RT-qPCR analysis. The expression patterns of AdPAL in samples of A. dahurica under various abiotic stresses were normalized using the two most (alone or in combination) and the least stable reference genes as recommended by RefFinder. The 2−ΔΔCT method, widely employed for assessing relative changes in gene expression, was utilized to compute target gene relative expression data [37]. Three technical duplicates of each biological material were used for analysis.

3. Results

3.1. Selection of Candidate Reference Genes, Evaluation of Amplification Specificity, and PCR Efficiency

Based on the transcriptome data of A. dahurica, we carefully selected 11 genes as potential reference genes. Table S1 shows the sequence information of the 11 potential reference genes. Table 1 presents the gene symbol, gene name, forward and reverse primers, melting temperature (Tm), amplicon size, RT-qPCR efficiency (E), and correlation coefficient (R2). Subsequently, the specificity of the RT-qPCR primers was confirmed through the use of gel electrophoresis and melting curve analyses. The analysis of 1% agarose gel electrophoresis revealed the presence of a single amplicon, aligning with the anticipated fragment size, following PCR amplification of all potential reference genes (Figure S1). Furthermore, the melting curve analysis exhibited distinct amplification peaks for all primer sets (Figure S2). The RT-qPCR efficiency ranged from 94% to 109%, and the correlation coefficients (R2) ranged from 0.9886 to 0.9973, as determined by generating a series of standard curves through cDNA dilution amplification (Table 1).

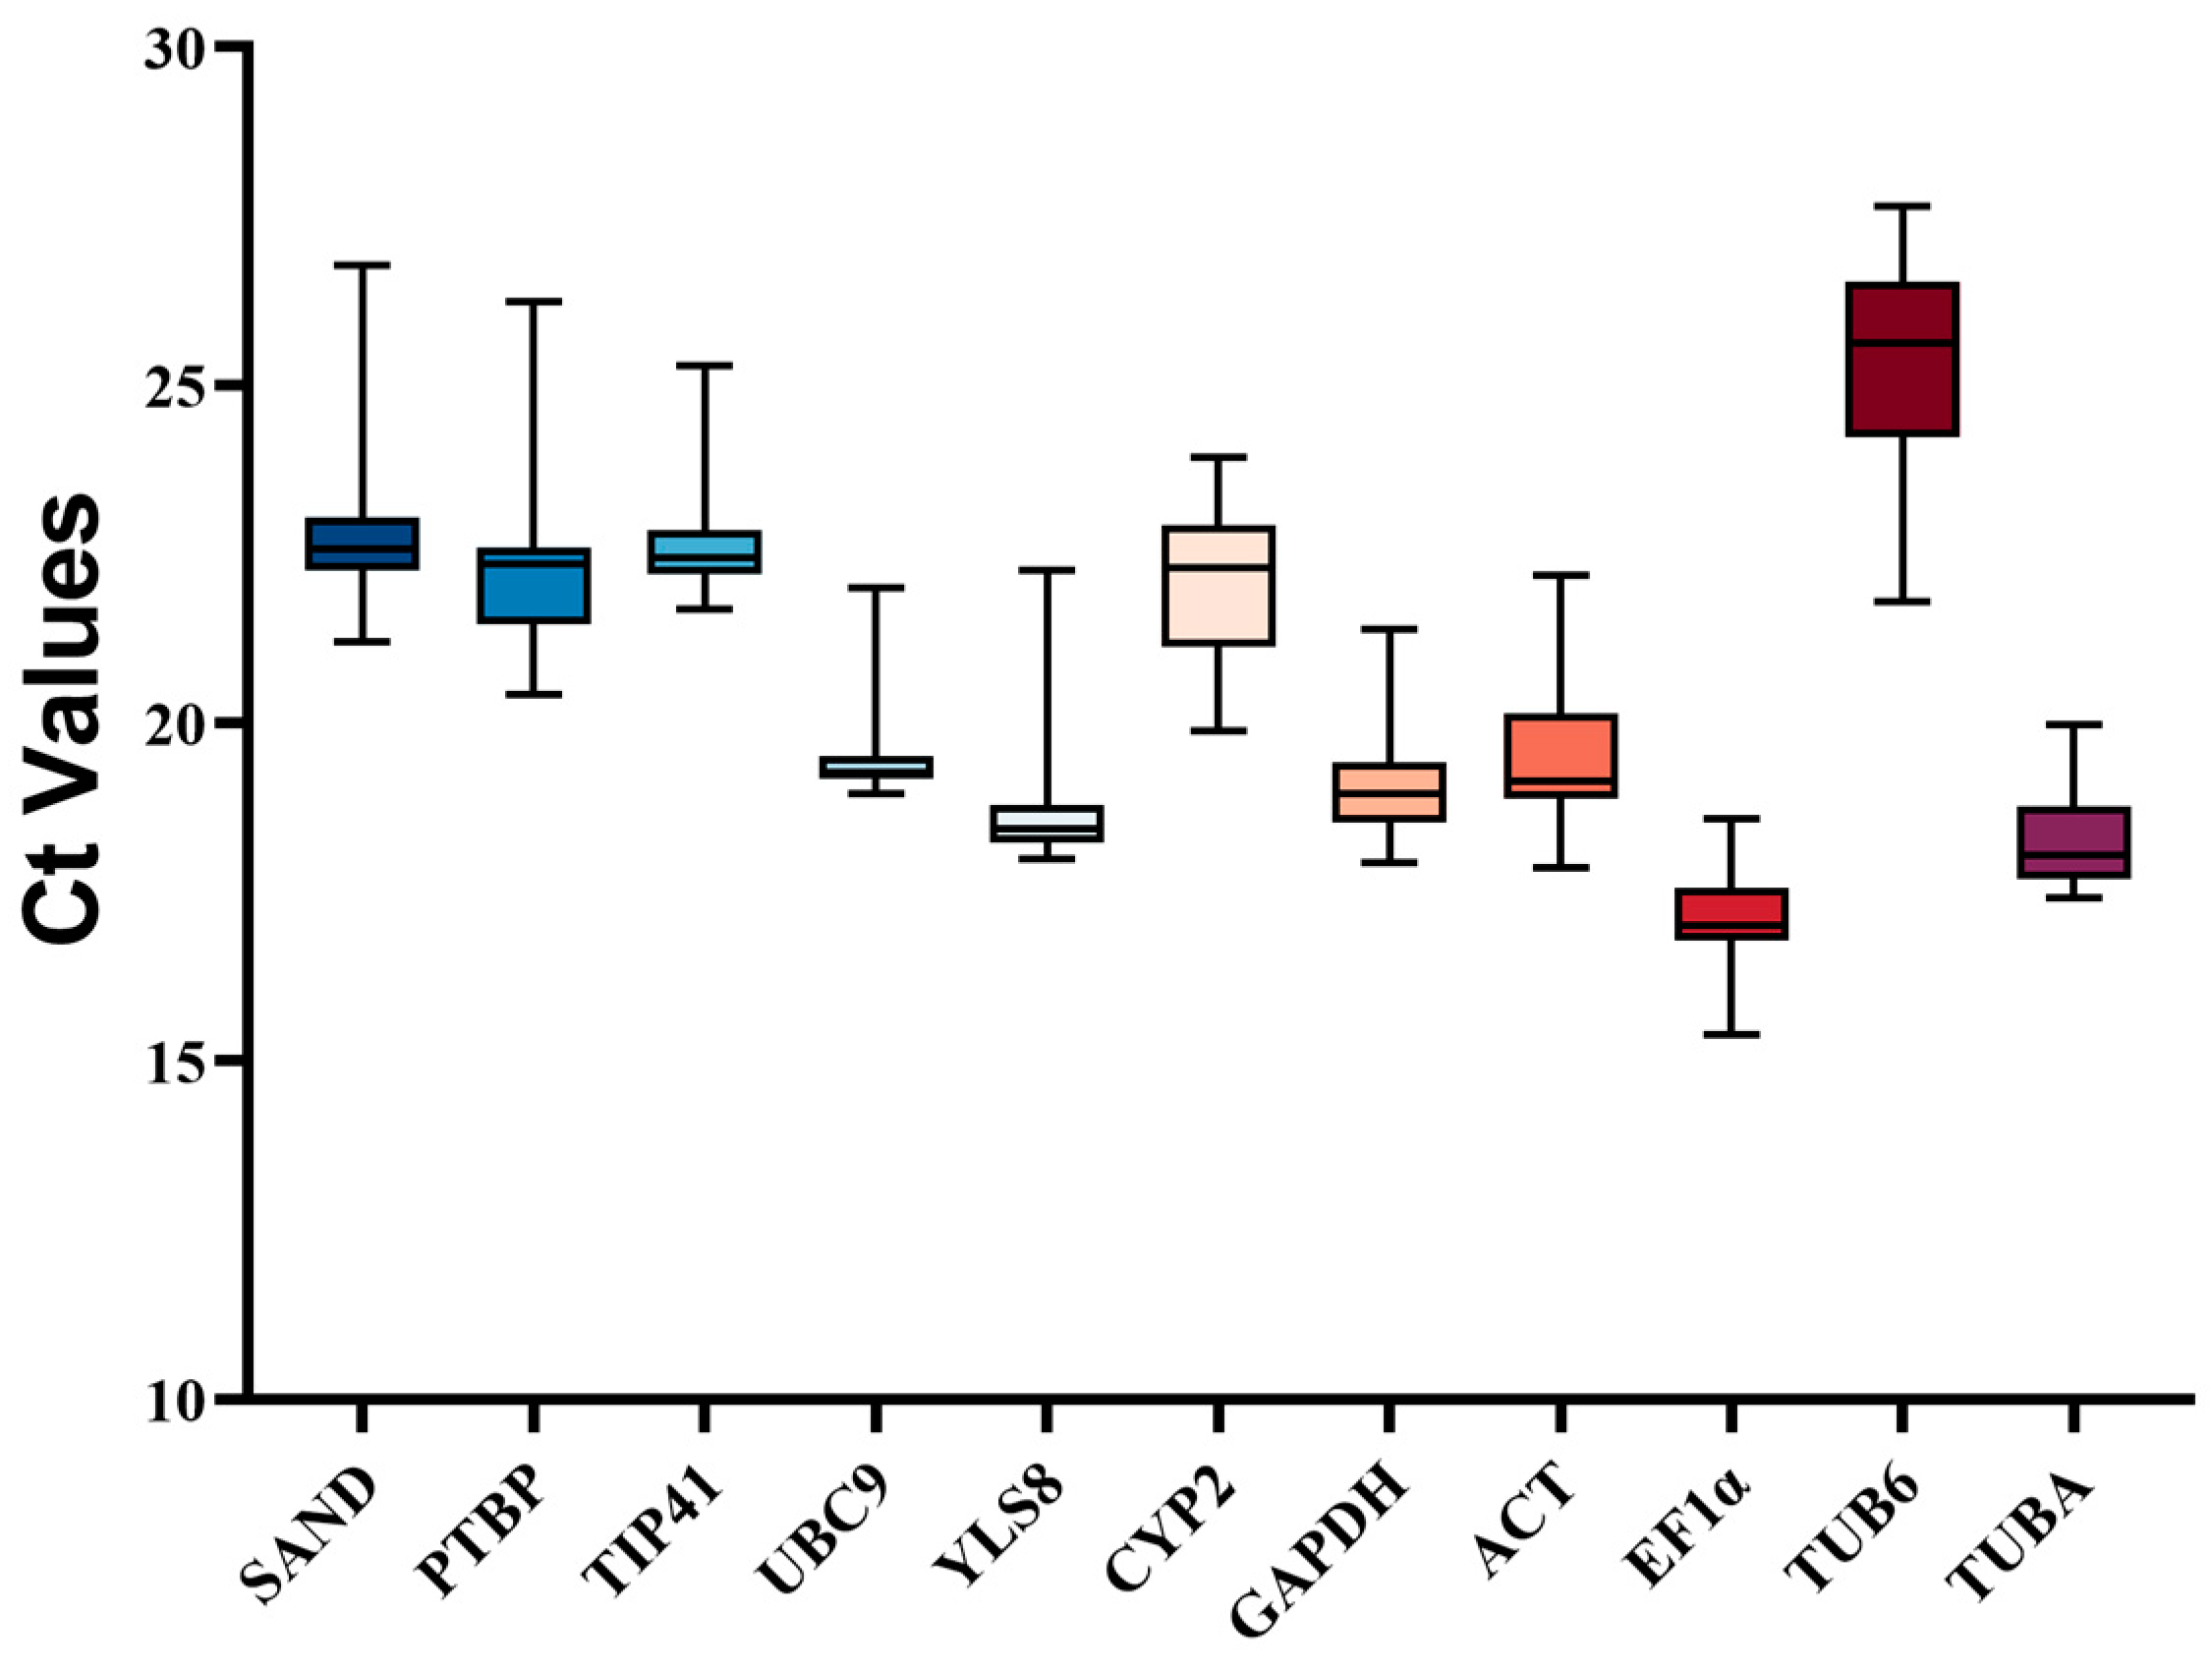
3.2. Expression Profile of Candidate Reference Genes

The cycle threshold values (Ct) were employed to measure the number of cycles required for the generated fluorescent signal to reach a detectable level. On the basis of these Ct values, the expression profile of the potential reference genes was consequently computed. The Ct values of these 11 reference genes are distributed between 15 and 25 (Figure 1 and Table S2). Notably, among these genes, EF1α exhibited the highest expression level due to it possessing the lowest Ct value. However, given the intricacy of their surroundings, it is imperative to carefully assess the appropriate utilization of these reference genes in different experimental conditions. Hence, the use of other statistical software (geNorm (ver.3.5), NormFinder (ver.0.953), and BestKeeper (ver.1.0) utilization and additional analyses are warranted.

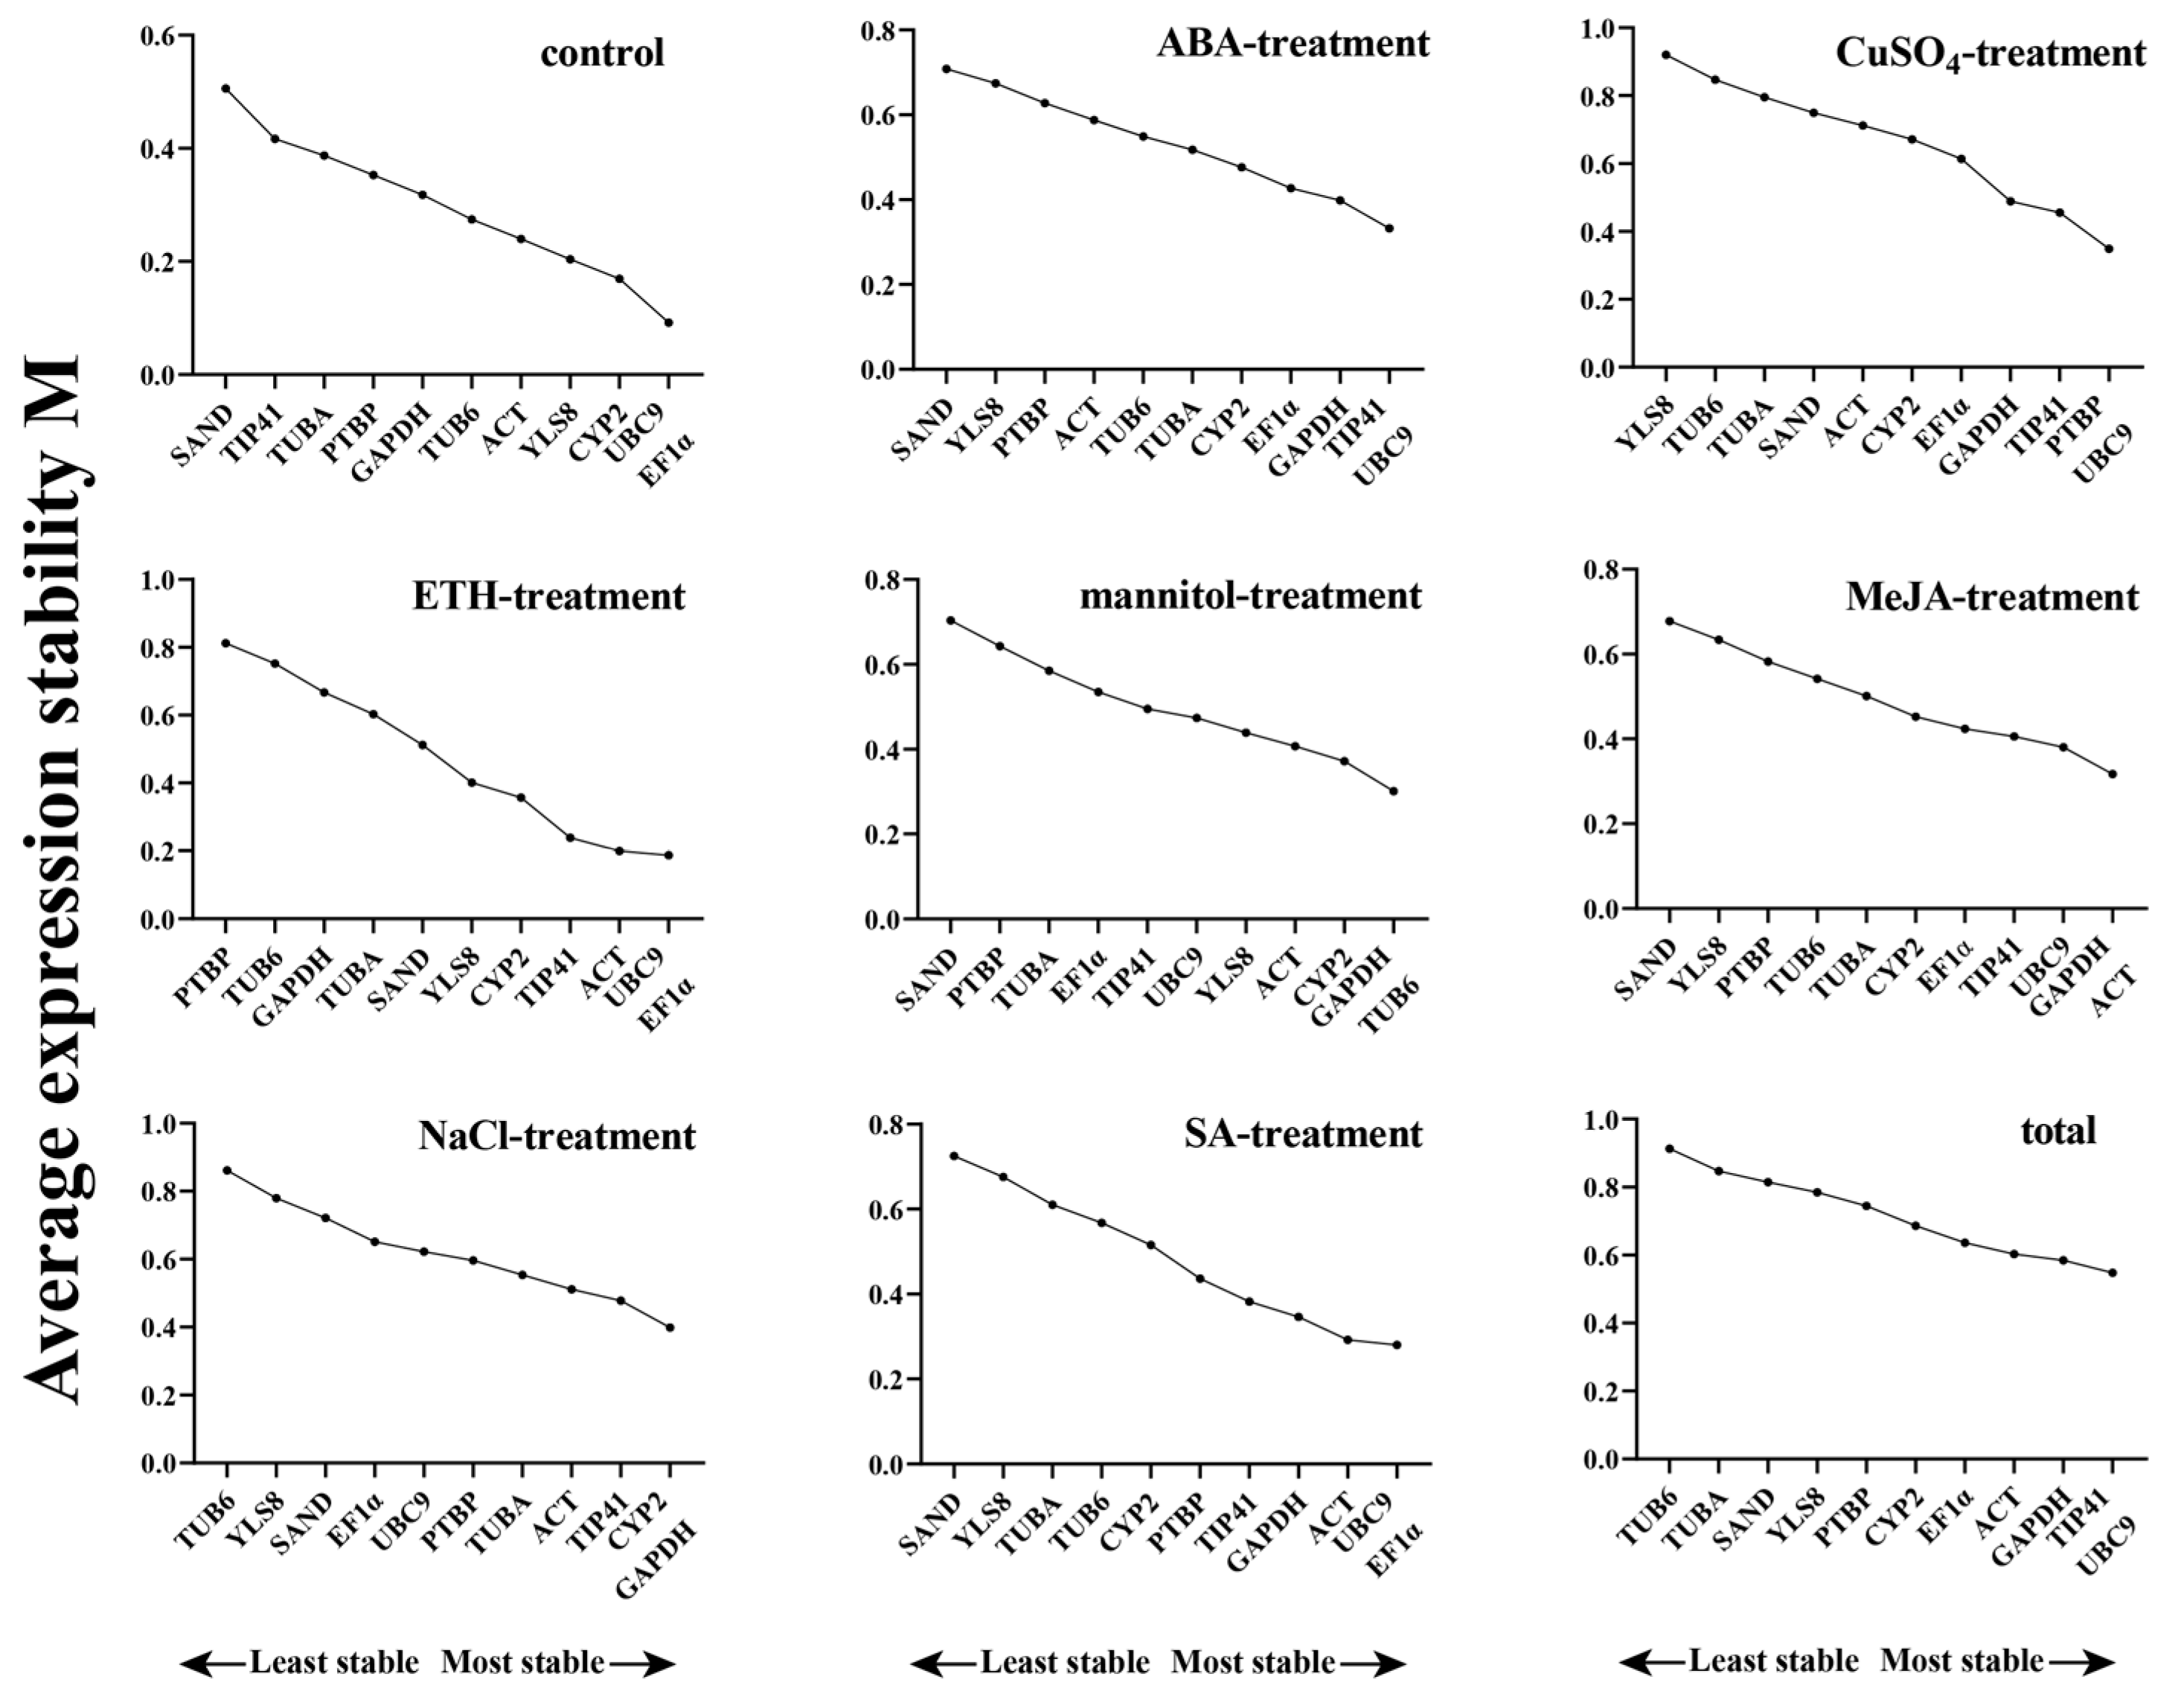
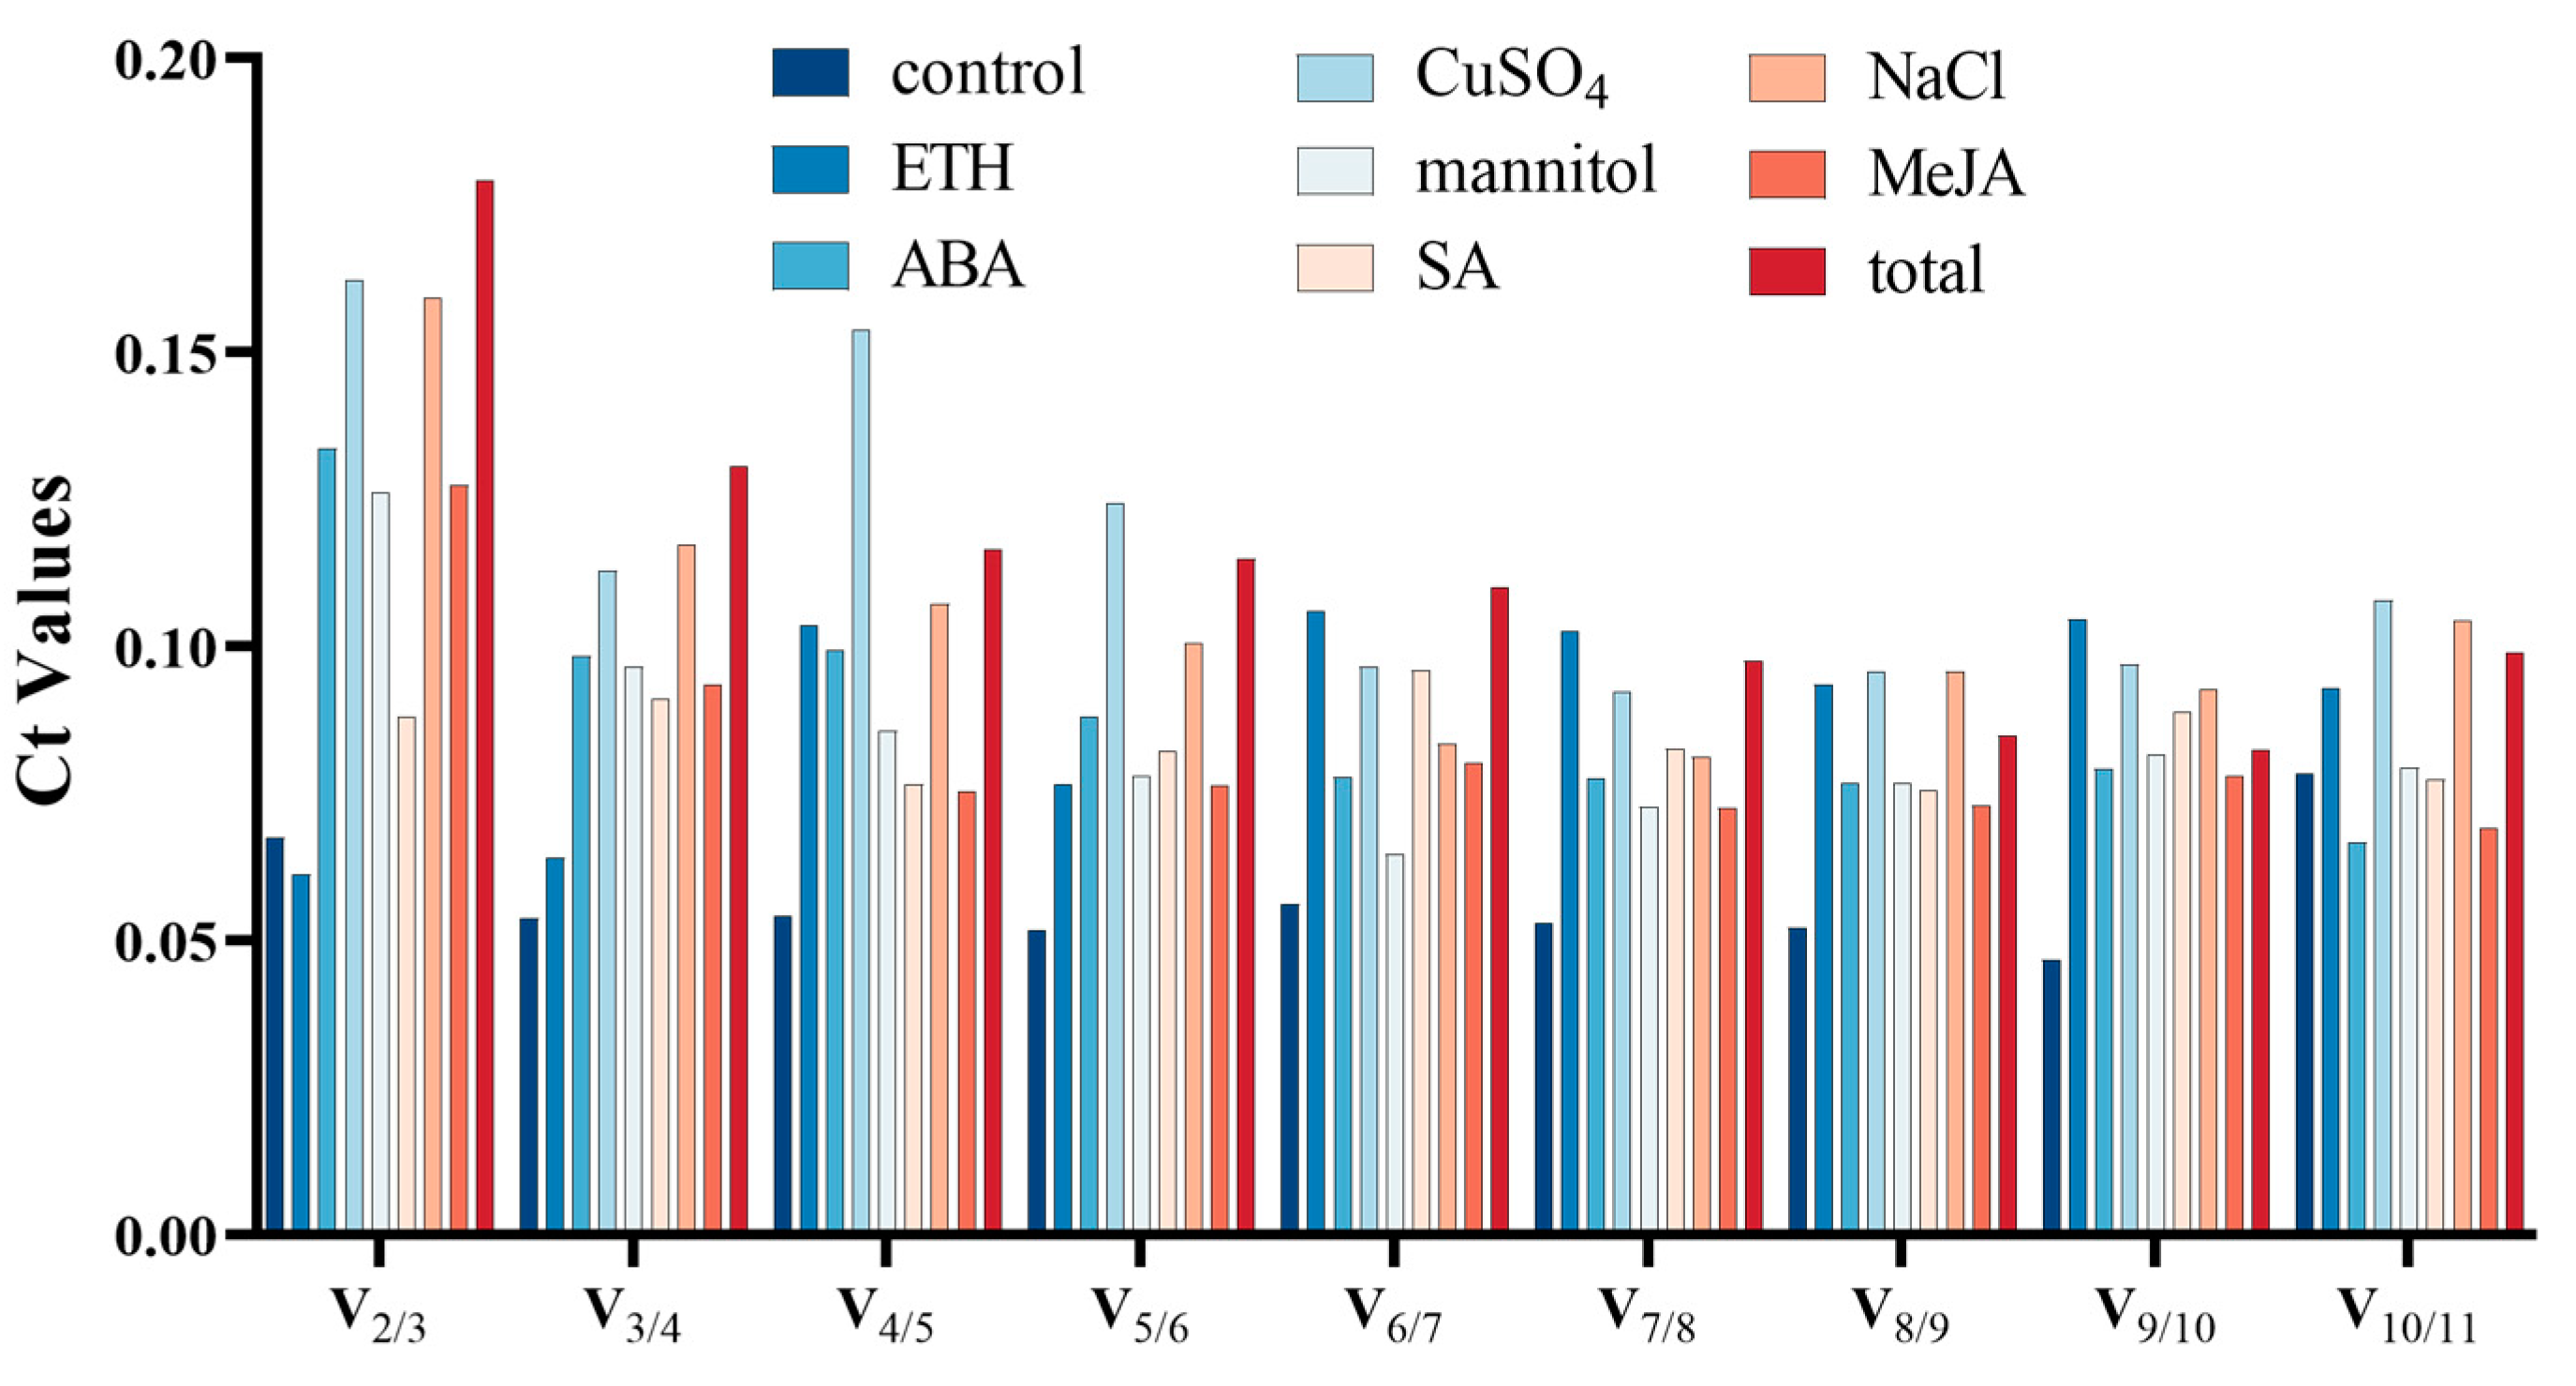
3.2.1. GeNorm Analysis

GeNorm analysis utilized the M value, which indicates the stability detection value of internal reference genes, to assess the stability of 11 potential reference genes. By calculating the M value of each reference gene’s stability, the geNorm algorithm filtered out those with higher stability. The general principle is that a smaller M value denotes higher stability, while a larger M value suggests lower stability. As illustrated in Figure 2, the 11 possible reference genes displayed varying degrees of stability across different treatments. UBC9 and TIP41 consistently exhibited the lowest M values among most treatment groups, making them the most stable reference genes. Furthermore, when considering all abiotic stress samples together, UBC9 and TIP41 demonstrated the lowest M values, further confirming their superior stability. Additionally, EF1α showed good stability under the control, ETH, and SA treatment, while GAPDH ranked first in the mannitol, MeJA, and NaCl treatment. PTBP, TUBA, and GAPDH were also among the most stable reference genes in CuSO4, ETH, and mannitol treatments, respectively. SAND generally exhibited inferior stability compared to the other assumed reference genes. Overall, TUB6 emerged as the least stable candidate gene in our comprehensive analysis (Figure 2).
The algorithm also possesses the capability to determine the paired variation V value of the standardization factor after the addition of a new reference gene. This allows for the determination of the ideal number of reference genes using the Vn/n+1 value. A paired variation (V) score of less than 0.15 is considered ideal, suggesting that the addition of an extra gene will have minimal impact on the normalization process. The paired variation values (V2/3) in the control, ETH, ABA, mannitol, SA, and MeJA treatment groups were all less than 0.15, indicating that adding a third or even fourth reference gene had no discernible effect on the standardization of the target gene (Figure 3 and Table S3). As a result, the optimal number of reference genes determined under these treatments was two. Furthermore, the paired variation value (V3/4) of the CuSO4 and NaCl treatment groups is also less than 0.15, indicating that three reference genes is the ideal number for these groups (Figure 3 and Table S3).

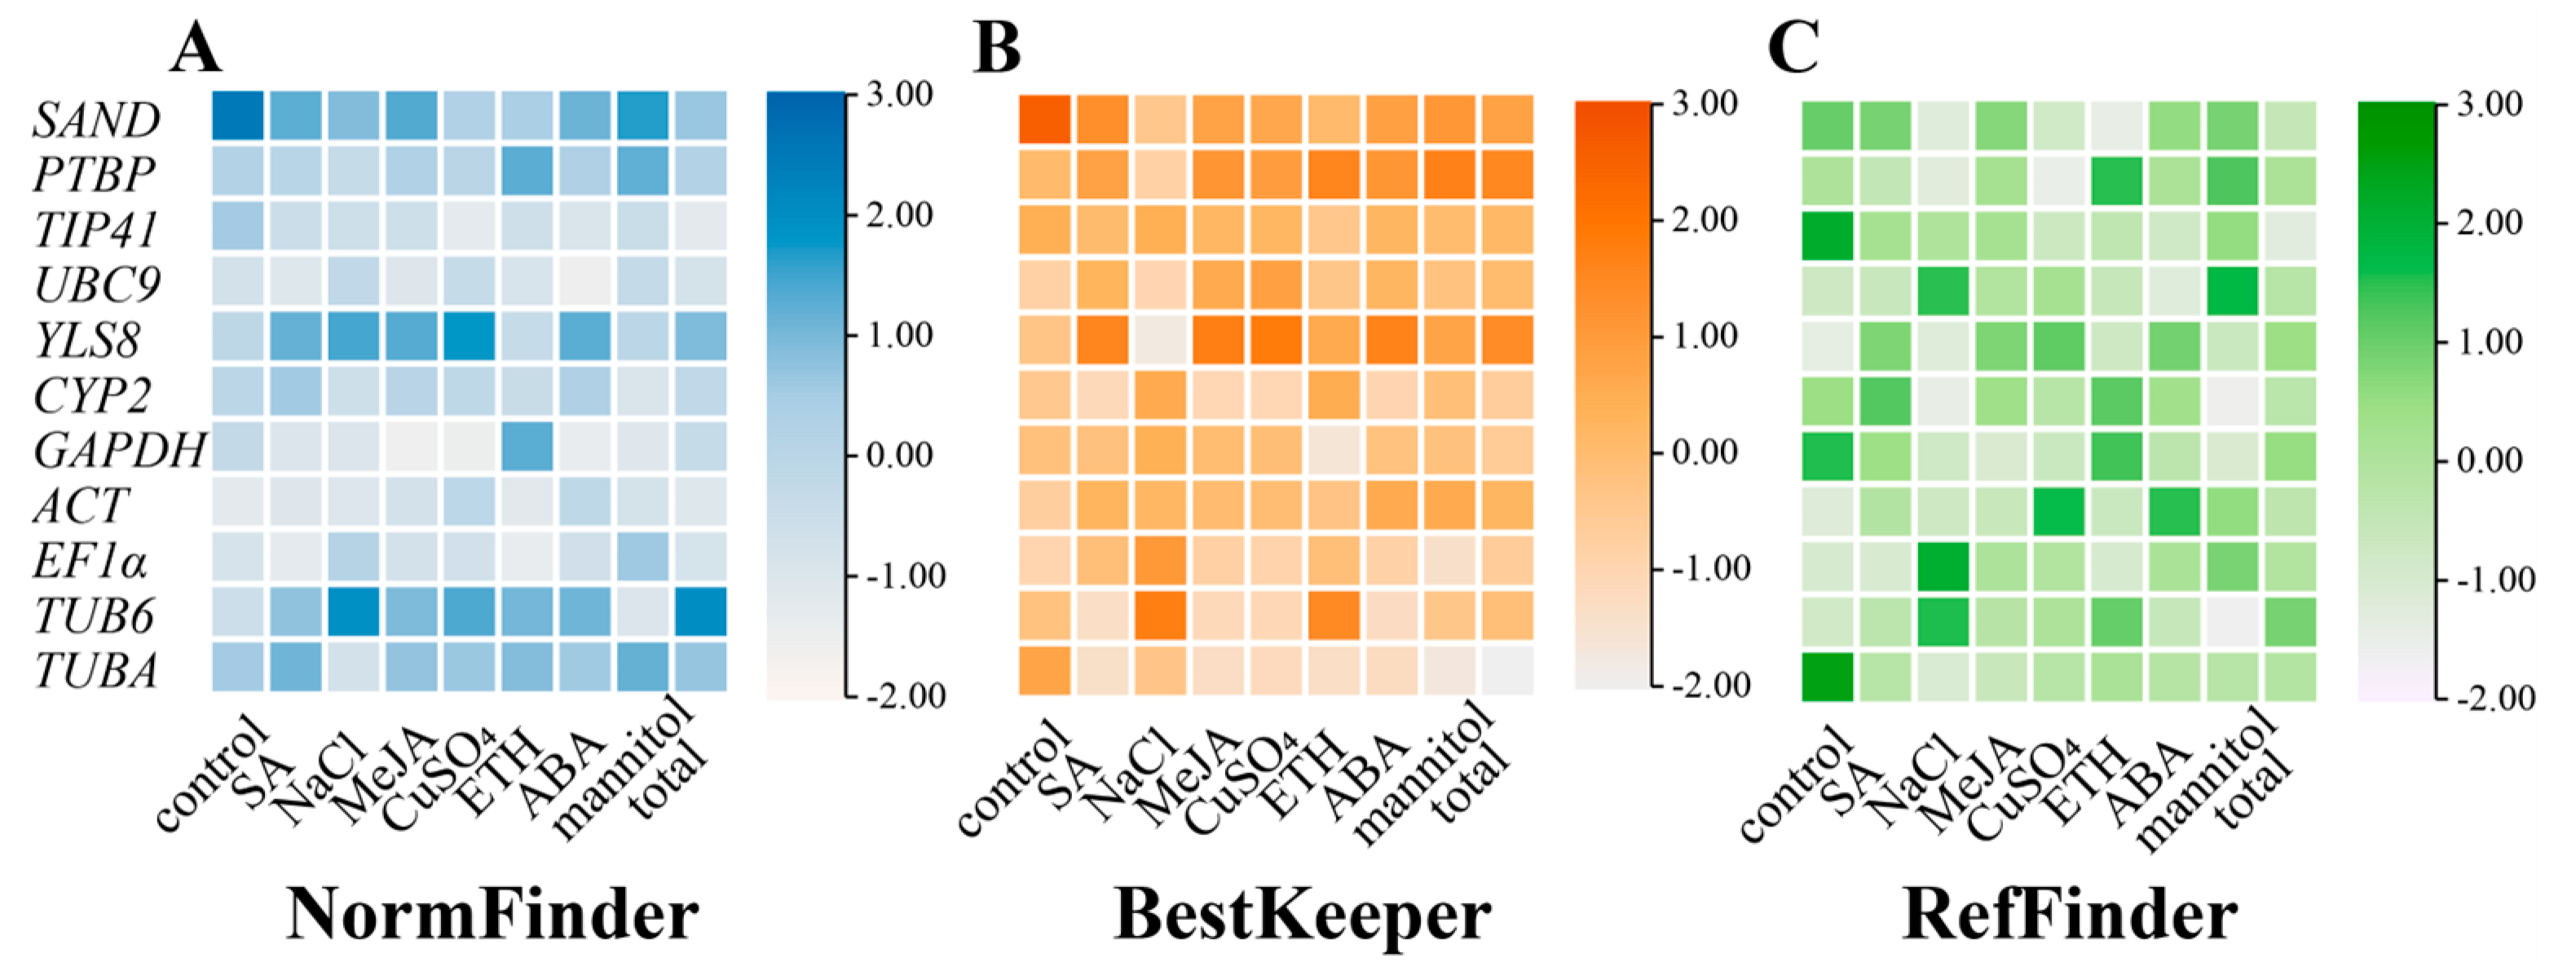
3.2.2. NormFinder Analysis

The most suitable reference gene is selected in the NormFinder analysis based on the stability value of reference gene expression, which is similar to the geNorm algorithm. The NormFinder algorithm requires that a reference gene be judged most acceptable if its expression stability value is the lowest. This algorithm can assess the variation across sample groups and compare the expression differences of reference genes. The ranks of 11 candidate genes as determined by the NormFinder algorithm are presented in Figure 4A and Table S4. In the CuSO4, mannitol, and MeJA treatment groups, GAPDH ranked first; ACT ranked first in the control and NaCl treatment groups; EF1α ranked first in the ETH and SA treatment groups. Additionally, TIP41 consistently achieved the top ranking when considering all the sample data. Similar to the geNorm results, SAND exhibited instability in most cases, while TUB6 was consistently recognized as the most unstable gene (Figure 4A and Table S4).

3.2.3. BestKeeper Analysis

BestKeeper, utilizes the raw Ct values to assess the coefficient of variation (CV) and standard deviation (SD) of the reference gene from each treatment. These metrics are then used to assess and compare the stability of the reference genes. It is important to note that lower SD and Ct values indicate a higher stability of gene expression, especially when the SD exceeds 1, indicating the instability of the reference gene and rendering it unsuitable for standardization. The results are depicted in Figure 4B and Table S5, and show some variations in the ranking of each gene compared to geNorm and NormFinder. The BestKeeper algorithm determined that TUBA was the most stable reference gene since it consistently performed well in all treatment groups, taking the top spot in five of them (CuSO4, mannitol, SA, MeJA, total), thus being recognized as the most stable internal reference gene based on the BestKeeper algorithm. YLS8 was identified as the most stable reference gene in the NaCl treatment group, while GAPDH demonstrated the highest stability in the ETH treatment group. TUB6 emerged as the most stable reference gene in the ABA treatment group, and EF1α was deemed the most stable reference gene in the control group. The BestKeeper algorithm revealed that YLS8 was the most unstable in most cases, whereas PTBP represented the most unstable gene when considering all samples together (Figure 4B and Table S5).

3.2.4. RefFinder Analysis

In order to reduce the impact of constraints linked to a singular algorithm, the RefFinder application (https://www.heartcure.com.au/reffinder/, accessed on 25 September 2023) was utilized to ascertain comprehensive stability rankings for the possible reference genes. This algorithm combines the results from general analysis programs such as geNorm, NormFinder, and BestKeeper to calculate the overall ranking of 11 candidate internal reference genes. Figure 4C and Table S6 diaplayed the comprehensive ranking that RefFinder determined. Among the four treatment groups (NaCl, MeJA, CuSO4, and mannitol), GAPDH exhibited the highest stability and achieved higher rankings in most treatment groups (SA, NaCl, MeJA, CuSO4, ETH, ABA, mannitol, and total). In the SA, ETH, and control groups, EF1α was identified as the most stable gene. In the ABA treatment group, UBC9 was regarded as the most stable reference gene. Considering all the sample data, TIP41 was identified as the most stable internal reference gene. Conversely, SAND and YLS8 were consistently recognized as the most unstable reference genes (Figure 4C and Table S6).

3.2.5. Comprehensive Analysis

The most stable reference genes, as determined by geNorm, were UBC9, TIP41, and GAPDH. NormFinder identified TIP41, ACT, and EF1α as the most stable reference genes, while BestKeeper selected TUBA, CYP2, and EF1α as the most stable reference genes. According to this study, SAND and YLS8 are considered the most unstable reference genes, as they consistently exhibited instability across multiple treatment groups and different algorithm analyses (Table 2). To sum up, the 11 candidate reference genes can be arranged in descending order of stability: TIP41, UBC9, ACT, EF1α, GAPDH, CYP2, TUBA, PTBP, SAND, TUB6, and YLS8. This result is almost consistent with the analysis results of geNorm and NormFinder, and slightly different from the analysis results of BestKeeper.

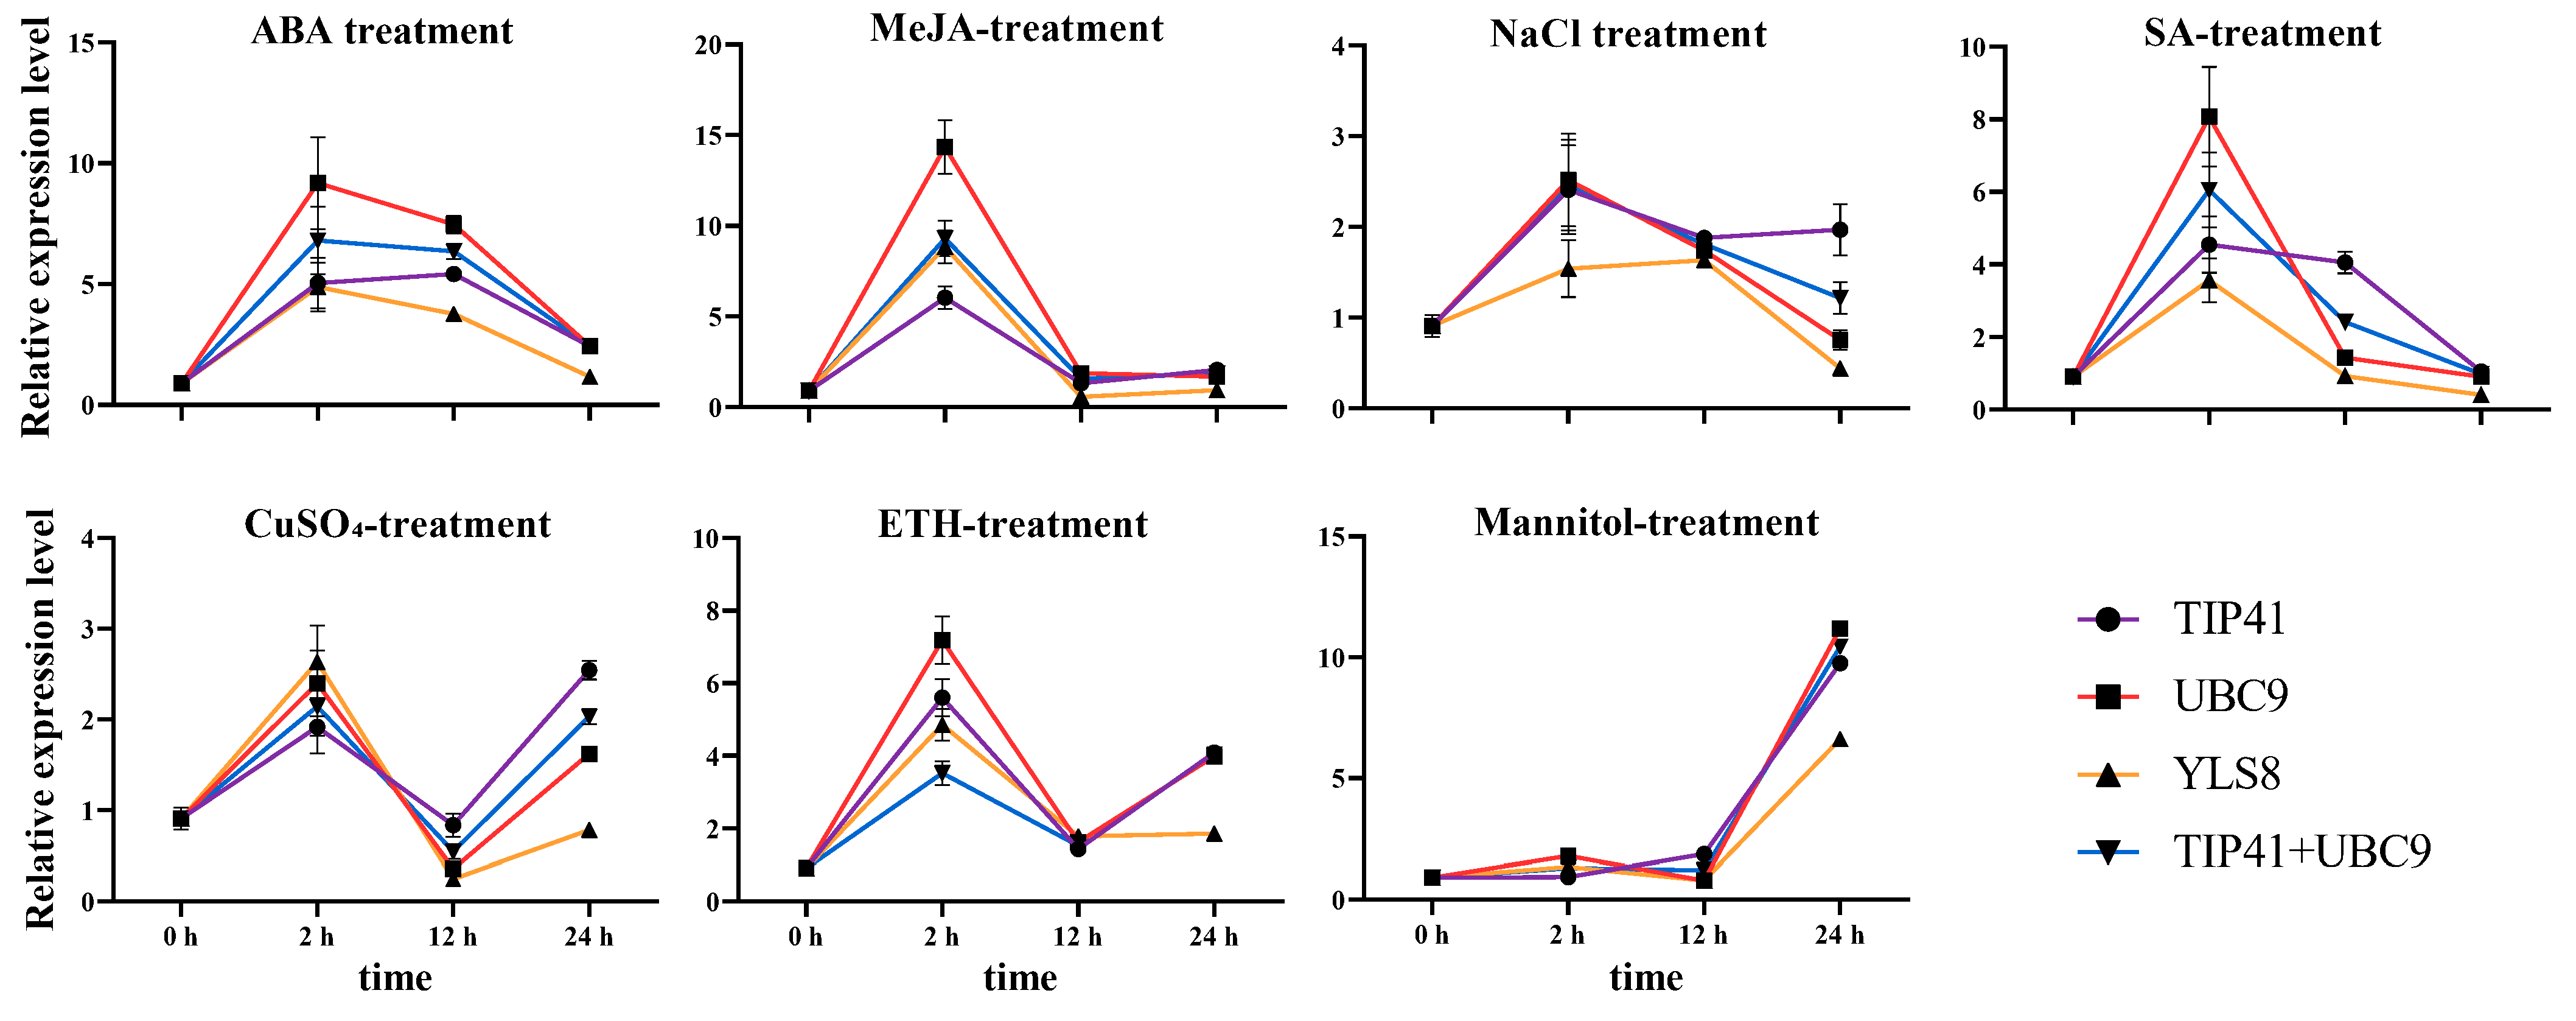
3.3. Reference Gene Validation

To validate the findings obtained from the aforementioned analyses, the expression pattern of AdPAL was examined in all samples. The relative expression levels of AdPAL were calculated and utilized to assess and standardize the observed results under various abiotic stresses, thereby confirming the suitability of the selected reference gene (Figure 5). RefFinder was used to rank the two most stable genes (TIP41 and UBC9 under different treatments) as well as the most unstable reference gene (YLS8) during the validation process. The expression level of AdPAL in sterile water-treated leaves was assumed to be “1”, and the 2−ΔΔCT method was employed to calculate its relative expression level in other samples. Figure 5 demonstrates that all samples exhibited significant changes and that the change patterns among the various sample groups altered when the relative expression level of AdPAL was normalized using the combination of the two most stable reference genes. During the mannitol treatment, the expression of AdPAL fluctuated at a low level over time and reached its peak after 24 h. In the other treatment groups, the relative expression level of AdPAL peaked at 2 h, with a subsequent decrease observed in the ABA, NaCl, and SA treatment groups. Conversely, in the ETH, MeJA, and CuSO4 treatment groups, the relative expression level initially decreased and then increased after 2 h of treatment. AdPAL expression patterns were consistent across all samples when normalized using the two most stable reference genes (TIP41 and UBC9) alone or in combination. Nevertheless, using unstable reference genes (YLS8) resulted in notable variations in AdPAL expression patterns. In the ABA, ETH, mannitol, and CuSO4 treatment groups, the relative expression of AdPAL exhibited notable disparities. In the remaining treatment groups, the expression levels of AdPAL showed minimal variations, but similar expression patterns were observed when standardized using the two most stable reference genes (alone or in combination).

4. Discussion

A. dahurica, a renowned edible medicinal herb with a long history of use in China, has been found to contain coumarins as its main active component. Coumarins possess notable anti-inflammatory, antibacterial, and antitumor properties [1]. These active substances are usually secondary metabolites produced during normal growth or in reaction to stress. Previous reports have highlighted a strong relationship between the expression levels of genes associated with secondary metabolite biosynthesis pathways and the synthesis and accumulation of secondary metabolites [6,38]. The biosynthetic pathway will be much easier to understand if these genes are quantified using stable reference genes [7].
RT-qPCR remains a widely utilized method for analyzing gene expression level since its sensitivity, accuracy, and efficiency, despite the availability of advanced technologies such as microarrays and high-throughput sequencing [39]. RT-qPCR serves as a primary approach for assessing gene expression levels and unraveling plant response mechanisms under various stresses. The choice of a suitable reference gene is crucial as it lays the foundation for understanding biosynthesis and regulatory mechanisms [10,40]. Numerous suitable reference genes have been discovered in both animals and plants [14,41,42,43].
From the transcriptome data of A. dahurica, a total of 11 reference genes were chosen in order to assess the stability of expression in leaves when exposed to salt (NaCl), drought (mannitol), heavy metal (CuSO4), and hormone treatments (ETH, ABA, SA, and MeJA). The Ct values of these genes were determined for the entire sample pool (Table S2). As shown in Figures S1 and S2, the dissolution curve displayed a single peak due to the specificity of the 11 primer pairs. The candidate genes exhibited a range of amplification efficiencies from 94.53 to 109.07%, with an R2 value of >0.98. This gave a solid foundation for the identification and assessment of reference genes in A. dahurica. The mean Ct values of the 11 potential reference genes varied from 15.39 to 27.63 (Figure 1 and Table S2). Moreover, a narrow distribution range typically indicates low variability; TIP41, UBC9, and YLS8 should therefore be regarded as stable reference genes (Figure 1). However, since the expression level of reference genes could vary under different experimental conditions (Table S2), it is essential to analyze their stability separately for specific tissues and treatments, utilizing multiple tools.
In this study, the stability of putative reference genes was sassessed using three statistical algorithms: geNorm [30], NormFinder [31], and BestKeeper [32]. Finally, the results were combined and verified using RefFinder. Previous studies had emphasized the necessity of using two or more algorithms to ensure accurate results. With a cut-off value of 0.15 (Vn/n+1), geNorm was able to ascertain the ideal number of reference genes for normalization. In this study, the V2/3 values for leaves under drought and hormone treatments (ABA, SA, ETH, MeJA) were below 0.15, suggesting that two reference genes would suffice under these treatments (Figure 3 and Table S3). According to this rule, three genes should be used for leaves treated with CuSO4 and NaCl. However, the 0.15 threshold was not an absolute requirement. Moreover, given that the V2/3 values for the CuSO4 and NaCl groups were slightly below 0.15 (0.012 and 0.009, respectively) (Table S3), using three reference genes instead of two during reference gene validation may not be necessary [41]. Similar to geNorm, NormFinder selected the most suitable reference gene by analyzing the relative expression levels of the reference gene. In the SA, MeJA, ETH, ABA, and mannitol treatment groups, the most stable reference genes were determined by the NormFinder algorithm, and the overall sample data were consistent with the results obtained from geNorm (Figure 4A and Table S4). However, the most stable genes identified by NormFinder in the NaCl and CuSO4 treatment groups differed from the geNorm results, with ACT and GAPDH ranked as the most stable genes in these two groups. The ranking of the most unstable internal reference genes was mostly consistent across different analyses, except for the ETH and ABA treatment groups.
Notably, while geNorm and NormFinder produced similar rankings for the reference genes, there were significant variations in the outcomes obtained from BestKeeper (Table 2). BestKeeper often identified low-ranked internal reference genes as the most stable genes according to the first two algorithms (excluding the control group) (Figure 4B and Table S5). In summary, the disparities between geNorm and NormFinder suggested that the ranking order of reference genes may vary based on the specific experimental conditions. The discrepancies observed between geNorm, NormFinder, and BestKeeper indicate that the ranking order may differ among the analysis method (Table 2). These variations can be attributed to the differences in the procedures and statistical algorithms employed. Previous studies have also reported instances where the results obtained from BestKeeper were inconsistent with those of geNorm and NormFinder, as observed in Nitraria tangutorum [43] and Kentucky bluegrass [42].
Finally, RefFinder, a comprehensive tool, was used to generate the final rankings of the 11 candidate genes by analyzing the geometric mean of rankings from each algorithm. A lower geometric mean indicates greater stability of the gene (Figure 4C and Table S6). The reference gene selected for standardizing and quantifying the expression level of A. dahurica was determined by RefFinder, with UBC9 and ACT following TIP41 as the most stable reference genes. These results agreed with previous studies conducted on Momordica charantia [22] and Psoralea corylifolia [21], where TIP41 also demonstrated high stability. However, in studies on Angelica decursiva [17] and Dendrobium huoshanense [44], TIP41 was not identified as the most stable gene, further highlighting the absence of a universal reference gene that is stably expressed across different conditions or organisms. Hence, it is essential to verify presumed reference genes before each RT-qPCR analysis to ensure their suitability for specific experimental conditions. Furthermore, previous studies have indicated that the most stable internal reference genes are not always stably expressed in various species or under specific experimental conditions [17,21,22,44]. Therefore, when selecting suitable reference genes, it is vital to consider the differences in species and experimental conditions.
To further assess the suitability of the selected reference genes, the expression of AdPAL, a crucial enzyme for the synthesis of coumarins in A. dahurica, was normalized using the two most stable genes (TIP41 and UBC9), their combination, and the least stable gene (YLS8) under various treatments. Coumarins represent the primary active components of A. dahurica, and the expression level of AdPAL may directly correlate with the coumarin content, which could provide a basis for further research on biosynthesis regulation [27]. The results demonstrated that significant variations occurred when the most unstable reference gene, YLS8, was used for standardization (Figure 5). When one stable gene or a combination of stable reference genes was used for normalization, slight variations were observed in the expression pattern of PAL (Figure 5). These findings underscore the significance of selecting appropriate reference genes to ensure accurate RT-qPCR results, as exemplified by the expression analysis of PAL. Notably, in the different treatment groups, the expression of AdPAL exhibited a pronounced increase after 2 h of treatment. This could be attributed to the enhanced formation of coumarins, a type of secondary metabolite in A. dahurica, following stress treatments, consequently resulting in an increased relative expression level of the AdPAL. Similar observations have been reported in cherry [25] and potato [45]. Interestingly, during continuous treatment, only the expression of AdPAL in the ETH, mannitol, and CuSO4 treatment groups showed an upward trend, while the other treatment groups exhibited a decline.

5. Conclusions

In summary, this study aimed to identify stable reference genes in A. dahurica under various treatments. Of the 11 candidate genes investigated, TIP41 exhibited the highest stability, followed by UBC9 and ACT. Conversely, YLS8 was found to have low stability and is generally not advised as an appropriate reference gene in most circumstances. Furthermore, the results were validated by assessing the relative abundance of AdPAL. Overall, this research contributes to our understanding of gene expression in A. dahurica under several abiotic stresses and can be an effective tool in the selection of relevant reference genes in other plants.

Supplementary Materials

The following supporting information can be downloaded at: https://www.mdpi.com/article/10.3390/genes15010079/s1, Figure S1: Agarose gel (1.0%) electrophoresis showing amplification of a specific PCR product of the expected size for each gene. Figure S2: Melting curves of 11 candidate reference genes tested in this study. Table S1: Information of all candidate genes and target genes in A. dahurica. Table S2: Ct values of 11 candidate genes of A. dahurica. Table S3: Pairwise variation (Vn/n+1) analysis of 11 candidate reference genes calculated using geNorm. Table S4: Stability rank of 11 candidate genes by NormFinder. Table S5: Stability rank of 11 candidate genes by Bestkeeper. Table S6: Expression stability values of 11 candidate genes calculated using the RefFinder.

Author Contributions

Conceptualization, X.Z. and Y.H.; methodology, J.Z. (Jing Zhang), X.H. and J.Z. (Jun Zhou); software, L.Y., S.P. and H.Y.; validation, L.Y. and S.P.; formal analysis, H.Y., Z.D., S.P. and Q.T.; investigation, X.H., J.Z. (Jun Zhou), L.Y. and X.Z.; resources, X.Z. and Y.H.; data curation, J.Z. (Jing Zhang), X.H., J.Z. (Jun Zhou) and Z.D.; writing—original draft preparation, J.Z. (Jing Zhang) and X.H.; writing—review and editing, J.Z. (Jing Zhang), Q.T. and Y.H.; visualization, J.Z. (Jing Zhang) and Y.H.; supervision, Y.H.; project administration, Q.T. and X.Z.; funding acquisition, J.Z. (Jing Zhang) and Y.H. All authors have read and agreed to the published version of the manuscript.

Funding

This work was funded by the China Postdoctoral Science Foundation, grant number 2023M741143, the Scientific Research Fund of Hunan Provincial Education Department, grant number 23B0228, and the Research Innovation Project of Postgraduates in Hunan Agricultural University, grant number CX20230706.

Institutional Review Board Statement

Not applicable.

Informed Consent Statement

Not applicable.

Data Availability Statement

The gene sequence information mentioned in this study can be found from the literature based on the gene list in Additional Table S1. The raw data can be accessed from the NCBI Sequence Read Archive (SRA) platform under the accession number SRP289220. The materials are available from the corresponding author on reasonable request after publication of the work.

Conflicts of Interest

The authors declare that they have no known competing financial interests or personal relationships that could appear to influence the work reported in this paper.

References

  1. Zhao, H.; Feng, Y.-L.; Wang, M.; Wang, J.-J.; Liu, T.; Yu, J. The Angelica dahurica: A review of traditional uses, phytochemistry and pharmacology. Front. Pharmacol. 2022, 13, 896637. [Google Scholar] [CrossRef] [PubMed]
  2. Zou, J.; Duan, Y.; Wang, Y.; Liu, A.; Chen, Y.; Guo, D.; Guo, W.; Li, S.; Su, Z.; Wu, Y.; et al. Phellopterin cream exerts an anti-inflammatory effect that facilitates diabetes-associated cutaneous wound healing via SIRT1. Phytomedicine 2022, 107, 154447. [Google Scholar] [CrossRef] [PubMed]
  3. Zheng, Y.M.; Shen, J.Z.; Wang, Y.; Lu, A.X.; Ho, W.S. Anti-oxidant and anti-cancer activities of Angelica dahurica extract via induction of apoptosis in colon cancer cells. Phytomedicine 2016, 23, 1267–1274. [Google Scholar] [CrossRef] [PubMed]
  4. Li, D.; Wu, L. Coumarins from the roots of Angelica dahurica cause anti-allergic inflammation. Exp. Ther. Med. 2017, 14, 874–880. [Google Scholar] [CrossRef] [PubMed]
  5. Nützmann, H.-W.; Huang, A.; Osbourn, A. Plant metabolic clusters—From genetics to genomics. New Phytol. 2016, 211, 771–789. [Google Scholar] [CrossRef] [PubMed]
  6. Lau, W.; Sattely, E.S. Six enzymes from mayapple that complete the biosynthetic pathway to the etoposide aglycone. Science 2015, 349, 1224–1228. [Google Scholar] [CrossRef] [PubMed]
  7. Sun, H.; Jiang, X.; Sun, M.; Cong, H.; Qiao, F. Evaluation of reference genes for normalizing RT-qPCR in leaves and suspension cells of Cephalotaxus hainanensis under various stimuli. Plant Methods 2019, 15, 31. [Google Scholar] [CrossRef] [PubMed]
  8. Bourgaud, F.; Gravot, A.; Milesi, S.; Gontier, E. Production of plant secondary metabolites: A historical perspective. Plant Sci. 2001, 161, 839–851. [Google Scholar] [CrossRef]
  9. Bustin, S.A.; Benes, V.; Nolan, T.; Pfaffl, M.W. Quantitative real-time RT-PCR—A perspective. J. Mol. Endocrinol. 2005, 34, 597–601. [Google Scholar] [CrossRef]
  10. Dheda, K.; Huggett, J.F.; Chang, J.S.; Kim, L.U.; Bustin, S.A.; Johnson, M.A.; Rook, G.A.W.; Zumla, A. The implications of using an inappropriate reference gene for real-time reverse transcription PCR data normalization. Anal. Biochem. 2005, 344, 141–143. [Google Scholar] [CrossRef]
  11. Delporte, M.; Legrand, G.; Hilbert, J.-L.; Gagneul, D. Selection and validation of reference genes for quantitative real-time PCR analysis of gene expression in Cichorium intybus. Front. Plant Sci. 2015, 6, 651. [Google Scholar] [CrossRef]
  12. Huggett, J.; Dheda, K.; Bustin, S.; Zumla, A. Real-time RT-PCR normalisation; strategies and considerations. Genes Immun. 2005, 6, 279–284. [Google Scholar] [CrossRef] [PubMed]
  13. Dong, X.-M.; Zhang, W.; Zhang, S.-B. Selection and validation of reference genes for quantitative real-time PCR analysis of development and tissue-dependent flower color formation in Cymbidium lowianum. Int. J. Mol. Sci. 2022, 23, 738. [Google Scholar] [CrossRef] [PubMed]
  14. Li, Y.; Liang, X.; Zhou, X.; Wu, Z.; Yuan, L.; Wang, Y.; Li, Y. Selection of reference genes for qRT-PCR analysis in medicinal plant glycyrrhiza under abiotic stresses and hormonal treatments. Plants 2020, 9, 1441. [Google Scholar] [CrossRef]
  15. Hou, S.; Zhao, T.; Yang, D.; Li, Q.; Liang, L.; Wang, G.; Ma, Q. Selection and validation of reference genes for quantitative RT-PCR analysis in Corylus heterophylla Fisch. × Corylus avellana L. Plants 2021, 10, 159. [Google Scholar] [CrossRef] [PubMed]
  16. Liang, W.; Zou, X.; Carballar-Lejarazú, R.; Wu, L.; Sun, W.; Yuan, X.; Wu, S.; Li, P.; Ding, H.; Ni, L.; et al. Selection and evaluation of reference genes for qRT-PCR analysis in Euscaphis konishii Hayata based on transcriptome data. Plant Methods 2018, 14, 42. [Google Scholar] [CrossRef] [PubMed]
  17. He, Y.; Zhong, Y.; Bao, Z.; Wang, W.; Xu, X.; Gai, Y.; Wu, J. Evaluation of Angelica decursiva reference genes under various stimuli for RT-qPCR data normalization. Sci. Rep. 2021, 11, 18993. [Google Scholar] [CrossRef]
  18. Song, H.; Mao, W.; Duan, Z.; Que, Q.; Zhou, W.; Chen, X.; Li, P. Selection and validation of reference genes for measuring gene expression in Toona ciliata under different experimental conditions by quantitative real-time PCR analysis. BMC Plant Biol. 2020, 20, 450. [Google Scholar] [CrossRef] [PubMed]
  19. Yang, Z.; Zhang, R.; Zhou, Z. Identification and validation of reference genes for gene expression analysis in Schima superba. Genes 2021, 12, 732. [Google Scholar] [CrossRef]
  20. Yi, S.; Lin, Q.; Zhang, X.; Wang, J.; Miao, Y.; Tan, N. Selection and validation of appropriate reference genes for quantitative RT-PCR analysis in Rubia yunnanensis Diels based on transcriptome data. Biomed Res. Int. 2020, 2020, 5824841. [Google Scholar] [CrossRef]
  21. Zhong, Y.; Gai, Y.; Gao, J.; Nie, W.; Bao, Z.; Wang, W.; Xu, X.; Wu, J.; He, Y. Selection and validation of reference genes for quantitative real-time PCR normalization in Psoralea corylifolia (Babchi) under various abiotic stress. J. Plant Physiol. 2022, 274, 153722. [Google Scholar] [CrossRef]
  22. Wang, Z.; Xu, J.; Liu, Y.; Chen, J.; Lin, H.; Huang, Y.; Bian, X.; Zhao, Y. Selection and validation of appropriate reference genes for real-time quantitative PCR snalysis in Momordica charantia. Phytochemistry 2019, 164, 1–11. [Google Scholar] [CrossRef] [PubMed]
  23. Zhang, Y.; Mu, D.; Wang, L.; Wang, X.; Wilson, I.W.; Chen, W.; Wang, J.; Liu, Z.; Qiu, D.; Tang, Q. Reference genes screening and fene expression patterns analysis involved in gelsenicine biosynthesis under different hormone treatments in Gelsemium elegans. Int. J. Mol. Sci. 2023, 24, 15973. [Google Scholar] [CrossRef] [PubMed]
  24. Pei, T.; Ma, P.; Ding, K.; Liu, S.; Jia, Y.; Ru, M.; Dong, J.; Liang, Z. SmJAZ8 acts as a core repressor regulating JA-induced biosynthesis of salvianolic acids and tanshinones in Salvia miltiorrhiza Hairy roots. J. Exp. Bot. 2018, 69, 1663–1678. [Google Scholar] [CrossRef] [PubMed]
  25. Zhang, Q.; Yang, W.; Liu, J.; Liu, H.; Lv, Z.; Zhang, C.; Chen, D.; Jiao, Z. Postharvest UV-C irradiation increased the flavonoids and anthocyanins accumulation, phenylpropanoid pathway gene expression, and antioxidant activity in sweet sherries (Prunus avium L.). Postharvest Biol. Technol. 2021, 175, 111490. [Google Scholar] [CrossRef]
  26. He, Y.; Zhong, X.; Jiang, X.; Cong, H.; Sun, H.; Qiao, F. Characterisation, expression and functional analysis of PAL gene family in Cephalotaxus hainanensis. Plant Physiol. Biochem. PPB 2020, 156, 461–470. [Google Scholar] [CrossRef]
  27. Sui, Z.; Luo, J.; Yao, R.; Huang, C.; Zhao, Y.; Kong, L. Functional characterization and correlation analysis of phenylalanine ammonia-lyase (PAL) in coumarin biosynthesis from Peucedanum praeruptorum Dunn. Phytochemistry 2019, 158, 35–45. [Google Scholar] [CrossRef]
  28. He, Y.; Zhang, J.; He, Y.; Liu, H.; Wang, C.; Guan, G.; Zhao, Y.; Tian, Y.; Zhong, X.; Lu, X. Two O-methyltransferases are responsible for multiple O-methylation steps in the biosynthesis of furanocoumarins from Angelica decursiva. Plant Physiol. Biochem. 2023, 204, 108142. [Google Scholar] [CrossRef]
  29. Zhou, Y.; Zhang, Y.; Mu, D.; Lu, Y.; Chen, W.; Zhang, Y.; Zhang, R.; Qin, Y.; Yuan, J.; Pan, L.; et al. Selection of reference genes in Evodia rutaecarpa Var. officinalis and expression patterns of genes Iinvolved in its limonin biosynthesis. Plants 2023, 12, 3197. [Google Scholar] [CrossRef]
  30. Vandesompele, J.; De Preter, K.; Pattyn, F.; Poppe, B.; Van Roy, N.; De Paepe, A.; Speleman, F. Accurate normalization of real-time quantitative RT-PCR data by geometric averaging of multiple internal control genes. Genome Biol. 2002, 3, RESEARCH0034. [Google Scholar] [CrossRef]
  31. Andersen, C.L.; Jensen, J.L.; Ørntoft, T.F. Normalization of real-time quantitative reverse transcription-PCR data: A model-based variance estimation approach to identify genes suited for normalization, applied to bladder and colon cancer data sets. Cancer Res. 2004, 64, 5245–5250. [Google Scholar] [CrossRef]
  32. Pfaffl, M.W.; Tichopad, A.; Prgomet, C.; Neuvians, T.P. Determination of stable housekeeping genes, differentially regulated target genes and aample integrity: BestKeeper--excel-based tool using pair-wise correlations. Biotechnol. Lett. 2004, 26, 509–515. [Google Scholar] [CrossRef] [PubMed]
  33. Wu, Z.-J.; Tian, C.; Jiang, Q.; Li, X.-H.; Zhuang, J. Selection of suitable reference genes for qRT-PCR normalization during leaf development and hormonal stimuli in tea plant (Camellia sinensis). Sci. Rep. 2016, 6, 19748. [Google Scholar] [CrossRef] [PubMed]
  34. Xie, F.; Wang, J.; Zhang, B. RefFinder: A Web-Based Tool for Comprehensively Analyzing and Identifying Reference Genes. Funct. Integr. Genomics 2023, 23, 125. [Google Scholar] [CrossRef]
  35. Xie, F.; Xiao, P.; Chen, D.; Xu, L.; Zhang, B. MiRDeepFinder: A MiRNA Analysis Tool for Deep Sequencing of Plant Small RNAs. Plant Mol. Biol. 2012, 80, 75–84. [Google Scholar] [CrossRef] [PubMed]
  36. Song, C.; Li, X.; Jia, B.; Liu, L.; Wei, P.; Manzoor, M.A.; Wang, F.; Li, B.Y.; Wang, G.; Chen, C.; et al. Comparative transcriptomics unveil the crucial genes involved in coumarin biosynthesis in Peucedanum praeruptorum Dunn. Front. Plant Sci. 2022, 13, 899819. [Google Scholar] [CrossRef] [PubMed]
  37. Livak, K.J.; Schmittgen, T.D. Analysis of relative gene expression data using real-time quantitative PCR and the 2−ΔΔCT method. Methods 2001, 25, 402–408. [Google Scholar] [CrossRef]
  38. Olofsson, L.; Engström, A.; Lundgren, A.; Brodelius, P.E. Relative expression of genes of terpene metabolism in different tissues of Artemisia annua L. BMC Plant Biol. 2011, 11, 45. [Google Scholar] [CrossRef] [PubMed]
  39. Bustin, S.A. Quantification of mRNA using real-time reverse transcription PCR (RT-PCR): Trends and problems. J. Mol. Endocrinol. 2002, 29, 23–39. [Google Scholar] [CrossRef]
  40. Xiao, Z.; Sun, X.; Liu, X.; Li, C.; He, L.; Chen, S.; Su, J. Selection of reliable reference genes for gene expression studies on Rhododendron molle G. Don. Front. Plant Sci. 2016, 7, 1547. [Google Scholar] [CrossRef]
  41. Hu, A.; Yang, X.; Zhu, J.; Wang, X.; Liu, J.; Wang, J.; Wu, H.; Zhang, H.; Zhang, H. Selection and validation of appropriate reference genes for RT-qPCR analysis of Nitraria sibirica under various abiotic stresses. BMC Plant Biol. 2022, 22, 592. [Google Scholar] [CrossRef] [PubMed]
  42. Niu, K.; Shi, Y.; Ma, H. Selection of candidate reference genes for gene expression analysis in Kentucky bluegrass (Poa pratensis L.) under abiotic stress. Front. Plant Sci. 2017, 8, 193. [Google Scholar] [CrossRef] [PubMed]
  43. Wang, B.; Wang, L.; Duan, H.; Chong, P.; Li, Y. Selection and validation of reference genes for quantitative real-time PCR analysis of Nitraria tangutorum. Res. Sq. 2020. [Google Scholar] [CrossRef]
  44. Yi, S.; Lu, H.; Tian, C.; Xu, T.; Song, C.; Wang, W.; Wei, P.; Gu, F.; Liu, D.; Cai, Y.; et al. Selection of suitable reference genes for gene expression normalization studies in Dendrobium huoshanense. Genes 2022, 13, 1486. [Google Scholar] [CrossRef] [PubMed]
  45. Payyavula, R.S.; Shakya, R.; Sengoda, V.G.; Munyaneza, J.E.; Swamy, P.; Navarre, D.A. Synthesis and regulation of chlorogenic acid in potato: Rerouting phenylpropanoid flux in HQT-silenced lines. Plant Biotechnol. J. 2015, 13, 551–564. [Google Scholar] [CrossRef]
Figure 1. Expression profile of the 11 candidate reference genes. The box graph displays the quartile spacing. Each color only represents a different candidate internal reference gene. The inner frame of the box reflects the average value of the data, while the outer frame represents the 25th to 75th percentile. The horizontal lines below and above, respectively, showed the minimum and maximum values. The median is the line through the center of the box.
Genes 15 00079 g001
Figure 2. GeNorm was used to analyze the expression stability values (M) of the 11 candidate reference genes. A lower M value denotes a more stable statement. Leftward-pointing genes are less stable than rightward-pointing genes.
Genes 15 00079 g002
Figure 3. The ideal number of reference genes (Vn/n+1) for pairwise variation normalization is determined. Columns with varying colors indicate different treatments.
Genes 15 00079 g003
Figure 4. NormFinder (A), BestKeeper (B), and RefFinder (C) stability analyses of 11 potential reference genes. The stability of the reference gene is shown by the color change, which increases with the decrease of stability. The results of NormFinder, BestKeeper and RefFinder are listed in Tables S4, S5 and S6, respectively.
Genes 15 00079 g004
Figure 5. Relative expression of AdPAL at 0, 2, 12, and 24 h following treatment using the chosen reference genes for normalization. The most unstable reference gene (YLS8) in the various treatment groups and the two most stable reference genes (TIP41 and UBC9) (alone or in combination) in the various treatment groups were the verified reference gene(s) used as normalization factors. Error bars displayed the standard error derived from three biological replicates.
Genes 15 00079 g005
Table 1. Candidate genes and primer pairs used for qPCR normalization in A. dahurica.
Gene SymbolGene NameForward/Reverse Primer (5′-3′)Tm (°C)Size (bp)E (%)R2
SANDSAND family proteinGCTTGCCTTGTTGGATAA59.4101100.400.9964
GATGCTGTGTTCTCTTCTC59.4
PTBPPolypyrimidine tract-binding proteinGTGTGATTGGAACTTGATG58.114994.530.9886
TTACTGATGCTGAGACTG57.4
GAPDHGlyceraldehyde-3-phosphate dehydrogenaseGTATCCGTTGTTGACCTT58.4120100.120.9961
ATCACAGACCTCCAGAAT58.6
ACTActinTTCACCATTCCAGTTCCA59.9147107.350.9902
TATCCGCTTCATCGTTACA60.1
TIP41TIP41-like proteinGCAAGTGAGAGGTCTGAA60.4184106.820.9857
ACAAGTCGGAATATGGAAGT60.5
CYP2Cyclophilin 2AACAGCGACATAATCAAGC60.1125105.680.9901
CTCTCCAGCACCAAGTAA60.0
EF1αElongation factor 1 αGATTGGAGGTATTGGAACT58.0158107.590.9973
CATTGTCACCAGGAAGAG58.8
UBC9Ubiquitin-protein ligase 9CCTCCAGATAGTCCTTATTC57.9165109.070.9973
GCTCCATTGTTCTTTCAG57.4
TUB6Tubulin β-6TGAGATAAGGAAGAGTAGTG57.192102.060.9911
ACATAGGCATAAAGGGATAC58.2
YLS8Thioredoxin-like protein YLS8CTGTTGCGGAGACGATAA60.9191100.670.9953
CTGCTTGTCCTTCATTGC60.5
TUBA(Tubulin-α)AAGGTATGGACGAGATGG59.6181101.410.9974
TCAGCAGTTCACACAGTA59.6
PALPhenylalanine ammonia lyaseGGTGATGGAGAGTATGAA56.7170105.610.9989
GTGGTAATGTGTTGGAAG57.0
Table 2. Rankings of the 11 candidate reference genes based on stability values calculated using different types of algorithms.
Rank1234567891011
SA
geNormEF1α/UBC9/ACTGAPDHTIP41PTBPCYP2TUB6TUBAYLS8SAND
NormFinderEF1αUBC9ACTGAPDHTIP41PTBPCYP2TUB6TUBAYLS8SAND
BestKeeperTUBATUB6CYP2GAPDHEF1αTIP41ACTUBC9PTBPSANDYLS8
Comprehensive RankingEF1αUBC9ACTGAPDHTUBATIP41TUB6CYP2PTBPYLS8SAND
NaCl
geNormGAPDH/CYP2/TIP41ACTTUBAPTBPUBC9EF1αSANDYLS8TUB6
NormFinderACTGADPHTUBATIP41CYP2PTBPUBC9EF1αSANDYLS8YUB6
BestKeeperYLS8UBC9PTBPSANDTUBAACTGAPDHTIP41CYP2EF1αTUB6
Comprehensive RankingGAPDHACTCYP2TUBATIP41PTBPUBC9YLS8SANDEF1αTUB6
MeJA
geNormACT/GAPDH/UBC9TIP41EF1αCYP2TUBATUB6PTBPYLS8SAND
NormFinderGAPDHUBC9ACTEF1αTIP41CYP2PTBPTUBATUB6YLS8SAND
BestKeeperTUBATUB6CYP2EF1αGAPDHACTTIP41UBC9SANDPTBPYLS8
Comprehensive RankingGAPDHACTUBC9EF1αTUBACYP2TIP41TUB6PTBPYLS8SAND
CuSO4
geNormUBC9/PTBP/TIP41GAPDHEF1αCYP2ACTSANDTUBATUB6YLS8
NormFinderGAPDHTIP41EF1αUBC9CYP2ACTPTBPSANDTUBATUB6YLS8
BestKeeperTUBATUB6CYP2EF1αGAPDHACTTIP41SANDUBC9PTBPYLS8
Comprehensive RankingGAPDHTIP41UBC9EF1αPTBPCYP2TUBAACTTUB6SANDYLS8
ETH
geNormEF1α/UBC9/ACTTIP41CYP2YLS8SANDTUBAGAPDHTUB6PTBP
NormFinderEF1αACTUBC9TIP41CYP2YLS8SANDTUBATUB6PTBPGAPDH
BestKeeperGAPDHTUBATIP41UBC9ACTEF1αSANDCYP2YLS8TUB6PTBP
Comprehensive RankingEF1αUBC9ACTTIP41GAPDHCYP2TUBAYLS8SANDTUB6PTBP
ABA
geNormUBC9/TIP41/GAPDHEF1αCYP2TUBATUB6ACTPTBPYLS8SAND
NormFinderUBC9GAPDHTIP41EF1αACTPTBPCYP2TUBATUB6SANDYLS8
BestKeeperTUB6TUBACYP2EF1αGAPDHUBC9TIP41ACTSANDPTBPYLS8
Comprehensive RankingUBC9GAPDHTIP41EF1αTUB6CYP2TUBAACTPTBPSANDYLS8
mannitol
geNormTUB6/GAPDH/CYP2ACTYLS8UBC9TIP41EF1αTUBAPTBPSAND
NormFinderGAPDHTUB6CYP2ACTTIP41UBC9YLS8EF1αTUBAPTBPSAND
BestKeeperTUBAEF1αTUB6UBC9GAPDHCYP2TIP41ACTYLS8SANDPTBP
Comprehensive RankingGAPDHTUB6CYP2ACTTUBAUBC9EF1αTIP41YLS8PTBPSAND
control
geNormEF1α/UBC9/CYP2YLS8ACTTUB6GAPDHPTBPTUBATIP41SAND
NormFinderACTEF1αUBC9TUB6GAPDHYLS8CYYP2PTBPTUBATIP41SAND
BestKeeperEF1αUBC9ACTCYP2YLS8TUB6GAPDHPTBPTIP41TUBASAND
Comprehensive RankingEF1αACTUBC9TUB6CYP2YLS8GAPDHPTBPTUBATIP41SAND
Total
geNormUBC9/TIP41/GAPDHACTEF1αCYP2PTBPYLS8SANDTUBATUB6
NormFinderTIP41ACTEF1αUBC9GAPDHCYP2PTBPSANDTUBAYLS8TUB6
BestKeeperTUBACYP2EF1αGAPDHTUB6UBC9TIP41ACTSANDYLS8PTBP
Comprehensive RankingTIP41UBC9ACTEF1αGAPDHCYP2TUBAPTBPSANDTUB6YLS8
Disclaimer/Publisher’s Note: The statements, opinions and data contained in all publications are solely those of the individual author(s) and contributor(s) and not of MDPI and/or the editor(s). MDPI and/or the editor(s) disclaim responsibility for any injury to people or property resulting from any ideas, methods, instructions or products referred to in the content.

