
An Evolutionary Perspective of Codon Usage Pattern, Dinucleotide Composition and Codon Pair Bias in Prunus Necrotic Ringspot Virus

 , and
, and 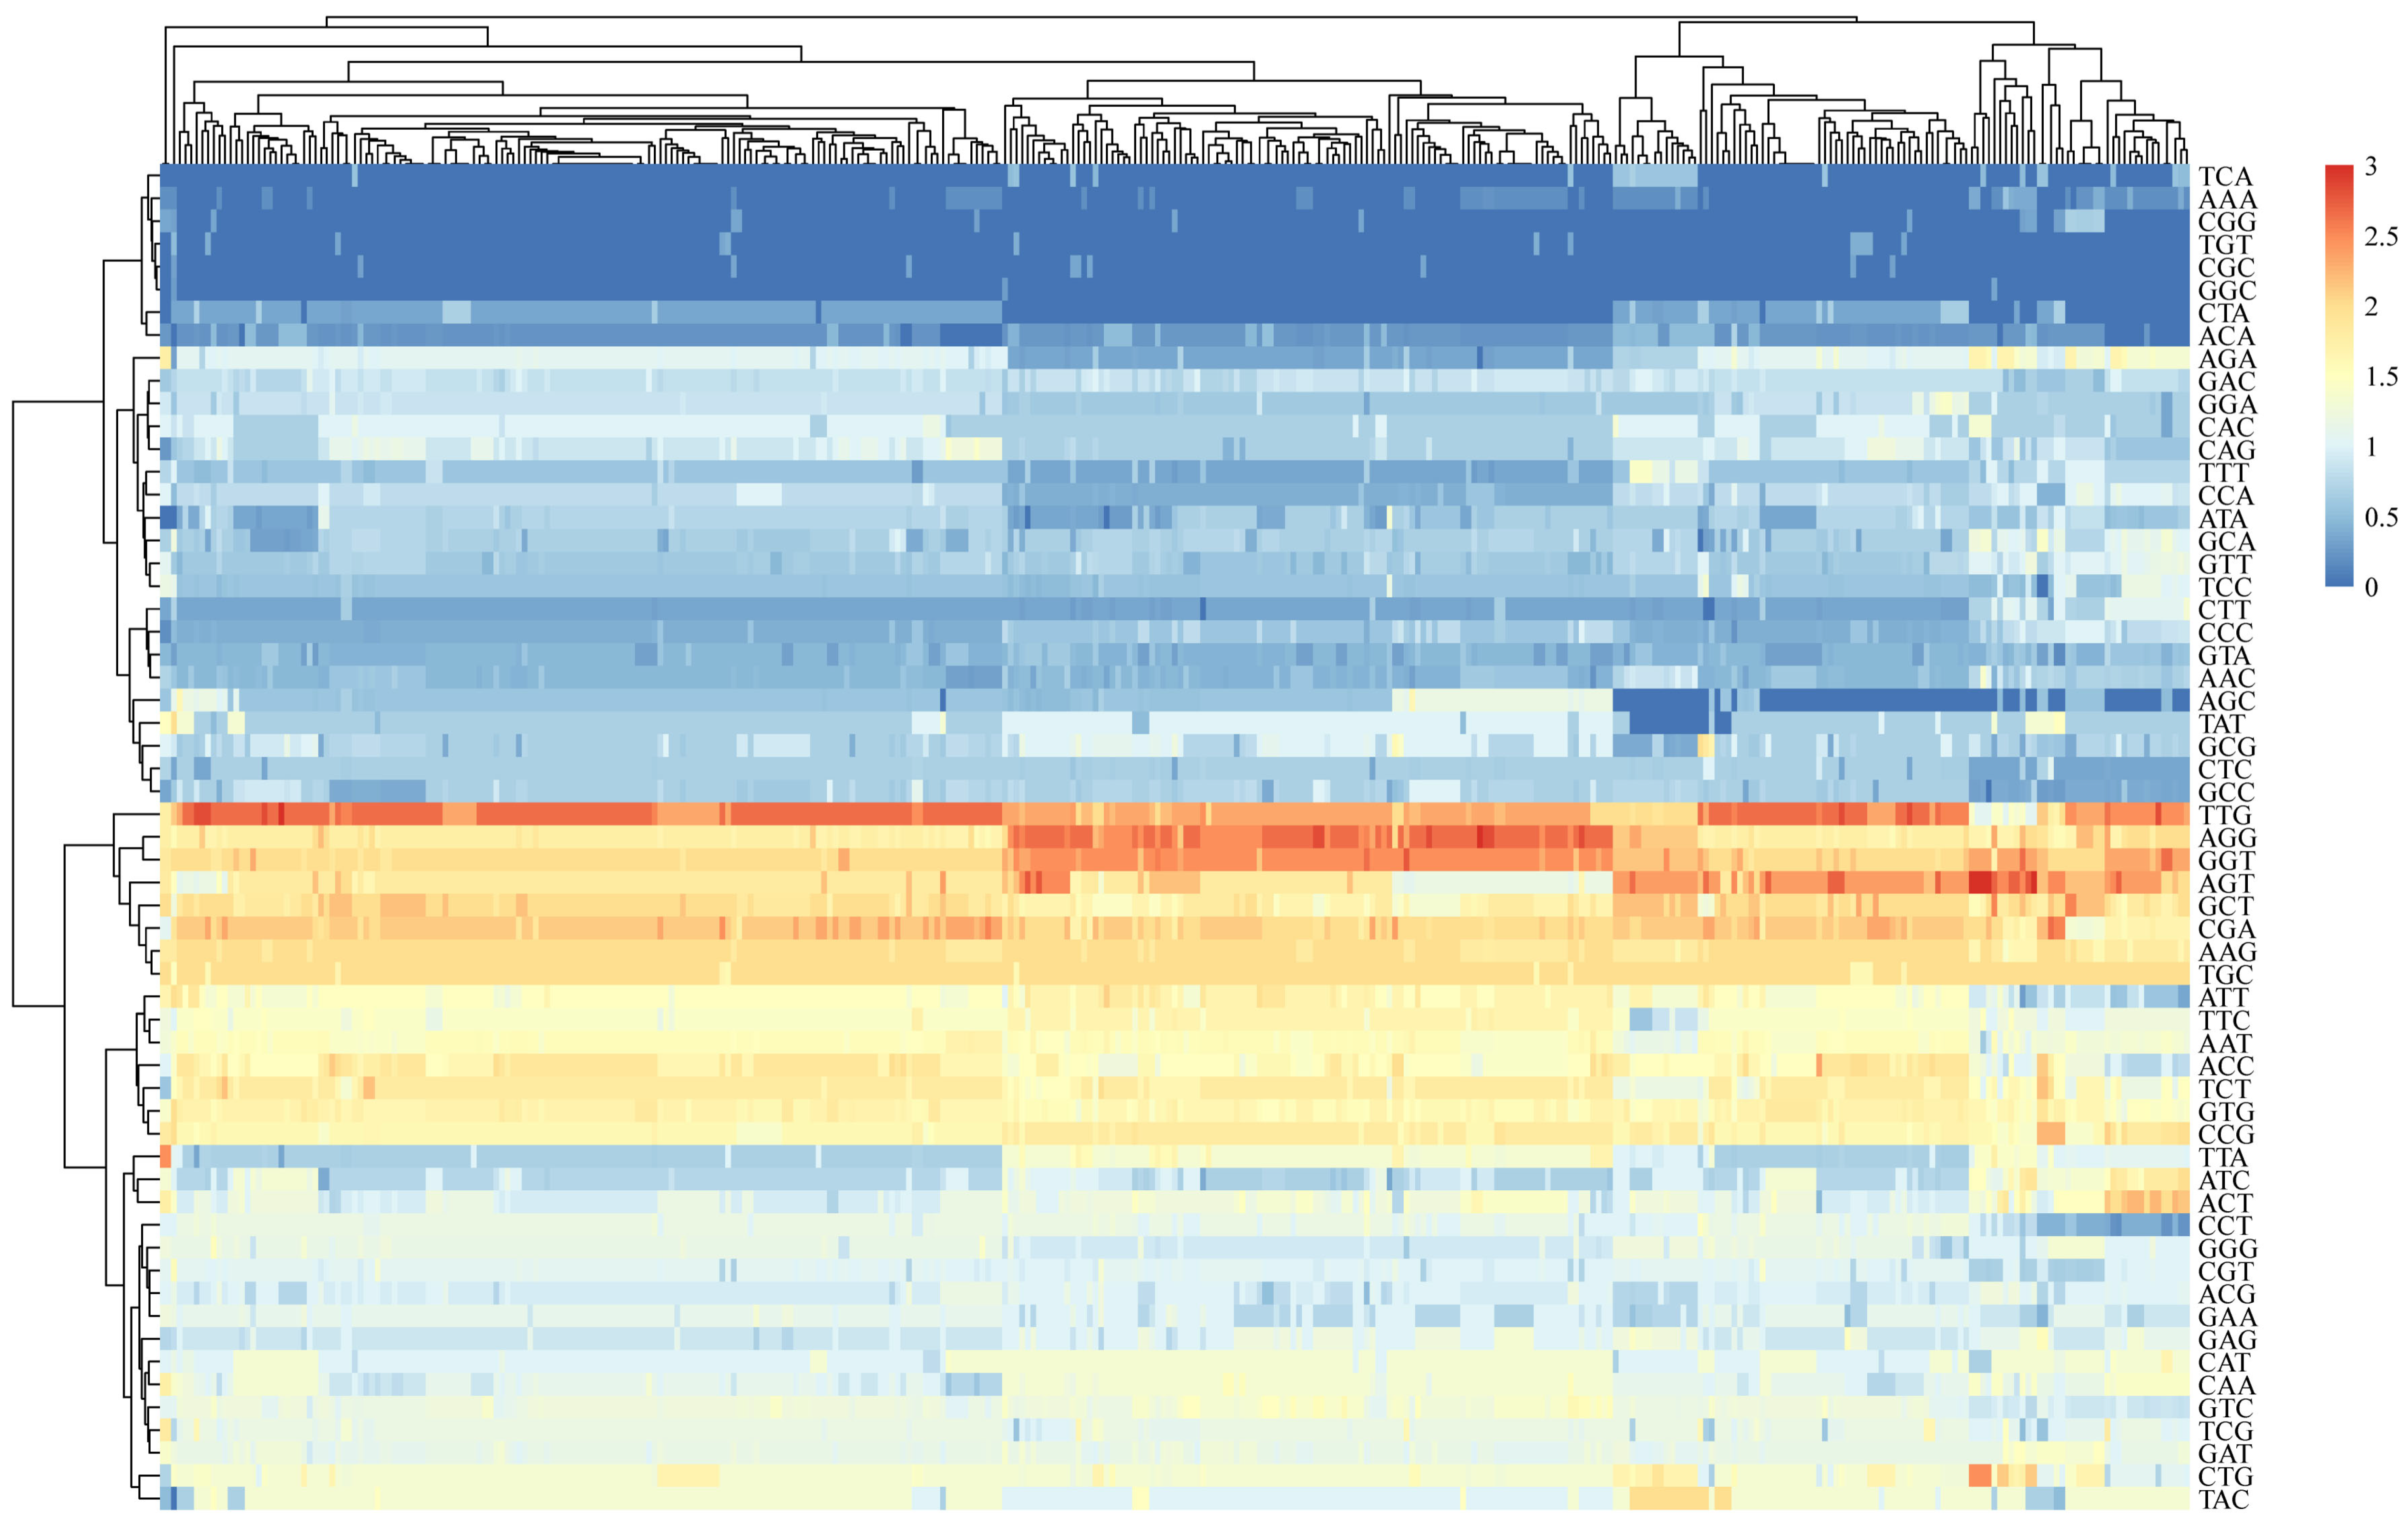
Abstract
1. Introduction
2. Materials and Methods
2.1. Virus Isolates
2.2. Recombination and Phylogenetic Analysis
2.3. Nucleotide Composition Analysis
2.4. Effective Number of Codons (ENC) Analysis
2.5. Relative Synonymous Codon Usage (RSCU) Analysis
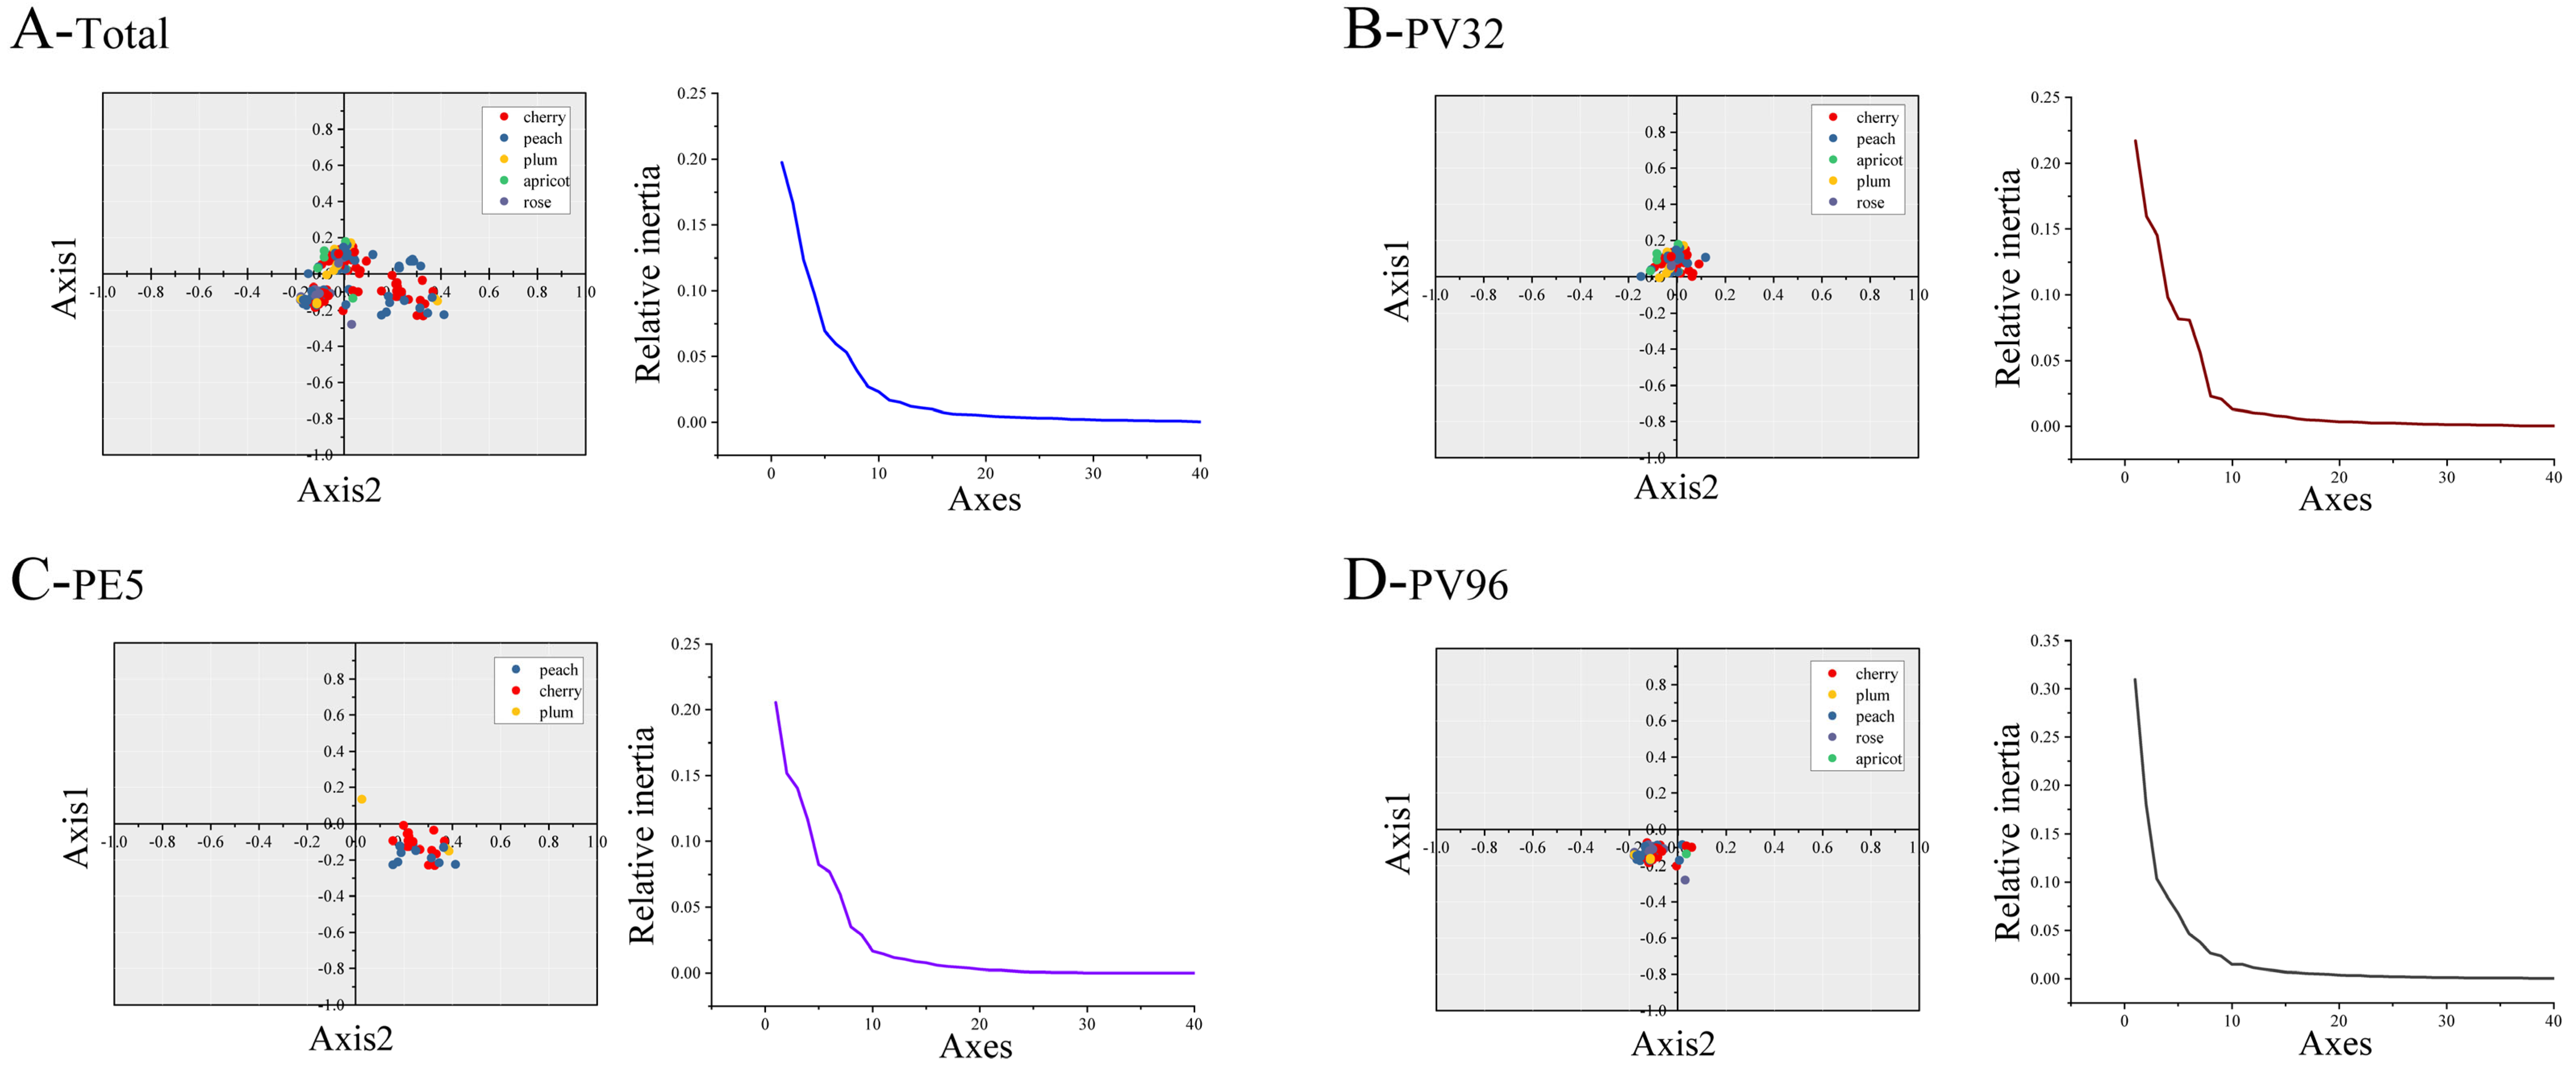
2.6. Principal Component Analysis (PCA)
2.7. ENC-Plot Analysis
2.8. Parity Rule 2 (PR2) Analysis
2.9. Neutrality Analysis
2.10. Codon Adaptation Index (CAI) Analysis
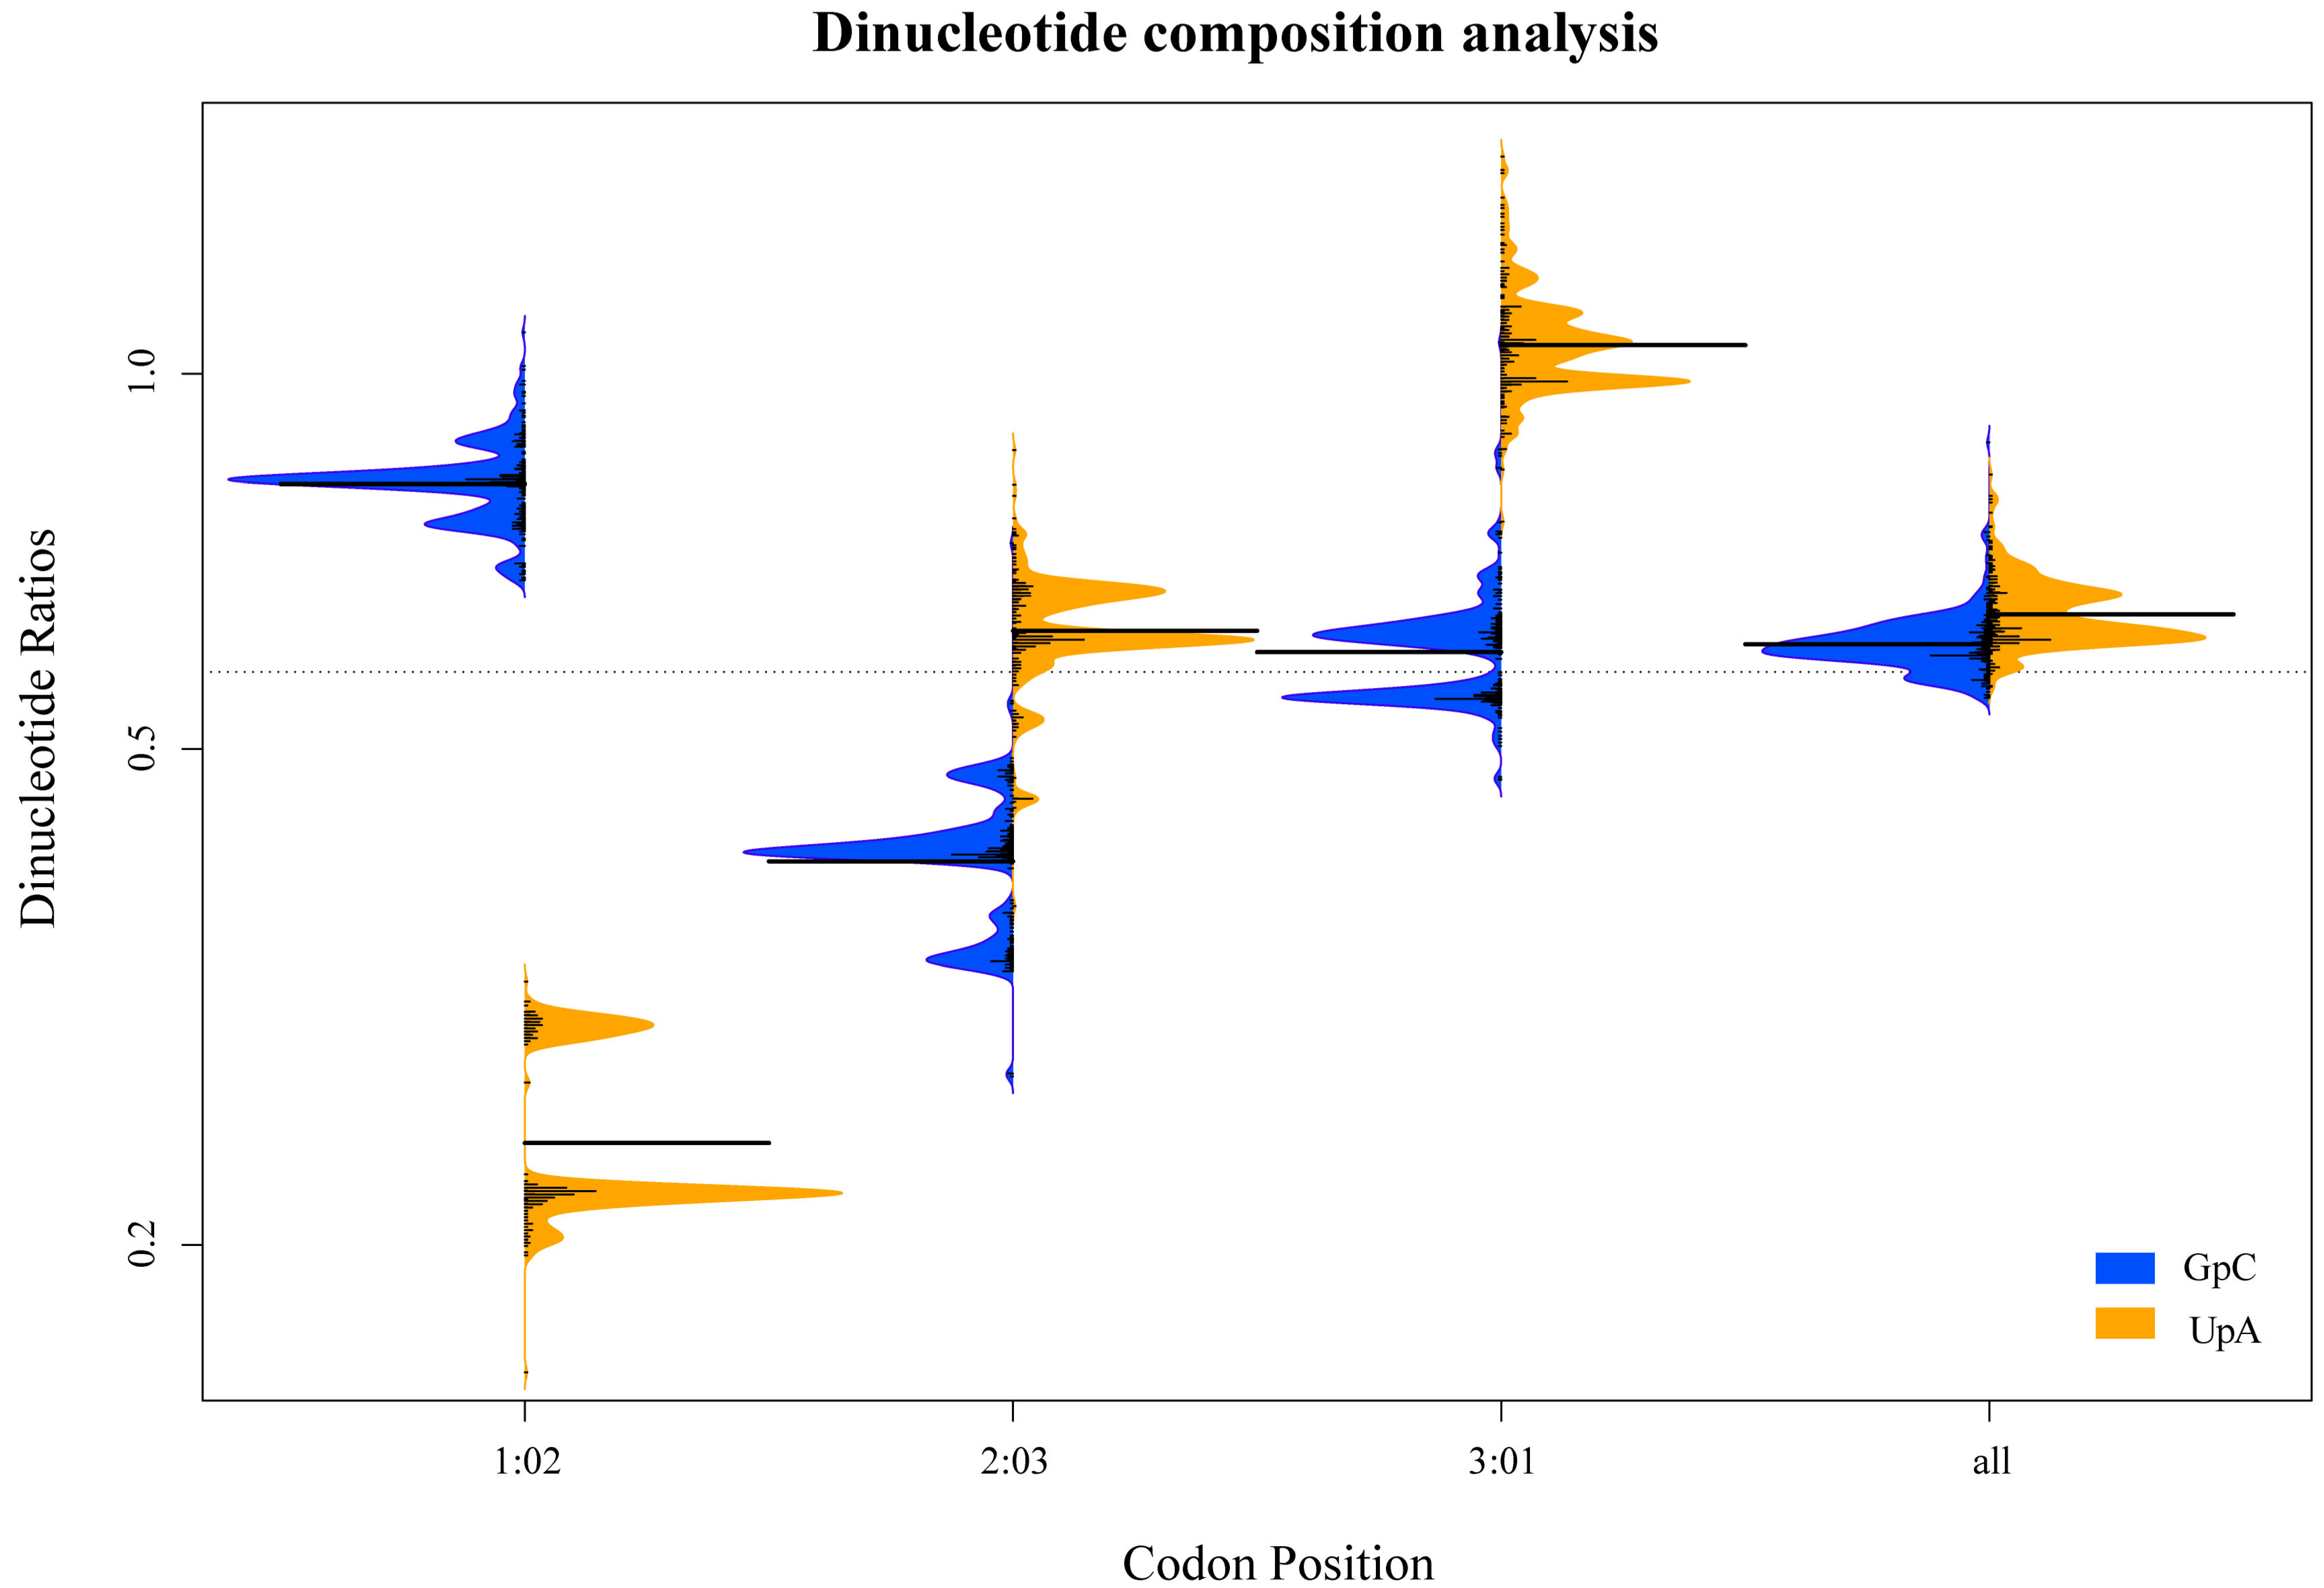
2.11. Dinucleotide Composition Analysis
2.12. Calculation of Codon Pair Bias
3. Results
3.1. Recombination and Phylogenetic Analysis
3.2. Codon Usage Analysis
3.3. Dinucleotide Composition Analysis
3.4. Codon Pair Bias Analysis
4. Discussion
Supplementary Materials
Author Contributions
Funding
Institutional Review Board Statement
Informed Consent Statement
Data Availability Statement
Conflicts of Interest
References
- Bol, J.F. Alfalfa Mosaic Virus and Ilarviruses: Involvement of Coat Protein in Multiple Steps of the Replication Cycle. J. Gen. Virol. 1999, 80, 1089–1102. [Google Scholar] [CrossRef] [PubMed]
- Pallas, V.; Aparicio, F.; Herranz, M.C.; Amari, K.; Sanchez-Pina, M.A.; Myrta, A.; Sanchez-Navarro, J.A. Ilarviruses of Prunus Spp.: A Continued Concern for Fruit Trees. Phytopathology 2012, 102, 1108–1120. [Google Scholar] [CrossRef]
- Bock, K.R. Strains of Prunus Necrotic Ringspot Virus in Hop (Humulus lupulus L.). Ann. Appl. Biol. 1967, 59, 437–446. [Google Scholar] [CrossRef]
- Uyemoto, J.K. Important Diseases of Prunus Caused by Viruses and Other Graft-Transmissible Pathogens in California and South Carolina. Plant Dis. 1992, 76, 5. [Google Scholar] [CrossRef]
- Hammond, R.W. Chapter 38: Prunus Necrotic Ringspot Virus. In Virus and Virus-like Diseases of Pome and Stone Fruits; Virology; The American Phytopathological Society: Saint Paul, MI, USA, 2011; pp. 207–213. [Google Scholar]
- Francki, R.I.B. (Ed.) The Viruses and Their Taxonomy. In The Plant Viruses: Polyhedral Virions with Tripartite Genomes; The Viruses; Springer: Boston, MA, USA, 1985; pp. 1–18. [Google Scholar]
- Aparicio, F.; Pallás, V.; Sánchez-Navarro, J. Implication of the C Terminus of the Prunus Necrotic Ringspot Virus Movement Protein in Cell-to-Cell Transport and in Its Interaction with the Coat Protein. J. Gen. Virol. 2010, 91, 1865–1870. [Google Scholar] [CrossRef]
- Hasegawa, M.; Yasunaga, T.; Miyata, T. Secondary Structure of MS2 Phage RNA and Bias in Code Word Usage. Nucleic Acids Res. 1979, 7, 2073–2079. [Google Scholar] [CrossRef][Green Version]
- Parvathy, S.T.; Udayasuriyan, V.; Bhadana, V. Codon Usage Bias. Mol. Biol. Rep. 2022, 49, 539–565. [Google Scholar] [CrossRef]
- Li, G.; Wang, H.; Wang, S.; Xing, G.; Zhang, C.; Zhang, W.; Liu, J.; Zhang, J.; Su, S.; Zhou, J. Insights into the Genetic and Host Adaptability of Emerging Porcine Circovirus 3. Virulence 2018, 9, 1301–1313. [Google Scholar] [CrossRef]
- Yan, Z.; Wang, R.; Zhang, L.; Shen, B.; Wang, N.; Xu, Q.; He, W.; He, W.; Li, G.; Su, S. Evolutionary Changes of the Novel Influenza D Virus Hemagglutinin-Esterase Fusion Gene Revealed by the Codon Usage Pattern. Virulence 2019, 10, 1–9. [Google Scholar] [CrossRef]
- Butt, A.M.; Nasrullah, I.; Qamar, R.; Tong, Y. Evolution of Codon Usage in Zika Virus Genomes Is Host and Vector Specific. Emerg. Microbes Infect. 2016, 5, e107. [Google Scholar] [CrossRef]
- He, W.; Zhao, J.; Xing, G.; Li, G.; Wang, R.; Wang, Z.; Zhang, C.; Franzo, G.; Su, S.; Zhou, J. Genetic Analysis and Evolutionary Changes of Porcine Circovirus 2. Mol. Phylogenet. Evol. 2019, 139, 106520. [Google Scholar] [CrossRef] [PubMed]
- Zhang, W.; Zhang, L.; He, W.; Zhang, X.; Wen, B.; Wang, C.; Xu, Q.; Li, G.; Zhou, J.; Veit, M.; et al. Genetic Evolution and Molecular Selection of the HE Gene of Influenza C Virus. Viruses 2019, 11, 167. [Google Scholar] [CrossRef]
- Supek, F. The Code of Silence: Widespread Associations between Synonymous Codon Biases and Gene Function. J. Mol. Evol. 2016, 82, 65–73. [Google Scholar] [CrossRef]
- Buchan, J.R.; Aucott, L.S.; Stansfield, I. TRNA Properties Help Shape Codon Pair Preferences in Open Reading Frames. Nucleic Acids Res. 2006, 34, 1015–1027. [Google Scholar] [CrossRef] [PubMed]
- Duret, L.; Mouchiroud, D. Expression Pattern and, Surprisingly, Gene Length Shape Codon Usage in Caenorhabditis, Drosophila, and Arabidopsis. Proc. Natl. Acad. Sci. USA 1999, 96, 4482–4487. [Google Scholar] [CrossRef]
- Sueoka, N. Translation-Coupled Violation of Parity Rule 2 in Human Genes Is Not the Cause of Heterogeneity of the DNA G+C Content of Third Codon Position. Gene 1999, 238, 53–58. [Google Scholar] [CrossRef]
- Willner, D.; Thurber, R.V.; Rohwer, F. Metagenomic Signatures of 86 Microbial and Viral Metagenomes. Environ. Microbiol. 2009, 11, 1752–1766. [Google Scholar] [CrossRef] [PubMed]
- Kariin, S.; Burge, C. Dinucleotide Relative Abundance Extremes: A Genomic Signature. Trends Genet. 1995, 11, 283–290. [Google Scholar] [CrossRef]
- He, Z.; Qin, L.; Xu, X.; Ding, S. Evolution and Host Adaptability of Plant RNA Viruses: Research Insights on Compositional Biases. Comput. Struct. Biotechnol. J. 2022, 20, 2600–2610. [Google Scholar] [CrossRef]
- Sexton, N.R.; Ebel, G.D. Effects of Arbovirus Multi-Host Life Cycles on Dinucleotide and Codon Usage Patterns. Viruses 2019, 11, 643. [Google Scholar] [CrossRef]
- Linthicum, K.J.; Britch, S.C.; Anyamba, A. Rift Valley Fever: An Emerging Mosquito-Borne Disease. Annu. Rev. Entomol. 2016, 61, 395–415. [Google Scholar] [CrossRef]
- Lobo, F.P.; Mota, B.E.; Pena, S.D.; Azevedo, V.; Macedo, A.M.; Tauch, A.; Machado, C.R.; Franco, G.R. Virus-Host Coevolution: Common Patterns of Nucleotide Motif Usage in Flaviviridae and Their Hosts. PLoS ONE 2009, 4, e6282. [Google Scholar] [CrossRef] [PubMed]
- Di Giallonardo, F.; Schlub, T.E.; Shi, M.; Holmes, E.C. Dinucleotide Composition in Animal RNA Viruses Is Shaped More by Virus Family than by Host Species. J. Virol. 2017, 91, e02381-16. [Google Scholar] [CrossRef] [PubMed]
- Wong, E.H.; Smith, D.K.; Rabadan, R.; Peiris, M.; Poon, L.L. Codon Usage Bias and the Evolution of Influenza A Viruses. Codon Usage Biases of Influenza Virus. BMC Evol. Biol. 2010, 10, 253. [Google Scholar] [CrossRef] [PubMed]
- Shen, S.H.; Stauft, C.B.; Gorbatsevych, O.; Song, Y.; Ward, C.B.; Yurovsky, A.; Mueller, S.; Futcher, B.; Wimmer, E. Large-Scale Recoding of an Arbovirus Genome to Rebalance Its Insect versus Mammalian Preference. Proc. Natl. Acad. Sci. USA 2015, 112, 4749–4754. [Google Scholar] [CrossRef] [PubMed]
- Moura, G.; Pinheiro, M.; Arrais, J.; Gomes, A.C.; Carreto, L.; Freitas, A.; Oliveira, J.L.; Santos, M.A.S. Large Scale Comparative Codon-Pair Context Analysis Unveils General Rules That Fine-Tune Evolution of MRNA Primary Structure. PLoS ONE 2007, 2, e847. [Google Scholar] [CrossRef]
- Moura, G.; Pinheiro, M.; Silva, R.; Miranda, I.; Afreixo, V.; Dias, G.; Freitas, A.; Oliveira, J.L.; Santos, M.A. Comparative Context Analysis of Codon Pairs on an ORFeome Scale. Genome Biol. 2005, 6, R28. [Google Scholar] [CrossRef]
- Beutler, E.; Gelbart, T.; Han, J.H.; Koziol, J.A.; Beutler, B. Evolution of the Genome and the Genetic Code: Selection at the Dinucleotide Level by Methylation and Polyribonucleotide Cleavage. Proc. Natl. Acad. Sci. USA 1989, 86, 192–196. [Google Scholar] [CrossRef]
- Kunec, D.; Osterrieder, N. Codon Pair Bias Is a Direct Consequence of Dinucleotide Bias. Cell Rep. 2016, 14, 55–67. [Google Scholar] [CrossRef]
- Coleman, J.R.; Papamichail, D.; Skiena, S.; Futcher, B.; Wimmer, E.; Mueller, S. Virus Attenuation by Genome-Scale Changes in Codon Pair Bias. Science 2008, 320, 1784–1787. [Google Scholar] [CrossRef]
- Gutman, G.A.; Hatfield, G.W. Nonrandom Utilization of Codon Pairs in Escherichia Coli. Proc. Natl. Acad. Sci. USA 1989, 86, 3699–3703. [Google Scholar] [CrossRef] [PubMed]
- Buchan, R.; Stansfield, I. Codon Pair Bias in Prokaryotic and Eukaryotic Genomes. BMC Bioinform. 2005, 6, P4. [Google Scholar] [CrossRef]
- Irwin, B.; Heck, J.D.; Hatfield, G.W. Codon Pair Utilization Biases Influence Translational Elongation Step Times. J. Biol. Chem. 1995, 270, 22801–22806. [Google Scholar] [CrossRef]
- Song, S.; Li, Z.; Song, W.; Chen, W.; Wu, Y. Complete Genomic Sequence of A Sweet Cherry Isolate of Prunus Necrotic Ringspot Virus from China. J. Plant Pathol. 2016, 98, 163–166. [Google Scholar]
- Aparicio, F.; Myrta, A.; Di Terlizzi, B.; Pallás, V. Molecular Variability Among Isolates of Prunus Necrotic Ringspot Virus from Different Prunus spp. Phytopathology 1999, 89, 991–999. [Google Scholar] [CrossRef] [PubMed]
- Glasa, M.; Betinová, E.; Kúdela, O.; Šubr, Z. Biological and Molecular Characterisation of Prunus Necrotic Ringspot Virus Isolates and Possible Approaches to Their Phylogenetic Typing. Ann. Appl. Biol. 2002, 140, 279–283. [Google Scholar] [CrossRef]
- Saánchez-Navarro, J.A.; Pallaás, V. Evolutionary Relationships in the Ilarviruses: Nucleotide Sequence of Prunus Necrotic Ringspot Virus RNA 3. Arch. Virol. 1997, 142, 749–763. [Google Scholar] [CrossRef]
- Qin, L.; Ding, S.; He, Z. Compositional Biases and Evolution of the Largest Plant RNA Virus Order Patatavirales. Int. J. Biol. Macromol. 2023, 240, 124403. [Google Scholar] [CrossRef]
- Larkin, M.A.; Blackshields, G.; Brown, N.P.; Chenna, R.; McGettigan, P.A.; McWilliam, H.; Valentin, F.; Wallace, I.M.; Wilm, A.; Lopez, R.; et al. Clustal W and Clustal X version 2.0. Bioinformatics 2007, 23, 2947–2948. [Google Scholar] [CrossRef]
- Martin, D.P.; Murrell, B.; Golden, M.; Khoosal, A.; Muhire, B. RDP4: Detection and Analysis of Recombination Patterns in Virus Genomes. Virus Evol. 2015, 1, vev003. [Google Scholar] [CrossRef]
- Salminen, M.O.; Carr, J.K.; Burke, D.S.; McCutchan, F.E. Identification of Breakpoints in Intergenotypic Recombinants of HIV Type 1 by Bootscanning. AIDS Res. Hum. Retroviruses 1995, 11, 1423–1425. [Google Scholar] [CrossRef] [PubMed]
- Sawyer, S. GENECONV: A Computer Package for the Statistical Detection of Gene Conversion. 1999. Available online: https://www.math.wustl.edu/~sawyer/ (accessed on 19 July 2023).
- Boni, M.F.; Posada, D.; Feldman, M.W. An Exact Nonparametric Method for Inferring Mosaic Structure in Sequence Triplets. Genetics 2007, 176, 1035–1047. [Google Scholar] [CrossRef] [PubMed]
- Smith, J.M. Analyzing the mosaic structure of genes. J. Mol. Evol. 1992, 34, 126–129. [Google Scholar] [PubMed]
- Posada, D.; Crandall, K.A. Evaluation of Methods for Detecting Recombination from DNA Sequences: Computer Simulations. Proc. Natl. Acad. Sci. USA 2001, 98, 13757–13762. [Google Scholar] [CrossRef]
- Gibbs, M.J.; Armstrong, J.S.; Gibbs, A.J. Sister-Scanning: A Monte Carlo Procedure for Assessing Signals in Recombinant Sequences. Bioinformatics 2000, 16, 573–582. [Google Scholar] [CrossRef]
- Minh, B.Q.; Schmidt, H.A.; Chernomor, O.; Schrempf, D.; Woodhams, M.D.; von Haeseler, A.; Lanfear, R. IQ-TREE 2: New Models and Efficient Methods for Phylogenetic Inference in the Genomic Era. Mol. Biol. Evol. 2020, 37, 1530–1534. [Google Scholar] [CrossRef]
- Letunic, I.; Bork, P. Interactive Tree Of Life (ITOL) v5: An Online Tool for Phylogenetic Tree Display and Annotation. Nucleic Acids Res. 2021, 49, W293–W296. [Google Scholar]
- Puigbò, P.; Aragonès, L.; Garcia-Vallvé, S. RCDI/ERCDI: A Web-Server to Estimate Codon Usage Deoptimization. BMC Res. Notes 2010, 3, 87. [Google Scholar] [CrossRef]
- Belalov, I.S.; Lukashev, A.N. Causes and Implications of Codon Usage Bias in RNA Viruses. PLoS ONE 2013, 8, e56642. [Google Scholar] [CrossRef]
- Sharp, P.M.; Li, W.H. An evolutionary perspective on synonymous codon usage in unicellular organisms. J. Mol. Evol. 1986, 24, 28–38. [Google Scholar] [CrossRef]
- Behura, S.K.; Singh, B.K.; Severson, D.W. Antagonistic Relationships between Intron Content and Codon Usage Bias of Genes in Three Mosquito Species: Functional and Evolutionary Implications. Evol. Appl. 2013, 6, 1079–1089. [Google Scholar] [CrossRef] [PubMed]
- Gu, H.; Fan, R.L.Y.; Wang, D.; Poon, L.L.M. Dinucleotide Evolutionary Dynamics in Influenza A Virus. Virus Evol. 2019, 5, vez038. [Google Scholar] [CrossRef] [PubMed]
- Karlin, S.; Mrázek, J. Compositional Differences within and between Eukaryotic Genomes. Proc. Natl. Acad. Sci. USA 1997, 94, 10227–10232. [Google Scholar] [CrossRef] [PubMed]
- Chandel, V.; Rana, T.; Handa, A.; Thakur, P.D.; Hallan, V.; Zaidi, A.A. Incidence of Prunus Necrotic Ring Spot Virus on Malus Domestica in India. J. Phytopathol. 2008, 156, 382–384. [Google Scholar] [CrossRef]
- Xing, F.; Gao, D.; Liu, H.; Wang, H.; Habili, N.; Li, S. Molecular Characterization and Pathogenicity Analysis of Prunus Necrotic Ringspot Virus Isolates from China Rose (Rosa Chinensis Jacq.). Arch. Virol. 2020, 165, 2479–2486. [Google Scholar] [CrossRef]
- Song, S.; Sun, P.-P.; Chen, Y.-H.; Ma, Q.; Wang, X.-Y.; Zhao, M.-M.; Li, Z.-N. Complete Genome Sequences of Five Prunus Necrotic Ringspot Virus Isolates from Inner Mongolia of China and Comparison to Other PNRSV Isolates around the World. J. Plant Pathol. 2019, 101, 1047–1054. [Google Scholar] [CrossRef]
- Cui, H.G.; Liu, H.Z.; Chen, J.; Zhou, J.F.; Qu, L.N.; Su, J.M.; Wang, G.P.; Hong, N. Genetic Diversity of Prunus Necrotic Ringspot Virus Infecting Stone Fruit Trees Grown at Seven Regions in China and Differentiation of Three Phylogroups by Multiplex RT-PCR. Crop Prot. 2015, 74, 30–36. [Google Scholar] [CrossRef]
- He, Z.; Dong, Z.; Gan, H. Genetic Changes and Host Adaptability in Sugarcane Mosaic Virus Based on Complete Genome Sequences. Mol. Phylogenet. Evol. 2020, 149, 106848. [Google Scholar] [CrossRef]
- Chakraborty, P.; Das, S.; Saha, B.; Sarkar, P.; Karmakar, A.; Saha, A.; Saha, D.; Saha, A. Phylogeny and Synonymous Codon Usage Pattern of Papaya Ringspot Virus Coat Protein Gene in the Sub-Himalayan Region of North-East India. Can. J. Microbiol. 2015, 61, 555–564. [Google Scholar] [CrossRef]
- He, Z.; Gan, H.; Liang, X. Analysis of Synonymous Codon Usage Bias in Potato Virus M and Its Adaption to Hosts. Viruses 2019, 11, 752. [Google Scholar] [CrossRef]
- Biswas, K.K.; Palchoudhury, S.; Chakraborty, P.; Bhattacharyya, U.K.; Ghosh, D.K.; Debnath, P.; Ramadugu, C.; Keremane, M.L.; Khetarpal, R.K.; Lee, R.F. Codon Usage Bias Analysis of Citrus Tristeza Virus: Higher Codon Adaptation to Citrus Reticulata Host. Viruses 2019, 11, 331. [Google Scholar] [CrossRef] [PubMed]
- He, Z.; Dong, Z.; Qin, L.; Gan, H. Phylodynamics and Codon Usage Pattern Analysis of Broad Bean Wilt Virus 2. Viruses 2021, 13, 198. [Google Scholar] [CrossRef] [PubMed]
- He, M.; Guan, S.-Y.; He, C.-Q. Evolution of Rice Stripe Virus. Mol. Phylogenet. Evol. 2017, 109, 343–350. [Google Scholar] [CrossRef]
- He, Z.; Dong, Z.; Gan, H. Comprehensive Codon Usage Analysis of Rice Black-Streaked Dwarf Virus Based on P8 and P10 Protein Coding Sequences. Infect. Genet. Evol. 2020, 86, 104601. [Google Scholar] [CrossRef]
- He, Z.; Ding, S.; Guo, J.; Qin, L.; Xu, X. Synonymous Codon Usage Analysis of Three Narcissus Potyviruses. Viruses 2022, 14, 846. [Google Scholar] [CrossRef] [PubMed]
- Novembre, J.A. Accounting for Background Nucleotide Composition When Measuring Codon Usage Bias. Mol. Biol. Evol. 2002, 19, 1390–1394. [Google Scholar] [CrossRef]
- Moriyama, E. Gene Length and Codon Usage Bias in Drosophila Melanogaster, Saccharomyces Cerevisiae and Escherichia coli. Nucleic Acids Res. 1998, 26, 3188–3193. [Google Scholar] [CrossRef]
- Romero, H.; Zavala, A.; Musto, H. Codon Usage in Chlamydia Trachomatis Is the Result of Strand-Specific Mutational Biases and a Complex Pattern of Selective Forces. Nucleic Acids Res. 2000, 28, 2084–2090. [Google Scholar] [CrossRef]
- Rima, B.K.; McFerran, N.V. Dinucleotide and Stop Codon Frequencies in Single-Stranded RNA Viruses. J. Gen. Virol. 1997, 78 Pt 11, 2859–2870. [Google Scholar] [CrossRef]
- González de Prádena, A.; Sánchez Jimenez, A.; San León, D.; Simmonds, P.; García, J.A.; Valli, A.A. Plant Virus Genome Is Shaped by Specific Dinucleotide Restrictions That Influence Viral Infection. mBio 2020, 11, e02818-19. [Google Scholar] [CrossRef]


Disclaimer/Publisher’s Note: The statements, opinions and data contained in all publications are solely those of the individual author(s) and contributor(s) and not of MDPI and/or the editor(s). MDPI and/or the editor(s) disclaim responsibility for any injury to people or property resulting from any ideas, methods, instructions or products referred to in the content. |
© 2023 by the authors. Licensee MDPI, Basel, Switzerland. This article is an open access article distributed under the terms and conditions of the Creative Commons Attribution (CC BY) license (https://creativecommons.org/licenses/by/4.0/).
Share and Cite
Wang, L.; Zhao, H.; Wang, Z.; Ding, S.; Qin, L.; Jiang, R.; Deng, X.; He, Z.; Li, L. An Evolutionary Perspective of Codon Usage Pattern, Dinucleotide Composition and Codon Pair Bias in Prunus Necrotic Ringspot Virus. Genes 2023, 14, 1712. https://doi.org/10.3390/genes14091712
Wang L, Zhao H, Wang Z, Ding S, Qin L, Jiang R, Deng X, He Z, Li L. An Evolutionary Perspective of Codon Usage Pattern, Dinucleotide Composition and Codon Pair Bias in Prunus Necrotic Ringspot Virus. Genes. 2023; 14(9):1712. https://doi.org/10.3390/genes14091712
Chicago/Turabian StyleWang, Lingqi, Haiting Zhao, Zhilei Wang, Shiwen Ding, Lang Qin, Runzhou Jiang, Xiaolong Deng, Zhen He, and Liangjun Li. 2023. "An Evolutionary Perspective of Codon Usage Pattern, Dinucleotide Composition and Codon Pair Bias in Prunus Necrotic Ringspot Virus" Genes 14, no. 9: 1712. https://doi.org/10.3390/genes14091712
APA StyleWang, L., Zhao, H., Wang, Z., Ding, S., Qin, L., Jiang, R., Deng, X., He, Z., & Li, L. (2023). An Evolutionary Perspective of Codon Usage Pattern, Dinucleotide Composition and Codon Pair Bias in Prunus Necrotic Ringspot Virus. Genes, 14(9), 1712. https://doi.org/10.3390/genes14091712