Article

Genome-Wide Identification and Characterization of the Phytochrome Gene Family in Peanut

Institute of Industrial Crops, Jiangsu Academy of Agricultural Sciences, Nanjing 210014, China
*
Author to whom correspondence should be addressed.
Genes 2023, 14(7), 1478; https://doi.org/10.3390/genes14071478
Submission received: 5 June 2023 / Revised: 4 July 2023 / Accepted: 18 July 2023 / Published: 20 July 2023
(This article belongs to the Special Issue Peanut Genetic Breeding and Germplasm Innovation)

Abstract

:
To investigate the potential role of phytochrome (PHY) in peanut growth and its response to environmental fluctuations, eight candidate AhPHY genes were identified via genome-wide analysis of cultivated peanut. These AhPHY polypeptides were determined to possess acidic and hydrophilic physiochemical properties and exhibit subcellular localization patterns consistent with residence in the nucleus and cytoplasm. Phylogenetic analysis revealed that the AhPHY gene family members were classified into three subgroups homologous to the PHYA/B/E progenitors of Arabidopsis. AhPHY genes within the same clade largely displayed analogous gene structure, conserved motifs, and phosphorylation sites. AhPHY exhibited symmetrical distribution across peanut chromosomes, with 7 intraspecific syntenic gene pairs in peanut, as well as 4 and 20 interspecific PHY syntenic gene pairs in Arabidopsis and soybean, respectively. A total of 42 cis-elements were predicted in AhPHY promoters, including elements implicated in phytohormone regulation, stress induction, physiology, and photoresponse, suggesting putative fundamental roles across diverse biological processes. Moreover, spatiotemporal transcript profiling of AhPHY genes in various peanut tissues revealed distinct expression patterns for each member, alluding to putative functional specialization. This study contributes novel insights into the classification, structure, molecular evolution, and expression profiles of the peanut phytochrome gene family, and also provides phototransduction gene resources for further mechanistic characterization.

1. Introduction

Light constitutes a crucial environmental factor that regulates plant growth and developmental dynamics, governing processes such as photosynthesis and photomorphogenetics. Previous studies have demonstrated that plant photochromic systems predominantly consist of three classic families of photoreceptors: phytochromes (PHY) that detect red/far-red (R/FR) light, cryptochromes (CRY), and phototropins (PHOT) that detect blue/UV-A light. These photosensory chromoproteins are capable of accurately perceiving various attributes of ambient light including wavelength, intensity, directionality, and periodicity [1].
Phytochromes are capable of photo-interconversion between the biologically active far-red light-absorbing form (Pfr) and the inactive red light-absorbing form (Pr) upon exposure to red light and far-red light, respectively [2,3]. The typical structure of plant phytochromes consists of a highly conserved N-terminal PAS-GAF-PHY* photosensory module and a C-terminal HKRD regulatory module. A cysteine residue on the GAF domain covalently anchors a tetrapyrrole chromophore, whose inherent photochemical properties govern the reversible photoisomerization of the phytochrome between the Pr and Pfr conformers [4,5].
The model plant Arabidopsis thaliana possesses five phytochrome genes (PHYA-PHYE) that have evolved through a series of duplication events [6]. While sharing some degree of sequence similarity, these phytochromes display divergent biochemical properties and significant functional diversity during plant morphogenesis. Studies have shown that PHYA exhibits rapid Pfr instability and can transduce signals upon rapid photoreversible conversion between Pr and Pfr forms, thus promoting plant de-etiolation. PHYA specifically mediates the very-low-fluence response (VLFR) regulating seed germination under very low light and the far-red high-irradiance response (FR-HIR) regulating seedling morphogenesis under vegetation shade. In contrast, PHYB/C/D/E are relatively Pfr-stable, with PHYB functioning as the primary photosensor mediating the classic reversible red/far-red low-fluence response (LFR) and red high-irradiance response (R-HIR) that govern nearly all stages of plant development [7,8,9].
Phytochromes have been extensively characterized in multiple crop species such as rice [10], millet [11], maize [12,13], mungbean [14], soybean [15,16], potato [17] and tomato [18,19] utilizing genetic and molecular techniques. However, the phytochrome gene family of peanut remains poorly characterized. By leveraging the genome data of cultivated peanut in conjunction with bioinformatics tools, this study identified and analyzed the physiochemical properties, structural features, molecular evolution, and putative functions of peanut phytochromes, providing a theoretical framework for in-depth mechanistic characterization of the AhPHY gene family.

2. Materials and Methods

2.1. Prediction of PHY Genes in Peanut

The experimental material for this study was the cultivated peanut (Arachis hypogaea L. cv. Tifrunner). Genome and protein sequences for cultivated peanut were obtained from the Peanutbase database (https://www.peanutbase.org/, accessed on 15 January 2023) and locally compiled. Based on the conserved domains of the phytochrome gene family in Arabidopsis, hidden Markov models of the PHY* (PF00360) and GAF (PF01590) domains were retrieved from the InterPro database (https://www.ebi.ac.uk/interpro/, accessed on 14 January 2023). The PHY*.OUT and GAF.OUT seed alignments were constructed using the hmmbuild of the HMMER tool (version 3.0) and hmmsearch of CMD locally. The polypeptide sequences were then extracted using SeqHunter tool (version 1.0) with an E-value cutoff of 1 × 10⁻¹⁰. Alignments of preselected protein sequences were performed with the SMART sequence analysis tool (http://smart.embl-heidelberg.de/, accessed on 15 January 2023). Repetitive sequences and redundant transcripts were eliminated, and the candidate members of the peanut PHY gene family were identified.
Multiple sequence alignment analysis was performed on the PHY family protein sequences of peanut (Arachis hypogaea), soybean (Glycine max), and Arabidopsis (Arabidopsis thaliana) using Clustal X software (version 1.83) [20]. A phylogenetic tree was constructed using the maximum likelihood method in MEGA X software (version 10.1.8) with a bootstrap value of 1000 [21]. Data on Arabidopsis and soybean were obtained from the TAIR database (https://www.arabidopsis.org/, accessed on 5 February 2023) and Phytozome database (https://Phytozome-next.jgi.doe.gov/, accessed on 5 February 2023), respectively.

2.2. Sequence Structure Analysis

To characterize the gene features of AhPHY, various bioinformatics tools for in silico analyses were employed. The physicochemical properties were analyzed using the ProtParam tool from ExPASy (https://web.expasy.org/protparam/, accessed on 7 February 2023) to determine the number of amino acids (aa), molecular weight (MW), theoretical isoelectric points (pI), instability index (II), aliphatic index, and grand average of hydropathicity (GRAVY). The presence and location of signal peptides were predicted using SignalP version 5.0 (https://services.healthtech.dtu.dk/services/SignalP-5.0/, accessed on 8 February 2023). Transmembrane helices were predicted using TMHMM version 2.0 (https://services.healthtech.dtu.dk/services/TMHMM-2.0/, accessed on 8 February 2023). Subcellular localization was predicted using ProtComp version 9.0 (http://linux1.softberry.com/berry.phtml?topic=protcomppl&group=programs&subgroup=proloc/, accessed on 8 February 2023). Phosphorylation sites for serine, threonine, and tyrosine were predicted using NetPhos version 3.1 (https://services.healthtech.dtu.dk/service.php?NetPhos/, accessed on 12 February 2023).
Conserved motifs of candidate proteins were analyzed using the MEME suite version 5.5.3 (https://meme-suite.org/meme/tools/meme/, accessed on 9 February 2023) with the following parameters: maximum 10 motifs, minimum motif width 6, and maximum motif width 50 [22]. The resulting meme.xml file was downloaded for further analysis. To confirm the presence of conserved domains, the batch CD-search tool from NCBI (https://www.ncbi.nlm.nih.gov/cdd/, accessed on 10 February 2023) was utilized and the resulting hitdata.txt file was downloaded for further analysis. The conserved motifs and domains in candidate genes were both visualized using TBtools software (version 1.112) [23]. Coding (CDS) and genomic sequences (in FASTA format) for candidate genes were retrieved from local datasets, then gene structure visualization was performed using GSDS version 2.0 (http://gsds.gao-lab.org/, accessed on 10 February 2023) [24].
The secondary structures of candidate proteins were predicted using the SOPMA web server (https://npsa-prabi.ibcp.fr/cgi-bin/npsa_automat.pl?page=/NPSA/npsa_sopma.html/, accessed on 15 February 2023) with default parameters. While tertiary protein structures were modeled using the SWISS-MODEL web server (https://swissmodel.expasy.org/, accessed on 15 February 2023) with default parameters.

2.3. Chromosomal Localization and Syntenic Analysis

Chromosomal location information of the peanut PHY gene family was retrieved from local datasets, and physical distribution of candidate genes on peanut chromosomes was annotated using TBtools. Based on the genomic and structural annotation datasets of peanut, Arabidopsis, and soybean, collinearity maps of peanut PHY genes within and across species were constructed and visualized using TBtools, then exported as an SVG vector graphic file, which was further refined using Adobe Illustrator software (version 15.0.0).

2.4. Cis-Elements Prediction and Expression Pattern Analysis

The 2000 bp upstream promoter regions proximal to the start codon of the CDS for each AhPHY gene were retrieved from the local cultivated peanut genome dataset using SeqHunter based on sequence coordinates. Putative cis-elements within candidate genes were then predicted using PlantCARE (http://bioinformatics.psb.ugent.be/webtools/plantcare/html/, accessed on 13 February 2023) [25] and complied into local datasets. The positions of predicted cis-elements were visualized using the GSDS tool and refined using Adobe Illustrator for final figure preparation.
Transcriptome datasets from cultivated peanut and diploid progenitor were obtained from Peanutbase and locally compiled. Transcript abundance for candidate genes was quantified using the fragments per kilobase million (FPKM) metric, calculated with Featurecounts software (version 2.0.3) [26]. The tissue expression heatmaps were constructed and visualized using TBtools. FPKM values underwent log-transformation and row-normalization for visualization within the squared heatmap. Raw FPKM values were displayed without normalization in the circular heatmap. These heatmaps were combined and rendered in TBtools, then exported as an SVG vector graphic file, which was further refined using Adobe Illustrator for final figure preparation.

3. Results

3.1. Identification of the PHY Gene Family in Peanut

Based on the genome-wide data of cultivated peanut in Peanutbase, two hidden Markov models corresponding to the PHY* (PF00360) and GAF (PF01590) domains were utilized as queries to screen 9 and 18 polypeptide sequences harboring the aforementioned motifs, respectively. Through alignment of the aforementioned preliminary screened protein sequences using the SMART tool, 8 candidate members of the peanut phytochrome family were obtained and denoted as AhPHY. Protein physicochemical properties were analyzed using the ExPASy-ProtParam tool (Table 1). AhPHY encode proteins ranging from 1101 to 1151 amino acids in length, with molecular weights ranging from 122.42 to 128.16 kDa, and theoretical isoelectric points from 5.72 to 6.14, characterizing them as acidic proteins (pI < 7). The aliphatic index ranges from 91.04 to 95.50 and the instability index ranges from 43.27 to 46.13, characterizing them as unstable proteins (II > 40). The grand average hydropathy (GRAVY) index ranges from −0.055 to −0.171, indicating a degree of hydrophilicity. Furthermore, all AhPHY proteins lack an N-terminal signal peptide and transmembrane helices, indicating an intracellular localization. In silico subcellular localization prediction showed that AhPHY exhibits potential for multiple localizations, including the nucleus and cytoplasm.
Phosphorylation sites represent crucial protein functional loci that play an important role in regulating cellular function. According to phosphorylation site prediction by the NetPhos tool, the AhPHY proteins contain serine (Ser), threonine (Thr), and tyrosine (Tyr) residues, ranging from 96 to 104 across proteins. Specifically, Arahy.T2CQE4 encompasses the largest number of Ser residues (64), while Arahy.HS5Z9Z contains the fewest (57). Arahy.HS5Z9Z also exhibits the most Thr residues (37), whereas Arahy.PM8GQZ possesses the fewest (24). Additionally, Arahy.F3Y113 contains the most Tyr residues (11), while both Arahy.7E2TSQ and Arahy.D04KR2 harbor the fewest (8).

3.2. Phylogenetic Analysis and Classification of AhPHY Genes

To further elucidate the phylogeny and functional characteristics of the peanut PHY family, a cluster analysis of phytochrome gene homologs from peanut, Arabidopsis, and soybean was performed using the maximum likelihood method in the MEGA X software (Figure 1). Based on gene structure and sequence homology, the homologs were classified into five subgroups. Only members homologous to the PHYA/B/E clades were identified in the peanut and soybean genomes, with the most recent gene duplication event in this family occurring in the PHYB progenitor. Based on photoinduced activity, they can also be categorized into two types: type I exhibits photoactivation kinetics consistent with photolability and predominantly encompasses PHYA-like homologous sequence, while type II exhibits photostability and its sequence homology to PHYB/C/D/E.

3.3. Conserved Motif, Domain, and Structure Analysis

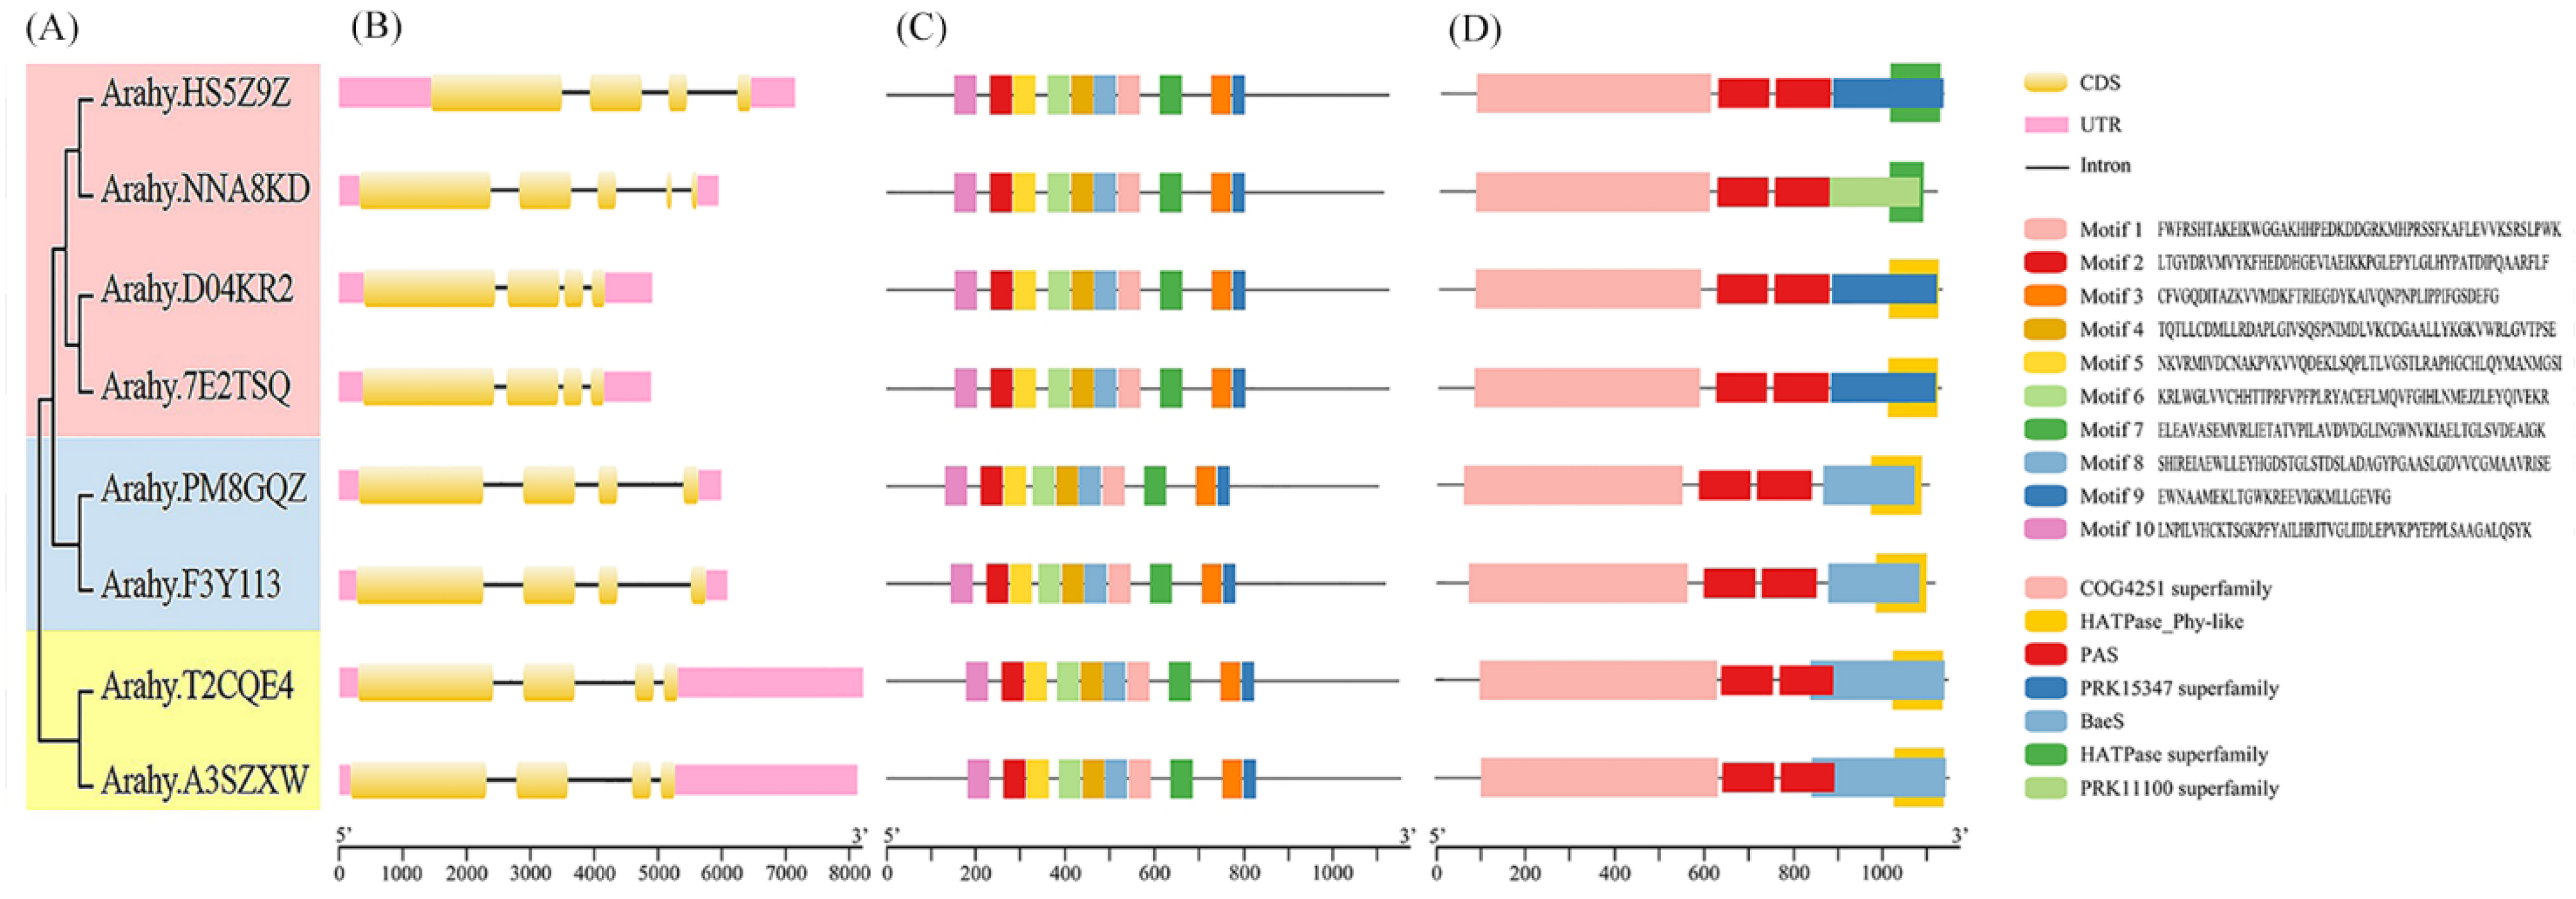
Gene structure analysis revealed that, with the exception of Arahy.NNA8KD, which contained 5 exons and 4 introns, the remaining AhPHY genes contained 4 exons and 3 introns, exhibiting a similar gene structure. Concomitantly, members of each subtype exhibited a degree of genetic homology, with phylogenetic nearness correlating positively with similarities in UTR length and distribution as well as exon number and organization, indicating conservation of gene structure among closely related proteins (Figure 2A,B). For a gene family, shared motifs may be directly associated with gene structure and function. Ten conserved motifs were identified using the MEME tool. Motifs 1-10 were present in all AhPHY in the same order. Motifs 10/2/5 and 6/4/8/1 exhibited the highest degree of conservation, constituting the recognition sites of the GAF and PHY* domains of phytochrome proteins, respectively. Additionally, motifs 7/3/9 constituted the recognition site of the PAS domain (Figure 2C). Domain analysis revealed that all AhPHY proteins harbored the characteristic COG4251 superfamily domain and PAS domain. COG4251 is classified as a model spanning multiple domains and constitutes the region of the histidine kinase responsible for photoinduced signal transduction, whereas the PAS domain exists as two tandem repeats and typically functions as a signal sensor for light and oxygen in signal transduction.
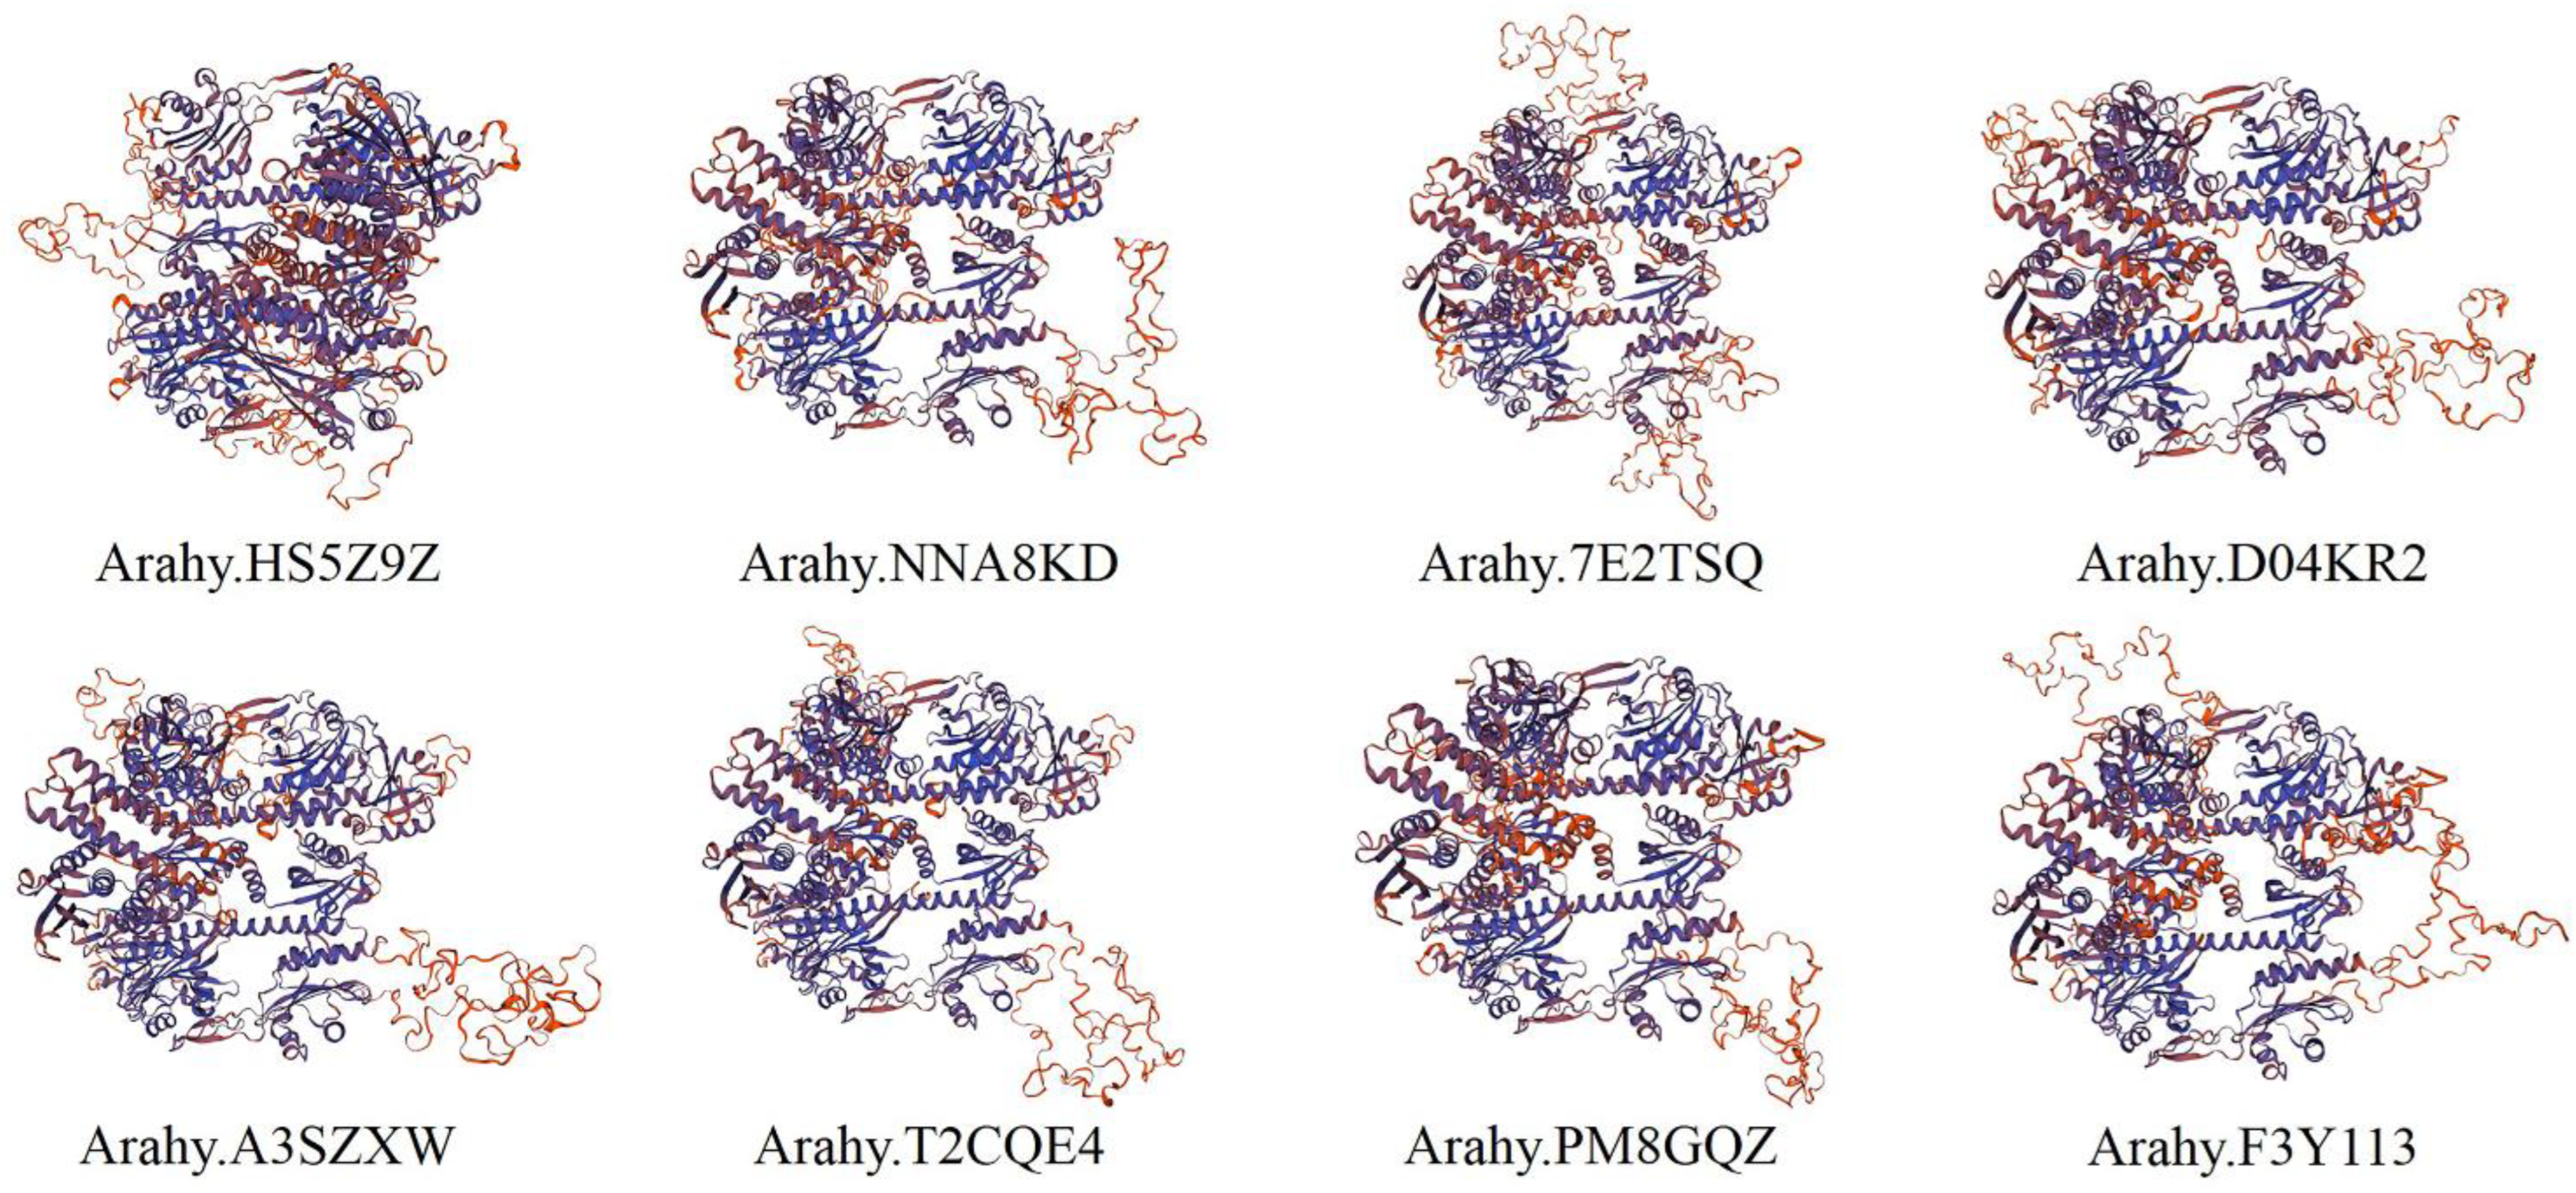
According to secondary structure prediction by the SOPMA tool, the AhPHY proteins were found to encompass α-helix, extended strand, β-turn, and random coil secondary structural elements. The α-helix content was the highest overall, constituting 47.35–49.28%, followed by random coil, constituting 30.34–32.80%, and extended strand, constituting 14.31–14.80%, while the β-turn was the lowest, constituting 4.89–5.81% (Table 2). Prediction using the SWISS-MODEL tool revealed that the tertiary structures of all AhPHY proteins were largely similar, especially between allelic variants (Figure 3), which was consistent with the aforementioned gene structure analysis outcomes.

3.4. Genome Distribution and Syntenic Analysis of AhPHY Genes

The chromosomal localizations of the AhPHY genes were mapped using TBtools. As shown in Figure 4, the peanut genome (AABB) encompasses 20 chromosomes, with 8 candidate genes located on chromosomes Chr03, Chr04, Chr06, Chr09, Chr13, Chr14, Chr16, and Chr19, respectively, demonstrating an overall symmetrical distribution. Intraspecific collinearity analysis revealed seven pairs of genomic synteny between six genes of the peanut PHY gene family. Specifically, Arahy.7E2TSQ on Chr06, Arahy.HS5Z9Z on Chr09, Arahy.D04KR2 on Chr16, and Arahy.NNA8KD on Chr19 were collinear with each other. Arahy.A3SZXW on Chr04 and Arahy.T2CQE on Chr14 were also collinear. Thus, it can be inferred that most AhPHY may have arisen through whole genome duplication events, indicating that segmental duplication played an important role in driving the evolution of the peanut phytochrome gene family.
To further elucidate the phylogenetic mechanisms underlying the peanut PHY gene family, we constructed a genome-wide collinearity map of peanut, Arabidopsis, and soybean, highlighting the PHY gene family members exhibiting collinear relationships across the three species. The results demonstrated that four peanut AhPHY genes and one Arabidopsis AtPHY gene formed four syntenic gene pairs, whereas six peanut AhPHY genes and six soybean GmPHY genes formed twenty syntenic gene pairs (Figure 5), indicating that the PHY family between peanut and soybean shares an exceptionally high degree of homology. These PHY syntenic gene pairs may possess similar potential functions or even originate from a common ancestor.

3.5. Promoter Cis-Element Analysis of AhPHY Genes

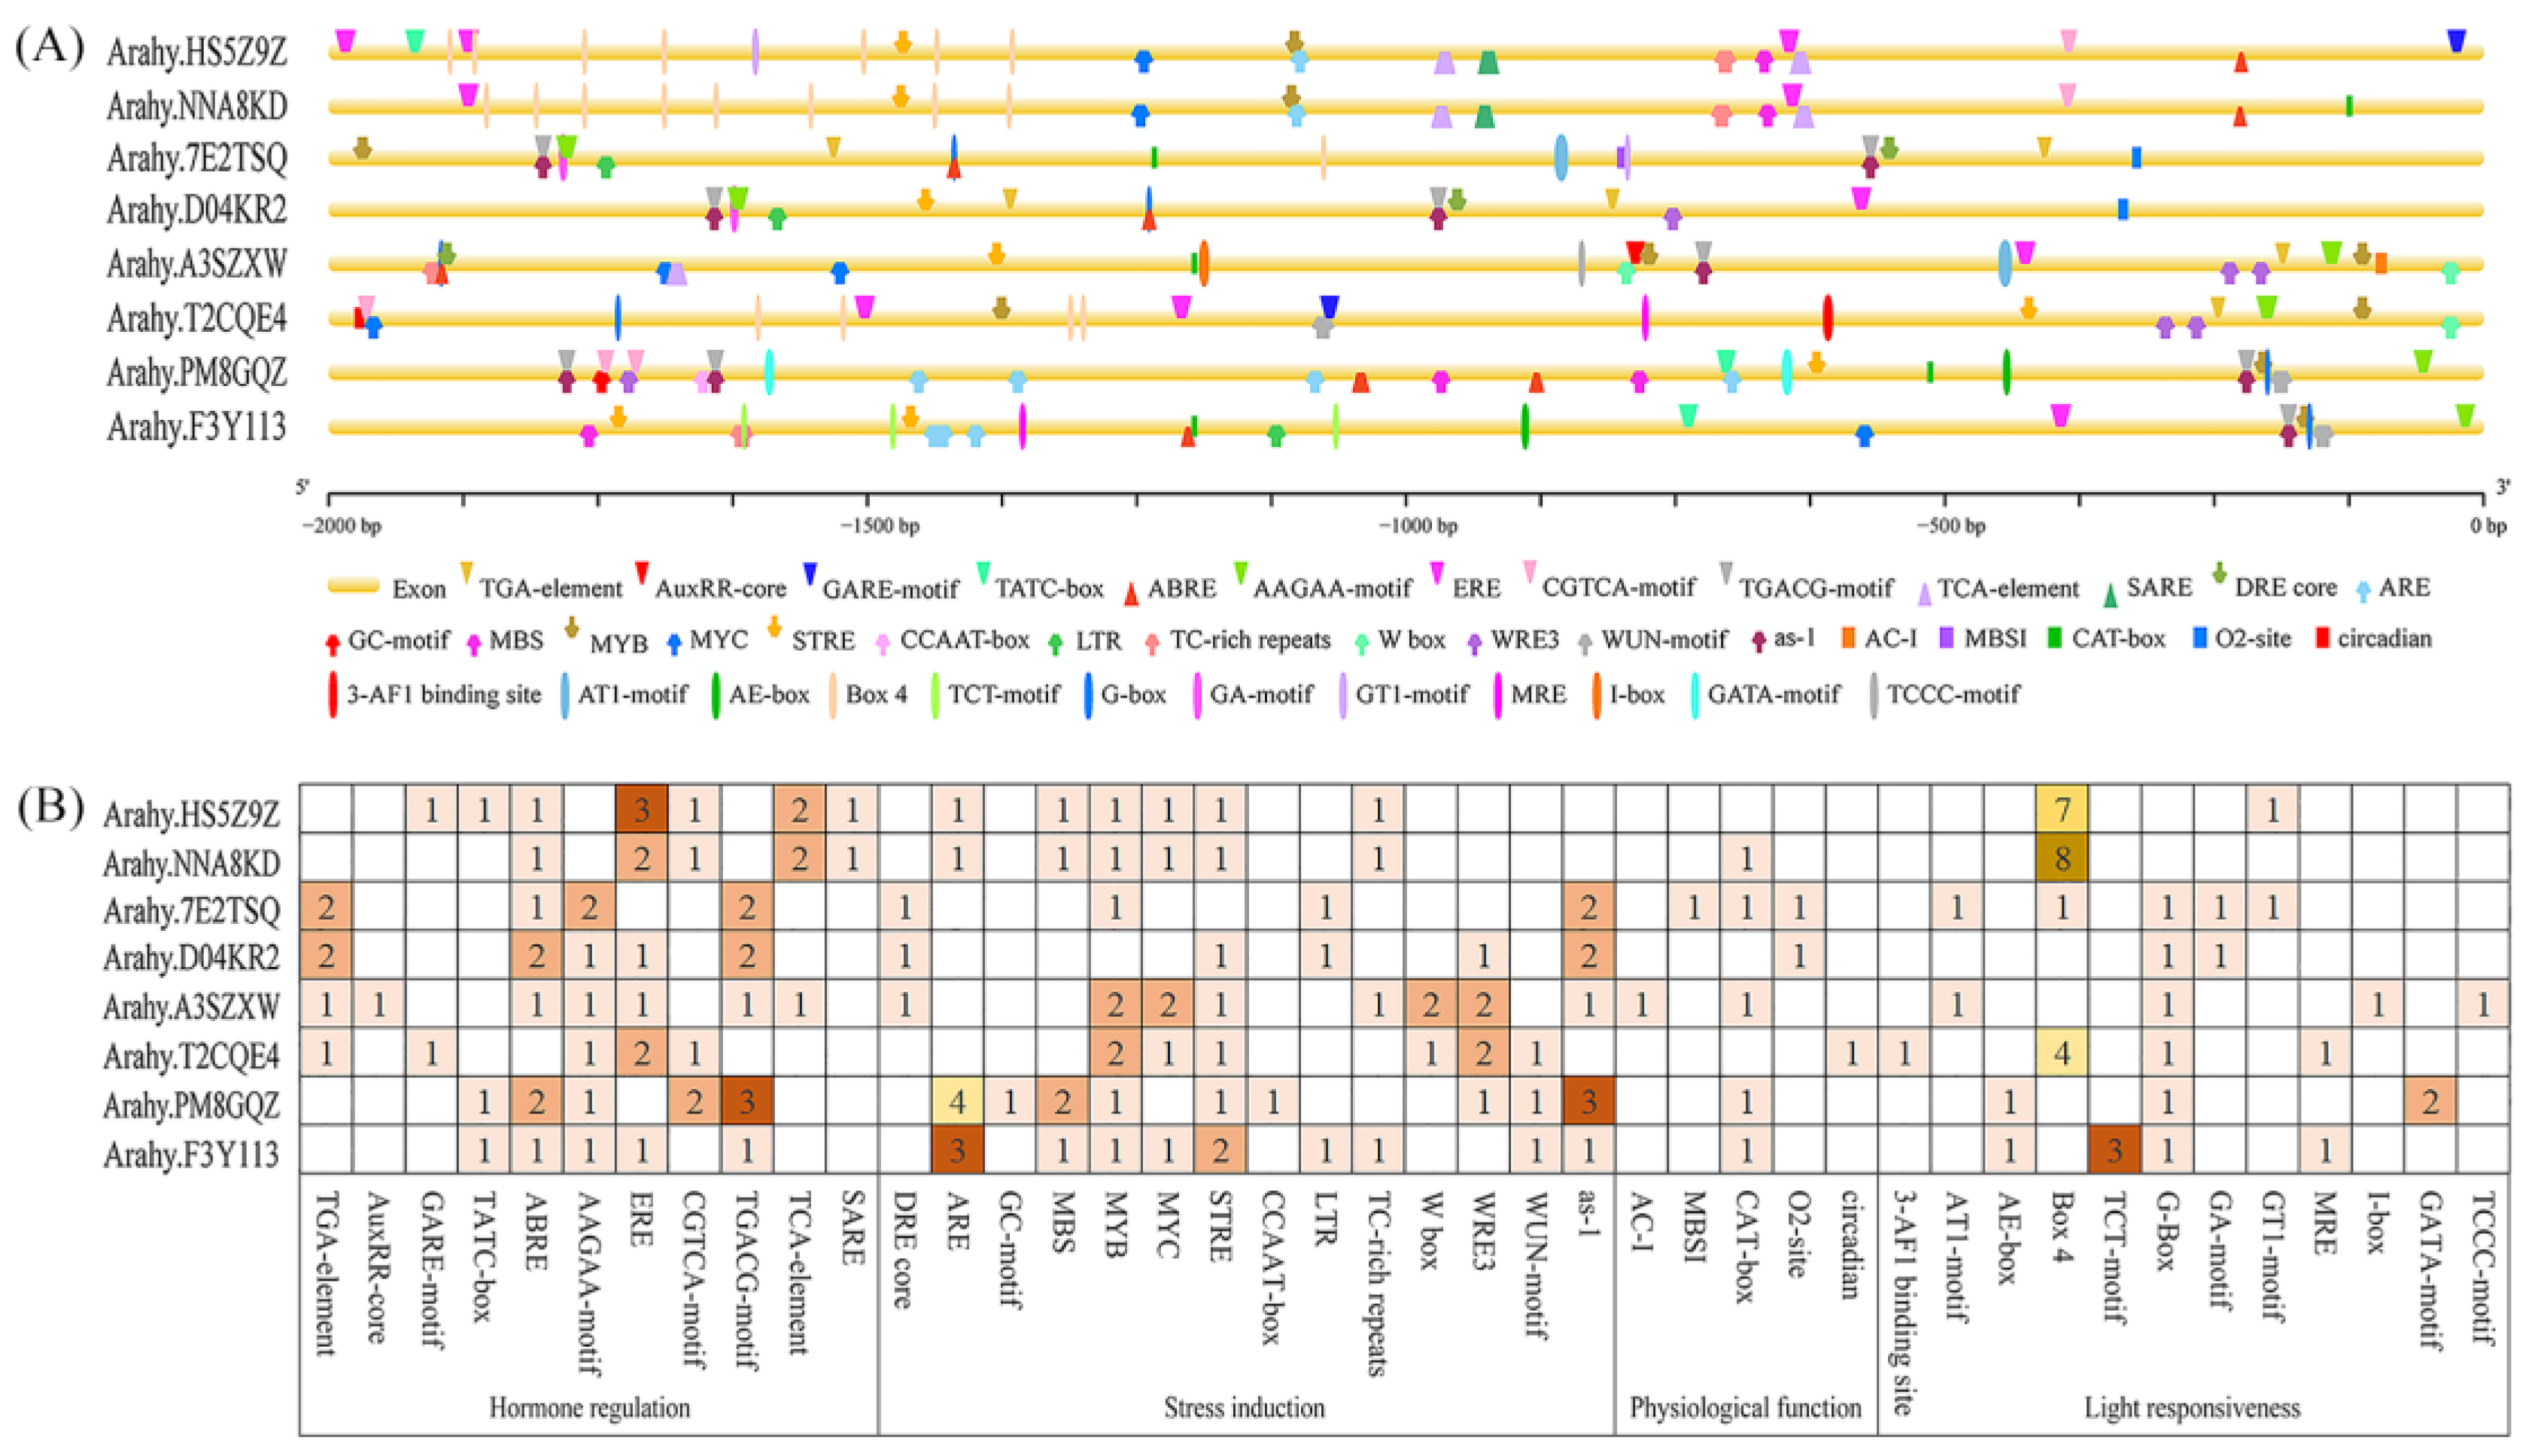
To explore the putative transcriptional regulatory mechanism of the peanut PHY gene family, cis-acting element prediction was performed on the upstream 2000 bp promoter sequences of each member. A plethora of cis-acting elements were enriched in the promoter regions of the peanut PHY gene family, including those responsive to plant hormones (auxin, gibberellin, abscisic acid, ethylene, methyl jasmonate, and salicylic acid), abiotic stresses (anaerobic induction, drought induction, osmotic stress, low temperature response, and defense response, etc.), growth and development (flavonoid biosynthesis, meristem expression, endosperm expression, and circadian rhythm, etc.), as well as various light-responsive elements (Figure 6A).
Statistical analysis revealed that, with the exception of Arahy.HS5Z9Z, which lacked cis-elements associated with physiological function, the remaining AhPHY members harbored all four aforementioned modules of cis-elements. Arahy.A3SZX contained the most types of cis-elements (21 types) and Arahy.NNA8KD contained the fewest (12 types). Regarding phytohormone regulation, AhPHY contained three to five types of hormone response elements, and each member contained abscisic acid response elements (ABRE and AAGAA-motif) and methyl jasmonate response elements (CGTCA-motif and TGACG-motif). Four members contained auxin response elements (TGA-element and AuxRR-core), four members contained gibberellin response elements (GARE-motif and TATC-box), and all members except Arahy.7E2TSQ and Arahy.PM8GQZ contained ethylene response elements (ERE), whereas three members contained salicylic acid response elements (TCA-element and SARE). A total of twelve photoresponsive elements were identified in the AhPHY gene family, with one to five types distributed in each member. Arahy.7E2TSQ contained the most types of photoresponsive elements, whereas Arahy.NNA8KD contained the fewest types but the highest number. Regarding plant growth and development regulation, only Arahy.A3SZXW contained vascular bundle specific expression element (AC-I), Arahy.7E2TSQ contained flavonoid biosynthesis element (MBSI), Arahy.T2CQE4 contained circadian rhythm control element (circadian), five members contained meristem expression regulatory element (CAT-box), and two members contained endosperm expression regulatory element (O2-site) (Figure 6B).

3.6. Expression Pattern Analysis of AhPHY Genes

RNA-Seq read counts from 22 tissues of cultivated peanut were obtained from Peanutbase to analyze the spatiotemporal expression patterns of AhPHY. Members sharing closer phylogenetic relationships displayed similar spatiotemporal expression trends. As shown in Figure 7, the expression levels of Arahy.HS5Z9Z and Arahy.NNA8KD were the highest during early seed development, followed by pod development, and the lowest in leaves. The expression level of Arahy.D04KR2 was the highest in nodules, followed by pistils, and it was also highly expressed during later seed development, whereas Arahy.7E2TSQ was predominantly expressed in leaves, pistils, and mid-developmental seeds. Arahy.PM8GQZ and Arahy.F3Y113 were mainly expressed in leaves and shoots but barely expressed during seed development. Arahy.T2CQE4 and Arahy.A3SZXW were mainly expressed in leaves, shoots, and early-developmental seeds.
Furthermore, the original expression levels in each tissue were compared based on their circular scale values, followed by an analysis of the tissue-specific expression patterns of AhPHY. The results demonstrated that Arahy.HS5Z9Z and Arahy.NNA8KD exhibited the highest expression abundance in gynophores, pods, as well as seeds during early development. Arahy.D04KR2 showed the highest expression levels in nodules, pistils, and seeds during later development. Arahy.T2CQE4 and Arahy.A3SZXW had the highest expression levels in leaves and shoots. These results imply that AhPHY may play a role in the growth and development of different tissues in peanut.
To study the expression profile of the peanut PHY gene family in response to abiotic stress, transcriptome sequencing analysis was performed on peanut gynophores subjected to prolonged darkness for 7 days. The analysis revealed that all AhPHY genes except Arahy.F3Y113 were up-regulated to varying extents under dark treatment, with Arahy.NNA8KD exhibiting the highest basal expression level and showing the greatest up-regulation, representing an almost 73.2% increase in transcript abundance relative to the control (Supplementary Figure S1). Additionally, transcriptome datasets of the diploid progenitor Arachis duranensis responding to drought stress and nematode infection were obtained from Peanutbase [27,28], and the expression patterns of AhPHY genes were analyzed (Supplementary Figure S2). The results demonstrated that under drought treatment the transcripts homologous to Arahy.7E2TSQ were up-regulated while those homologous to Arahy.NNA8KD, Arahy.PM8GQZ, and Arahy.A3SZXW were down-regulated, exhibiting a similar trend as observed in drought-treated seedlings of cultivated peanut (Supplementary Figure S3) [29]. Furthermore, following nematode infection for zero, three, six, and nine days, the abundance of Arahy.7E2TSQ homologous transcripts initially decreased and then increased whereas the other homologous transcripts exhibited the opposite pattern, indicating that the AhPHY genes may play an important role in abiotic and biotic stress responses.

4. Discussion

Phytochromes are implicated in light-induced development throughout plant ontogenesis, including seed germination, seedling photomorphogenesis, shade avoidance response, flowering induction, and senescence of adult plants, etc. [7]. Concomitantly, the evolution of distinct subgroups of photoreceptors within the phytochrome gene family enhanced plant sensitivity to fluctuating light qualities, conferring them with functional diversity [9,30] and promoting interaction with other endogenous signaling transduction pathways (e.g., plant hormones) [31,32,33,34,35,36].
Peanut is a widely cultivated oilseed and economic crop globally, with its yield and quality formation governed by both environmental and genetic factors. In this study, eight AhPHY members encoding 1101 to 1151 amino acids were identified in the genome-wide analysis of cultivated peanut, all of which belong to acidic hydrophilic proteins. Analysis of phytochrome subcellular localization in transgenic Arabidopsis seedlings expressing five genotypes of PHY:GFP fusion proteins revealed that under dark conditions, fluorescence was localized to the cytoplasm. Following light exposure, the fusion proteins translocated to the nucleus and aggregated into characteristic spots, exhibiting typical circadian rhythm regulation [37,38,39,40]. Subcellular localization prediction revealed that the AhPHY gene family members localize predominantly to the nucleus and cytoplasm, consistent with the nuclear-cytoplasmic distribution characteristics of phytochromes reported previously.
Phylogenetic analysis demonstrated that based on photosensitivity and light-induced characteristics, the peanut PHY gene family encompasses two physical types: photolabile type I and photostable type II [41]. Concomitantly, according to gene structure and sequence similarity, AhPHY can be further subdivided into three subgroups homologous to PHYA/B/E progenitors, containing four, two, and two homologous copies, respectively. This classification result is highly analogous to that of soybean [15]. Genetic variability depends on gene structure and conserved domains [42]. In this study, the gene structure of the AhPHY gene family was relatively conserved during evolution, with an identical number and distribution of conserved motifs. All members contain the typical COG4251 superfamily domain and PAS domain of phytochrome proteins, indicating a high degree of conservation in both evolution and function.
Protein phosphorylation constitutes an extensive and crucial post-translational modification process, closely associated with various biological processes, such as cellular signal transduction, DNA damage repair, transcriptional regulation, apoptosis regulation, etc. [43,44]. Predicting phosphorylation sites aids in elucidating protein phosphorylation modification mechanisms of target proteins. In this study, the number of phosphorylation sites of AhPHY members with close phylogenetic relationships was similar, as was the distribution of serine, threonine, and tyrosine residues. The PHYA and PHYB branches contained more phosphorylation sites, indicating that the member genes of these two branches may be more sensitive to changes in the external light environment and respond more rapidly.
Compared with the five classical clades of the Arabidopsis PHY gene family phylogenetic tree, the eight AhPHY genes identified here were distributed across only three ancestral clades. Chromosomal localization revealed a symmetrical distribution, indicating that each clade may have divergent or redundant gene copies. These findings imply that gene duplication contributed a pivotal role in the expansion and evolution of the allotetraploid peanut AhPHY gene family. Collinearity analysis revealed seven pairs of genomic synteny between six AhPHY genes within species of peanut. Furthermore, four AhPHY genes in peanut and one AtPHY gene in Arabidopsis formed four syntenic gene pairs, whereas six AhPHY genes in peanut and six GmPHY genes in soybean formed twenty syntenic gene pairs. The high degree of synteny between peanut and soybean PHY genes indicates a conservation of function that may reflect their closer evolutionary relationship as legumes. By contrast, the limited synteny between peanut and Arabidopsis PHY genes points to greater functional diversification since their last common ancestor. In summary, integrating phylogenetic and collinearity analyses may enable prediction of the putative biological functions of the peanut PHY gene family by comparing them with homologous PHY genes in model plants and related species.
A total of 42 cis-regulatory elements responsive to phytohormones, abiotic stresses, growth and development, as well as photoresponse, were identified within the putative promoter regions of genes encoding the peanut PHYTOCHROME photoreceptor protein family. The differences in the identity and combination of cis-elements between these photoreceptors reflect the diversity of their spatio-temporal expression patterns and putative participation in complex signaling networks. In our study, the AhPHY gene family was found to contain elements responsive to light, drought, and defense stress, wherein the majority of these members exhibited significant changes in expression levels following exposure of complete photodeprivation, osmotic stress, and nematode infection. These findings suggest that AhPHY genes may fulfill important functions related to plant photomorphogenesis [6,45] and tolerance to abiotic and biotic stresses [46,47,48]. Meanwhile, the independent presence of specific cis-elements inside the promoters of distinct PHY family members indicates their significant non-redundant functions. For example, the circadian regulatory element present within the promoter of the Arahy.T2CQE4 gene, localized between −1977 bp and −1986 bp upstream of the transcription start site, implies a unique regulatory role for this gene in the plant’s circadian rhythm responses. The presence of this cis-element provides scientific evidence in support of the hypothesized function of the Arahy.T2CQE4 gene.
The spatiotemporal expression patterns of AhPHY gene family members were rather interesting. Members exhibiting close phylogenetic relationships demonstrated similar spatiotemporal expression patterns, whereas members of distinct clades exhibited certain tissue specificity. Accordingly, the putative relationship between gene expression and plant ontogeny can be inferred from spatiotemporal expression trends and expression abundance. Members exhibiting constitutive expression may play a role in the maintenance of basic cell and organ functions, while those with high expression during reproductive development are likely involved in light or photoperiod regulation of pod and seed formation. For instance, Arahy.HS5Z9Z and Arahy.NNA8KD may be related to the morphogenetic processes occurring early during the development of pods and seeds, and the organogenesis of floral organs. Whereas Arahy.T2CQE4 and Arahy.A3SZXW may be associated with the seed embryogenesis, as well as photomorphogenesis of leaves within each growth period. Arahy.D04KR2 may participate in processes of root nodulation and pistil differentiation. Furthermore, the transcripts level of Arahy.PM8GQZ and Arahy.F3Y113 displayed limited variation across various tissues in comparison to other phytochrome family members. Their expression profiles were largely constitutive at a relatively low baseline level. This pattern implies that these genes may encode constitutively expressed proteins or exhibit redundancy function during plant ontogenesis [49].

5. Conclusions

In this study, eight members of the peanut phytochrome gene family were identified and characterized using bioinformatic approaches. Comprehensive analyses of their physicochemical properties, phylogenetic relationships, sequence structures, chromosomal distributions, collinearities, promoter cis-elements, and expression patterns provide a scientific framework for further elucidating the biological functions of AhPHY in peanut growth, development, and environmental adaptation.

Supplementary Materials

The following are available online at https://www.mdpi.com/article/10.3390/genes14071478/s1, Figure S1: Expression profiling of PHY genes in cultivated peanut under dark treatment; Figure S2: Expression profiling of PHY genes in wild peanut under abiotic stress; Figure S3: Expression profiling of PHY genes in cultivated peanut under drought treatment.

Author Contributions

Y.S. (Yue Shen) and Y.S. (Yi Shen) conceived and implemented of this study, and completed manuscript writing; Y.L., X.Z. and M.L. performed data analysis; Z.C. revised the manuscript. All authors have read and agreed to the published version of the manuscript.

Funding

This work was supported by grants from the Jiangsu Open Competition Project (Grant No. JBGS(2021)062 to Yi Shen), the Jiangsu Agricultural Science and Technology Innovation Fund (Grant No. CX(20)3121 to Yue Shen), and the earmarked fund for CARS-13.

Institutional Review Board Statement

Not applicable.

Informed Consent Statement

Not applicable.

Data Availability Statement

Data are contained within the article.

Conflicts of Interest

The authors declare no conflict of interest.

References

  1. Schäfer, E.; Nagy, F. (Eds.) Photomorphogenesis in Plants and Bacteria: Fumction and Signal Transduction Mechanisms, 3rd ed.; Springer: Dordrecht, The Netherlands, 2006; pp. 41–247. [Google Scholar]
  2. Arana, M.V.; Sánchez-Lamas, M.; Strasser, B.; Ibarra, S.E.; Cerdán, P.D.; Botto, J.F.; Sánchez, R.A. Functional diversity of phytochrome family in the control of light and gibberellin-mediated germination in Arabidopsis. Plant Cell Environ. 2014, 37, 2014–2023. [Google Scholar] [CrossRef] [PubMed]
  3. Bae, G.Y.; Choi, G. Decoding of light signals by plant phytochromes and their interacting proteins. Annu. Rev. Plant Biol. 2008, 59, 281–311. [Google Scholar] [CrossRef] [PubMed] [Green Version]
  4. Rockwell, N.C.; Su, Y.S.; Lagarias, J.C. Phytochrome structure and signaling mechanisms. Annu. Rev. Plant Biol. 2006, 57, 837–858. [Google Scholar] [CrossRef] [Green Version]
  5. Lamparter, T.; Carrascal, M.; Michael, N.; Martinez, E.; Rottwinkel, G.; Abian, J. The biliverdin chromophore binds covalently to a conserved cysteine residue in the N-terminus of Agrobacterium phytochrome Agp1. Biochemistry 2004, 43, 3659–3669. [Google Scholar] [CrossRef] [PubMed]
  6. Casal, J.J.; Luccioni, L.G.; Oliverio, K.A.; Boccalandro, H.E. Light, phytochrome signalling and photomorphogenesis in Arabidopsis. Photochem. Photobiol. Sci. 2003, 2, 625–636. [Google Scholar] [CrossRef] [PubMed]
  7. Kircher, S.; Bauer, D.; Schäfer, E.; Nagy, F. Intramolecular uncoupling of chromophore photoconversion from structural signaling determinants drive mutant phytochrome B photoreceptor to far-red light perception. Plant Signal. Behav. 2012, 7, 904–906. [Google Scholar] [CrossRef] [Green Version]
  8. Casal, J.J.; Candia, A.N.; Sellaro, R. Light perception and signalling by phytochrome A. J. Exp. Bot. 2014, 65, 2835–2845. [Google Scholar] [CrossRef] [Green Version]
  9. Franklin, K.A.; Quail, P.H. Phytochrome functions in Arabidopsis development. J. Exp. Bot. 2010, 61, 11–24. [Google Scholar] [CrossRef] [Green Version]
  10. Piao, W.; Kim, E.Y.; Han, S.H.; Sakuraba, Y.; Paek, N.C. Rice phytochrome B (OsPhyB) negatively regulates dark- and starvation-induced leaf senescence. Plants 2015, 4, 644–663. [Google Scholar] [CrossRef] [Green Version]
  11. Wang, H.; Jia, G.; Zhang, N.; Zhi, H.; Xing, L.; Zhang, H.; Sui, Y.; Tang, S.; Li, M.; Zhang, H.; et al. Domestication-associated PHYTOCHROME C is a flowering time repressor and a key factor determining Setaria as a short-day plant. New Phytol. 2022, 236, 1809–1823. [Google Scholar] [CrossRef]
  12. Germán, W.; Ida, M.A.; José, C.J.; Ángel, M.G. Phytochrome B enhances plant growth, biomass and grain yield in field-grown maize. Ann. Bot. 2019, 123, 1079–1088. [Google Scholar]
  13. Li, Q.; Wu, G.; Zhao, Y.; Wang, B.; Zhao, B.; Kong, D.; Wei, H.; Chen, C.; Wang, H. CRISPR/Cas9-mediated knockout and overexpression studies reveal a role of maize phytochrome C in regulating flowering time and plant height. Plant Biotechnol. J. 2020, 18, 2520–2532. [Google Scholar] [CrossRef] [PubMed]
  14. Hwang, W.J.; Ha, J.; Lee, T.; Jeong, H.; Kim, M.Y.; Kim, S.K.; Lee, Y.H.; Jung, J.W.; Lee, S.H. A candidate flowering gene in mungbean is homologous to a soybean Phytochrome A gene. Euphytica 2017, 213, 79. [Google Scholar] [CrossRef]
  15. Wu, F.Q.; Fan, C.M.; Zhang, X.M.; Fu, Y.F. The phytochrome gene family in soybean and a dominant negative effect of a soybean PHYA transgene on endogenous Arabidopsis PHYA. Plant Cell Rep. 2013, 32, 1879–1890. [Google Scholar] [CrossRef] [PubMed]
  16. Lin, X.; Dong, L.; Tang, Y.; Li, H.; Cheng, Q.; Li, H.; Zhang, T.; Ma, L.; Xiang, H.; Chen, L.; et al. Novel and multifaceted regulations of photoperiodic flowering by phytochrome A in soybean. Proc. Natl. Acad. Sci. USA 2022, 119, e2208708119. [Google Scholar] [CrossRef]
  17. Zhou, T.; Song, B.; Liu, T.; Shen, Y.; Dong, L.; Jing, S.; Xie, C.; Liu, J. Phytochrome F plays critical roles in potato photoperiodic tuberization. Plant J. 2019, 98, 42–54. [Google Scholar] [CrossRef]
  18. Carlson, K.D.; Bhogale, S.; Anderson, D.; Zaragoza-Mendoza, A.; Madlung, A. Subfunctionalization of phytochrome B1/B2 leads to differential auxin and photosynthetic responses. Plant Direct 2020, 4, e00205. [Google Scholar] [CrossRef] [Green Version]
  19. Shahzad, R.; Ahmed, F.; Wang, Z.; Harlina, P.W.; Nishawy, E.; Ayaad, M.; Manan, A.; Maher, M.; Ewas, M. Comparative analysis of two phytochrome mutants of tomato (Micro-Tom cv.) reveals specific physiological, biochemical, and molecular responses under chilling stress. J. Genet. Eng. Biotechnol. 2020, 18, 77. [Google Scholar] [CrossRef]
  20. Larkin, M.A.; Blackshields, G.; Brown, N.P.; Chenna, R.; McGettigan, P.A.; McWilliam, H.; Valentin, F.; Wallace, I.M.; Wilm, A.; Lopez, R.; et al. Clustal W and Clustal X version 2.0. Bioinformatics 2007, 23, 2947–2948. [Google Scholar] [CrossRef] [Green Version]
  21. Kumar, S.; Stecher, G.; Li, M.; Knyaz, C.; Tamura, K. MEGA X: Molecular evolutionary genetics analysis across computing platforms. Mol. Biol. Evol. 2018, 35, 1547–1549. [Google Scholar] [CrossRef]
  22. Bailey, T.L.; Boden, M.; Buske, F.A.; Frith, M.; Grant, C.E.; Clementi, L.; Ren, J.; Li, W.W.; Noble, W.S. MEME SUITE: Tools for motif discovery and searching. Nucleic Acids Res. 2009, 37, W202–W208. [Google Scholar] [CrossRef] [PubMed]
  23. Chen, C.J.; Chen, H.; Zhang, Y.; Thomas, H.R.; Frank, M.H.; He, Y.H.; Xia, R. TBtools: An Integrative toolkit developed for interactive analyses of big biological data. Mol. Plant 2020, 13, 1194–1202. [Google Scholar] [CrossRef] [PubMed]
  24. Hu, B.; Jin, J.; Guo, A.-Y.; Zhang, H.; Luo, J.; Gao, G. GSDS 2.0: An upgraded gene feature visualization server. Bioinformatics 2015, 31, 1296–1297. [Google Scholar] [CrossRef] [PubMed] [Green Version]
  25. Lescot, M.; Déhais, P.; Thijs, G.; Marchal, K.; Moreau, Y.; Van de Peer, Y.; Rouzé, P.; Rombauts, S. PlantCARE, a database of plant cis-acting regulatory elements and a portal to tools for in silico analysis of promoter sequences. Nucleic Acids Res. 2002, 30, 325–327. [Google Scholar] [CrossRef] [PubMed]
  26. Mortazavi, A.; Williams, B.A.; McCue, K.; Schaeffer, L.; Wold, B. Mapping and quantifying mammalian transcriptomes by RNA-Seq. Nat. Methods 2008, 5, 621–628. [Google Scholar] [CrossRef]
  27. Brasileiro, A.C.M.; Morgante, C.V.; Araujo, A.C.G.; Leal-Bertioli, S.C.M.; Silva, A.K.; Martins, A.C.Q.; Vinson, C.C.; Santos, C.M.R.; Bonfim, O.; Togawa, R.C.; et al. Transcriptome profiling of wild Arachis from water-limited environments uncovers drought tolerance candidate genes. Plant Mol. Biol. Rep. 2015, 33, 1876–1892. [Google Scholar] [CrossRef]
  28. Guimaraes, P.M.; Guimaraes, L.A.; Morgante, C.V.; Silva, O.B.; Araujo, A.C.G.; Martins, A.C.Q.; Saraiva, M.A.P.; Oliveira, T.N.; Togawa, R.C.; Leal-Bertioli, S.C.M.; et al. Root transcriptome analysis of wild peanut reveals candidate genes for nematode resistance. PLoS ONE 2015, 10, e0140937. [Google Scholar] [CrossRef]
  29. Shen, Y.; Zhiguo, E.; Liu, Y.; Chen, Z. Screening and transcriptome analysis of water deficiency tolerant germplasms in peanut (Arachis hypogaea). Acta Physiol. Plant. 2015, 37, 103. [Google Scholar] [CrossRef]
  30. Whitelam, G.C.; Devlin, P.F. Roles of different phytochromes in Arabidopsis photomorphogenesis. Plant Cell Environ. 1997, 20, 752–758. [Google Scholar] [CrossRef]
  31. Olsen, J.E. Mechanisms of dormancy regulation. Acta Hortic. 2006, 727, 157–166. [Google Scholar] [CrossRef]
  32. Vitaly, S.; Larissa, K.; Michael, R.; Peter, N. Phytochrome A and its functional manifestations in etiolated and far-red light-grown seedlings of the wild-type rice and its hebiba and cpm2 mutants deficient in the defense-related phytohormone jasmonic acid. Photochem. Photobiol. 2020, 97, 335–342. [Google Scholar]
  33. Ruberti, I.; Sessa, G.; Ciolfi, A.; Possenti, M.; Carabelli, M.; Morelli, G. Plant adaptation to dynamically changing environment: The shade avoidance response. Biotechnol. Adv. 2012, 30, 1047–1058. [Google Scholar] [CrossRef] [PubMed]
  34. Zhang, C.; Zhang, F.; Zhou, J.; Fan, Z.; Chen, F.; Ma, H.; Xie, X. Overexpression of a phytochrome-regulated tandem zinc finger protein gene, OsTZF1, confers hypersensitivity to ABA and hyposensitivity to red light and far-red light in rice seedlings. Plant Cell Rep. 2012, 31, 1333–1343. [Google Scholar] [CrossRef]
  35. Carvalho, R.F.; Quecini, V.; Peres, L.E.P. Hormonal modulation of photomorphogenesis-controlled anthocyanin accumulation in tomato (Solanum lycopersicum L. cv Micro-Tom) hypocotyls: Physiological and genetic studies. Plant Sci. 2010, 178, 258–264. [Google Scholar] [CrossRef]
  36. Mitsunori, S.; Eiji, N.; Giltsu, C.; Shinjiro, Y. Interaction of light and hormone signals in germinating seeds. Plant Mol. Biol. 2009, 69, 463–472. [Google Scholar]
  37. Kircher, S.; Kozma-Bognár, L.; Kim, L.; Adám, E.; Harter, K.; Schäfer, E.; Nagy, F. Light quality-dependent nuclear import of the plant photoreceptors phytochrome A and B. Plant Cell 1999, 11, 1445–1456. [Google Scholar]
  38. Yamaguchi, R.; Nakamura, M.; Mochizuki, N.; Kay, S.A.; Nagatani, A. Light-dependent translocation of a phytochrome B-GFP fusion protein to the nucleus in transgenic Arabidopsis. J. Cell Biol. 1999, 145, 437–445. [Google Scholar] [CrossRef]
  39. Kim, L.; Kircher, S.; Toth, R.; Adam, E.; Schäfer, E.; Nagy, F. Light-induced nuclear import of phytochrome-A, GFP fusion proteins is differentially regulated in transgenic tobacco and Arabidopsis. Plant J. 2000, 22, 125–133. [Google Scholar] [CrossRef] [Green Version]
  40. Kircher, S.; Gil, P.; Kozma-Bognár, L.; Fejes, E.; Speth, V.; Husselstein-Muller, T.; Bauer, D.; Adám, E.; Schäfer, E.; Nagy, F. Nucleocytoplasmic partitioning of the plant photoreceptors phytochrome A, B, C, D, and E is regulated differentially by light and exhibits a diurnal rhythm. Plant Cell 2002, 14, 1541–1555. [Google Scholar] [CrossRef] [Green Version]
  41. Furuya, M.; Schäfer, E. Photoperception and signalling of induction reactions by different phytochromes. Trends Plant Sci. 1996, 1, 301–307. [Google Scholar] [CrossRef]
  42. Cheng, Y.; Ahammed, G.J.; Yao, Z.; Ye, Q.; Ruan, M.; Wang, R.; Li, Z.; Zhou, G.; Wan, H. Comparative Genomic Analysis Reveals Extensive Genetic Variations of WRKYs in Solanaceae and Functional Variations of CaWRKYs in Pepper. Front. Genet. 2019, 10, 492. [Google Scholar] [CrossRef] [Green Version]
  43. Bigeard, J.; Rayapuram, N.; Pflieger, D.; Hirt, H. Phosphorylation-dependent regulation of plant chromatin and chromatin-associated proteins. Proteomics 2014, 14, 2127–2140. [Google Scholar] [CrossRef] [PubMed]
  44. Adijat, A.A.; Amara, C.; Shakeel, A.; Wang, Y.; Shu, Y.; Li, S.; Liu, X.; Kazeem, B.B.; Muhammad, T.S.; Tong, X.H.; et al. Protein phosphorylation and phosphoproteome: An overview of rice. Rice Sci. 2020, 27, 184–200. [Google Scholar]
  45. Balcerowicz, M.; Mahjoub, M.; Nguyen, D.; Lan, H.; Stoeckle, D.; Conde, S.; Jaeger, K.E.; Wigge, P.A.; Ezer, D. An early-morning gene network controlled by phytochromes and cryptochromes regulates photomorphogenesis pathways in Arabidopsis. Mol. Plant 2021, 14, 983–996. [Google Scholar] [CrossRef] [PubMed]
  46. Falleiros, R.C.; Lattarulo, M.C.; Antunes, R.A. The role of phytochrome in stress tolerance. J. Integr. Plant Biol. 2011, 53, 920–929. [Google Scholar]
  47. Abdellatif, I.M.Y.; Yuan, S.; Yoshihara, S.; Suzaki, T.; Ezura, H.; Miura, K. Stimulation of tomato drought tolerance by PHYTOCHROME A and B1B2 mutations. Int. J. Mol. Sci. 2023, 24, 1560. [Google Scholar] [CrossRef]
  48. Fichman, Y.; Xiong, H.; Sengupta, S.; Morrow, J.; Loog, H.; Azad, R.K.; Hibberd, J.M.; Liscum, E.; Mittler, R. Phytochrome B regulates reactive oxygen signaling during abiotic and biotic stress in plants. New Phytol. 2022, 237, 1711–1727. [Google Scholar] [CrossRef]
  49. Halliday, K.J.; Salter, M.G.; Thingnaes, E.; Whitelam, G.C. Phytochrome control of flowering is temperature sensitive and correlates with expression of the floral integrator FT. Plant J. 2003, 33, 875–885. [Google Scholar] [CrossRef]
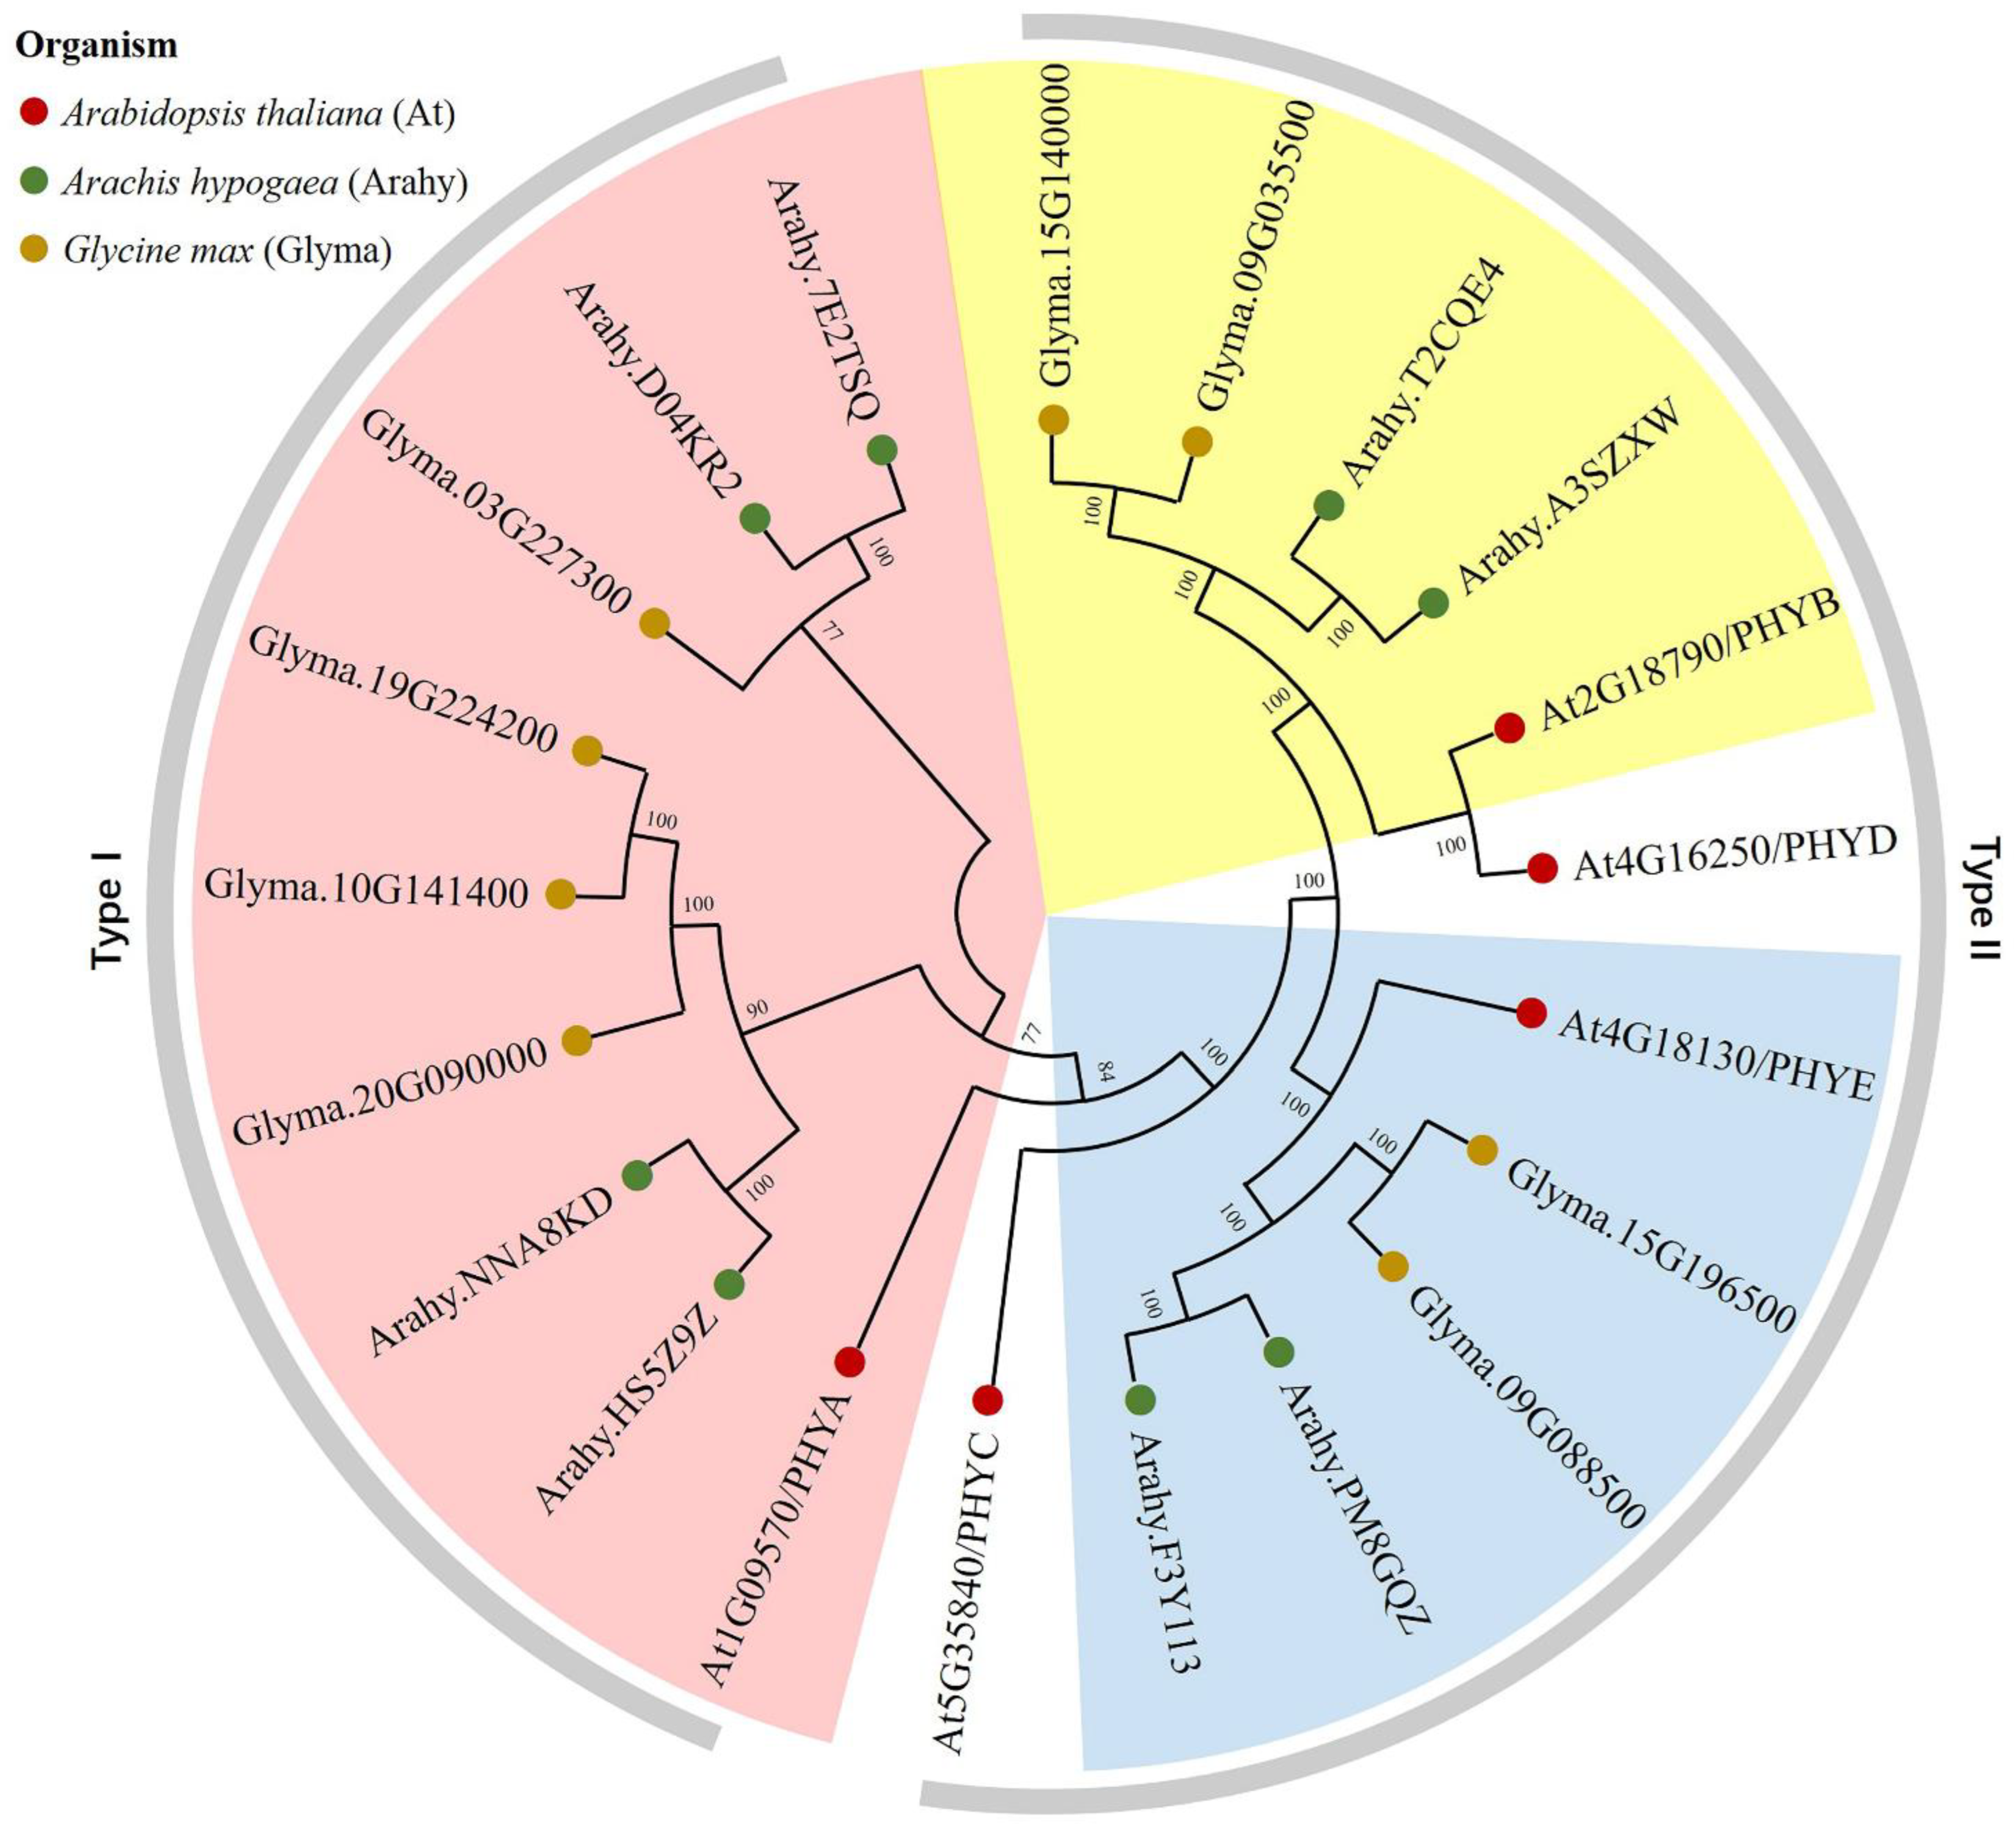
Figure 1. Phylogenetic analysis of PHY genes in peanut, soybean, and Arabidopsis. The PHY genes are denoted by green, khaki, and red dots for peanut, soybean, and Arabidopsis, respectively. The subgroups are delineated by colored fan-shaped partitions homologous to 5 PHYs (PHYA-PHYE) in Arabidopsis. In the outer ring (grey), the classification is established upon photoinduced activity, including photolabile type I and photostable type II variants.
Genes 14 01478 g001
Figure 2. Phylogenetic tree, gene structure, conserved motifs, and domains of PHY genes in peanut. (A) A maximum likelihood phylogenetic tree of AhPHY genes was constructed using the MEGA X tool; (B) The exon-intron architecture of AhPHY genes was performed using the GSDS tool; (C) Motif composition of AhPHY proteins was visualized by TBtools, with different colored boxes representing motifs containing specific amino acid sequences; (D) Domain architecture of AhPHY proteins visualized by TBtools, with different colored boxes representing conserved domains.
Genes 14 01478 g002
Figure 3. Tertiary structure model of AhPHY proteins.
Genes 14 01478 g003
Figure 4. Chromosomal localization and intraspecific synteny of AhPHY genes. The blue areas indicate chromosomes, with the scale bar representing megabases (Mb). The gray areas indicate collinear regions, and the red lines indicate syntenic relationships between phytochrome genes of peanut.
Genes 14 01478 g004
Figure 5. Interspecific synteny of PHY genes across different species. The red, blue, and yellow round rectangles indicate chromosomes of Arabidopsis, peanut, and soybean, respectively. The gray areas indicate collinear regions, and the red lines indicate syntenic relationships between phytochrome genes across different species.
Genes 14 01478 g005
Figure 6. Prediction of cis-regulatory elements in the promoter regions of AhPHY genes. (A) Distribution diagram of cis-elements for AhPHY gene promoters, with diverse colored geometric figures representing distinct cis-elements; (B) The putative cis-elements were quantified and functionally classified based on their established roles in gene transcriptional regulation.
Genes 14 01478 g006
Figure 7. Expression profiling of AhPHY genes across various peanut tissues exhibited distinct spatiotemporal patterns. The square color scale of the heatmap indicates FPKM values following row normalization, with maximal and minimal expression denoted by red and blue, respectively. The circular color scale indicates raw FPKM values, where the surface area subtended by each circle was directly proportional to the expression level. Leaf 1 = lateral stem leaf; Leaf 2 = main stem leaf; Leaf 3 = seedling leaf; Veg shoot = vegetative shoot tip; Repr shoot = reproductive shoot tip; Root = root; Nodule = nodule; Perianth = perianth; Stamen = stamen; Pistil = pistils; Peg tip 1 = peg tip aerial; Peg tip 2 = peg tip below soil; Peg tip Pt 1 = peg tip to fruit Pattee 1; Fruit Pt 1/3 = fruit Pattee 1/3; Pearp Pt 5/6 = pericarp Pattee 5/6; Seed Pt 5/6/7/8/10 = seed Pattee 5/6/7/8/10.
Genes 14 01478 g007
Table 1. Physicochemical properties and subcellular localization of AhPHY genes.
Gene IDAmino Acid (aa)Molecular Weight (Da)Isoelectric Point (pI)Instability Index (II)Aliphatic IndexGRAVYSubcellular LocalizationPhosphorylation Site
Ser/Thr/TyrTotal
Arahy.HS5Z9Z1125124,470.30 6.01 43.54 93.95 −0.081Cyt, N57/37/10104
Arahy.NNA8KD1113123,208.83 5.80 45.13 95.22 −0.056Cyt, N58/36/9103
Arahy.7E2TSQ1125124,620.66 6.05 43.27 95.07 −0.055Cyt, N60/36/8104
Arahy.D04KR21125124,612.76 6.14 43.40 95.50 −0.055Cyt, N61/35/8104
Arahy.A3SZXW1151128,157.41 5.76 44.12 91.82 −0.171Cyt, N63/30/9102
Arahy.T2CQE41147127,672.95 5.80 43.90 91.72 −0.168Cyt, N64/28/9101
Arahy.PM8GQZ1101122,424.19 5.80 45.79 91.04 −0.132Cyt, N62/24/1096
Arahy.F3Y1131116123,960.97 5.72 46.13 91.32 −0.122Cyt, N61/26/1198
Note: Cyt = cytoplasm; N = nucleus; Ser = serine; Thr = threonine; Tyr = tyrosine.
Table 2. Secondary structure analysis of AhPHY proteins.
Gene IDα-Helix (%)Extended Strand (%)β-Turn (%)Random Coil (%)
Arahy.HS5Z9Z48.0014.315.4232.27
Arahy.NNA8KD48.6114.565.3031.54
Arahy.7E2TSQ47.5614.764.8932.80
Arahy.D04KR248.3614.765.6931.20
Arahy.A3SZXW47.3514.685.3032.67
Arahy.T2CQE447.6914.735.5832.00
Arahy.PM8GQZ49.0514.805.8130.34
Arahy.F3Y11349.2814.705.2930.73
Disclaimer/Publisher’s Note: The statements, opinions and data contained in all publications are solely those of the individual author(s) and contributor(s) and not of MDPI and/or the editor(s). MDPI and/or the editor(s) disclaim responsibility for any injury to people or property resulting from any ideas, methods, instructions or products referred to in the content.