Article

Characterization and Potential Function Analysis of the SRS Gene Family in Brassica napus

1
College of Life Science and Technology, Huazhong Agricultural University, Wuhan 430070, China
2
Key Laboratory of Biology and Genetics Improvement of Oil Crops, Oil Crops Research Institute of Chinese Academy of Agricultural Sciences, Ministry of Agriculture and Rural Affairs, Wuhan 430062, China
*
Author to whom correspondence should be addressed.
Genes 2023, 14(7), 1421; https://doi.org/10.3390/genes14071421
Submission received: 15 June 2023 / Revised: 7 July 2023 / Accepted: 7 July 2023 / Published: 10 July 2023
(This article belongs to the Special Issue Genetics of Biotic and Abiotic Stress Response in Crops)

Abstract

:
SRS (SHI-related sequence) transcription factors play a crucial role in plant growth, development, and abiotic stress response. Although Brassica napus (B. napus) is one of the most important oil crops in the world, the role of SRS genes in B. napus (BnSRS) has not been well investigated. Therefore, we employed a bioinformatics approach to identify BnSRS genes from genomic data and investigated their characteristics, functions, and expression patterns, to gain a better understanding of how this gene family is involved in plant development and growth. The results revealed that there were 34 BnSRS gene family members in the genomic sequence of B. napus, unevenly distributed throughout the sequence. Based on the phylogenetic analysis, these BnSRS genes could be divided into four subgroups, with each group sharing comparable conserved motifs and gene structure. Analysis of the upstream promoter region showed that BnSRS genes may regulate hormone responses, biotic and abiotic stress response, growth, and development in B. napus. The protein-protein interaction analysis revealed the involvement of BnSRS genes in various biological processes and metabolic pathways. Our analysis of BnSRS gene expression showed that 23 BnSRS genes in the callus tissue exhibited a dominant expression pattern, suggesting their critical involvement in cell dedifferentiation, cell division, and tissue development. In addition, association analysis between genotype and agronomic traits revealed that BnSRS genes may be linked to some important agronomic traits in B. napus, suggesting that BnSRS genes were widely involved in the regulation of important agronomic traits (including C16.0, C18.0, C18.1, C18.2 C18.3, C20.1, C22.1, GLU, protein, TSW, and FFT). In this study, we predicted the evolutionary relationships and potential functions of BnSRS gene family members, providing a basis for the development of BnSRS gene functions which could facilitate targeted functional studies and genetic improvement for elite breeding in B. napus.

1. Introduction

B. napus (AACC, 2n = 38), also known as rapeseed, is a significant industrial crop and a popular source of edible oil source globally and originated about 7500 years ago from a cross between two diploid species, B. rapa (AA, 2n = 20) and B. oleracea (CC, 2n = 18) [1]. The ancestor of B. napus underwent triploidization before hybridization, resulting in multiple duplication events throughout its evolutionary history. As a result, the copy number of the gene from B. napus should be six times that of Arabidopsis. B. napus serves multiple purposes in our daily lives, including being used as edible oil, vegetable, high-quality protein animal feed, potential energy crop, and so on. SRS transcription factors play an important role in various biologic processes [2,3,4,5,6,7,8,9,10]. Nevertheless, their function in B. napus has not been extensively studied.
The SRS transcription factors constitute an ancient gene family in plants that are pivotal in diverse biological processes including plant growth, development, hormone synthesis, and signal transduction [11,12]. The majority of members in this family share two constant domains, namely the N-terminal RING-like zinc finger and the C-terminal IGGH domain [12,13]. The RING-like zinc finger domain contains a conserved cysteine-rich ring finger domain (RING finger domain), which engages in various physiological and biochemical processes by acting as E3 ubiquitin ligase or transcription factors [14]. Another IGGH domain, which is abundant in acidic amino acids, promotes the creation of both homo- and heterodimer protein complexes [13]. In Arabidopsis, the gene family’s original discovery site, it has been observed to exert a negative influence on root development by modulating the biosynthesis of the auxin hormone [3].
The number of SRS gene family members differs among different plants. Arabidopsis thaliana (Arabidopsis), for example, a popular model plant, contains 10 members including SHI, STY1(SRS1/STYlISH1), STY2(SRS2/STYlISH2), LRP1(LATERAL ROOT PRIMORDIUM1), and SRS3SRS8 (SHI-related sequence 3–8) [2,4,5,6], 6 in rice [7], 26 in cotton [8], and 21 in soybean [9]. Extensive research has been conducted on SRS genes since their discovery in Arabidopsis. Studies have shown that SRS genes can regulate root development by inducing the expression of the auxin hormone synthesis gene YUCCA4. Moreover, when the LPR1 gene is overexpressed, auxin hormone levels rise, inhibiting root development [2,4]. Both leaf and flower tissues play crucial roles in the vegetative and reproduction process. A large number of loci associated with the development of these tissues have been identified in Brassica, such as the FLC gene [14], the MADS-box genes [15], the BoPLD1 gene [16], the BnDWF/DCL1 locus [17], BoABI1, BoAP1, BoPLD1, BoTHL1 and PBCGSSRBo39 [18], and the Ll 3.2 locus [19]. In addition, SRS genes can also affect leaf and flower development. Mutations in a single AtSRS gene can lead to altered leaf shape and abnormal flower development, and when multiple SRS genes are mutated simultaneously trait differences also increase, indicating some functional overlap among the SRS family members [10,12]. Overexpressing the AtSHI gene results in significant dwarfism and delayed flowering [11,20]. Meanwhile, in barley, SRS genes can regulate awn length and flower development [21,22]. While in maize, SRS genes could take part in carbohydrate redistribution during leaf senescence [23]. Abiotic stresses such as drought, temperature, salt, and nutrient stresses can alter plant biosynthesis and nutrient acquisition throughout plant growth and development. These stresses emerge as significant factors that restrict plant growth and impact crop yield and quality [24,25,26]. In winter rapeseed, a large number of stable reference genes have been identified under various stresses by integrating multiple tools under different stress [27]. The co-expression of multiple genes can improve stress tolerance for better adaptation to different abiotic stresses in B. napus [28]. Glucobrassicin (GBS), a secondary metabolite found in a large number of Brassica species, exhibits an increase in content under various abiotic stresses [29]. Furthermore, SRS genes also showed important roles during salt-stressed environments, indicating that they are also involved in the biological processes of adversity stress [9,30].
The SRS gene family plays a vital role in various biological processes such as plant growth, hormone regulation, stress response, and development. A comprehensive understanding of the SRS gene family`s functions can assist in breeding superior plant varieties. Nevertheless, there is limited information available on the SRS gene family in B. napus. Therefore, this study employs a bioinformatic approach to characterize and investigate the BnSRS gene family’s structure, expression, distribution, evolutionary patterns, and potential impact on agronomic traits, aiming to provide a better understanding of its potential function and assist in the breeding of superior varieties of B. napus in the future.

2. Materials and Methods

To provide a comprehensive overview of the study, a flow chart was created (Figure 1). In detail, we performed the identification and verification of the BnSRS gene after downloading the genome sequence and annotation files. Once the BnSRS genes were obtained, evolutionary and gene structural analysis, expression pattern analysis, protein-protein interacting analysis, and association mapping analysis were performed to reveal the potential function of the BnSRS genes, facilitating targeted functional studies and genetic improvement for elite breeding in B. napus.

2.1. Characterization and Physicochemical Characterization of BnSRS Family Members

The analysis utilized the commonly used reference genome, Darmor-bzh (v4.1) [1], which is the first assembled B. napus genome based on high-depth sequencing data, with a genome size of approximately 850 Mb, containing 101,040 protein-coding genes. The genome sequence and gene structure files were obtained from the BRAD database (http://brassicadb.cn/, accessed on 6 March 2023). The SRS protein sequence of the model plant Arabidopsis was downloaded from the TAIR database (https://www.arabidopsis.org, accessed on 6 March 2023). To identify the BnSRS genes, the Hidden Markov Models (HMM) file, PF05142, of the SRS gene family was downloaded from the Pfam database (v35.0, http://pfam.xfam.org, accessed on 6 March 2023) [31]. BnSRS candidate genes were identified by searching through the B. napus protein sequence using hmmer3.0 software with a set e-value < 1 × 10⁻⁵ [32]. The candidate gene was further verified against the conserved domain using the online web tool NCBI-CDD (https://www.ncbi.nlm.nih.gov/Structure/cdd/docs/cdd_search.html, accessed on 6 March 2023) [33] and the SMART database (http://smart.embl.de/, accessed on 6 March 2023) [34] with a default parameter. The remaining BnSRS genes were subjected to the online software ExPASy (http://web.expasy.org/protparam/, accessed on 6 March 2023) to predict the molecular weights (MW), isoelectric point (pI), Instability Index, aliphatic index, and grand average of hydropathicity. Then, the subcellular location of BnSRS proteins was predicted using the WoLFPSORT online tool (https://wolfpsort.hgc.jp/, accessed on 6 March 2023) [35]. Finally, the position of the BnSRS gene on the chromosome was determined based on the reference genome annotation information.

2.2. The Phylogenetic Analysis of BnSRS

The SRS protein from B. napus, Arabidopsis, rice (Oryza sativa), cotton (Gossypium hirsutum, G. hirsutum), and soybean (Glycine max) were used to construct the phylogenetic tree. First, multiple sequence alignment was performed on the integrated protein sequences using MUSCLE software [36]. Next, MEGA software was used to construct a phylogenetic tree based on the ML method with a bootstrap value set to 5000 [37]. Finally, the phylogenetic tree file was uploaded to the online software iTOL v6.5.2 (https://itol.embl.de/) for visualization [38]. Multiple synteny analysis was also performed between these five species by using Tbtools software [39]. To identify the duplicated gene pairs of BnSRS, the software BLASTP was used to align the BnSRS protein sequences with the e-value of 1 × 10⁻¹⁰ [40], then the software MCScan X [41] was used to identify the duplicated gene pairs of BnSRS which were visualized using the software Circos [42]. Once the duplicated gene pairs of BnSRS were obtained, the software Tbtools was used to calculate the evolutionary pressure of each duplicated gene pair of BnSRS [39].

2.3. The Gene Structure, Conserved Motifs, and Cis-Acting Regulatory Elements Analysis

The exon and intron structures of the BnSRS gene were obtained based on the genome annotation file. The conserved motifs of the BnSRS gene family were predicted using the online software MEME (v5.5.3, https://meme-suite.org/tools/, accessed on 6 March 2023) with a maximum number of conserved motifs set to 10 [43]. To identify cis-acting regulatory elements, the sequences in the 2 kb upstream of the BnSRS genes were extracted, and then the online software PlantCARE5 (https://bioinformatics.psb.ugent.be/webtools/plantcare/html/, accessed on 6 March 2023) was used to predict the cis-acting regulatory elements of each BnSRS gene [44]. Finally, gene structure, conserved motifs, and cis-acting regulatory elements were visualized by Tbtools [39].

2.4. Analysis of the Expression Pattern of BnSRS in Different Tissues and Different Environments

Transcriptome data were obtained from the previous studies that included a total of 32 tissues containing bud, callus, leaf, stamen, new pistil, blossomy pistil, wilting pistil, stem, sepal, ovule, 11 time-course seeds and silique walls (0, 4, 8, 12, 16, 20, 24, 28, 32, 40, 48), and five stress conditions (Sclerotinia sclerotiorum (S. sclerotiorum), dehydration, salt, cold, and abscisic acid) [45,46,47]. These data were aligned to the reference genome by software hisat2 with the following parameters: -t -p 40—min-intronlen 20—max-intronlen 20,000—dta [48], and the expression quantity based on the transcripts per kilobase million (TPM) normalization method was calculated by software Stringtie with the setting: -e -B -p 30 -f 0.1 [49]. Finally, the expression of BnSRS was extracted and displayed by Tbtools [39].

2.5. Prediction of Protein-Protein Interaction Network Analysis

To explore proteins that interact with BnSRS proteins, based on the homologs of the BnSRS genes in Arabidopsis, we conducted a protein-protein interaction network analysis. These homologous proteins were subjected to the online software STRING (v12.0, https://www.string-db.org/, accessed on 6 March 2023) to obtain the interacting proteins [50]. Subsequently, the sequences of these proteins were aligned to obtain the homologous protein sequences in B.napus. Finally, these genes will be used to perform the GO and KEGG enrichment analysis by R package clusterProfiler to investigate the biological functions [51].

2.6. Association Mapping Analysis of BnSRS Genes with Important Agronomic Traits

To investigate the effect of the BnSRS gene on important agronomic traits, we used previously reported genotype data including 324 B. napus accessions [52]. SNPs within the BnSRS gene body were extracted and annotated using the software SnpEff [53]. Thereafter, 11 important agronomic traits were selected. These traits include fertility traits (final flowering time (FFT)). Proper fertility can improve the adaptability of B. napus to the season, which can be used to determine the area of B. napus promotion, and is very meaningful for achieving stable and high yields of B. napus. We also selected the yield trait of thousand seed weight (TSW), which is directly related to the yield of B. napus, and is of great importance for B. napus breeding. With the improvement of people’s living standards, people pay more and more attention to the quality of edible oil, therefore, we also investigated some quality traits (including palmitic acid (C16.0), stearic acid (C18.0), oleic acid (C18.1), linoleic acid (C18.2), linolenic acid (C18.3), eicosenoic acid (C20.1), erucic acid (C22.1), Glucosinolates (GLU), and protein). With the general linear model (GLM) method, an association mapping analysis was performed by the software rMVP between the SNP and these traits [54].

3. Results and Discussion

3.1. Identification of BnSRS Genes and Analysis of Physicochemical Properties of Its Family Members

The SRS gene family was represented by the Hidden Markov Model (HMM) PF05142, which was used to search for candidate genes with distinctive SRS domains in B. napus protein sequences. These candidate genes were verified through the online web tool NCBI-CDD [33] and SMART [34] database to identify genes with the DUF702 domain. As a result, 34 BnSRSs, named BnSRS1-BnSRS34 according to their positions in the genome sequence, were identified. The number of BnSRS genes was six more than in the previous study, providing an excellent addition to the research of the BnSRS gene family [55]. The majority of the proteins encoded by these BnSRS genes (30/34) were found to be located in the nucleus (Table S1), which is in agreement with previous studies [55,56]. Additionally, various properties of these proteins such as the number of amino acids (AA), molecular weight (MW), isoelectric point (pI), instability index, aliphatic index, and grand average of hydropathicity were statistically analyzed using Table S1. The results showed that the length of the AA ranged from 130 to 346 with an average length of 280.9; the BnSRS29 protein was identified as the shortest, while the BnSRS32 protein was the longest. The MW of the proteins ranged from 15,066.46 to 38,329.85. The pI values were found to range from 4.56 to 10.06, with 13 pI values less than 7 and 21 pI values greater than 7, indicating that most of the BnSRS proteins were alkaline. The instability index ranged from 42.17–68.46, and all were unstable proteins. The aliphatic index ranged from 38.95–84.58. The grand average of hydropathicity ranged from −0.93 to −0.047, indicating that all the identified proteins were hydrophilic.

3.2. Phylogenetic Analysis of BnSRS

To reveal the phylogenetic relationship of BnSRS, a maximum likelihood (ML) phylogenetic tree was constructed using protein sequences of the SRS gene from 34 BnSRSs, 10 AtSRSs, 6 OsSRSs [7], 26 GhSRSs [8], and 21 GmSRSs [9]. The results showed that all SRSs could be classified into four groups according to the clustering relationship, with varying numbers of gene members per group. Group I comprised 25 members, including 1 from Arabidopsis, 4 from B. napus, 2 from rice, 9 from cotton, and 9 from soybean. Group II comprised 21 members, including 5 from Arabidopsis, 11 from B. napus, 4 from rice, 1 from cotton, and none from soybean. The largest number of members was found in group III, which had 47 members comprising 3 from Arabidopsis, 16 from B. napus, none from rice, 16 from cotton, and 12 from soybean. Lastly, group IV comprised 4 members with 1 and 3 members in Arabidopsis and B. napus, respectively (Figure 2). Additionally, multiple synteny analysis was also performed among the five species (Figure S1), which revealed that a large and significant number of SRS genes were not homologous to SRS genes in other species, implying that SRS genes have undergone substantial divergence during the evolutionary process.

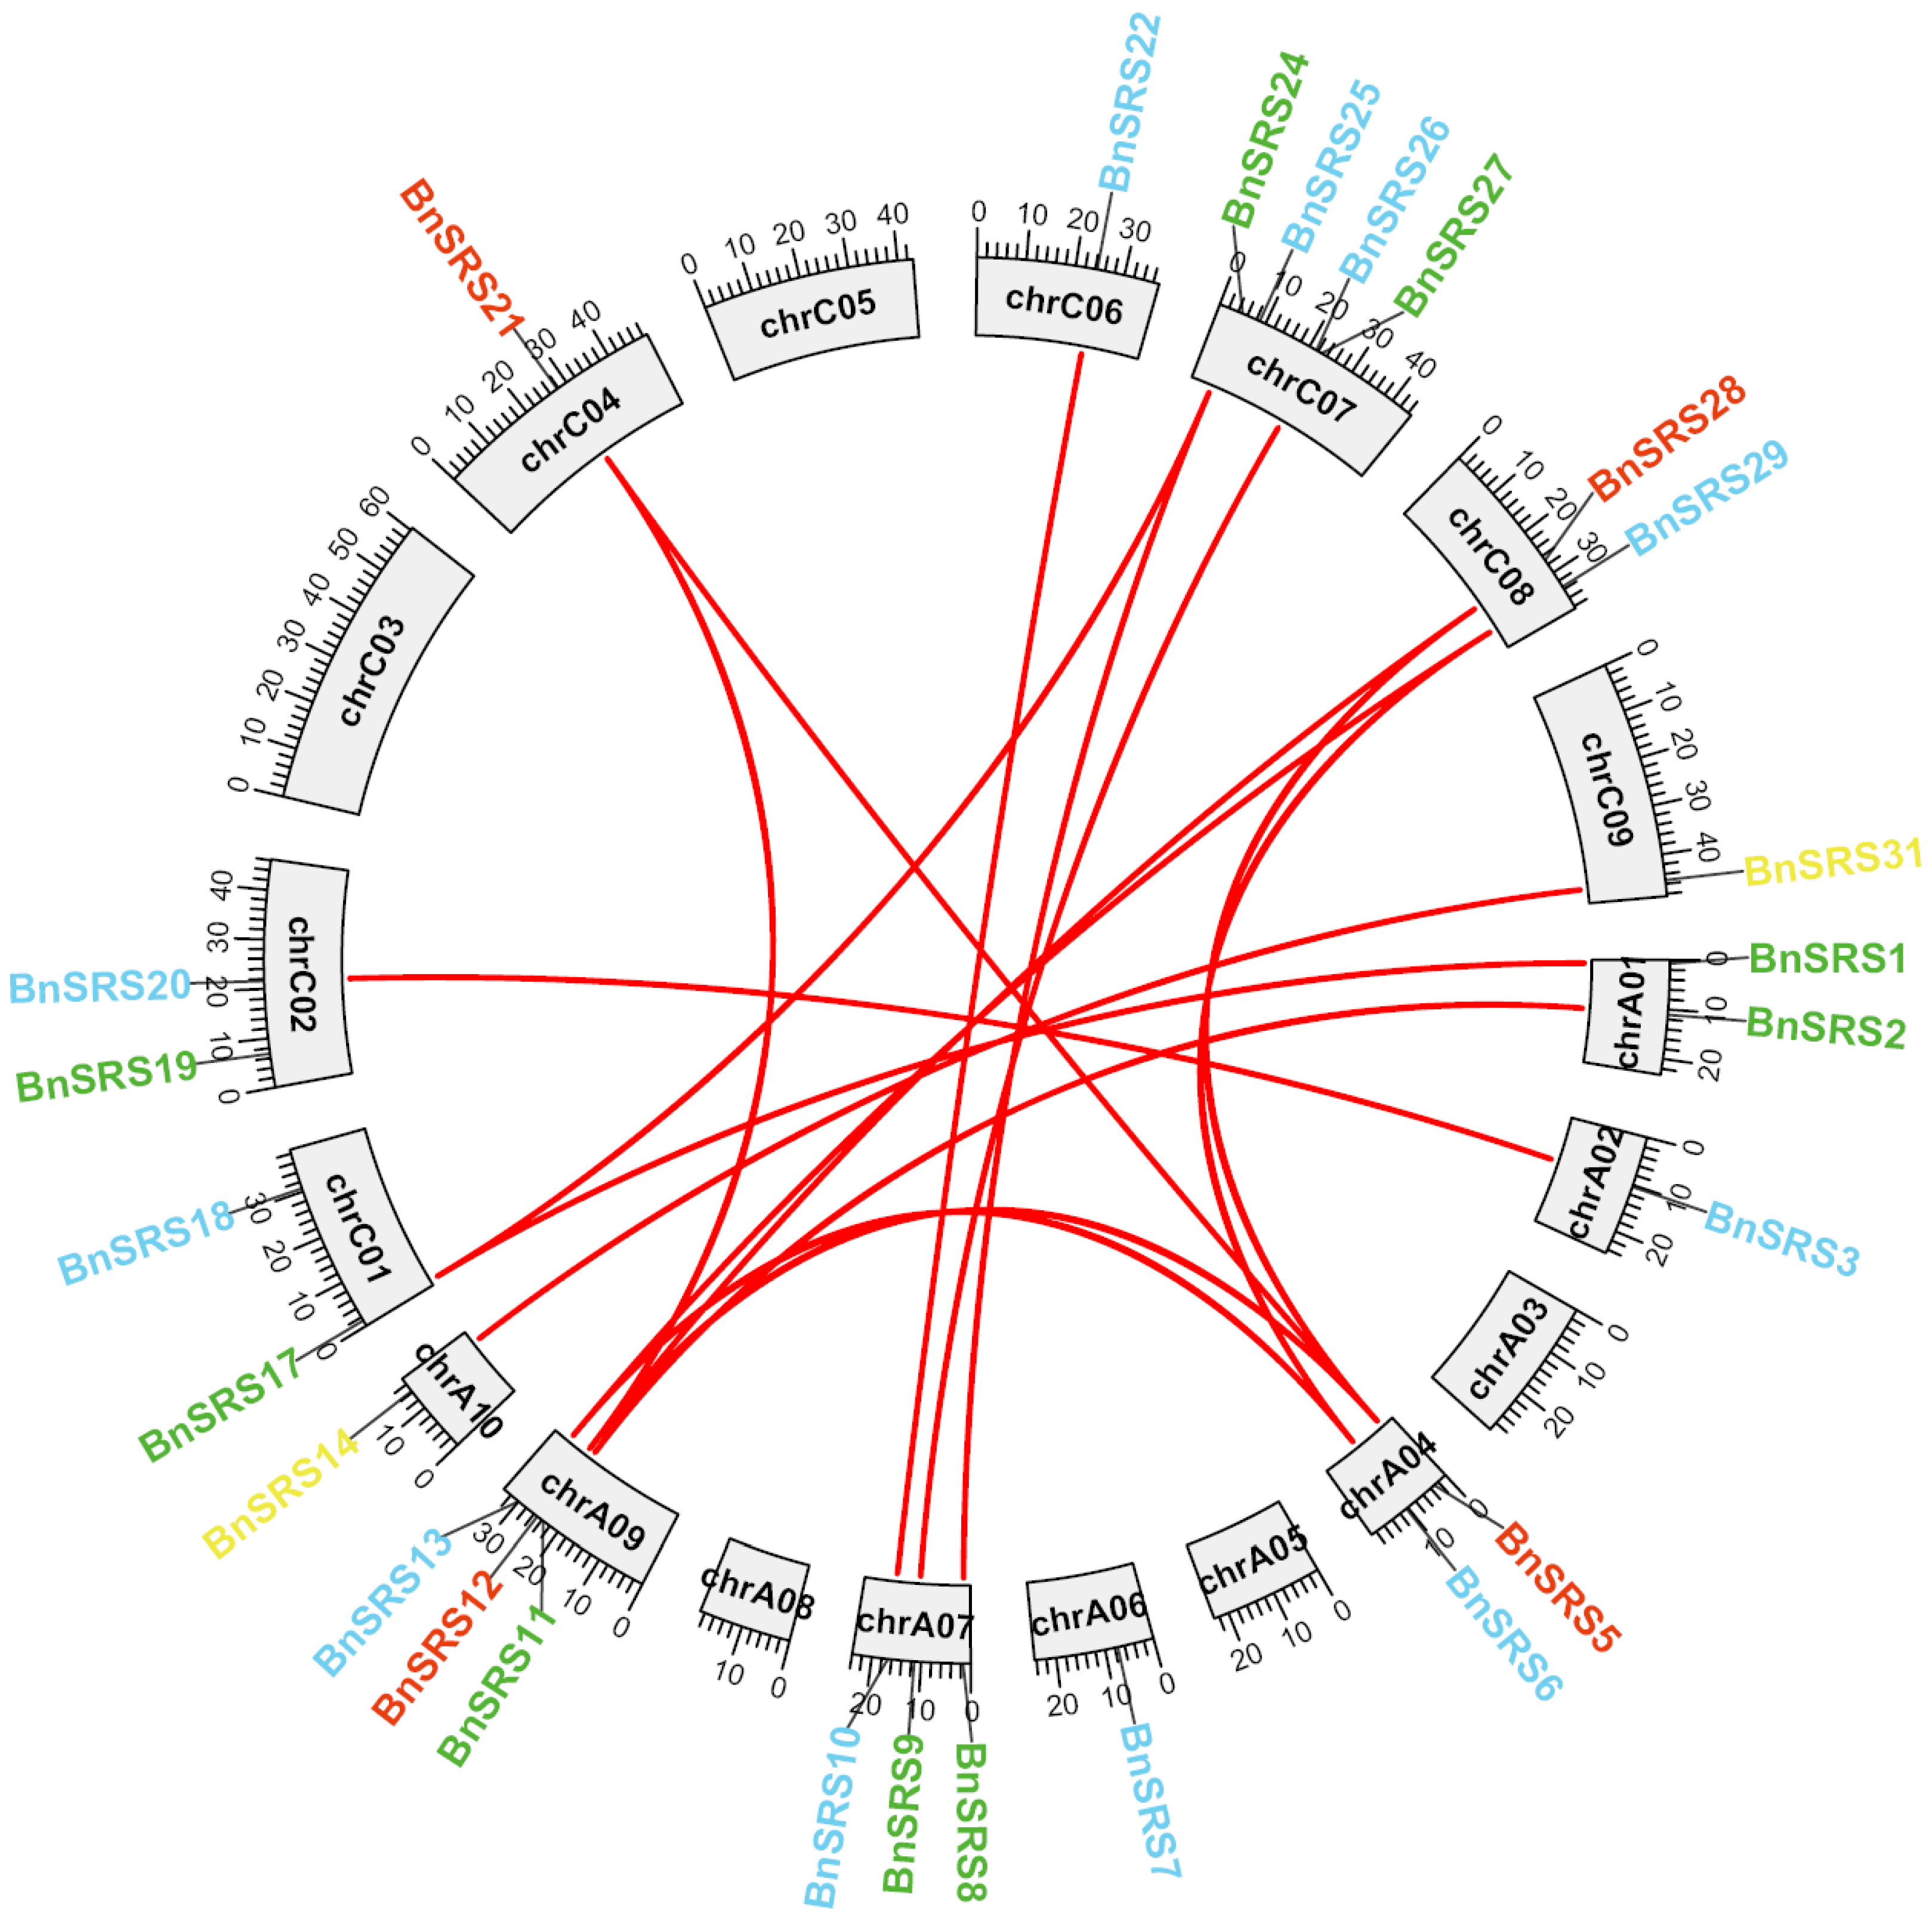
3.3. Analysis of Chromosomal Localization and Duplication Events of BnSRS Gene Family Members

Gene duplication is a widespread phenomenon among various species and plays a critical role in promoting species diversity and creating novel species [57,58]. This study focuses on B. napus, which is believed to have originated from natural hybridization between Brassica rapa and Brassica oleracea about 7500 years ago [1,59,60]. The ancestor of B. napus underwent triploidization before hybridization, resulting in multiple duplication events throughout its evolutionary history. As a result, the number of BnSRS gene families should be six times that of Arabidopsis. However, the annotation file revealed 34 members of the BnSRS gene family, which was lower than expected. This may be due to the loss of the BnSRS gene or functional divergence. Twenty-six BnSRS genes were unevenly distributed over 14 chromosomes, with the highest number of members found on chromosome C07, which contains 4 BnSRS members. Chromosomes A07 and A09 both had 3 each, while chromosomes A01, A04, C01, C02, and C08 had 2 members each, and chromosomes A02, A05, A10, C04, C06, and C09 had only 1 member each (Figure 3 and Table S1). B. napus, an allotetraploid crop, has undergone multiple duplication events. To further explore the evolutionary relationships of BnSRS, we identified the duplication events and the duplicated gene pairs. A total of 20 duplicated gene pairs were found in the BnSRS genes, with 2 pairs of both genes found within the A subgenome, 1 pair in the C subgenome, and the remaining 17 duplicated gene pairs between the 2 subgenomes (Figure 3 and Table S2). Upon analyzing these gene pairs, we found that all had non-synonymous to synonymous substitutions (Ka/Ks) values less than 1, similar to that in Cassava [61], indicating that they underwent purifying selection during the evolutionary process. In addition, 23 out of the 34 BnSRS genes had undergone WGD (whole genome duplication) or segmental, which indicated that the expansion of the BnSRS gene members mainly resulted from WGD or segmental events.

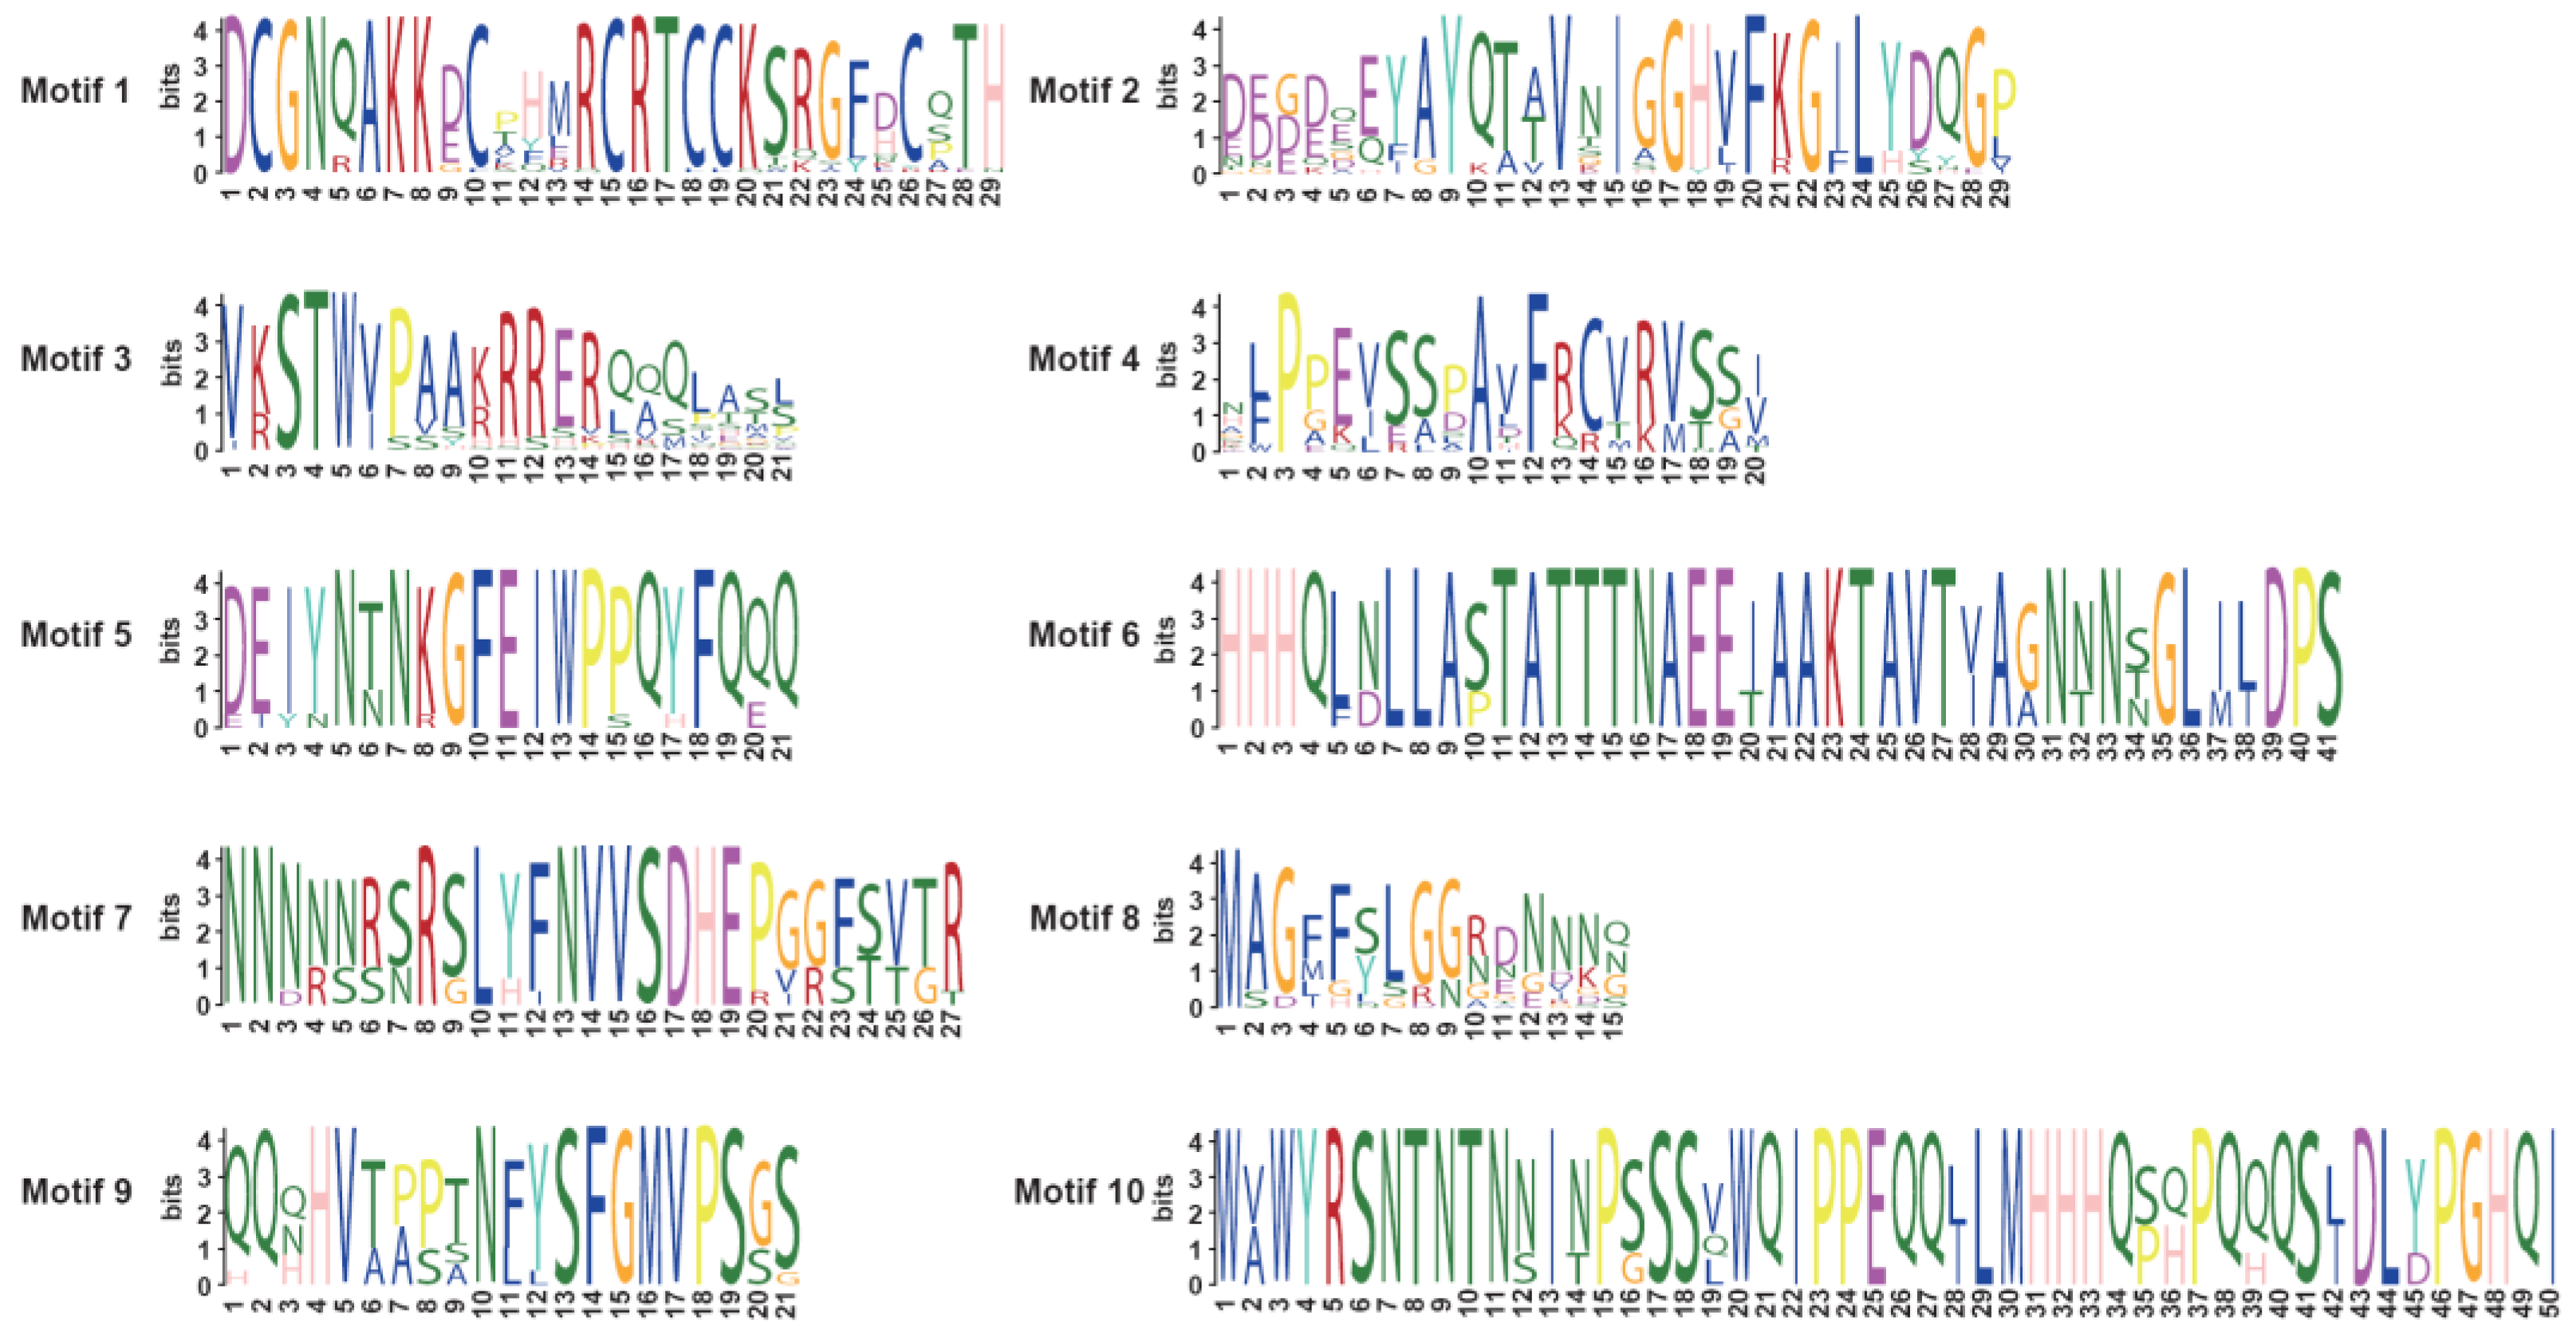
3.4. Analysis of BnSRS Gene Structure and Conserved Motifs

The number of exons varied among subgroups. The highest average number of exons per gene was found in Group I (4). Followed by group II (average of 2, range of 1–3). Exon counts varied the greatest in group III, from 2 to 5, with an average of 3. Finally, group IV genes all contained 2 exons (Figure 4A,C). To analyze the domain functions present in the BnSRS genes, we analyzed their motif distribution. The results showed that the majority (32/34) of the BnSRS genes contained a RING-like zinc finger (motif 1), while 29 BnSRS genes had the IGGH domain (Motif 2), indicating that these two motifs tend to be conserved in the BnSRS gene family (Figure 5). In addition, different motifs were observed to have varying distributions among the different BnSRS subgroups. For example, motif 6 was only present in both group II and group III, while motif 10 was only present in group II, and motif 9 was only present in group III. The number of motifs also varied among subgroups, with group III having the highest number of motifs and group I having the fewest, suggesting that changes in motif number occurred during the evolutionary process of the BnSRS family members, leading to functional divergences among them (Figure 4B). In addition, similar motifs were observed among members of the same subgroups, suggesting potential similarities in evolutionary relationships or functions (Figure 2 and Figure 4).

3.5. Analysis of Cis-Acting Elements of the BnSRS Genes

Plants have complex regulatory mechanisms that respond to biotic and abiotic stresses, and many of these mechanisms depend on cis-acting elements present in the promoter regions of genes [62,63]. The critical promoter region of a gene plays a crucial role in regulating its function [64]. To identify cis-acting elements of the BnSRS genes, a sequence of 2000 bp upstream of the translation starting at the site was extracted and submitted to PlantCare, an online web tool for cis-acting element analysis [44]. After analyzing the results, it was discovered that the extracted sequence contained various hormone-related elements, such as auxin-responsive, abscisic acid responsiveness, gibberellin responsiveness, MeJA-responsive, salicylic acid responsiveness, and others (AuxRR-core, ABRE, TATC-box, TGACG-motif, TCA-element). Additionally, stress-related elements, light responsiveness, low-temperature responsiveness, drought-inducibility, anaerobic induction, and others (TC-rich repeats, ACE, LTR, MBS, ARE) were also present. Furthermore, development-related elements were also identified, such as circadian control, cell cycle regulation, meristem expression, endosperm expression, and others (circadian, MSA-like, CAT-box, AACA_motif). Among these elements, ABRE, ARE, and CAT-box accounted for the highest number of hormone-related elements, stress-related elements, and development-related elements, respectively (Figure 6 and Table S3). All of the BnSRS genes’ promoter regions contained light-responsive elements, suggesting that the BnSRS genes may be involved in the light response during the growth and development of B. napus. The promoter regions of 30 BnSRS genes contained abscisic acid-responsive and anaerobic induction-related elements, while 26 BnSRS genes had MeJA-responsive related elements. Additionally, nearly half of the BnSRS genes (16/34) contained low-temperature responsive elements (Figure S2 and Table S3). Additionally, some BnSRS genes contained stress-responsive, drought-inducibility, cell cycle regulation, and other related elements in the promoter region (Figure 6). These results suggest that BnSRS genes may play a crucial role in regulating hormone responses and in response to stresses, as well as growth and development, which is consistent with the SRS gene family in Cassava [61] and cotton [8].

3.6. Expression Pattern Analysis of BnSRS Gene Family Members

The expression pattern of genes could be used to infer the molecular functions of genes. Previous studies have shown that SRS genes were expressed in roots, stems, leaves, flowers, seeds, and other tissues, and were involved in growth and developmental processes in plants [2,3,6,7,8,9,11,20,23,56,65]. To further explore the function of the BnSRS gene family, we analyzed their expression patterns in different tissues and under various stresses. The results showed that only 2 BnSRS genes (BnSRS18 and BnSRS21) were expressed in all 32 tissues, while 34 BnSRS genes were expressed in 1 or more tissues. Twenty-three of them showed a dominant expression in callus tissue; indicating the potential importance of BnSRS genes in cell division, growth, and development (Figure 7). In the silique wall tissue, only 14 BnSRS genes were expressed at all times. In addition, the expression of BnSRS18 increased as DAP increased, except at 40 DAP, which showed a decrease (Figure S3A). Meanwhile, the expression of BnSRS21 declined continuously with the increase of DAP (Figure S3A). In the seed tissue, the expression of BnSRS21 showed a similar pattern to that in the silique wall tissue; while the expression of BnSRS18 increased and then decreased, with the highest expression at the 28th DAP (Figure S3B). Moreover, B.napus is exposed to a variety of biotic and abiotic stresses during its growth and development, and SRS genes play an important role in response to biotic and abiotic stresses [7]. So, we also investigated the changes in BnSRS gene expression under biotic and abiotic stresses. The results showed that only 4 BnSRS genes had expression under all stresses (Figure 8A). The overall findings demonstrated that only 9 BnSRS genes were expressed under all abiotic stresses, and most of the genes were expressed at a low level under different abiotic stresses, except for BnSRS18, which demonstrated up-regulation under different abiotic stresses except under dehydration for 1 h, with the highest expression up-regulation observed under salt treatment for 24 h, which was more than 2-fold. Most BnSRS genes displayed significant down-regulation under diverse abiotic stresses, with BnSRS2 showing the greatest decrease at 22-fold under ABA treatment for 24 h (Figure 8B). To investigate the expression profile of the BnSRS genes under biotic stress, we investigated the inoculation of B. napus at 0 and 24 h with S. sclerotiorum. The results showed that only some BnSRS genes responded to S. sclerotiorum inoculation (Figure 8B). Only the expression of BnSRS18 showed a significant increase, with a nearly 2-fold up-regulation, while the expression of BnSRS21 showed a substantial decrease, with a nearly 3-fold down-regulation (Figure 8B). These results suggested that the BnSRS genes play an important role in response to a variety of stresses, as in other species [6,7,8,9,61].

3.7. Prediction of BnSRS Proteins Interactions Analysis

To investigate the function of BnSRS genes in B. napus, we conducted a protein-protein interaction analysis using their homology to Arabidopsis. The results revealed that 20,145 genes interacted with these 34 BnSRS genes (Table S4). In the interaction network, these 34 BnSRS proteins were located in the central node, with most of them interacting with other proteins of BnSRS (Figure 9A). Furthermore, we performed the Gene Ontology (GO) enrichment and Kyoto Encyclopedia of Genes and Genomes (KEGG) pathway analysis on these interacting proteins. The KEGG pathway analysis showed that the genes encoding the interacting proteins were involved in various biochemical pathways, including phenylalanine, tyrosine and tryptophan biosynthesis, cytochrome P450, glycine, serine, and threonine metabolism, and so on (Figure 9B and Table S5). The GO enrichment analysis revealed that the genes encoding the interacting proteins were involved in multiple biological processes, such as transition metal ion transport, auxin-activated signaling pathway, stamen development, and so on. Furthermore, in terms of cellular components, these proteins were enriched in myosin complex, endosome membrane, microtubule, and others. In terms of molecular function, these proteins were enriched in tryptophan synthase activity, motor activity, pectinesterase activity, and so on (Table S6). Protein-protein interactions analysis showed that BnSRS proteins played an important role in many aspects of development and growth.

3.8. Genetic Effects of BnSRS Genes on B. napus Agronomic Traits

Previous studies have demonstrated that SRS genes have an impact on various plant traits, including flower development [12], root development [2,4], plant height, etc [11,20,66]. To investigate the impact of BnSRS genes on agronomic traits in B. napus, a natural population of 324 B. napus accessions was employed, and the relationship between BnSRS and agronomic traits was analyzed [52]. After filtering, a total of 3,320,299 SNPs were identified from the SNP genotype data of these natural populations, out of which 168 SNPs were located on the 34 gene sequences, with 111 on the A subgenome and 57 on the C subgenome. Interestingly, the density of SNPs within the BnSRS genes was found to be higher in the A subgenome (5/kb) than in the C subgenome (2/kb), indicating an asymmetric evolution of the BnSRS genes between the A and C subgenomes (Table S7). However, the SNP density within the BnSRS gene (3.4/kb) was lower than the genome-wide SNP density (4.5/kb), implying its relative conservation. Furthermore, annotation of all the SNPs identified 86 SNPs in the exon region (including 48 nonsynonymous, 37 synonymous, and 1 splicing junction mutation). Remarkably, group II had the highest number of SNPs per BnSRS gene on average, approximately 15, followed by group III (12 SNPs per gene), and group I (11 SNPs per gene). The minimum in group IV showed only about 4 SNPs per gene. Additionally, significant differences were observed in the distribution of SNP numbers among duplicated gene pairs. For instance, BnSRS31 had no SNP distribution, while 17 SNPs were identified in its corresponding duplicated gene, BnSRS14. Finally, an association analysis between SNPs and agronomic traits was conducted to examine the effect of the BnSRS gene on agronomic traits in B. napus. The results showed that a total of 27 SNPs were associated with at least one trait. For example, the gene BnSRS1 was significantly associated with protein content, final flowering time (FFT), and thousand seeds weight (TSW) (Figure 10A). Furthermore, the B. napus population was divided into different subgroups according to the significant loci, the results showed that the phenotypic differences between subgroups were also highly significant (Figure 10B–D). These findings suggest that BnSRS genes play a significant role in regulating essential agronomic traits in B. napus. Additionally, the identified SNPs can serve as valuable genetic resources for future research exploring the functional properties of BnSRS genes.

4. Conclusions

In this study, we identified a total of 34 BnSRS genes and categorized them into four subgroups based on their phylogenetic relationships. Most members within each subgroup exhibit similar motifs, while variations in motifs among subgroups may contribute to the functional diversity of BnSRS genes. The presence of cis-acting elements in the BnSRS genes promoters, the expression patterns in different tissues and under various abiotic and biotic stresses, as well as the protein-protein interaction analysis indicated their potential role in regulating various aspects of plant growth, development, and adversity stress. Furthermore, association analysis revealed the involvement of BnSRS genes in the regulation of several important agronomic traits. Overall, These findings contribute significantly to our understanding of the BnSRS gene family and establish a solid foundation for further research on the biological and functional properties of BnSRS genes.

Supplementary Materials

The following supporting information can be downloaded at: https://www.mdpi.com/article/10.3390/genes14071421/s1, Figure S1: Multiple synteny among five species. A, B, C, D, and E represent rice, Arabidopsis, B. napus, cotton, and soybean, respectively; Figure S2: The abundance of the identified cis-acting elements in the promoters of BnSRS genes; Figure S3: The expression levels of BnSRS genes in silique (a) and seed (b) tissues. Table S1: Characteristics of physicochemical properties of the BnSRS genes.; Table S2: Ka/Ks analysis for duolicated gene pairs of BnSRS genes.; Table S3: The position of cis-acting regulatory elements of BnSRS genes.; Table S4: Predicted protein-protein interactions of SRS Proteins in B. napus.; Table S5: The GO enrichment analysis results of interacting proteins.; Table S6: The KEGG pathway analysis results of interacting proteins.; Table S7: SNPs of the SRS genes identified in 324 B. napus accessions.

Author Contributions

M.H., C.T. and S.L., designed the research; Formal analysis, M.H. and M.X.; Funding acquisition, S.L. and C.T.; Investigation, M.H., X.C. (Xiaobo Cui) and M.X.; Data curation, X.C. (Xiaohui Cheng), J.H. and L.L.; Project administration, C.T.; Resources, M.H. and M.X.; M.H. wrote the manuscript; Review and editing, S.L., C.T., S.Y. and M.H. All authors have read and agreed to the published version of the manuscript.

Funding

This research was funded by the Young Top-notch Talent Cultivation Program of Hubei Province for Dr. Chaobo Tong, the National Natural Science Foundation of China (31770250), the National Key Research and Development Program of China (2018YFE0108000), Central Public-interest Scientific Institution Basal Research Fund, grant number 2021-2060302-061-027 No: 2021-2060302-061-029, the Agricultural Science and Technology Innovation Program of Chinese Academy of Agricultural Sciences (CAAS-ASTIP-2013-OCRI), the China Agriculture Research System of MOF and MARA (CARS-12), and the National Key Research and Development Program of China (2022YFD1200400).

Institutional Review Board Statement

Not applicable.

Informed Consent Statement

Not applicable.

Data Availability Statement

The corresponding data are shown in Supplementary Materials.

Acknowledgments

We would like to thank Zhixian Qiao at the Analysis and Testing Center of the Institute of Hydrobiology, Chinese Academy of Sciences, for her assistance with data analysis.

Conflicts of Interest

The authors declare no conflict of interest.

References

  1. Chalhoub, B.; Denoeud, F.; Liu, S.; Parkin, I.A.; Tang, H.; Wang, X.; Chiquet, J.; Belcram, H.; Tong, C.; Samans, B.; et al. Plant genetics. Early allopolyploid evolution in the post-Neolithic Brassica napus oilseed genome. Science 2014, 345, 950–953. [Google Scholar] [CrossRef] [PubMed] [Green Version]
  2. Singh, S.; Yadav, S.; Singh, A.; Mahima, M.; Singh, A.; Gautam, V.; Sarkar, A.K. Auxin signaling modulates LATERAL ROOT PRIMORDIUM1 (LRP1) expression during lateral root development in Arabidopsis. Plant J. 2020, 101, 87–100. [Google Scholar] [CrossRef] [PubMed]
  3. Smith, D.L.; Fedoroff, N.V. LRP1, a gene expressed in lateral and adventitious root primordia of arabidopsis. Plant Cell 1995, 7, 735–745. [Google Scholar]
  4. De Rybel, B.; Audenaert, D.; Xuan, W.; Overvoorde, P.; Strader, L.C.; Kepinski, S.; Hoye, R.; Brisbois, R.; Parizot, B.; Vanneste, S.; et al. A role for the root cap in root branching revealed by the non-auxin probe naxillin. Nat. Chem. Biol. 2012, 8, 798–805. [Google Scholar] [CrossRef] [PubMed] [Green Version]
  5. Eklund, D.M.; Cierlik, I.; Ståldal, V.; Claes, A.R.; Vestman, D.; Chandler, J.; Sundberg, E. Expression of Arabidopsis SHORT INTERNODES/STYLISH family genes in auxin biosynthesis zones of aerial organs is dependent on a GCC box-like regulatory element. Plant Physiol. 2011, 157, 2069–2080. [Google Scholar] [CrossRef] [PubMed] [Green Version]
  6. Gomariz-Fernández, A.; Sánchez-Gerschon, V.; Fourquin, C.; Ferrándiz, C. The Role of SHI/STY/SRS Genes in Organ Growth and Carpel Development Is Conserved in the Distant Eudicot Species Arabidopsis thaliana and Nicotiana benthamiana. Front. Plant Sci. 2017, 8, 814. [Google Scholar] [CrossRef] [PubMed] [Green Version]
  7. Yang, J.; Xu, P.; Yu, D. Genome-Wide Identification and Characterization of the SHI-Related Sequence Gene Family in Rice. Evol. Bioinform. Online 2020, 16, 1176934320941495. [Google Scholar] [CrossRef] [PubMed]
  8. Sun, C.; Yu, L.; Zhang, S.; Gu, Q.; Wang, M. Genome-wide characterization of the SHORT INTER-NODES/STYLISH and Shi-Related Sequence family in Gossypium hirsutum and functional identification of GhSRS21 under salt stress. Front. Plant Sci. 2022, 13, 1078083. [Google Scholar] [CrossRef]
  9. Zhao, S.P.; Song, X.Y.; Guo, L.L.; Zhang, X.Z.; Zheng, W.J. Genome-Wide Analysis of the Shi-Related Sequence Family and Functional Identification of GmSRS18 Involving in Drought and Salt Stresses in Soybean. Int. J. Mol. Sci. 2020, 21, 1810. [Google Scholar] [CrossRef] [Green Version]
  10. Kuusk, S.; Sohlberg, J.J.; Long, J.A.; Fridborg, I.; Sundberg, E. STY1 and STY2 promote the formation of apical tissues during Arabidopsis gynoecium development. Development 2002, 129, 4707–4717. [Google Scholar] [CrossRef]
  11. Fridborg, I.; Kuusk, S.; Robertson, M.; Sundberg, E. The Arabidopsis protein SHI represses gibberellin responses in Arabidopsis and barley. Plant Physiol. 2001, 127, 937–948. [Google Scholar] [CrossRef]
  12. Kuusk, S.; Sohlberg, J.J.; Magnus Eklund, D.; Sundberg, E. Functionally redundant SHI family genes regulate Arabidopsis gynoecium development in a dose-dependent manner. Plant J. 2006, 47, 99–111. [Google Scholar] [CrossRef]
  13. Eklund, D.M.; Ståldal, V.; Valsecchi, I.; Cierlik, I.; Eriksson, C.; Hiratsu, K.; Ohme-Takagi, M.; Sundström, J.F.; Thelander, M.; Ezcurra, I.; et al. The Arabidopsis thaliana STYLISH1 protein acts as a transcriptional activator regulating auxin biosynthesis. Plant Cell 2010, 22, 349–363. [Google Scholar] [CrossRef] [PubMed] [Green Version]
  14. Zhao, J.; Kulkarni, V.; Liu, N.; Del Carpio, D.P.; Bucher, J.; Bonnema, G. BrFLC2 (FLOWERING LOCUS C) as a candidate gene for a vernalization response QTL in Brassica rapa. J. Exp. Bot. 2010, 61, 1817–1825. [Google Scholar] [CrossRef] [PubMed] [Green Version]
  15. Sheng, X.-G.; Zhao, Z.-Q.; Wang, J.-S.; Yu, H.-F.; Shen, Y.-S.; Zeng, X.-Y.; Gu, H.-H. Genome wide analysis of MADS-box gene family in Brassica oleracea reveals conservation and variation in flower development. BMC Plant Biol. 2019, 19, 106. [Google Scholar] [CrossRef] [PubMed] [Green Version]
  16. Treccarichi, S.; Di Gaetano, C.; Di Stefano, F.; Gasparini, M.; Branca, F. Using Simple Sequence Repeats in 9 Brassica Complex Species to Assess Hypertrophic Curd Induction. Agriculture 2021, 11, 622. [Google Scholar] [CrossRef]
  17. Wang, Y.; Chen, W.; Chu, P.; Wan, S.; Yang, M.; Wang, M.; Guan, R. Mapping a major QTL responsible for dwarf architecture in Brassica napus using a single-nucleotide polymorphism marker approach. BMC Plant Biol. 2016, 16, 178. [Google Scholar] [CrossRef] [PubMed] [Green Version]
  18. Treccarichi, S.; Ben Ammar, H.; Amari, M.; Cali, R.; Tribulato, A.; Branca, F. Molecular Markers for Detecting Inflorescence Size of Brassica oleracea L. Crops and B. oleracea Complex Species (n = 9) Useful for Breeding of Broccoli (B. oleracea var. italica) and Cauliflower (B. oleracea var. botrytis). Plants 2023, 12, 407. [Google Scholar] [CrossRef]
  19. Lv, H.; Wang, Q.; Liu, X.; Han, F.; Fang, Z.; Yang, L.; Zhuang, M.; Liu, Y.; Li, Z.; Zhang, Y. Whole-Genome Mapping Reveals Novel QTL Clusters Associated with Main Agronomic Traits of Cabbage (Brassica oleracea var. capitata L.). Front. Plant Sci. 2016, 7, 989. [Google Scholar] [CrossRef] [Green Version]
  20. Fridborg, I.; Kuusk, S.; Moritz, T.; Sundberg, E. The Arabidopsis dwarf mutant shi exhibits reduced gibberellin responses conferred by overexpression of a new putative zinc finger protein. Plant Cell 1999, 11, 1019–1032. [Google Scholar] [CrossRef] [Green Version]
  21. Youssef, H.M.; Eggert, K.; Koppolu, R.; Alqudah, A.M.; Poursarebani, N.; Fazeli, A.; Sakuma, S.; Tagiri, A.; Rutten, T.; Govind, G.; et al. VRS2 regulates hormone-mediated inflorescence patterning in barley. Nat. Genet. 2017, 49, 157–161. [Google Scholar] [CrossRef] [PubMed]
  22. Yuo, T.; Yamashita, Y.; Kanamori, H.; Matsumoto, T.; Lundqvist, U.; Sato, K.; Ichii, M.; Jobling, S.A.; Taketa, S. A SHORT INTERNODES (SHI) family transcription factor gene regulates awn elongation and pistil morphology in barley. J. Exp. Bot. 2012, 63, 5223–5232. [Google Scholar] [CrossRef] [PubMed] [Green Version]
  23. He, B.; Shi, P.; Lv, Y.; Gao, Z.; Chen, G. Gene coexpression network analysis reveals the role of SRS genes in senescence leaf of maize (Zea mays L.). J. Genet. 2020, 99, 3. [Google Scholar] [CrossRef] [PubMed]
  24. Bechtold, U.; Field, B. Molecular mechanisms controlling plant growth during abiotic stress. J. Exp. Bot. 2018, 69, 2753–2758. [Google Scholar] [CrossRef] [Green Version]
  25. Ben Ammar, H.; Picchi, V.; Arena, D.; Treccarichi, S.; Bianchi, G.; Lo Scalzo, R.; Marghali, S.; Branca, F. Variation of Bio-Morphometric Traits and Antioxidant Compounds of Brassica oleracea L. Accessions in Relation to Drought Stress. Agronomy 2022, 12, 2016. [Google Scholar] [CrossRef]
  26. Raza, A. Eco-physiological and Biochemical Responses of Rapeseed (Brassica napus L.) to Abiotic Stresses: Consequences and Mitigation Strategies. J. Plant Growth Regul. 2021, 40, 1368–1388. [Google Scholar] [CrossRef]
  27. Ma, L.; Wu, J.; Qi, W.; Coulter, J.A.; Fang, Y.; Li, X.; Liu, L.; Jin, J.; Niu, Z.; Yue, J.; et al. Screening and verification of reference genes for analysis of gene expression in winter rapeseed (Brassica rapa L.) under abiotic stress. PLoS ONE 2020, 15, e0236577. [Google Scholar] [CrossRef]
  28. Wang, Z.; Yang, C.; Chen, H.; Wang, P.; Wang, P.; Song, C.; Zhang, X.; Wang, D. Multi-gene co-expression can improve comprehensive resistance to multiple abiotic stresses in Brassica napus L. Plant Sci. 2018, 274, 410–419. [Google Scholar] [CrossRef]
  29. Galletti, S.; Bagatta, M.; Branca, F.; Argento, S.; De Nicola, G.R.; Cianchetta, S.; Iori, R.; Ninfali, P. Isatis canescens is a rich source of glucobrassicin and other health-promoting compounds. J. Sci. Food Agric. 2015, 95, 158–164. [Google Scholar] [CrossRef]
  30. Büyük, İ.; Okay, A.; Aras, S. Identification and Characterization of SRS Genes in Phaseolus vulgaris Genome and Their Responses Under Salt Stress. Biochem. Genet. 2022, 60, 482–503. [Google Scholar] [CrossRef]
  31. Mistry, J.; Chuguransky, S.; Williams, L.; Qureshi, M.; Salazar, G.A.; Sonnhammer, E.L.L.; Tosatto, S.C.E.; Paladin, L.; Raj, S.; Richardson, L.J.; et al. Pfam: The protein families database in 2021. Nucleic Acids Res. 2021, 49, D412–D419. [Google Scholar] [CrossRef] [PubMed]
  32. Mistry, J.; Finn, R.D.; Eddy, S.R.; Bateman, A.; Punta, M. Challenges in homology search: HMMER3 and convergent evolution of coiled-coil regions. Nucleic Acids Res. 2013, 41, e121. [Google Scholar] [CrossRef] [PubMed] [Green Version]
  33. Lu, S.; Wang, J.; Chitsaz, F.; Derbyshire, M.K.; Geer, R.C.; Gonzales, N.R.; Gwadz, M.; Hurwitz, D.I.; Marchler, G.H.; Song, J.S.; et al. CDD/SPARCLE: The conserved domain database in 2020. Nucleic Acids Res. 2020, 48, D265–D268. [Google Scholar] [CrossRef] [PubMed] [Green Version]
  34. Letunic, I.; Khedkar, S.; Bork, P. SMART: Recent updates, new developments and status in 2020. Nucleic Acids Res. 2021, 49, D458–D460. [Google Scholar] [CrossRef]
  35. Horton, P.; Park, K.J.; Obayashi, T.; Fujita, N.; Harada, H.; Adams-Collier, C.J.; Nakai, K. WoLF PSORT: Protein localization predictor. Nucleic Acids Res. 2007, 35, W585–W587. [Google Scholar] [CrossRef] [Green Version]
  36. Edgar, R.C. MUSCLE: Multiple sequence alignment with high accuracy and high throughput. Nucleic Acids Res. 2004, 32, 1792–1797. [Google Scholar] [CrossRef] [PubMed] [Green Version]
  37. Tamura, K.; Stecher, G.; Kumar, S. MEGA11: Molecular Evolutionary Genetics Analysis Version 11. Mol. Biol. Evol. 2021, 38, 3022–3027. [Google Scholar] [CrossRef]
  38. Letunic, I.; Bork, P. Interactive Tree Of Life (iTOL) v5: An online tool for phylogenetic tree display and annotation. Nucleic Acids Res. 2021, 49, W293–W296. [Google Scholar] [CrossRef]
  39. Chen, C.; Chen, H.; Zhang, Y.; Thomas, H.R.; Frank, M.H.; He, Y.; Xia, R. TBtools: An Integrative Toolkit Developed for Interactive Analyses of Big Biological Data. Mol. Plant. 2020, 13, 1194–1202. [Google Scholar] [CrossRef]
  40. Camacho, C.; Coulouris, G.; Avagyan, V.; Ma, N.; Papadopoulos, J.; Bealer, K.; Madden, T.L. BLAST+: Architecture and applications. BMC Bioinform. 2009, 10, 421. [Google Scholar] [CrossRef] [Green Version]
  41. Wang, Y.; Tang, H.; Debarry, J.D.; Tan, X.; Li, J.; Wang, X.; Lee, T.H.; Jin, H.; Marler, B.; Guo, H.; et al. MCScanX: A toolkit for detection and evolutionary analysis of gene synteny and collinearity. Nucleic Acids Res. 2012, 40, e49. [Google Scholar] [CrossRef] [PubMed] [Green Version]
  42. Krzywinski, M.; Schein, J.; Birol, I.; Connors, J.; Gascoyne, R.; Horsman, D.; Jones, S.J.; Marra, M.A. Circos: An information aesthetic for comparative genomics. Genome Res. 2009, 19, 1639–1645. [Google Scholar] [CrossRef] [PubMed] [Green Version]
  43. Bailey, T.L.; Boden, M.; Buske, F.A.; Frith, M.; Grant, C.E.; Clementi, L.; Ren, J.; Li, W.W.; Noble, W.S. MEME SUITE: Tools for motif discovery and searching. Nucleic Acids Res. 2009, 37, W202–W208. [Google Scholar] [CrossRef] [PubMed]
  44. Lescot, M.; Déhais, P.; Thijs, G.; Marchal, K.; Moreau, Y.; Van de Peer, Y.; Rouzé, P.; Rombauts, S. PlantCARE, a database of plant cis-acting regulatory elements and a portal to tools for in silico analysis of promoter sequences. Nucleic Acids Res. 2002, 30, 325–327. [Google Scholar] [CrossRef] [PubMed]
  45. Yao, S.; Liang, F.; Gill, R.A.; Huang, J.; Cheng, X.; Liu, Y.; Tong, C.; Liu, S. A global survey of the transcriptome of allopolyploid Brassica napus based on single-molecule long-read isoform sequencing and Illumina-based RNA sequencing data. Plant J. 2020, 103, 843–857. [Google Scholar] [CrossRef]
  46. Zhang, Y.; Ali, U.; Zhang, G.; Yu, L.; Fang, S.; Iqbal, S.; Li, H.; Lu, S.; Guo, L. Transcriptome analysis reveals genes commonly responding to multiple abiotic stresses in rapeseed. Mol. Breed. 2019, 39, 158. [Google Scholar] [CrossRef]
  47. He, Y.; Li, Y.; Bai, Z.; Xie, M.; Zuo, R.; Liu, J.; Xia, J.; Cheng, X.; Liu, Y.; Tong, C.; et al. Genome-wide identification and functional analysis of cupin_1 domain-containing members involved in the responses to Sclerotinia sclerotiorum and abiotic stress in Brassica napus. Front. Plant Sci. 2022, 13, 983786. [Google Scholar] [CrossRef]
  48. Kim, D.; Langmead, B.; Salzberg, S.L. HISAT: A fast spliced aligner with low memory requirements. Nat. Methods 2015, 12, 357–360. [Google Scholar] [CrossRef] [Green Version]
  49. Pertea, M.; Pertea, G.M.; Antonescu, C.M.; Chang, T.C.; Mendell, J.T.; Salzberg, S.L. StringTie enables improved reconstruction of a transcriptome from RNA-seq reads. Nat. Biotechnol. 2015, 33, 290–295. [Google Scholar] [CrossRef] [Green Version]
  50. Szklarczyk, D.; Gable, A.L.; Nastou, K.C.; Lyon, D.; Kirsch, R.; Pyysalo, S.; Doncheva, N.T.; Legeay, M.; Fang, T.; Bork, P.; et al. The STRING database in 2021: Customizable protein-protein networks, and functional characterization of user-uploaded gene/measurement sets. Nucleic Acids Res. 2021, 49, D605–D612. [Google Scholar] [CrossRef]
  51. Yu, G.; Wang, L.G.; Han, Y.; He, Q.Y. clusterProfiler: An R package for comparing biological themes among gene clusters. Omics 2012, 16, 284–287. [Google Scholar] [CrossRef]
  52. Hu, M.; Xie, M.; Cui, X.; Huang, J.; Cheng, X.; Liu, L.; Liu, S.; Tong, C. Genome-Wide Characterization of Trehalose-6-Phosphate Synthase Gene Family of Brassica napus and Potential Links with Agronomic Traits. Int. J. Mol. Sci. 2022, 23, 15714. [Google Scholar] [CrossRef] [PubMed]
  53. Cingolani, P.; Platts, A.; Wang, L.; Coon, M.; Nguyen, T.; Wang, L.; Land, S.J.; Lu, X.; Ruden, D.M. A program for annotating and predicting the effects of single nucleotide polymorphisms, SnpEff: SNPs in the genome of Drosophila melanogaster strain w1118; iso-2; iso-3. Fly 2012, 6, 80–92. [Google Scholar] [CrossRef] [PubMed] [Green Version]
  54. Yin, L.; Zhang, H.; Tang, Z.; Xu, J.; Yin, D.; Zhang, Z.; Yuan, X.; Zhu, M.; Zhao, S.; Li, X.; et al. rMVP: A Memory-efficient, Visualization-enhanced, and Parallel-accelerated Tool for Genome-wide Association Study. Genom. Proteom. Bioinform. 2021, 19, 619–628. [Google Scholar] [CrossRef]
  55. Fang, D.; Zhang, W.; Cheng, X.; Hu, F.; Ye, Z.; Cao, J. Molecular evolutionary analysis of the SHI/STY gene family in land plants: A focus on the Brassica species. Front. Plant Sci. 2022, 13, 958964. [Google Scholar] [CrossRef]
  56. Zhang, Y.; von Behrens, I.; Zimmermann, R.; Ludwig, Y.; Hey, S.; Hochholdinger, F. LATERAL ROOT PRIMORDIA 1 of maize acts as a transcriptional activator in auxin signalling downstream of the Aux/IAA gene rootless with undetectable meristem 1. J. Exp. Bot. 2015, 66, 3855–3863. [Google Scholar] [CrossRef] [Green Version]
  57. Lynch, M.; Conery, J.S. The evolutionary fate and consequences of duplicate genes. Science 2000, 290, 1151–1155. [Google Scholar] [CrossRef] [PubMed] [Green Version]
  58. Kong, H.; Landherr, L.L.; Frohlich, M.W.; Leebens-Mack, J.; Ma, H.; dePamphilis, C.W. Patterns of gene duplication in the plant SKP1 gene family in angiosperms: Evidence for multiple mechanisms of rapid gene birth. Plant J. 2007, 50, 873–885. [Google Scholar] [CrossRef]
  59. Yang, Y.W.; Lai, K.N.; Tai, P.Y.; Ma, D.P.; Li, W.H. Molecular phylogenetic studies of Brassica, rorippa, arabidopsis and allied genera based on the internal transcribed spacer region of 18S-25S rDNA. Mol. Phylogenet. Evol. 1999, 13, 455–462. [Google Scholar] [CrossRef]
  60. Lysak, M.A.; Koch, M.A.; Pecinka, A.; Schubert, I. Chromosome triplication found across the tribe Brassiceae. Genome Res. 2005, 15, 516–525. [Google Scholar] [CrossRef] [Green Version]
  61. Huang, H.; Song, J.; Feng, Y.; Zheng, L.; Chen, Y.; Luo, K. Genome-Wide Identification and Expression Analysis of the SHI-Related Sequence Family in Cassava. Genes 2023, 14, 870. [Google Scholar] [CrossRef] [PubMed]
  62. Maire, P.; Wuarin, J.; Schibler, U. The role of cis-acting promoter elements in tissue-specific albumin gene expression. Science 1989, 244, 343–346. [Google Scholar] [CrossRef] [PubMed]
  63. Otsuki, A.; Yamamoto, M. Cis-element architecture of Nrf2-sMaf heterodimer binding sites and its relation to diseases. Arch. Pharm. Res. 2020, 43, 275–285. [Google Scholar] [CrossRef] [PubMed]
  64. Oudelaar, A.M.; Higgs, D.R. The relationship between genome structure and function. Nat. Rev. Genet. 2021, 22, 154–168. [Google Scholar] [CrossRef] [PubMed]
  65. Yuan, T.T.; Xu, H.H.; Li, J.; Lu, Y.T. Auxin abolishes SHI-RELATED SEQUENCE5-mediated inhibition of lateral root development in Arabidopsis. New Phytol. 2020, 225, 297–309. [Google Scholar] [CrossRef] [Green Version]
  66. Lütken, H.; Jensen, L.S.; Topp, S.H.; Mibus, H.; Müller, R.; Rasmussen, S.K. Production of compact plants by overexpression of AtSHI in the ornamental Kalanchoë. Plant Biotechnol. J. 2010, 8, 211–222. [Google Scholar] [CrossRef] [Green Version]
Figure 1. The pipeline for BnSRS gene family analysis.
Genes 14 01421 g001
Figure 2. A phylogenetic tree was constructed using the ML method to analyze the relationship between SRS genes. The BnSRS genes were found to be clustered into four distinct subgroups, distinguishable by different colors in the tree.
Genes 14 01421 g002
Figure 3. The distribution and collinearity of the BnSRS genes. Different color represents different subgroups, the red lines indicated the duplicated gene pairs of BnSRS.
Genes 14 01421 g003
Figure 4. The phylogenetic tree, conserved motifs, and gene structure for the BnSRS genes. (A) The phylogenetic tree for the BnSRS genes was constructed. (B) The conserved motifs identified in the BnSRS genes. Different color represents different motif. (C) The gene structure of the BnSRS genes. The green, purple, and red box represent the CDS, UTR, and DUF702 domains, respectively. The red box is above the green box, and it covers part of the green box.
Genes 14 01421 g004
Figure 5. The sequence logos of conversed motifs in the BnSRS proteins. Each letter’s height depicts the occurrence frequency of the corresponding base or amino acid residue at that position.
Genes 14 01421 g005
Figure 6. Cis-element analysis of the BnSRS genes. The different color boxes represent different cis-elements.
Genes 14 01421 g006
Figure 7. The expression levels of the BnSRS genes in 32 tissues. The red and blue represent high and low expressions, respectively. DAP represents days after pollination.
Genes 14 01421 g007
Figure 8. The expression pattern of the BnSRS genes under different biotic and abiotic stresses. (A) The number of BnSRS genes simultaneously expressed under different stresses. The ‘de’ represents dehydration and “S.s” represents S. sclerotiorum. The yellow bar represented the number of genes with expression in the tissue, the black dot indicated expression in the corresponding tissues, and the black bar indicated the number of genes expressed in the corresponding tissues. (B) The expression levels of the BnSRS genes under different stresses. The red and blue represent high and low expressions, respectively.
Genes 14 01421 g008
Figure 9. Protein-protein interaction analysis of BnSRS gene family members. (A) The network of protein-protein interaction analysis. The red points represent the BnSRS proteins, the blue points represent the proteins that interacted with the BnSRS proteins, the green lines represent the interactions between the BnSRS proteins, and the grey lines represent the interactions between the BnSRS proteins and the other proteins. (B) The KEGG pathway analysis of the genes encoding the proteins interacted with BnSRS genes.
Genes 14 01421 g009
Figure 10. The association analysis between BnSRR1 and agronomic traits in B. napus. (A) Manhattan plot with protein content, final flowering time (FFT), and thousand seeds weight (TSW). (BD) Phenotypic analysis of different genotypic groups at significant loci for protein content, FFT, and TSW. There were 106 and 203 B. napus accessions in Hap1 and Hap2 populations, respectively.
Genes 14 01421 g010
Disclaimer/Publisher’s Note: The statements, opinions and data contained in all publications are solely those of the individual author(s) and contributor(s) and not of MDPI and/or the editor(s). MDPI and/or the editor(s) disclaim responsibility for any injury to people or property resulting from any ideas, methods, instructions or products referred to in the content.

