
Exposure to Juvenile Stress Induces Epigenetic Alterations in the GABAergic System in Rats

 , , ,
, , ,  and
and 
Abstract
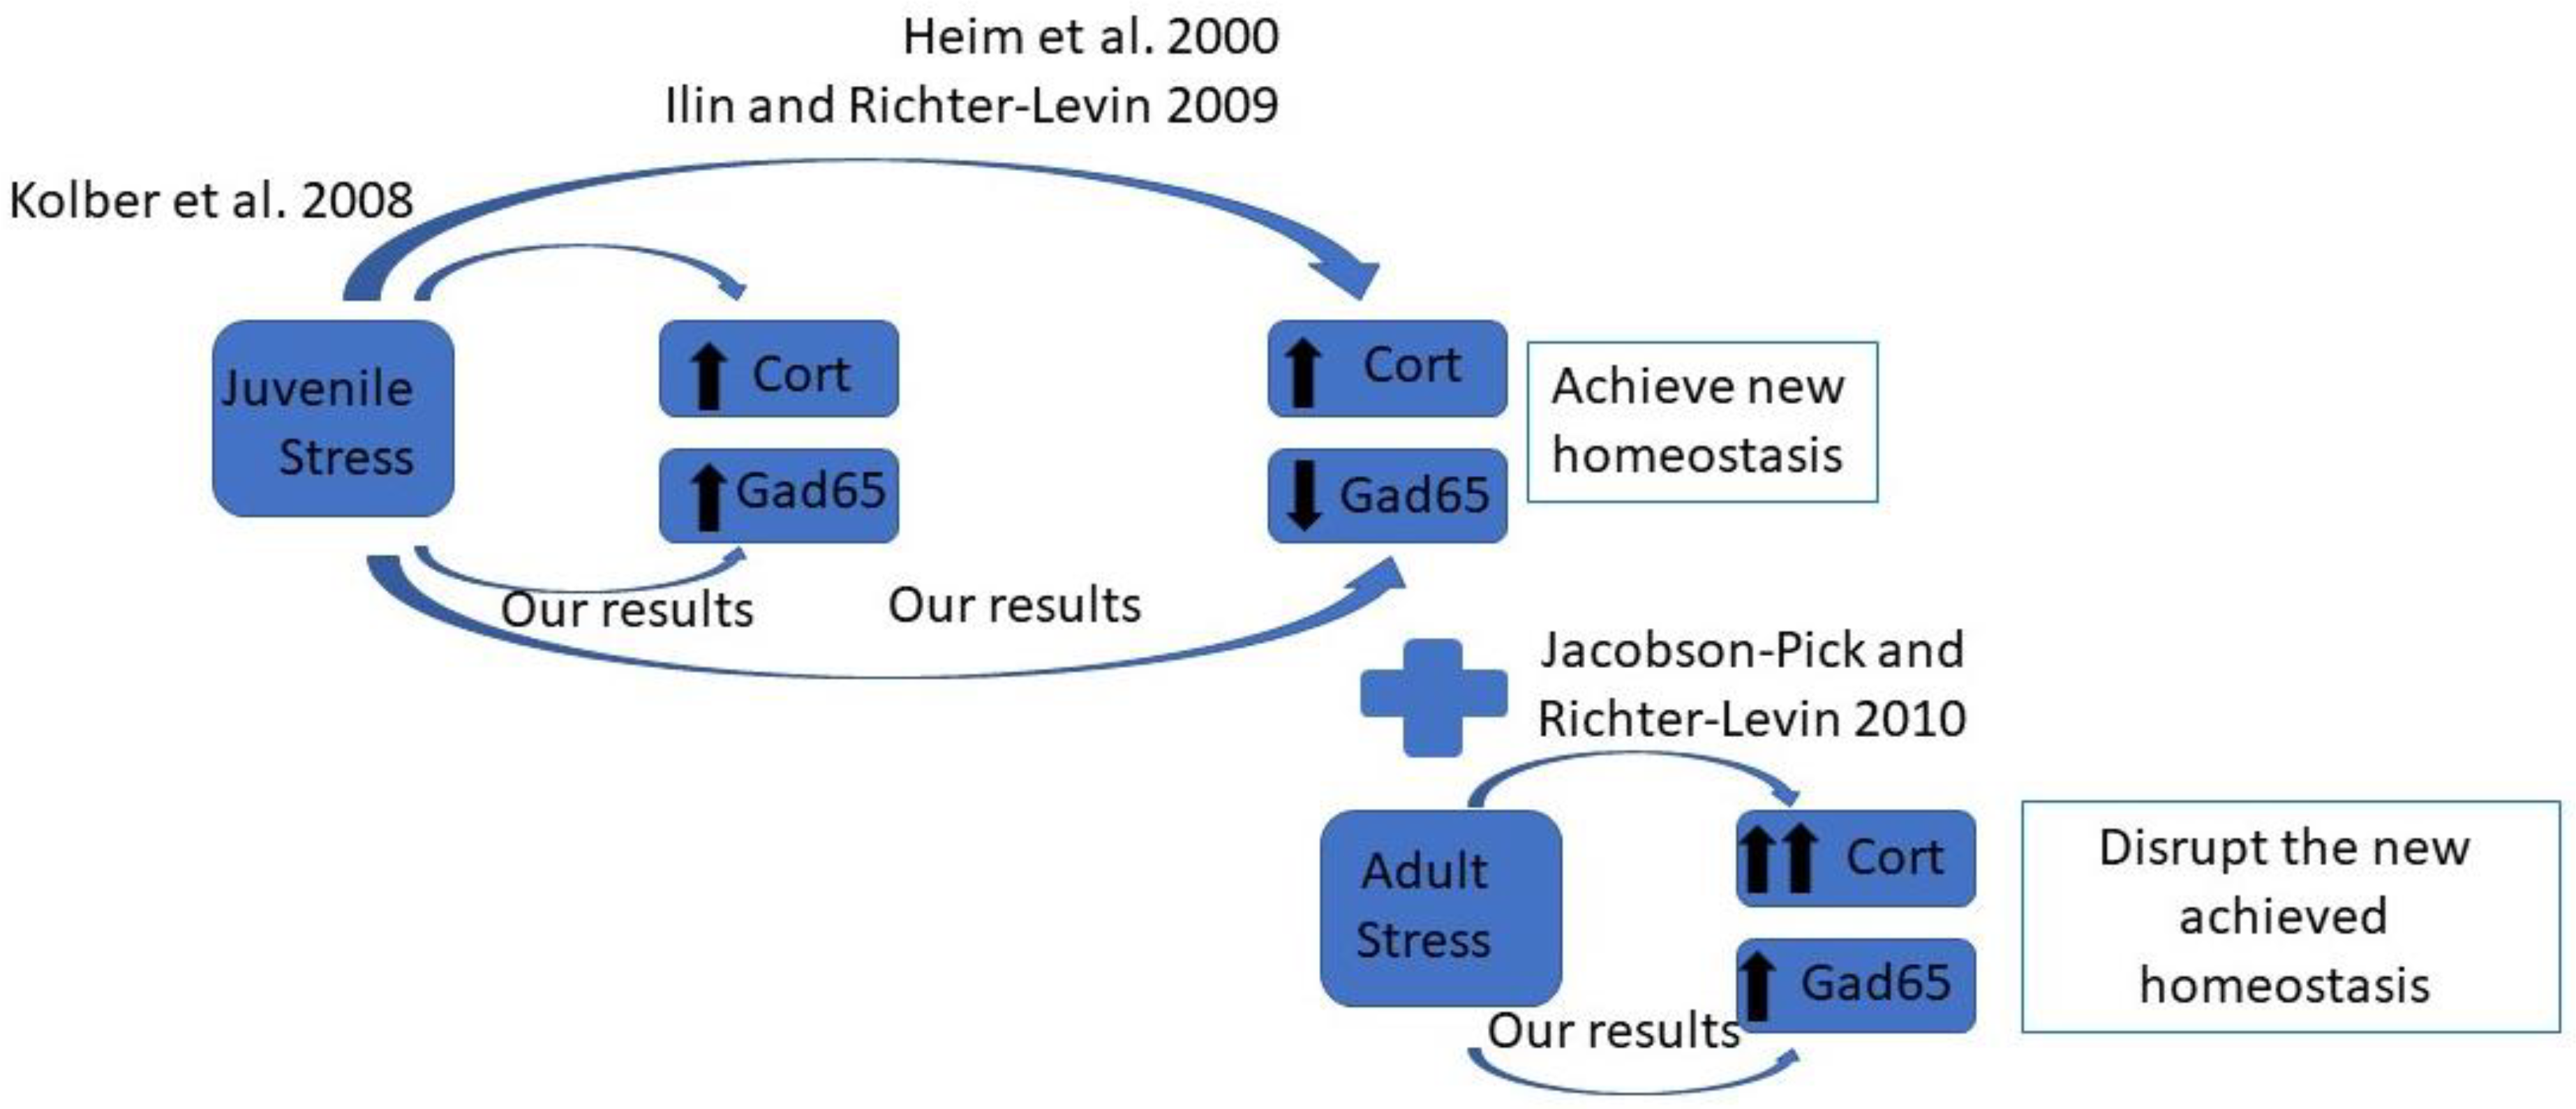
1. Introduction
2. Results
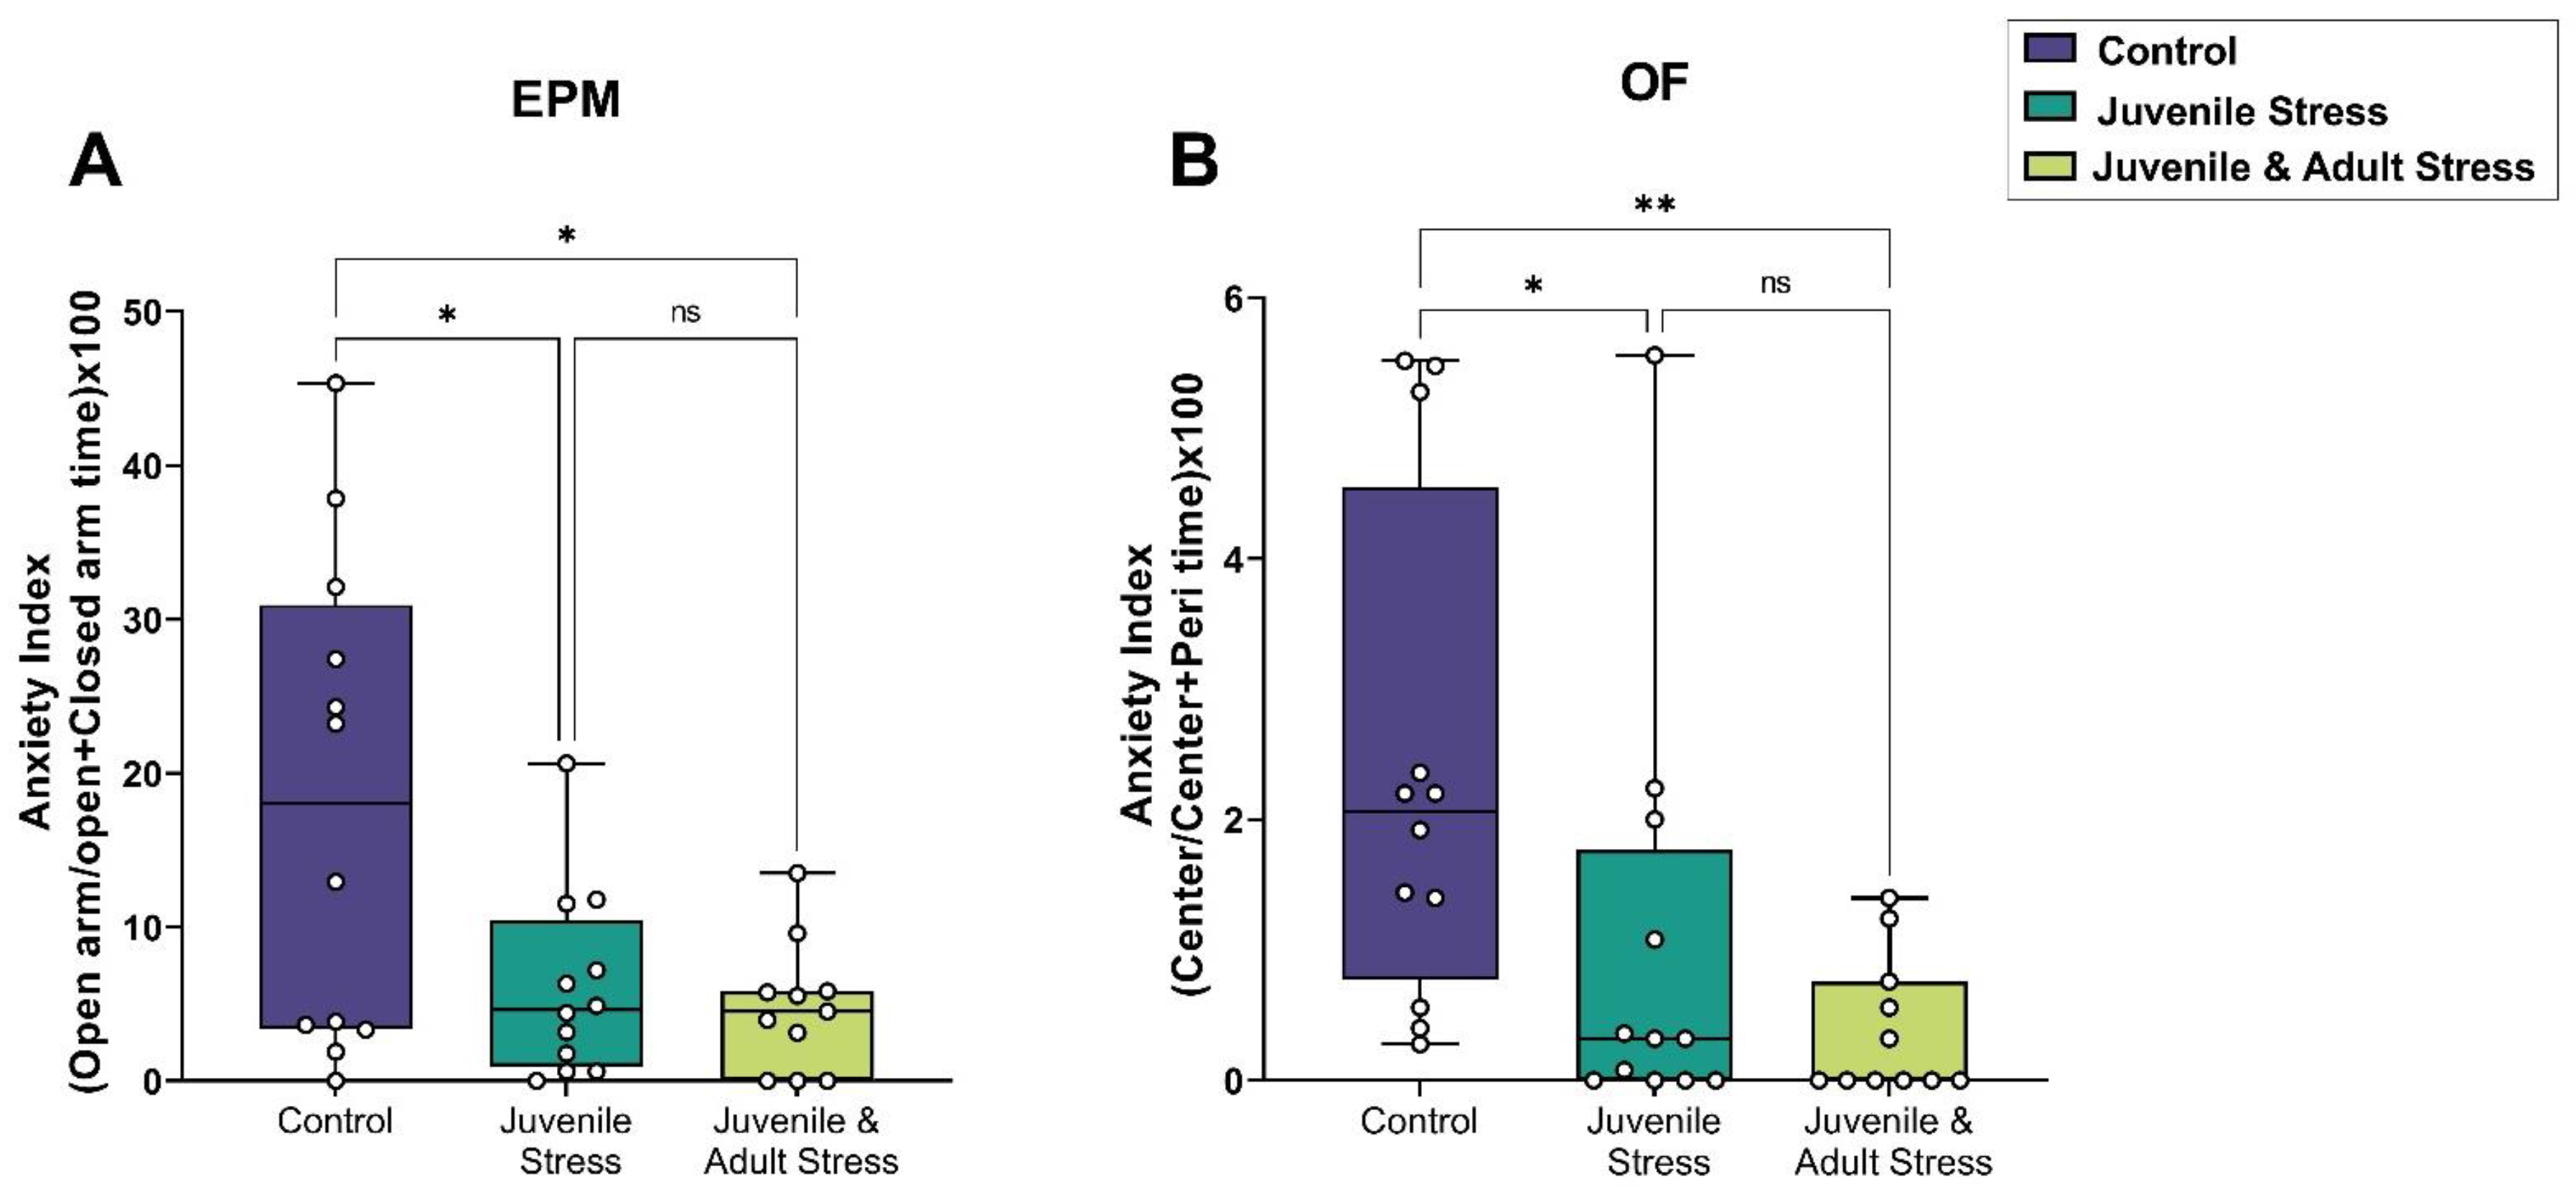
2.1. Behavioral Tests
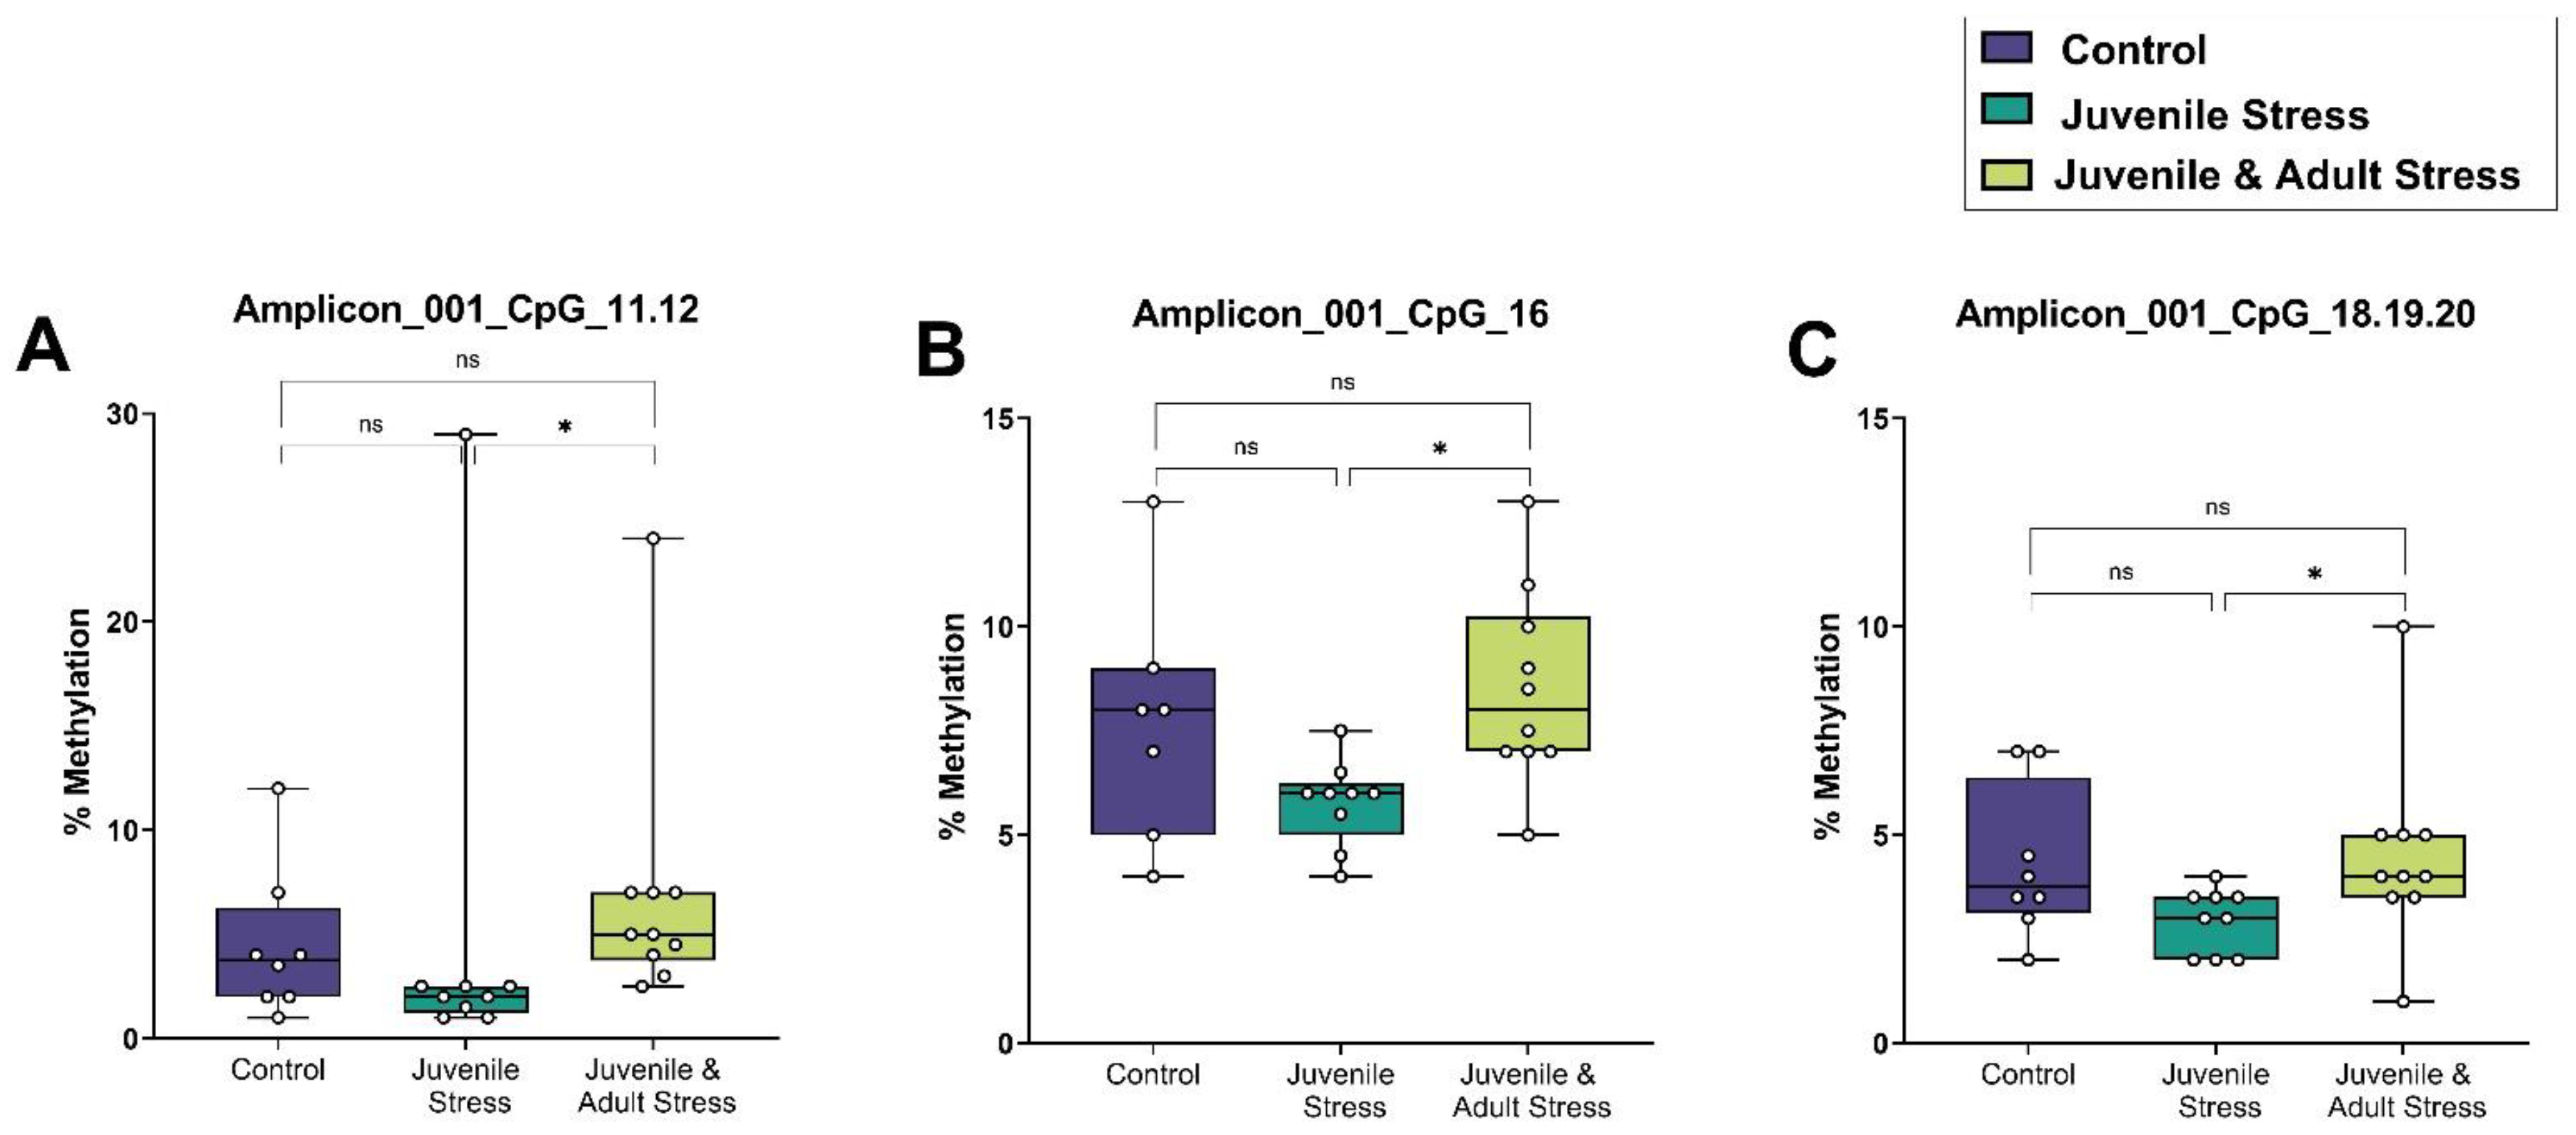
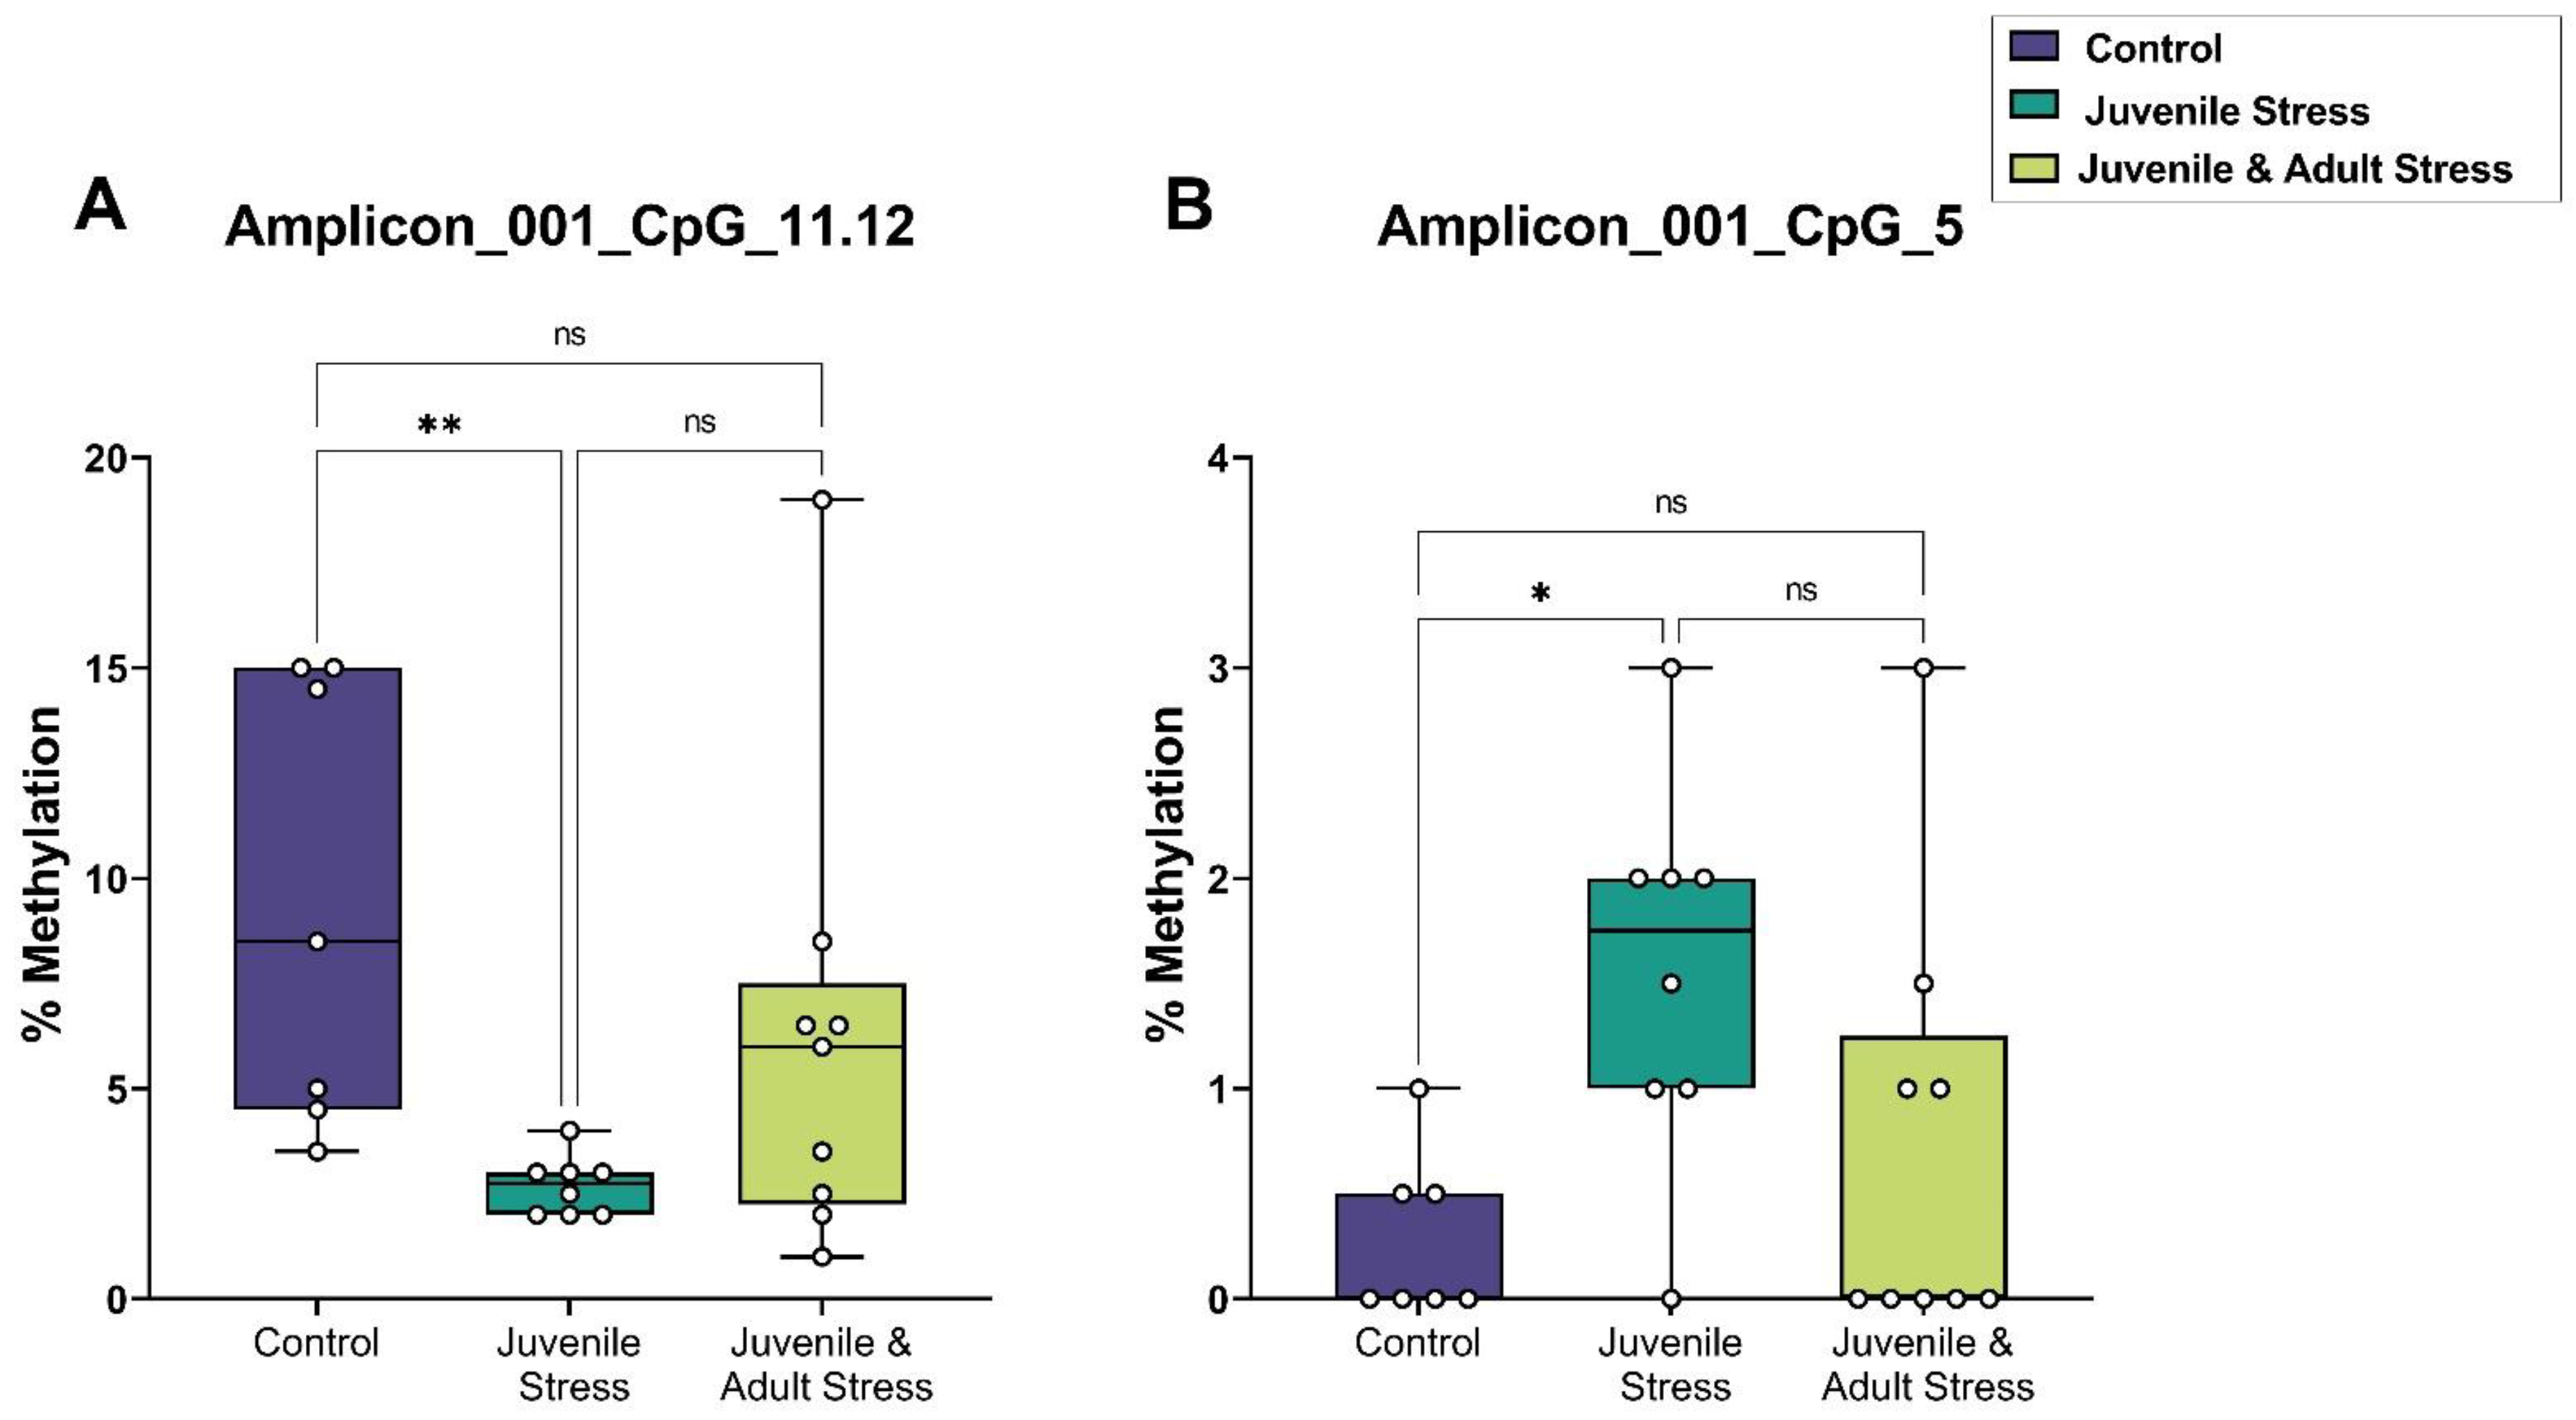
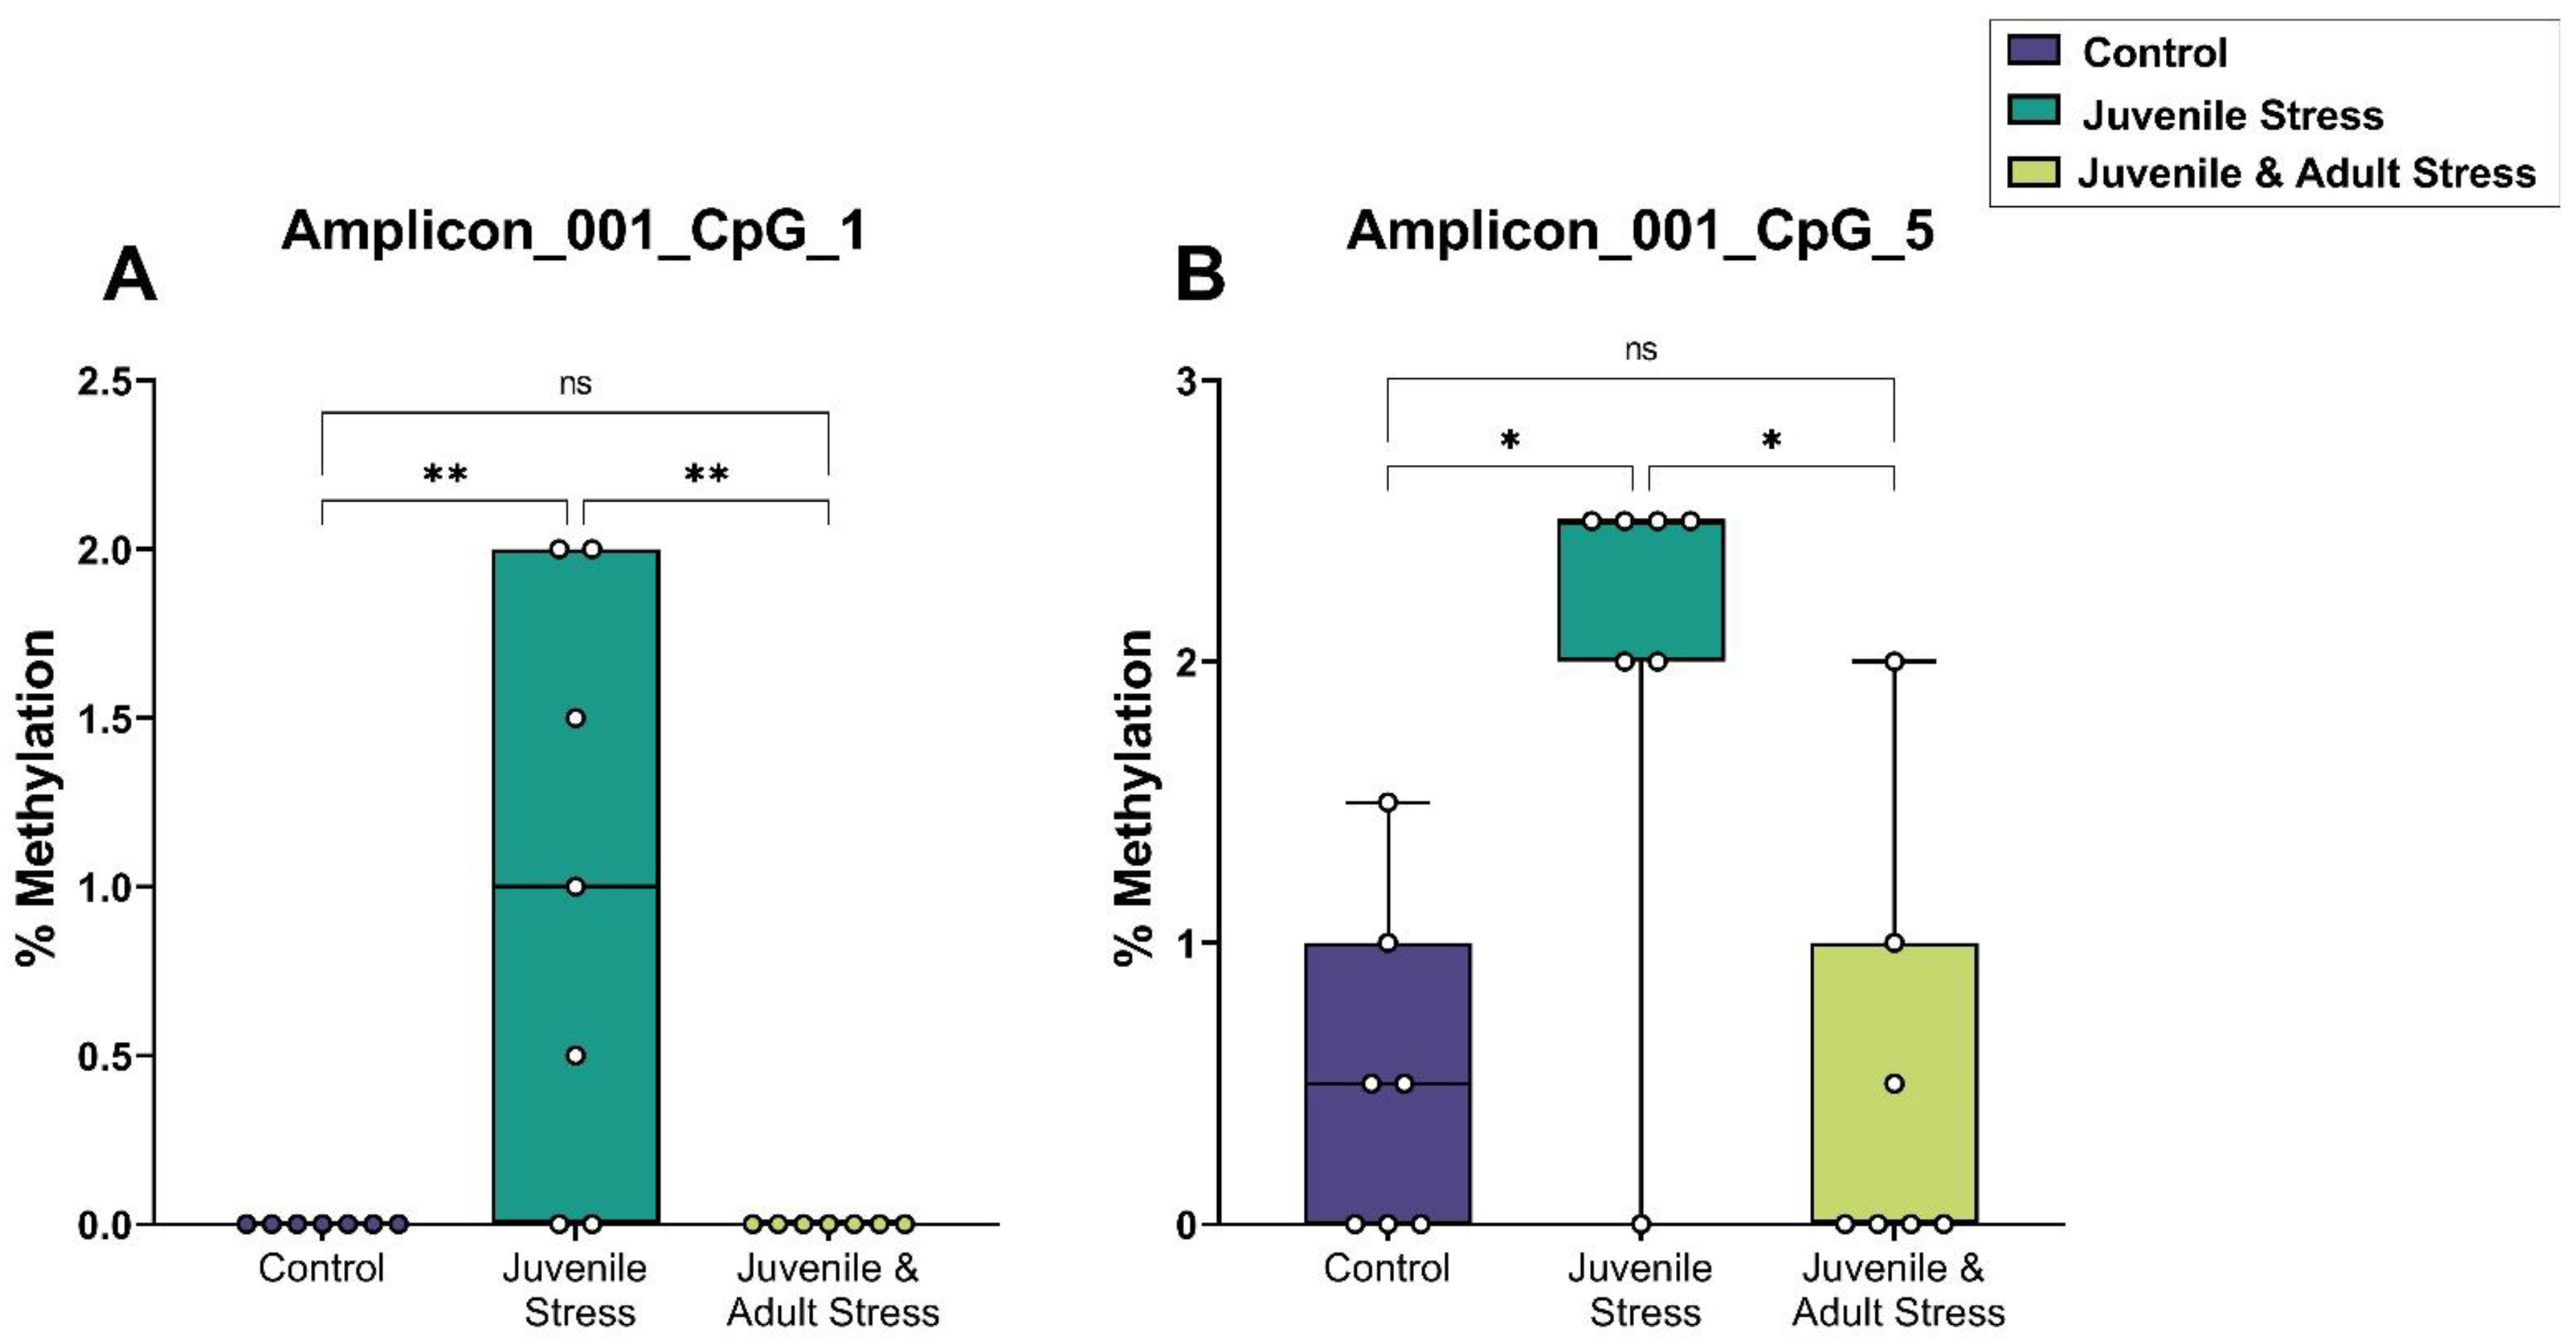
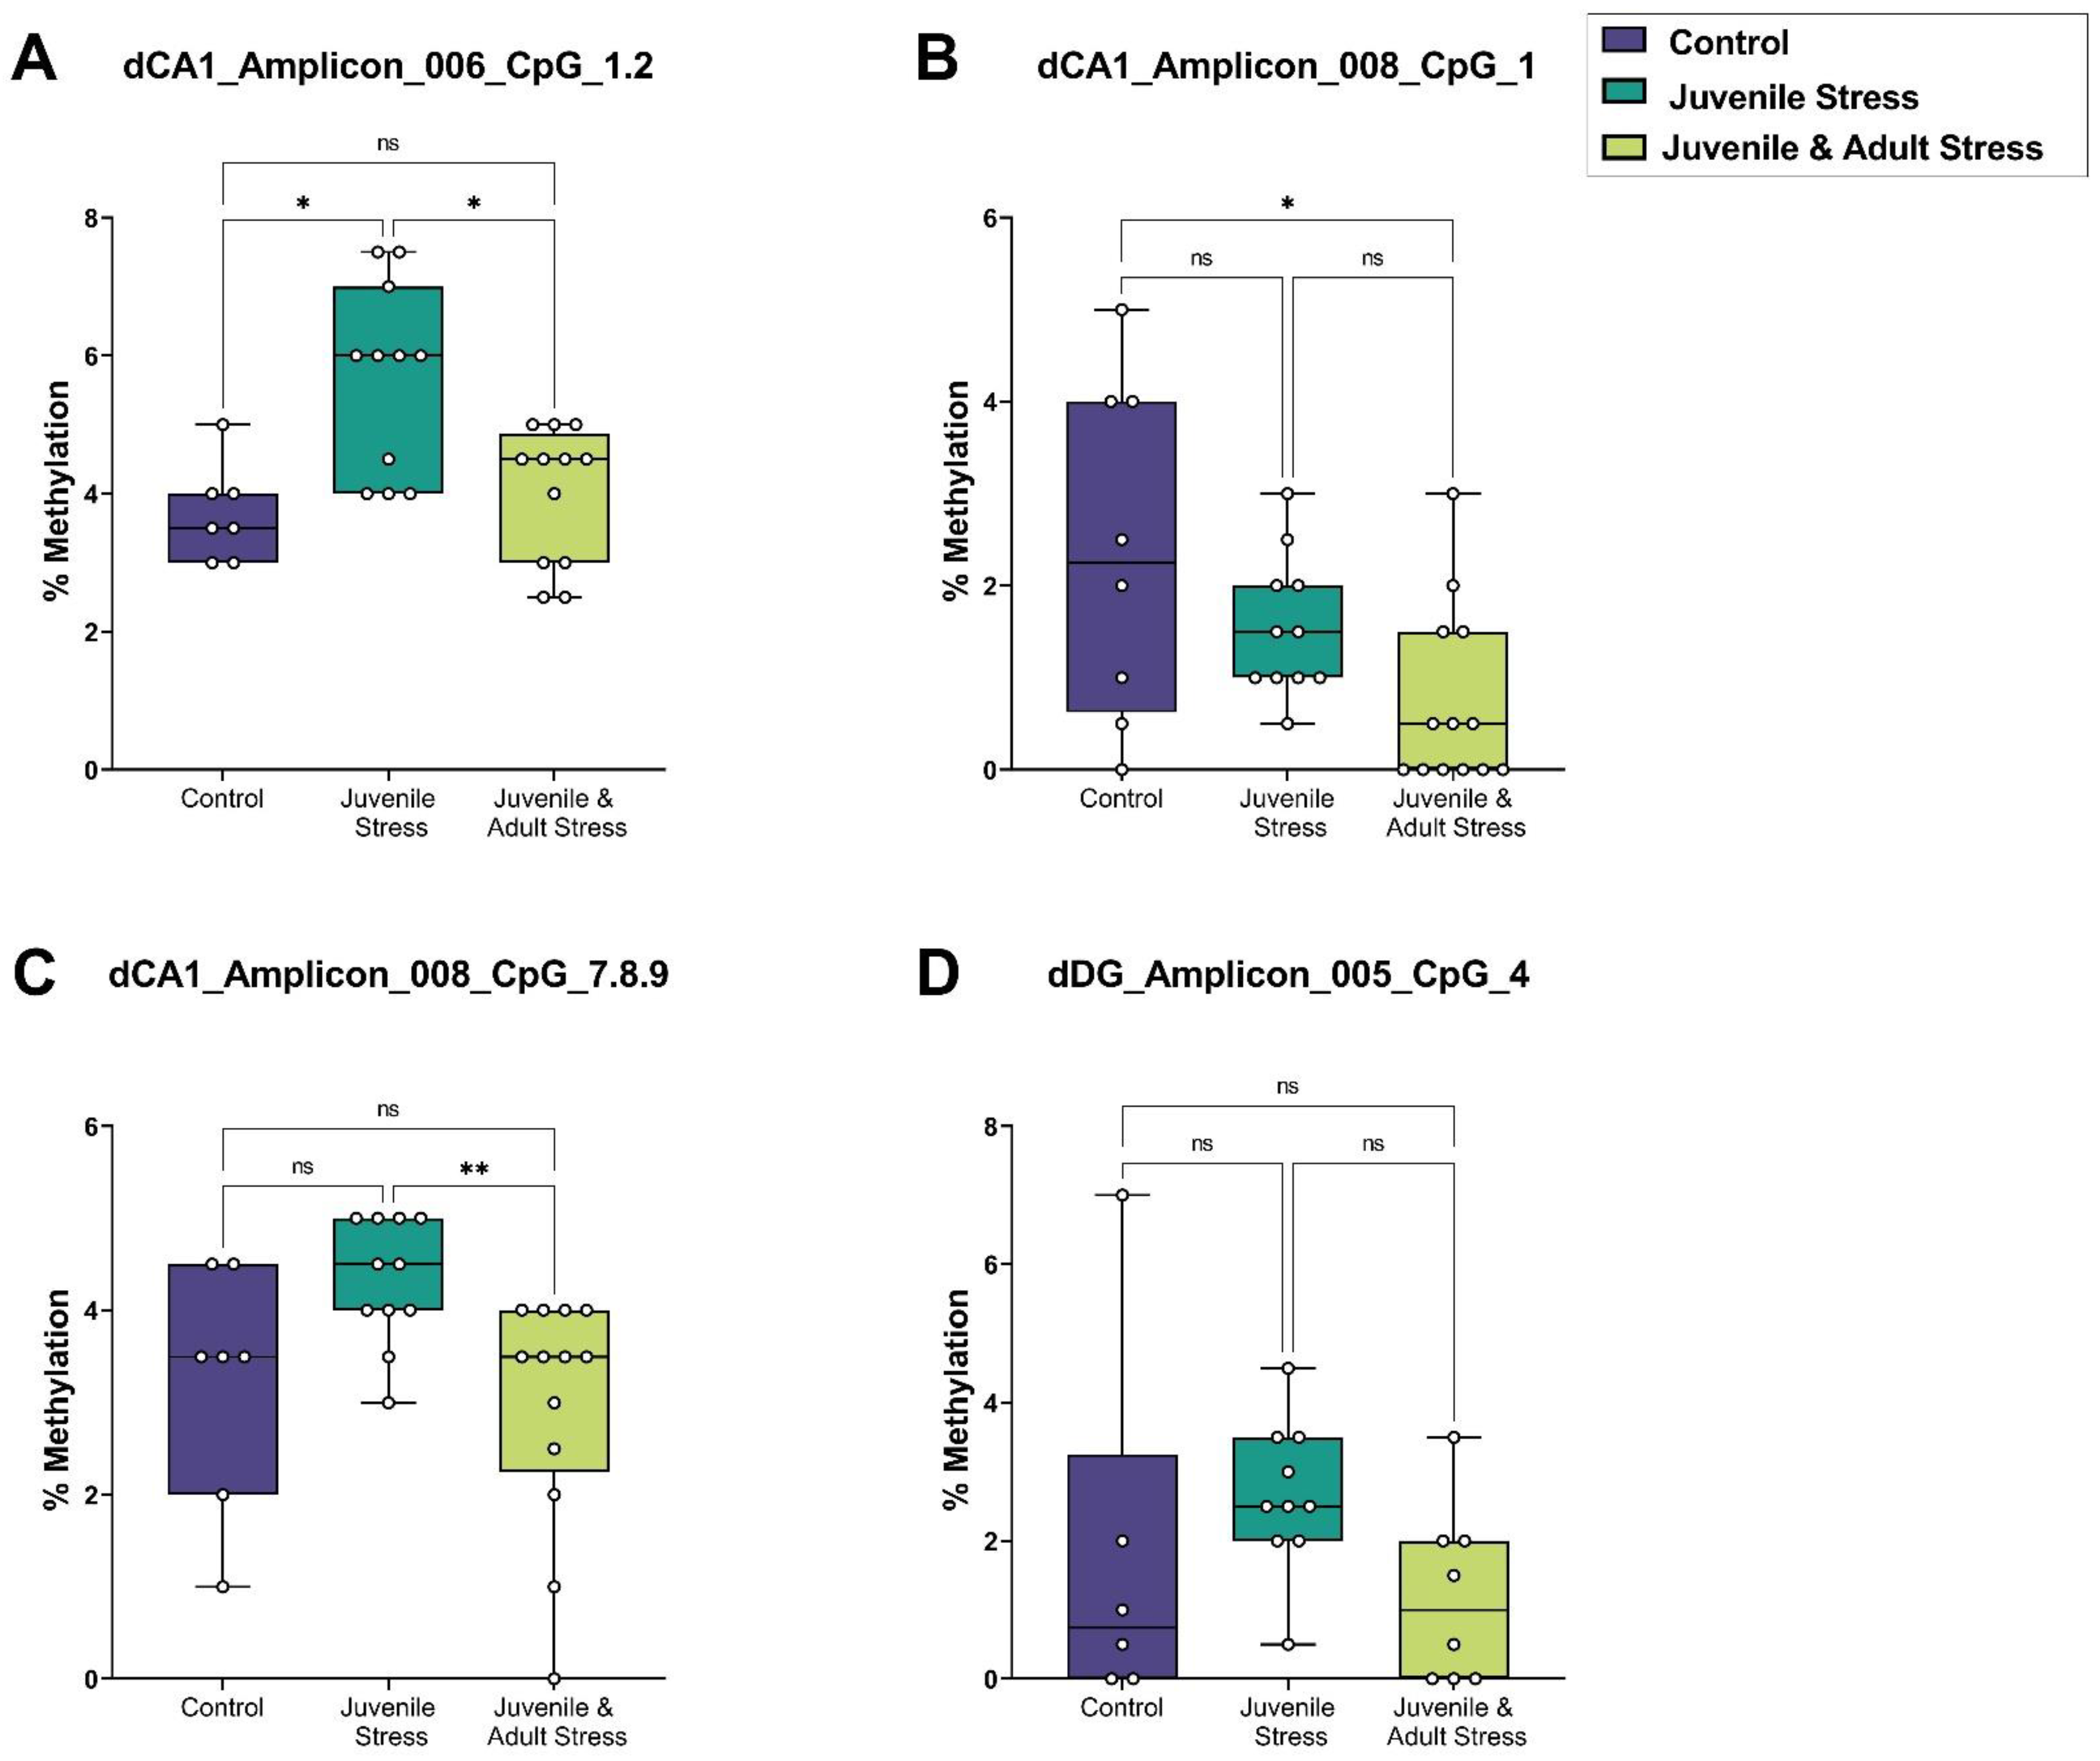
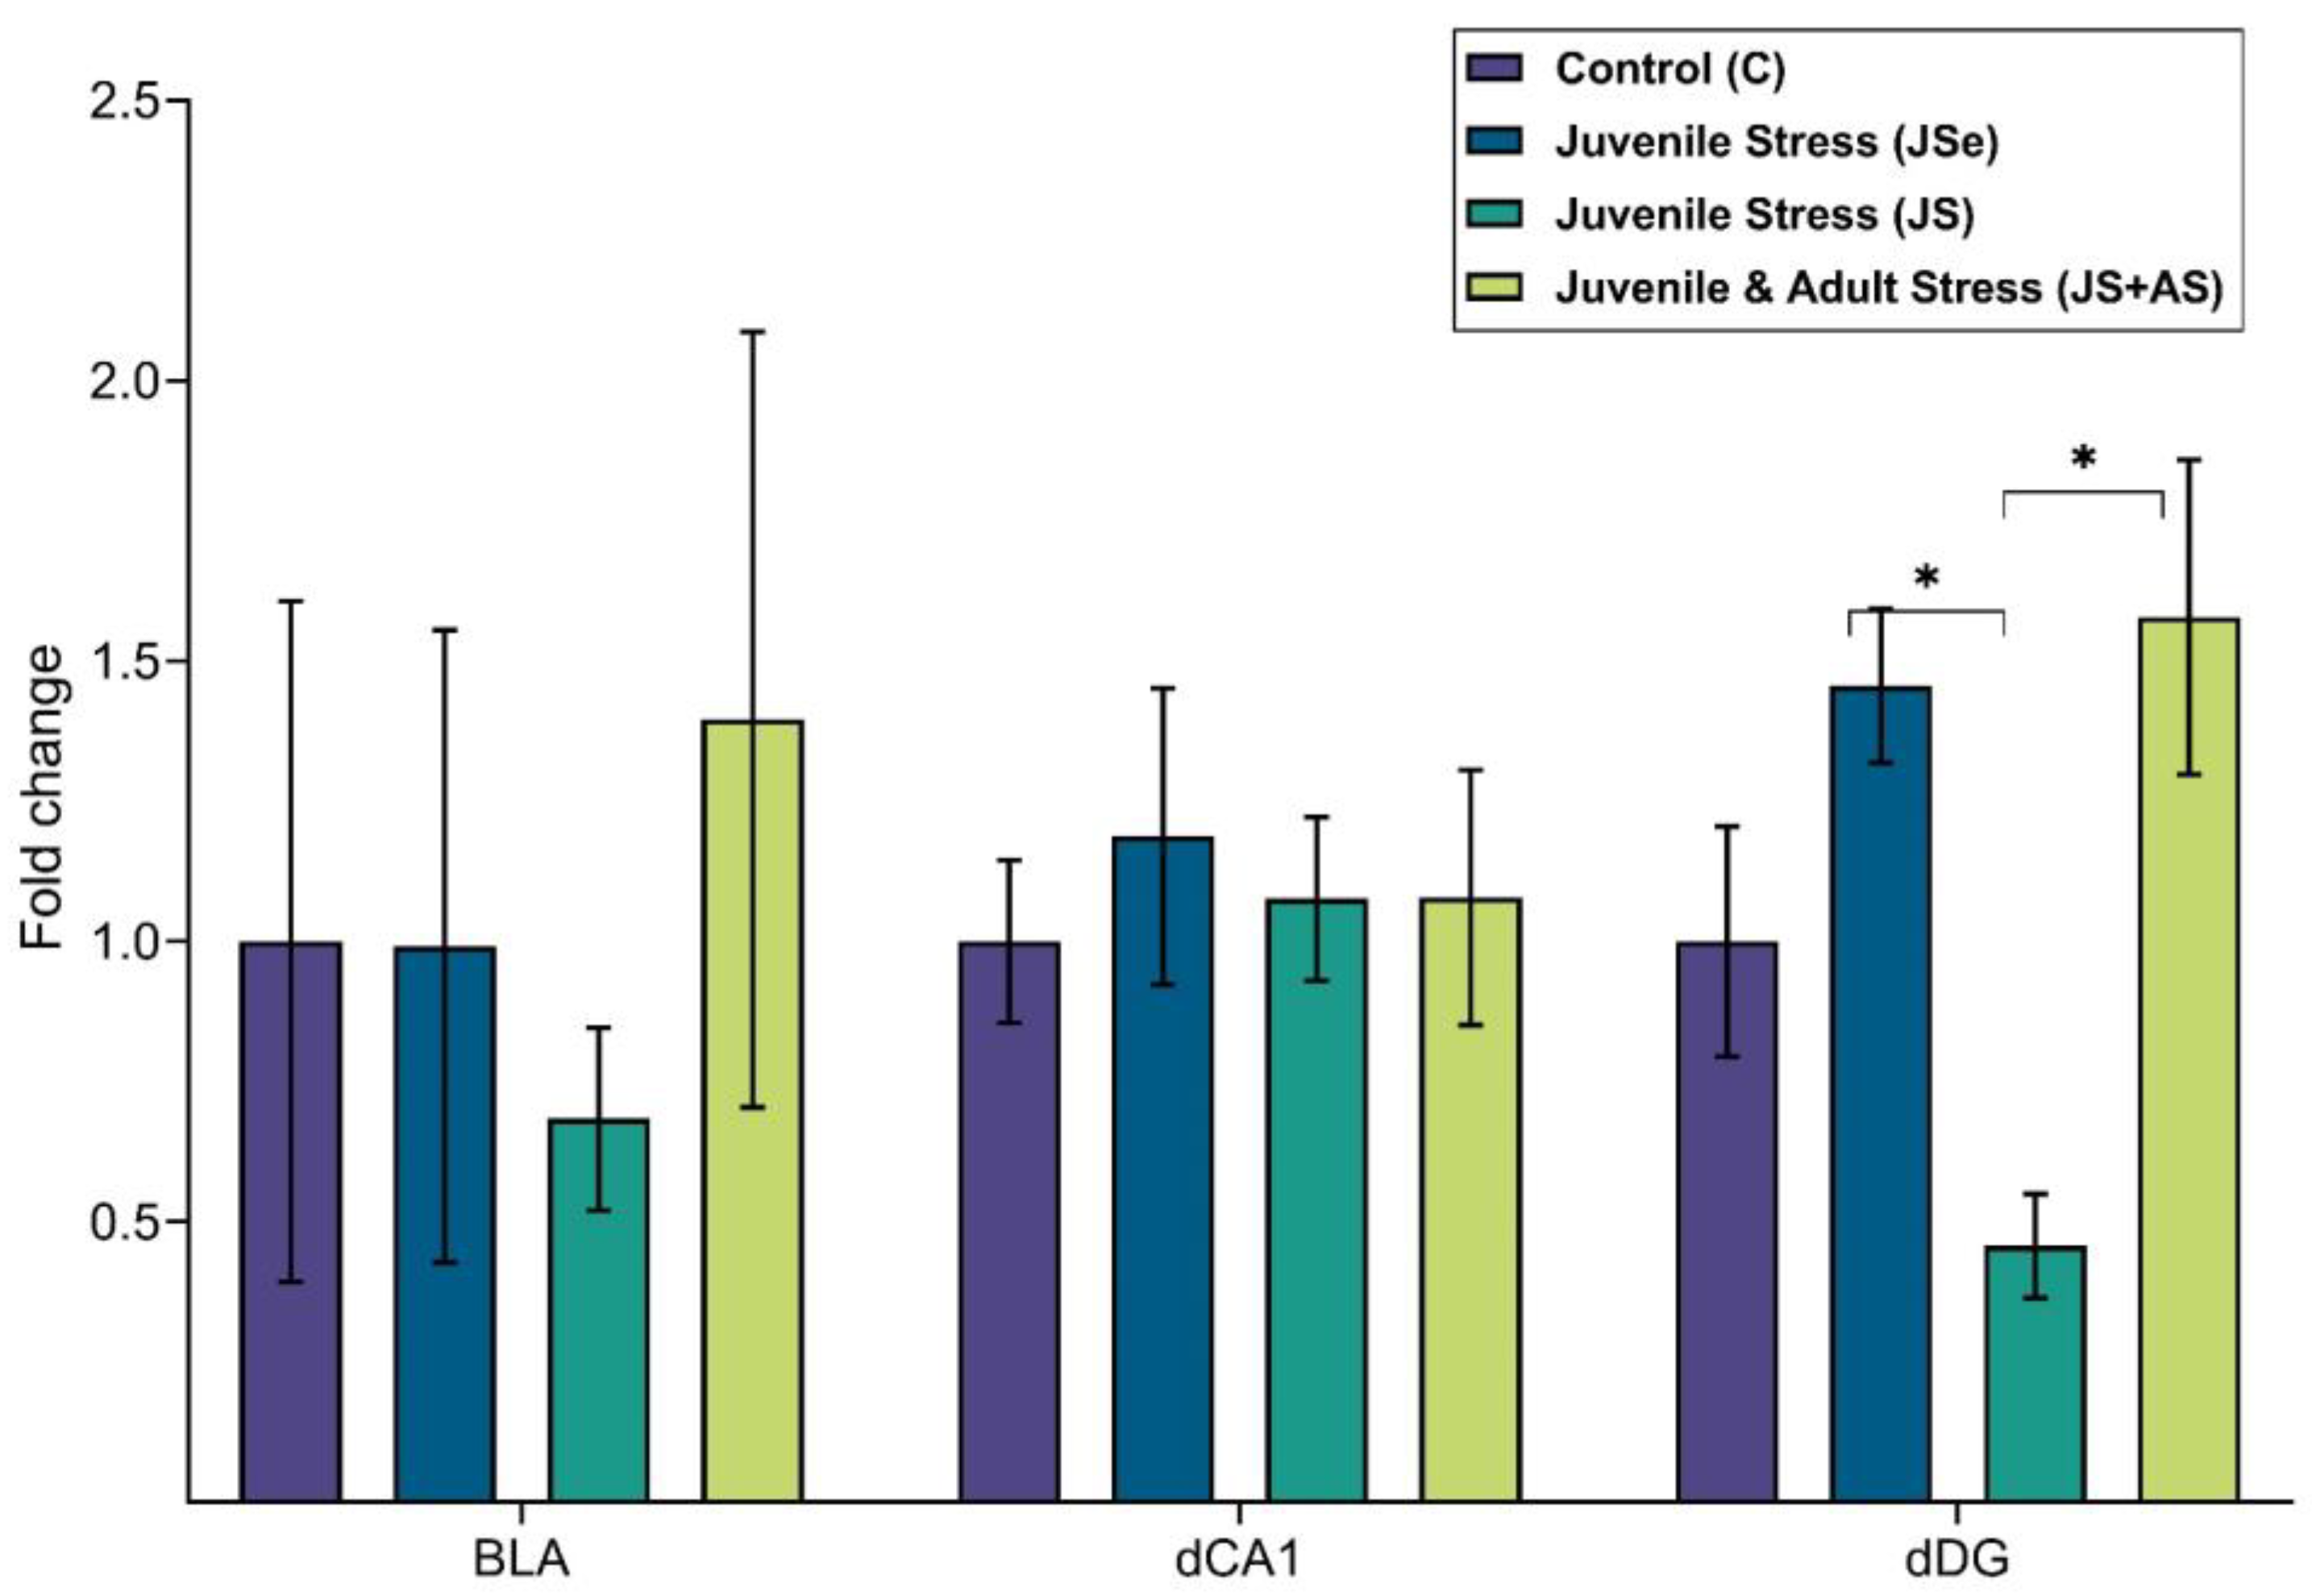
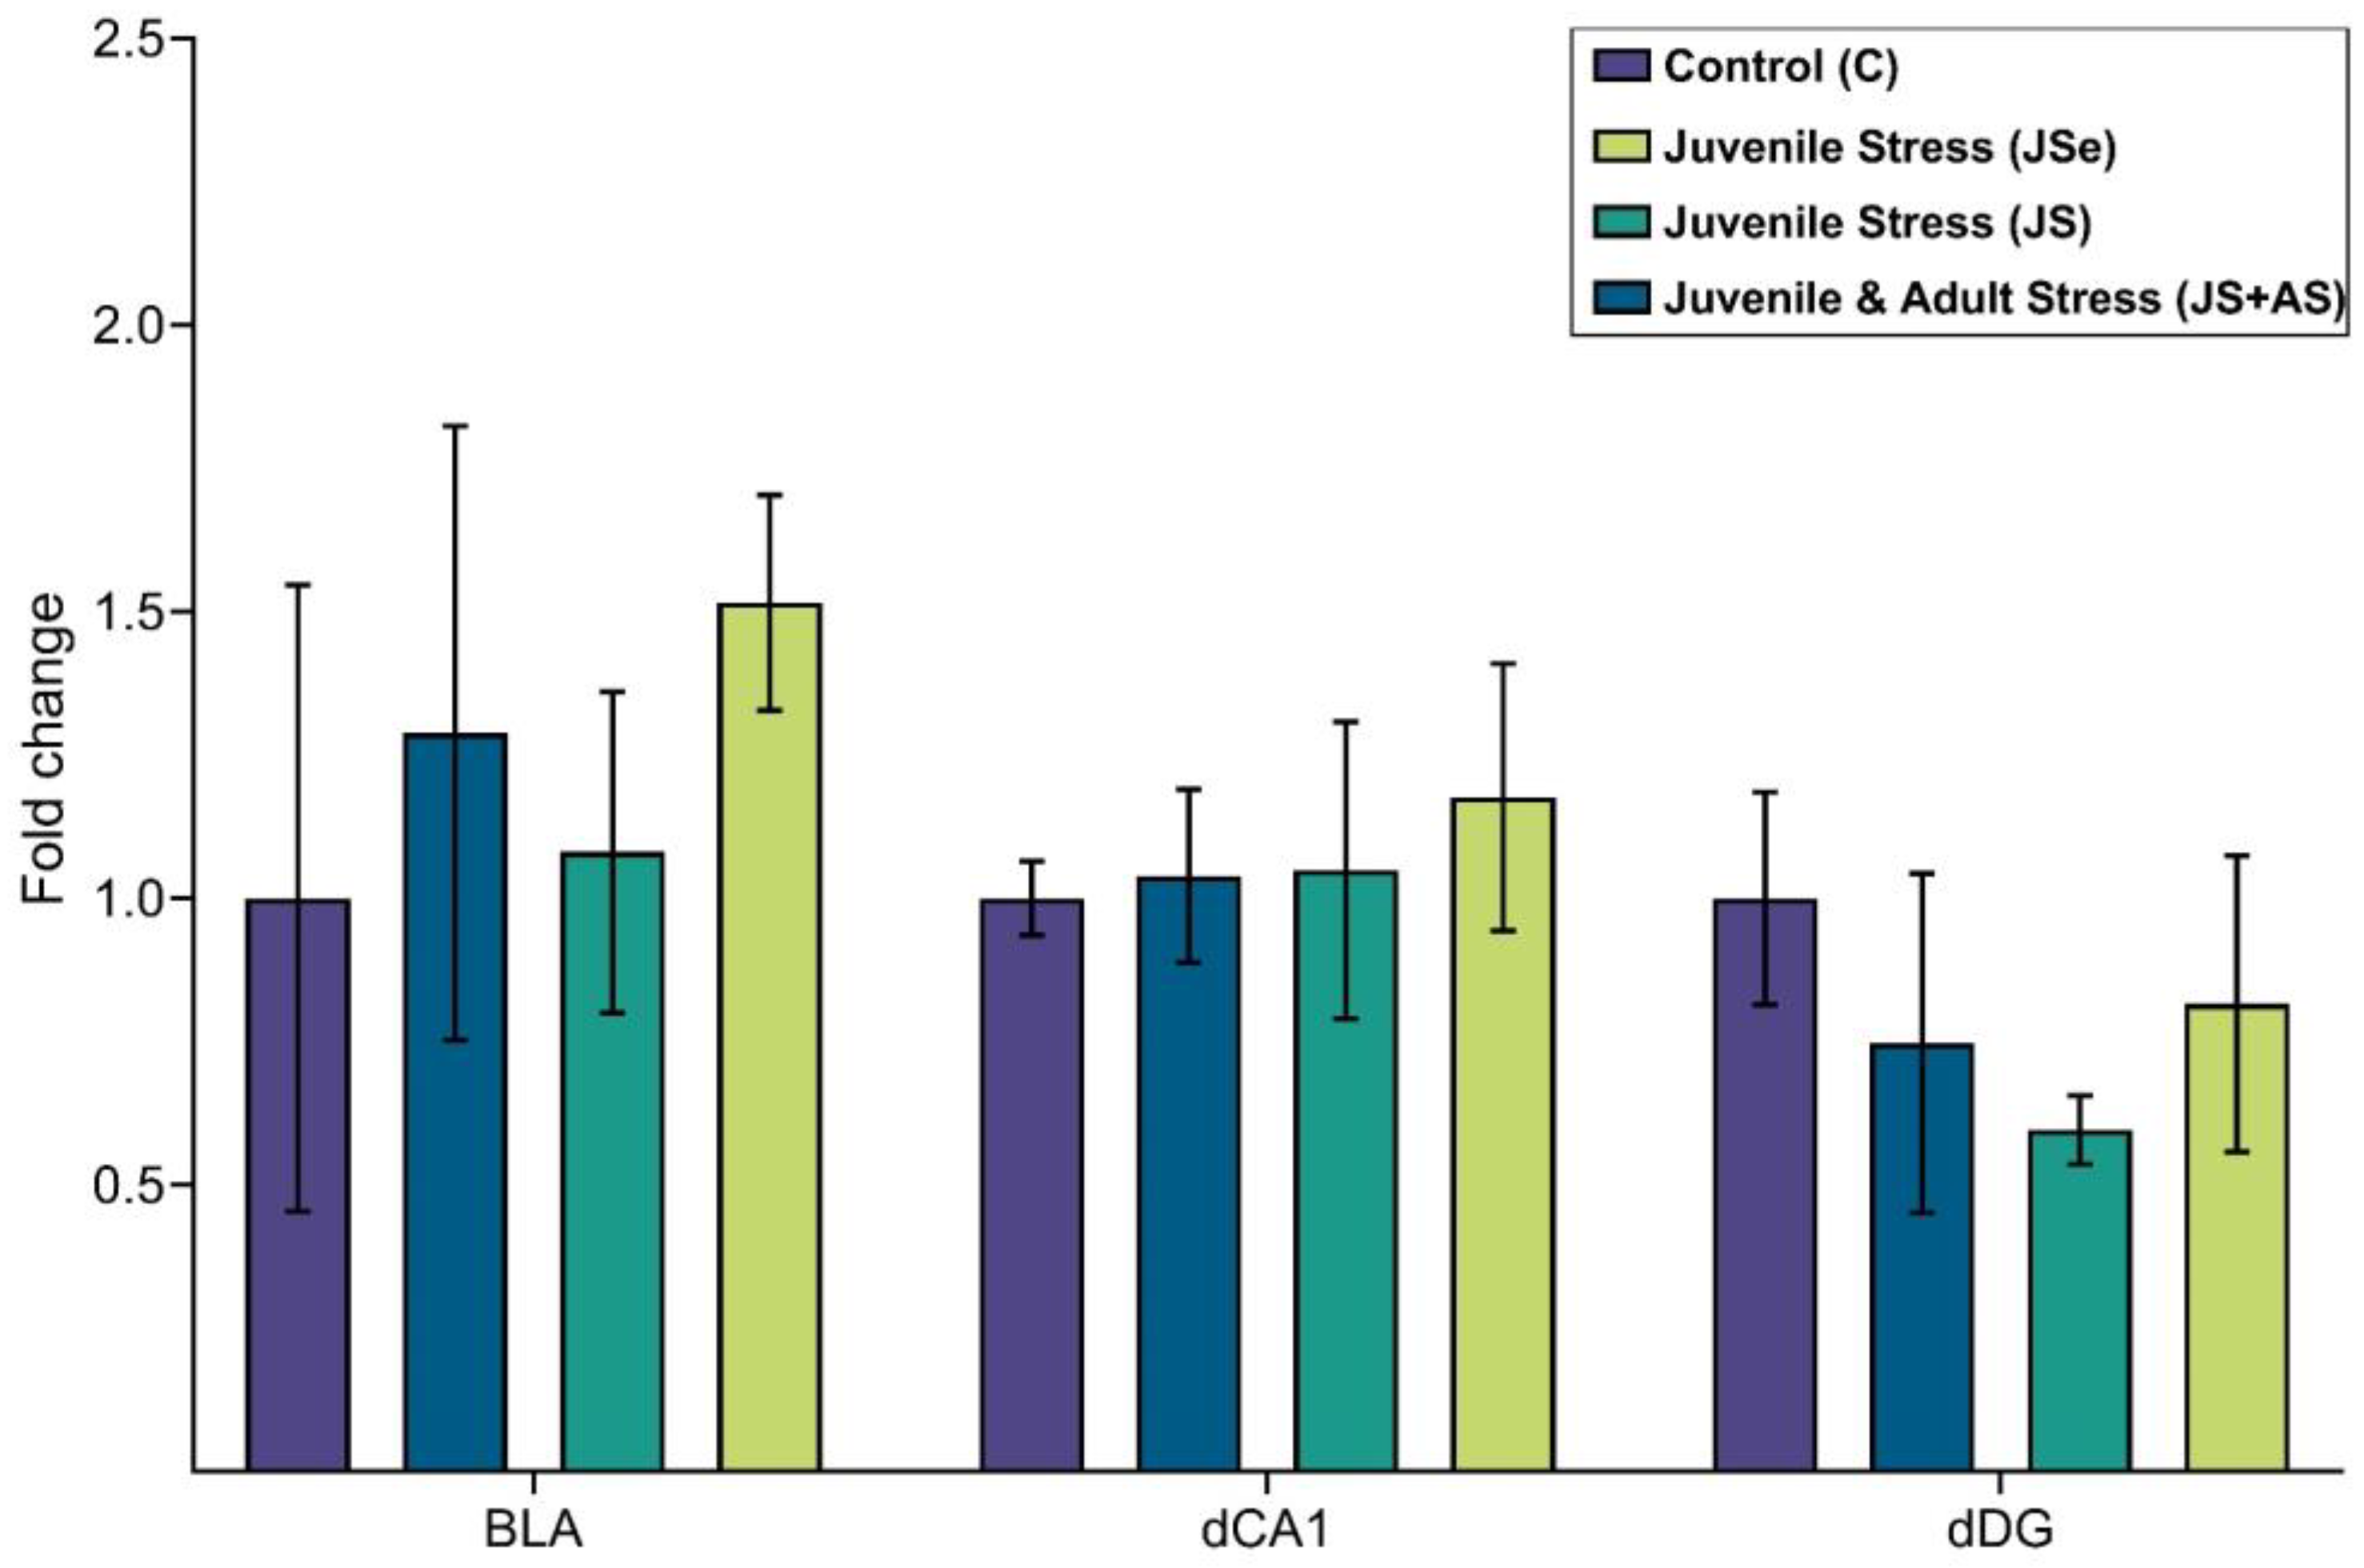
2.2. Sequenom Epityper MassARRAY
3. Discussion
4. Methods
4.1. Animals
4.2. Experimental Groups
4.2.1. Methylation Analysis
4.2.2. Expression Analysis
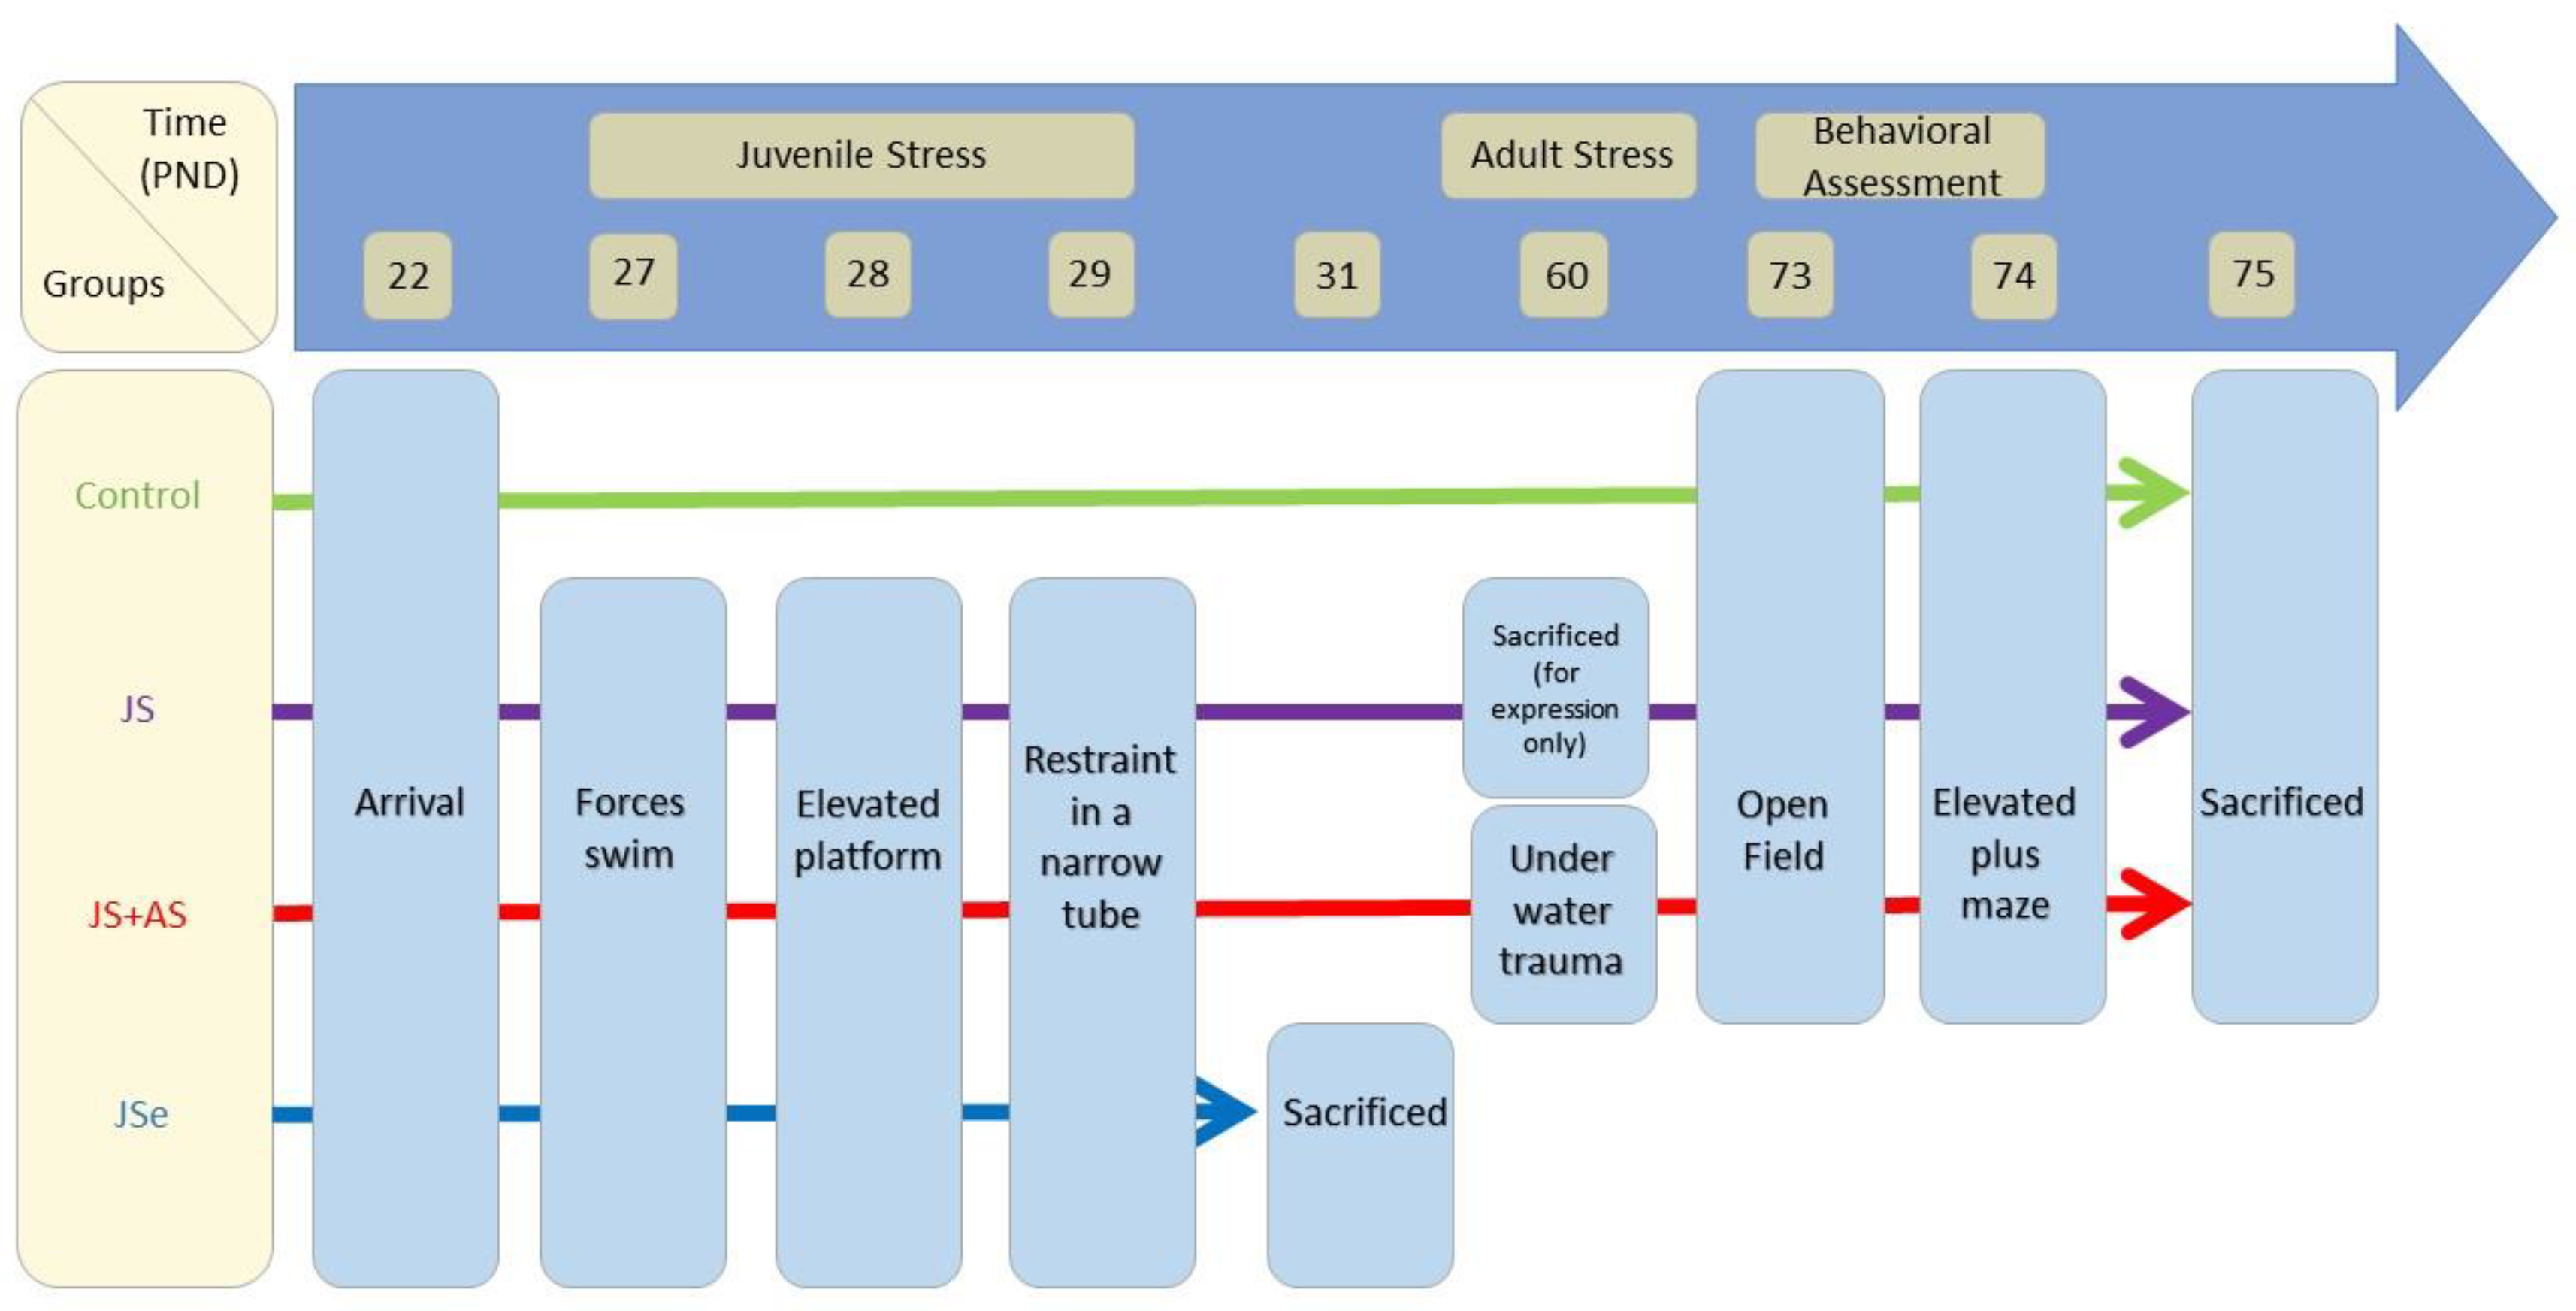
4.3. Stress Protocols and Behavioral Assessments
4.4. Harvesting Brain Tissues
4.5. DNA Extraction
4.6. Bisulfite Treatment
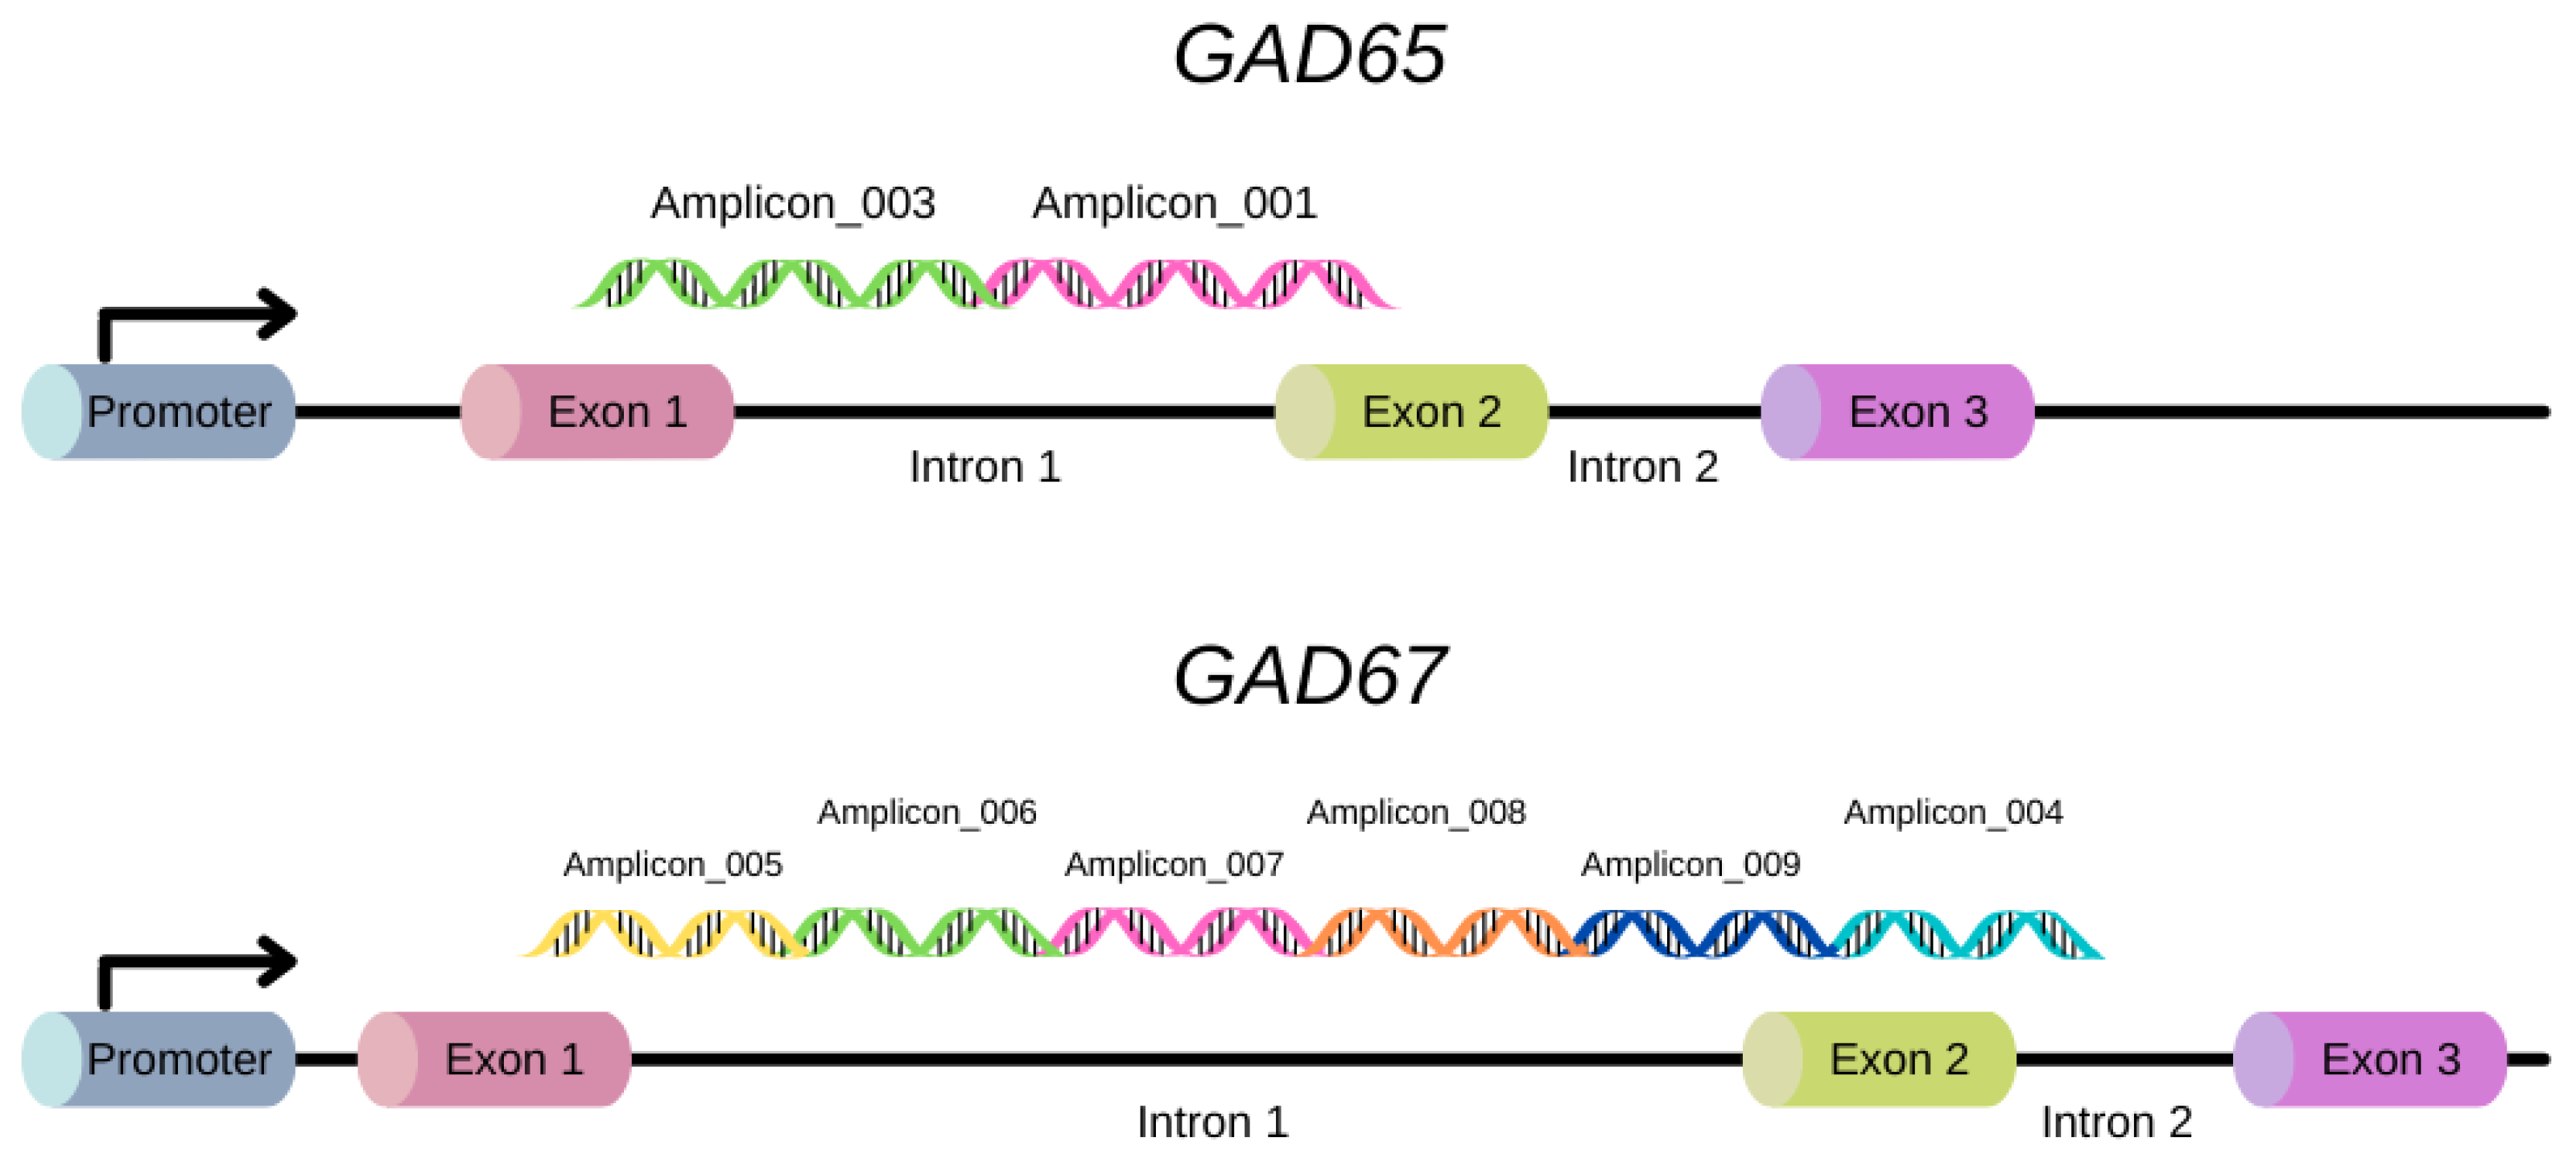
4.7. Amplicon and Primer Selection
4.8. Polymerase Chain Reaction (PCR) Amplification
4.9. Preparation for Sequenom
4.10. Sequenom Epityper MassARRAY Methylation and Spectra Analysis
4.11. RNA Extraction and cDNA Synthesize
4.12. Quantitative RT-PCR
4.13. Statistical Analysis
Supplementary Materials
Author Contributions
Funding
Institutional Review Board Statement
Informed Consent Statement
Data Availability Statement
Conflicts of Interest
References
- Koolhaas, J.M.; Bartolomucci, A.; de Buwalda, B.; de Boer, S.F.; Flügge, G.; Korte, S.M.; Meerlo, P.; Murison, R.; Olivier, B.; Palanza, P. Stress Revisited: A Critical Evaluation of the Stress Concept. Neurosci. Biobehav. Rev. 2011, 35, 1291–1301. [Google Scholar] [CrossRef] [PubMed]
- McEwen, B.S.; Gianaros, P.J. Stress-and Allostasis-Induced Brain Plasticity. Annu. Rev. Med. 2011, 62, 431–445. [Google Scholar] [CrossRef] [PubMed]
- Jacobson, L.; Sapolsky, R. The Role of the Hippocampus in Feedback Regulation of the Hypothalamic-Pituitary-Adrenocortical Axis. Endocr. Rev. 1991, 12, 118–134. [Google Scholar] [CrossRef] [PubMed]
- Myers, B.; McKlveen, J.M.; Herman, J.P. Glucocorticoid Actions on Synapses, Circuits, and Behavior: Implications for the Energetics of Stress. Front. Neuroendocrinol. 2014, 35, 180–196. [Google Scholar] [CrossRef] [PubMed]
- Lydiard, R.B. The Role of GABA in Anxiety Disorders. J. Clin. Psychiatry 2003, 64, 21–27. [Google Scholar]
- Kash, S.F.; Johnson, R.S.; Tecott, L.H.; Noebels, J.L.; Mayfield, R.D.; Hanahan, D.; Baekkeskov, S. Epilepsy in Mice Deficient in the 65-KDa Isoform of Glutamic Acid Decarboxylase. Proc. Natl. Acad. Sci. USA 1997, 94, 14060–14065. [Google Scholar] [CrossRef]
- Kash, S.F.; Tecott, L.H.; Hodge, C.; Baekkeskov, S. Increased Anxiety and Altered Responses to Anxiolytics in Mice Deficient in the 65-KDa Isoform of Glutamic Acid Decarboxylase. Proc. Natl. Acad. Sci. USA 1999, 96, 1698–1703. [Google Scholar] [CrossRef]
- Laprade, N.; Soghomonian, J.J. MK-801 Decreases Striatal and Cortical GAD65 MRNA Levels. Neuroreport 1995, 6, 1885–1889. [Google Scholar] [CrossRef]
- Hanno-Iijima, Y.; Tanaka, M.; Iijima, T. Activity-Dependent Bidirectional Regulation of GAD Expression in a Homeostatic Fashion Is Mediated by BDNF-Dependent and Independent Pathways. PLoS ONE 2015, 10, e0134296. [Google Scholar] [CrossRef]
- Castren, E.; Zafra, F.; Thoenen, H.; Lindholm, D. Light Regulates Expression of Brain-Derived Neurotrophic Factor MRNA in Rat Visual Cortex. Proc. Natl. Acad. Sci. USA 1992, 89, 9444–9448. [Google Scholar] [CrossRef]
- Zafra, F.; Lindholm, D.; Castren, E.; Hartikka, J.; Thoenen, H. Regulation of Brain-Derived Neurotrophic Factor and Nerve Growth Factor MRNA in Primary Cultures of Hippocampal Neurons and Astrocytes. J. Neurosci. 1992, 12, 4793–4799. [Google Scholar] [CrossRef]
- Sánchez-Huertas, C.; Rico, B. CREB-Dependent Regulation of GAD65 Transcription by BDNF/TrkB in Cortical Interneurons. Cerebral. Cortex 2011, 21, 777–788. [Google Scholar] [CrossRef]
- Almeida-Suhett, C.P.; Prager, E.M.; Pidoplichko, V.; Figueiredo, T.H.; Marini, A.M.; Li, Z.; Eiden, L.E.; Braga, M.F.M. Reduced GABAergic Inhibition in the Basolateral Amygdala and the Development of Anxiety-like Behaviors after Mild Traumatic Brain Injury. PLoS ONE 2014, 9, e102627. [Google Scholar] [CrossRef]
- Gilabert-Juan, J.; Castillo-Gomez, E.; Pérez-Rando, M.; Moltó, M.D.; Nacher, J. Chronic Stress Induces Changes in the Structure of Interneurons and in the Expression of Molecules Related to Neuronal Structural Plasticity and Inhibitory Neurotransmission in the Amygdala of Adult Mice. Exp. Neurol. 2011, 232, 33–40. [Google Scholar] [CrossRef]
- Hadad-Ophir, O.; Albrecht, A.; Stork, O.; Richter-Levin, G. Amygdala Activation and GABAergic Gene Expression in Hippocampal Sub-Regions at the Interplay of Stress and Spatial Learning. Front. Behav. Neurosci. 2014, 8, 3. [Google Scholar] [CrossRef]
- Lange, M.D.; Jüngling, K.; Paulukat, L.; Vieler, M.; Gaburro, S.; Sosulina, L.; Blaesse, P.; Sreepathi, H.K.; Ferraguti, F.; Pape, H.-C. Glutamic Acid Decarboxylase 65: A Link between GABAergic Synaptic Plasticity in the Lateral Amygdala and Conditioned Fear Generalization. Neuropsychopharmacology 2014, 39, 2211–2220. [Google Scholar] [CrossRef]
- Lussier, A.L.; Romay-Tallón, R.; Caruncho, H.J.; Kalynchuk, L.E. Altered GABAergic and Glutamatergic Activity within the Rat Hippocampus and Amygdala in Rats Subjected to Repeated Corticosterone Administration but Not Restraint Stress. Neuroscience 2013, 231, 38–48. [Google Scholar] [CrossRef]
- Prager, E.M.; Bergstrom, H.C.; Wynn, G.H.; Braga, M.F.M. The Basolateral Amygdala Γ-aminobutyric Acidergic System in Health and Disease. J. Neurosci. Res. 2016, 94, 548–567. [Google Scholar] [CrossRef]
- Stone, D.J.; Walsh, J.P.; Sebro, R.; Stevens, R.; Pantazopolous, H.; Benes, F.M. Effects of Pre-and Postnatal Corticosterone Exposure on the Rat Hippocampal GABA System. Hippocampus 2001, 11, 492–507. [Google Scholar] [CrossRef]
- Wolff, S.B.E.; Gründemann, J.; Tovote, P.; Krabbe, S.; Jacobson, G.A.; Müller, C.; Herry, C.; Ehrlich, I.; Friedrich, R.W.; Letzkus, J.J. Amygdala Interneuron Subtypes Control Fear Learning through Disinhibition. Nature 2014, 509, 453–458. [Google Scholar] [CrossRef]
- Zhu, C.; Liang, M.; Li, Y.; Feng, X.; Hong, J.; Zhou, R. Involvement of Epigenetic Modifications of GABAergic Interneurons in Basolateral Amygdala in Anxiety-like Phenotype of Prenatally Stressed Mice. Int. J. Neuropsychopharmacol. 2018, 21, 570–581. [Google Scholar] [CrossRef] [PubMed]
- Bowers, G.; Cullinan, W.E.; Herman, J.P. Region-Specific Regulation of Glutamic Acid Decarboxylase (GAD) MRNA Expression in Central Stress Circuits. J. Neurosci. 1998, 18, 5938–5947. [Google Scholar] [CrossRef] [PubMed]
- Albrecht, A.; Müller, I.; Ardi, Z.; Çalışkan, G.; Gruber, D.; Ivens, S.; Segal, M.; Behr, J.; Heinemann, U.; Stork, O. Neurobiological Consequences of Juvenile Stress: A GABAergic Perspective on Risk and Resilience. Neurosci. Biobehav. Rev. 2017, 74, 21–43. [Google Scholar] [CrossRef] [PubMed]
- Nicoglou, A.; Merlin, F. Epigenetics: A Way to Bridge the Gap between Biological Fields. Stud. Hist. Philos. Sci. Part C Stud. Hist. Philos. Biol. Biomed. Sci. 2017, 66, 73–82. [Google Scholar] [CrossRef]
- Cavalli, G.; Heard, E. Advances in Epigenetics Link Genetics to the Environment and Disease. Nature 2019, 571, 489–499. [Google Scholar] [CrossRef]
- Gibney, E.R.; Nolan, C.M. Epigenetics and Gene Expression. Heredity 2010, 105, 4–13. [Google Scholar] [CrossRef]
- Jin, J.; Lian, T.; Gu, C.; Yu, K.; Gao, Y.Q.; Su, X.D. The Effects of Cytosine Methylation on General Transcription Factors. Sci. Rep. 2016, 6, 29119. [Google Scholar] [CrossRef]
- Deaton, A.M.; Bird, A. CpG Islands and the Regulation of Transcription. Genes Dev. 2011, 25, 1010–1022. [Google Scholar] [CrossRef]
- Matosin, N.; Cruceanu, C.; Binder, E.B. Preclinical and Clinical Evidence of DNA Methylation Changes in Response to Trauma and Chronic Stress. Chronic Stress 2017, 1, 2470547017710764. [Google Scholar] [CrossRef]
- Yehuda, R.; Flory, J.D.; Bierer, L.M.; Henn-Haase, C.; Lehrner, A.; Desarnaud, F.; Makotkine, I.; Daskalakis, N.P.; Marmar, C.R.; Meaney, M.J. Lower Methylation of Glucocorticoid Receptor Gene Promoter 1 F in Peripheral Blood of Veterans with Posttraumatic Stress Disorder. Biol. Psychiatry 2015, 77, 356–364. [Google Scholar] [CrossRef]
- Alasaari, J.S.; Lagus, M.; Ollila, H.M.; Toivola, A.; Kivimäki, M.; Vahtera, J.; Kronholm, E.; Härmä, M.; Puttonen, S.; Paunio, T. Environmental Stress Affects DNA Methylation of a CpG Rich Promoter Region of Serotonin Transporter Gene in a Nurse Cohort. PLoS ONE 2012, 7, e45813. [Google Scholar] [CrossRef]
- van der Knaap, L.J.; Riese, H.; Hudziak, J.J.; Verbiest, M.; Verhulst, F.C.; Oldehinkel, A.J.; van Oort, F.V.A. Glucocorticoid Receptor Gene (NR3C1) Methylation Following Stressful Events between Birth and Adolescence. The TRAILS Study. Transl. Psychiatry 2014, 4, e381. [Google Scholar] [CrossRef]
- Chen, J.; Evans, A.N.; Liu, Y.; Honda, M.; Saavedra, J.M.; Aguilera, G. Maternal Deprivation in Rats Is Associated with Corticotrophin-Releasing Hormone (CRH) Promoter Hypomethylation and Enhances CRH Transcriptional Responses to Stress in Adulthood. J. Neuroendocrinol. 2012, 24, 1055–1064. [Google Scholar] [CrossRef]
- Weaver, I.C.G.; Cervoni, N.; Champagne, F.A.; D’Alessio, A.C.; Sharma, S.; Seckl, J.R.; Dymov, S.; Szyf, M.; Meaney, M.J. Epigenetic Programming by Maternal Behavior. Nat. Neurosci. 2004, 7, 847–854. [Google Scholar] [CrossRef]
- Mueller, B.R.; Bale, T.L. Sex-Specific Programming of Offspring Emotionality after Stress Early in Pregnancy. J. Neurosci. 2008, 28, 9055–9065. [Google Scholar] [CrossRef]
- Perroud, N.; Paoloni-Giacobino, A.; Prada, P.; Olié, E.; Salzmann, A.; Nicastro, R.; Guillaume, S.; Mouthon, D.; Stouder, C.; Dieben, K. Increased Methylation of Glucocorticoid Receptor Gene (NR3C1) in Adults with a History of Childhood Maltreatment: A Link with the Severity and Type of Trauma. Transl. Psychiatry 2011, 1, e59. [Google Scholar] [CrossRef]
- Vinkers, C.H.; Kalafateli, A.L.; Rutten, B.P.F.; Kas, M.J.; Kaminsky, Z.; Turner, J.D.; Boks, M.P.M. Traumatic Stress and Human DNA Methylation: A Critical Review. Epigenomics 2015, 7, 593–608. [Google Scholar] [CrossRef]
- Gilbert, S.; Epel, D. Ecological Developmental Biology: Integrating Epigenetics, Medicine, and Evolution; Sinauer Associates Inc.: Sunderland, MA, USA, 2009. [Google Scholar]
- Moore, L.D.; Le, T.; Fan, G. DNA Methylation and Its Basic Function. Neuropsychopharmacology 2012, 38, 23–38. [Google Scholar] [CrossRef]
- Brenet, F.; Moh, M.; Funk, P.; Feierstein, E.; Viale, A.J.; Socci, N.D.; Scandura, J.M. DNA Methylation of the First Exon Is Tightly Linked to Transcriptional Silencing. PLoS ONE 2011, 6, e14524. [Google Scholar] [CrossRef]
- Ball, M.P.; Li, J.B.; Gao, Y.; Lee, J.-H.; LeProust, E.M.; Park, I.-H.; Xie, B.; Daley, G.Q.; Church, G.M. Targeted and Genome-Scale Strategies Reveal Gene-Body Methylation Signatures in Human Cells. Nat. Biotechnol. 2009, 27, 361–368. [Google Scholar] [CrossRef]
- Wan, J.; Oliver, V.F.; Wang, G.; Zhu, H.; Zack, D.J.; Merbs, S.L.; Qian, J. Characterization of Tissue-Specific Differential DNA Methylation Suggests Distinct Modes of Positive and Negative Gene Expression Regulation. BMC Genom. 2015, 16, 49. [Google Scholar] [CrossRef] [PubMed]
- Anastasiadi, D.; Esteve-Codina, A.; Piferrer, F. Consistent Inverse Correlation between DNA Methylation of the First Intron and Gene Expression across Tissues and Species. Epigenetics Chromatin 2018, 11, 37. [Google Scholar] [CrossRef]
- Müller, I.; Obata, K.; Richter-Levin, G.; Stork, O. GAD65 Haplodeficiency Conveys Resilience in Animal Models of Stress-Induced Psychopathology. Front. Behav. Neurosci. 2014, 8, 265. [Google Scholar] [PubMed]
- Tripathi, K.; Demiray, Y.E.; Kliche, S.; Jing, L.; Hazra, S.; Hazra, J.D.; Richter-Levin, G.; Stork, O. Reducing Glutamic Acid Decarboxylase in the Dorsal Dentate Gyrus Attenuates Juvenile Stress Induced Emotional and Cognitive Deficits. Neurobiol. Stress 2021, 15, 100350. [Google Scholar] [CrossRef] [PubMed]
- Hadad-Ophir, O.; Ardi, Z.; Brande-Eilat, N.; Kehat, O.; Anunu, R.; Richter-Levin, G. Exposure to Prolonged Controllable or Uncontrollable Stress Affects GABAergic Function in Sub-Regions of the Hippocampus and the Amygdala. Neurobiol. Learn. Mem. 2017, 138, 271–280. [Google Scholar] [CrossRef]
- Jacobson-Pick, S.; Elkobi, A.; Vander, S.; Rosenblum, K.; Richter-Levin, G. Juvenile Stress-Induced Alteration of Maturation of the GABAA Receptor α Subunit in the Rat. Int. J. Neuropsychopharmacol. 2008, 11, 891–903. [Google Scholar] [CrossRef]
- Ardi, Z.; Albrecht, A.; Richter-Levin, A.; Saha, R.; Richter-Levin, G. Behavioral Profiling as a Translational Approach in an Animal Model of Posttraumatic Stress Disorder. Neurobiol. Dis. 2016, 88, 139–147. [Google Scholar] [CrossRef]
- Richter-Levin, G.; Sandi, C. Title: “Labels Matter: Is It Stress or Is It Trauma?”. Transl. Psychiatry 2021, 11, 385. [Google Scholar] [CrossRef]
- Kolber, B.J.; Wieczorek, L.; Muglia, L.J. Hypothalamic–Pituitary–Adrenal Axis Dysregulation and Behavioral Analysis of Mouse Mutants with Altered Glucocorticoid or Mineralocorticoid Receptor Function. Stress 2008, 11, 321–338. [Google Scholar] [CrossRef]
- Carpenter, L.L.; Carvalho, J.P.; Tyrka, A.R.; Wier, L.M.; Mello, A.F.; Mello, M.F.; Anderson, G.M.; Wilkinson, C.W.; Price, L.H. Decreased Adrenocorticotropic Hormone and Cortisol Responses to Stress in Healthy Adults Reporting Significant Childhood Maltreatment. Biol. Psychiatry 2007, 62, 1080–1087. [Google Scholar] [CrossRef]
- Heim, C.; Newport, D.J.; Heit, S.; Graham, Y.P.; Wilcox, M.; Bonsall, R.; Miller, A.H.; Nemeroff, C.B. Pituitary-Adrenal and Autonomic Responses to Stress in Women after Sexual and Physical Abuse in Childhood. JAMA 2000, 284, 592–597. [Google Scholar] [CrossRef]
- Kessler, R.C.; McLaughlin, K.A.; Green, J.G.; Gruber, M.J.; Sampson, N.A.; Zaslavsky, A.M.; Aguilar-Gaxiola, S.; Alhamzawi, A.O.; Alonso, J.; Angermeyer, M. Childhood Adversities and Adult Psychopathology in the WHO World Mental Health Surveys. Br. J. Psychiatry 2010, 197, 378–385. [Google Scholar] [CrossRef]
- Petrowski, K.; Wintermann, G.-B.; Schaarschmidt, M.; Bornstein, S.R.; Kirschbaum, C. Blunted Salivary and Plasma Cortisol Response in Patients with Panic Disorder under Psychosocial Stress. Int. J. Psychophysiol. 2013, 88, 35–39. [Google Scholar] [CrossRef]
- Bick, J.; Naumova, O.; Hunter, S.; Barbot, B.; Lee, M.; Luthar, S.S.; Raefski, A.; Grigorenko, E.L. Childhood Adversity and DNA Methylation of Genes Involved in the Hypothalamus–Pituitary–Adrenal Axis and Immune System: Whole-Genome and Candidate-Gene Associations. Dev. Psychopathol. 2012, 24, 1417–1425. [Google Scholar] [CrossRef]
- Houtepen, L.C.; Vinkers, C.H.; Carrillo-Roa, T.; Hiemstra, M.; van Lier, P.A.; Meeus, W.; Branje, S.; Heim, C.M.; Nemeroff, C.B.; Mill, J. Genome-Wide DNA Methylation Levels and Altered Cortisol Stress Reactivity Following Childhood Trauma in Humans. Nat. Commun. 2016, 7, 10967. [Google Scholar] [CrossRef]
- Bazak, N.; Kozlovsky, N.; Kaplan, Z.; Matar, M.; Golan, H.; Zohar, J.; Richter-Levin, G.; Cohen, H. Pre-Pubertal Stress Exposure Affects Adult Behavioral Response in Association with Changes in Circulating Corticosterone and Brain-Derived Neurotrophic Factor. Psychoneuroendocrinology 2009, 34, 844–858. [Google Scholar] [CrossRef]
- Grigoryan, G.; Ardi, Z.; Albrecht, A.; Richter-Levin, G.; Segal, M. Juvenile Stress Alters LTP in Ventral Hippocampal Slices: Involvement of Noradrenergic Mechanisms. Behav. Brain Res. 2015, 278, 559–562. [Google Scholar] [CrossRef]
- Jacobson-Pick, S.; Richter-Levin, G. Differential Impact of Juvenile Stress and Corticosterone in Juvenility and in Adulthood, in Male and Female Rats. Behav. Brain Res. 2010, 214, 268–276. [Google Scholar] [CrossRef]
- Ilin, Y.; Richter-Levin, G. Enriched Environment Experience Overcomes Learning Deficits and Depressive-like Behavior Induced by Juvenile Stress. PLoS ONE 2009, 4, e4329. [Google Scholar] [CrossRef]
- Moghaddam, B.; Jackson, M. Effect of Stress on Prefrontal Cortex Function. Neurotox. Res. 2004, 6, 73–78. [Google Scholar] [CrossRef]
- Richter-Levin, G.; Horovitz, O.; Tsoory, M.M. The Early Adolescent or “Juvenile Stress” Translational Animal Model of Posttraumatic Stress Disorder. In Future Directions in Post-Traumatic Stress Disorder; Springer: Boston, MA, USA, 2015; pp. 65–77. [Google Scholar] [CrossRef]
- Horovitz, O.; Tsoory, M.M.; Hall, J.; Jacobson-Pick, S.; Richter-Levin, G. Post-Weaning to Pre-Pubertal (‘Juvenile’) Stress: A Model of Induced Predisposition to Stress-Related Disorders. Neuroendocrinology 2012, 95, 56–64. [Google Scholar] [CrossRef] [PubMed]
- Ardi, Z.; Ritov, G.; Lucas, M.; Richter-Levin, G. The Effects of a Reminder of Underwater Trauma on Behaviour and Memory-Related Mechanisms in the Rat Dentate Gyrus. Int. J. Neuropsychopharmacol. 2014, 17, 571–580. [Google Scholar] [CrossRef] [PubMed]
- Avital, A.; Richter-Levin, G. Exposure to Juvenile Stress Exacerbates the Behavioural Consequences of Exposure to Stress in the Adult Rat. Int. J. Neuropsychopharmacol. 2005, 8, 163–173. [Google Scholar] [CrossRef] [PubMed]
- Pellow, S.; Chopin, P.; File, S.E.; Briley, M. Validation of Open: Closed Arm Entries in an Elevated plus-Maze as a Measure of Anxiety in the Rat. J. Neurosci. Methods 1985, 14, 149–167. [Google Scholar] [CrossRef]
- Paxinos, G.; Watson, C. The Rat Brain in Stereotaxic Coordinates; Academic Press, Inc.: San Diego, CA, USA, 1998. [Google Scholar]


| Region | CpG Site | Control | JS | JS + AS | Adj. Sig. | ||||||||
|---|---|---|---|---|---|---|---|---|---|---|---|---|---|
| n | M% | SE% | n | M% | SE% | n | M% | SE% | JS vs. Control | JS + AS vs. Control | JS + AS vs. JS | ||
| BLA | amplicon_001_CpG_11.12 | 8 | 4.4 | 1.2 | 9 | 4.9 | 3 | 10 | 6.9 | 2 | 0.652 | 0.439 | 0.015 * |
| amplicon_001_CpG_16 | 7 | 7.7 | 1.1 | 9 | 5.8 | 0.3 | 10 | 8.5 | 0.7 | 0.231 | 1 | 0.019 * | |
| amplicon_001_CpG_18.19.20 | 8 | 5.3 | 0.6 | 9 | 3 | 0.3 | 10 | 4.5 | 0.7 | 0.216 | 1 | 0.044 * | |
| dCA1 | amplicon_001_CpG_11.12 | 7 | 9.4 | 2 | 8 | 2.7 | 0.2 | 9 | 6.2 | 1.8 | 0.009 ** | 0.477 | 0.258 |
| amplicon_001_CpG_5 | 7 | 0.3 | 0.1 | 8 | 1.6 | 0.3 | 9 | 0.7 | 0.3 | 0.031 * | 1 | 0.144 | |
| dDG | amplicon_001_CpG_1 | 7 | 0 | 0 | 7 | 1 | 0.3 | 7 | 0 | 0 | 0.007 ** | 1 | 0.007 ** |
| amplicon_001_CpG_5 | 7 | 0.5 | 0.2 | 7 | 2 | 0.3 | 7 | 0.5 | 0.2 | 0.045 * | 1 | 0.029 * | |
Disclaimer/Publisher’s Note: The statements, opinions and data contained in all publications are solely those of the individual author(s) and contributor(s) and not of MDPI and/or the editor(s). MDPI and/or the editor(s) disclaim responsibility for any injury to people or property resulting from any ideas, methods, instructions or products referred to in the content. |
© 2023 by the authors. Licensee MDPI, Basel, Switzerland. This article is an open access article distributed under the terms and conditions of the Creative Commons Attribution (CC BY) license (https://creativecommons.org/licenses/by/4.0/).
Share and Cite
Ben David, G.; Amir, Y.; Tripathi, K.; Sharvit, L.; Benhos, A.; Anunu, R.; Richter-Levin, G.; Atzmon, G. Exposure to Juvenile Stress Induces Epigenetic Alterations in the GABAergic System in Rats. Genes 2023, 14, 565. https://doi.org/10.3390/genes14030565
Ben David G, Amir Y, Tripathi K, Sharvit L, Benhos A, Anunu R, Richter-Levin G, Atzmon G. Exposure to Juvenile Stress Induces Epigenetic Alterations in the GABAergic System in Rats. Genes. 2023; 14(3):565. https://doi.org/10.3390/genes14030565
Chicago/Turabian StyleBen David, Gil, Yam Amir, Kuldeep Tripathi, Lital Sharvit, Amir Benhos, Rachel Anunu, Gal Richter-Levin, and Gil Atzmon. 2023. "Exposure to Juvenile Stress Induces Epigenetic Alterations in the GABAergic System in Rats" Genes 14, no. 3: 565. https://doi.org/10.3390/genes14030565
APA StyleBen David, G., Amir, Y., Tripathi, K., Sharvit, L., Benhos, A., Anunu, R., Richter-Levin, G., & Atzmon, G. (2023). Exposure to Juvenile Stress Induces Epigenetic Alterations in the GABAergic System in Rats. Genes, 14(3), 565. https://doi.org/10.3390/genes14030565