
Whole Exome Sequencing Reveals Novel Candidate Genes in Familial Forms of Glaucomatous Neurodegeneration

 , , and
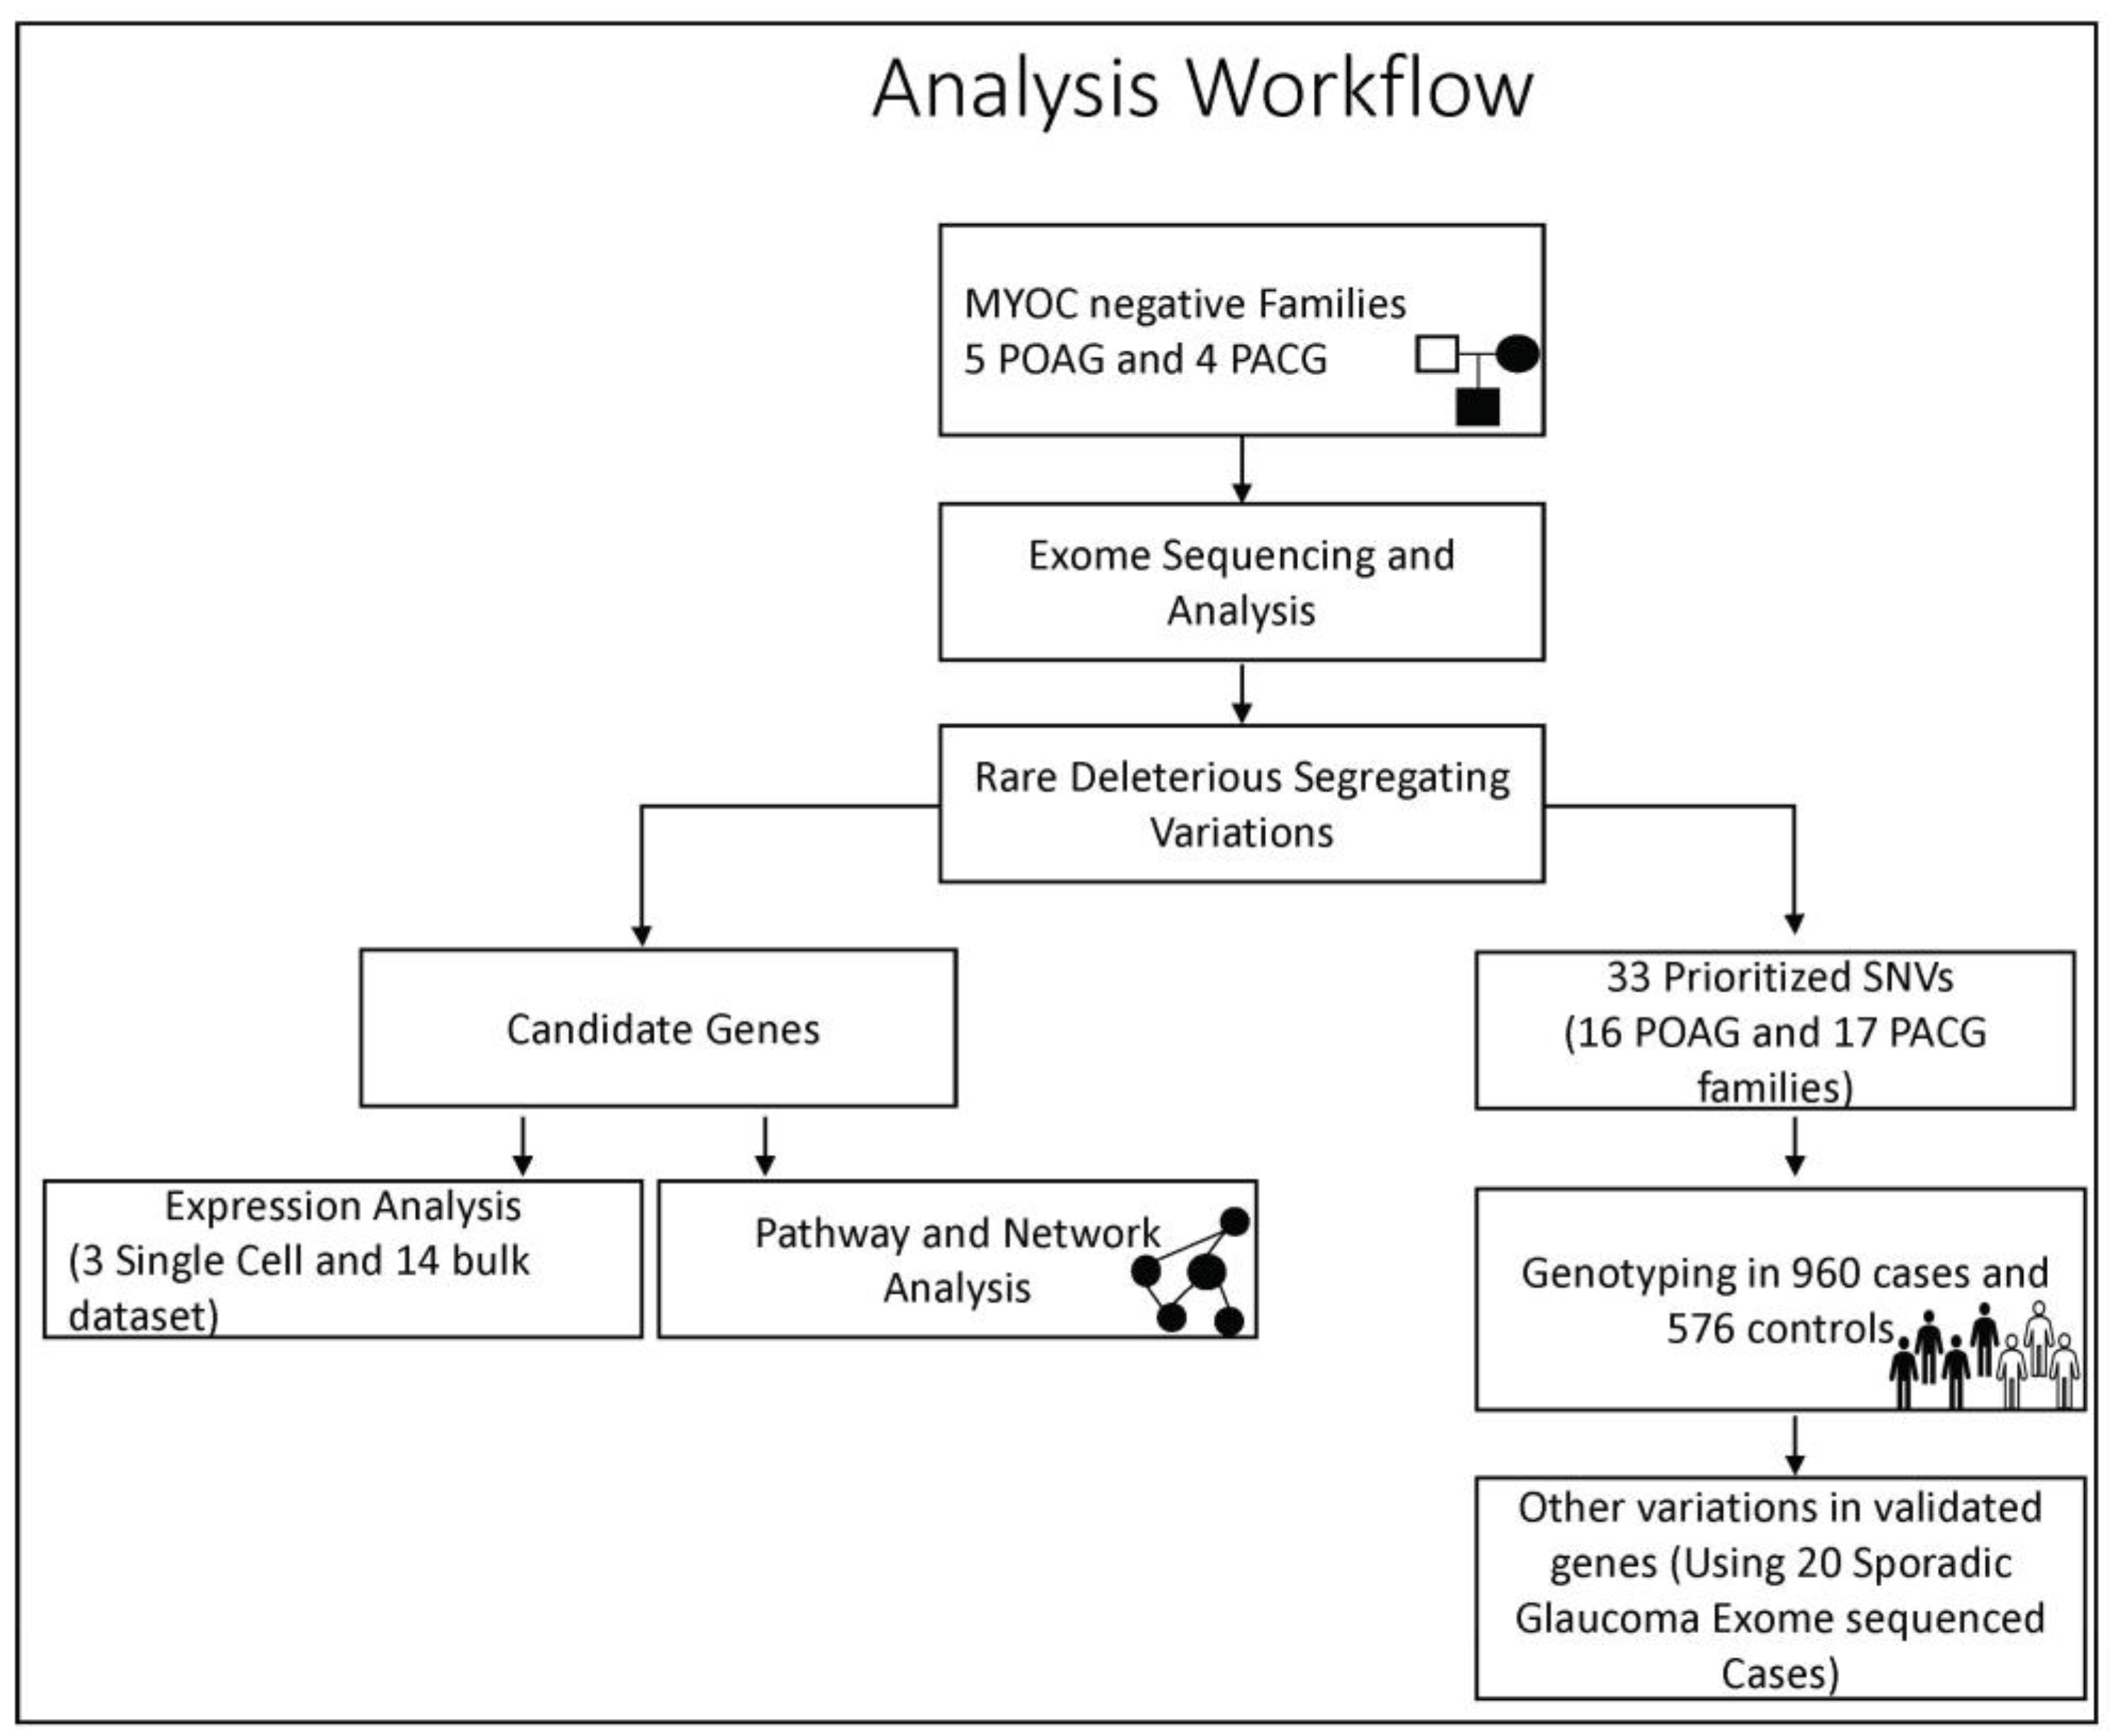
Abstract
1. Introduction
2. Materials and Methods
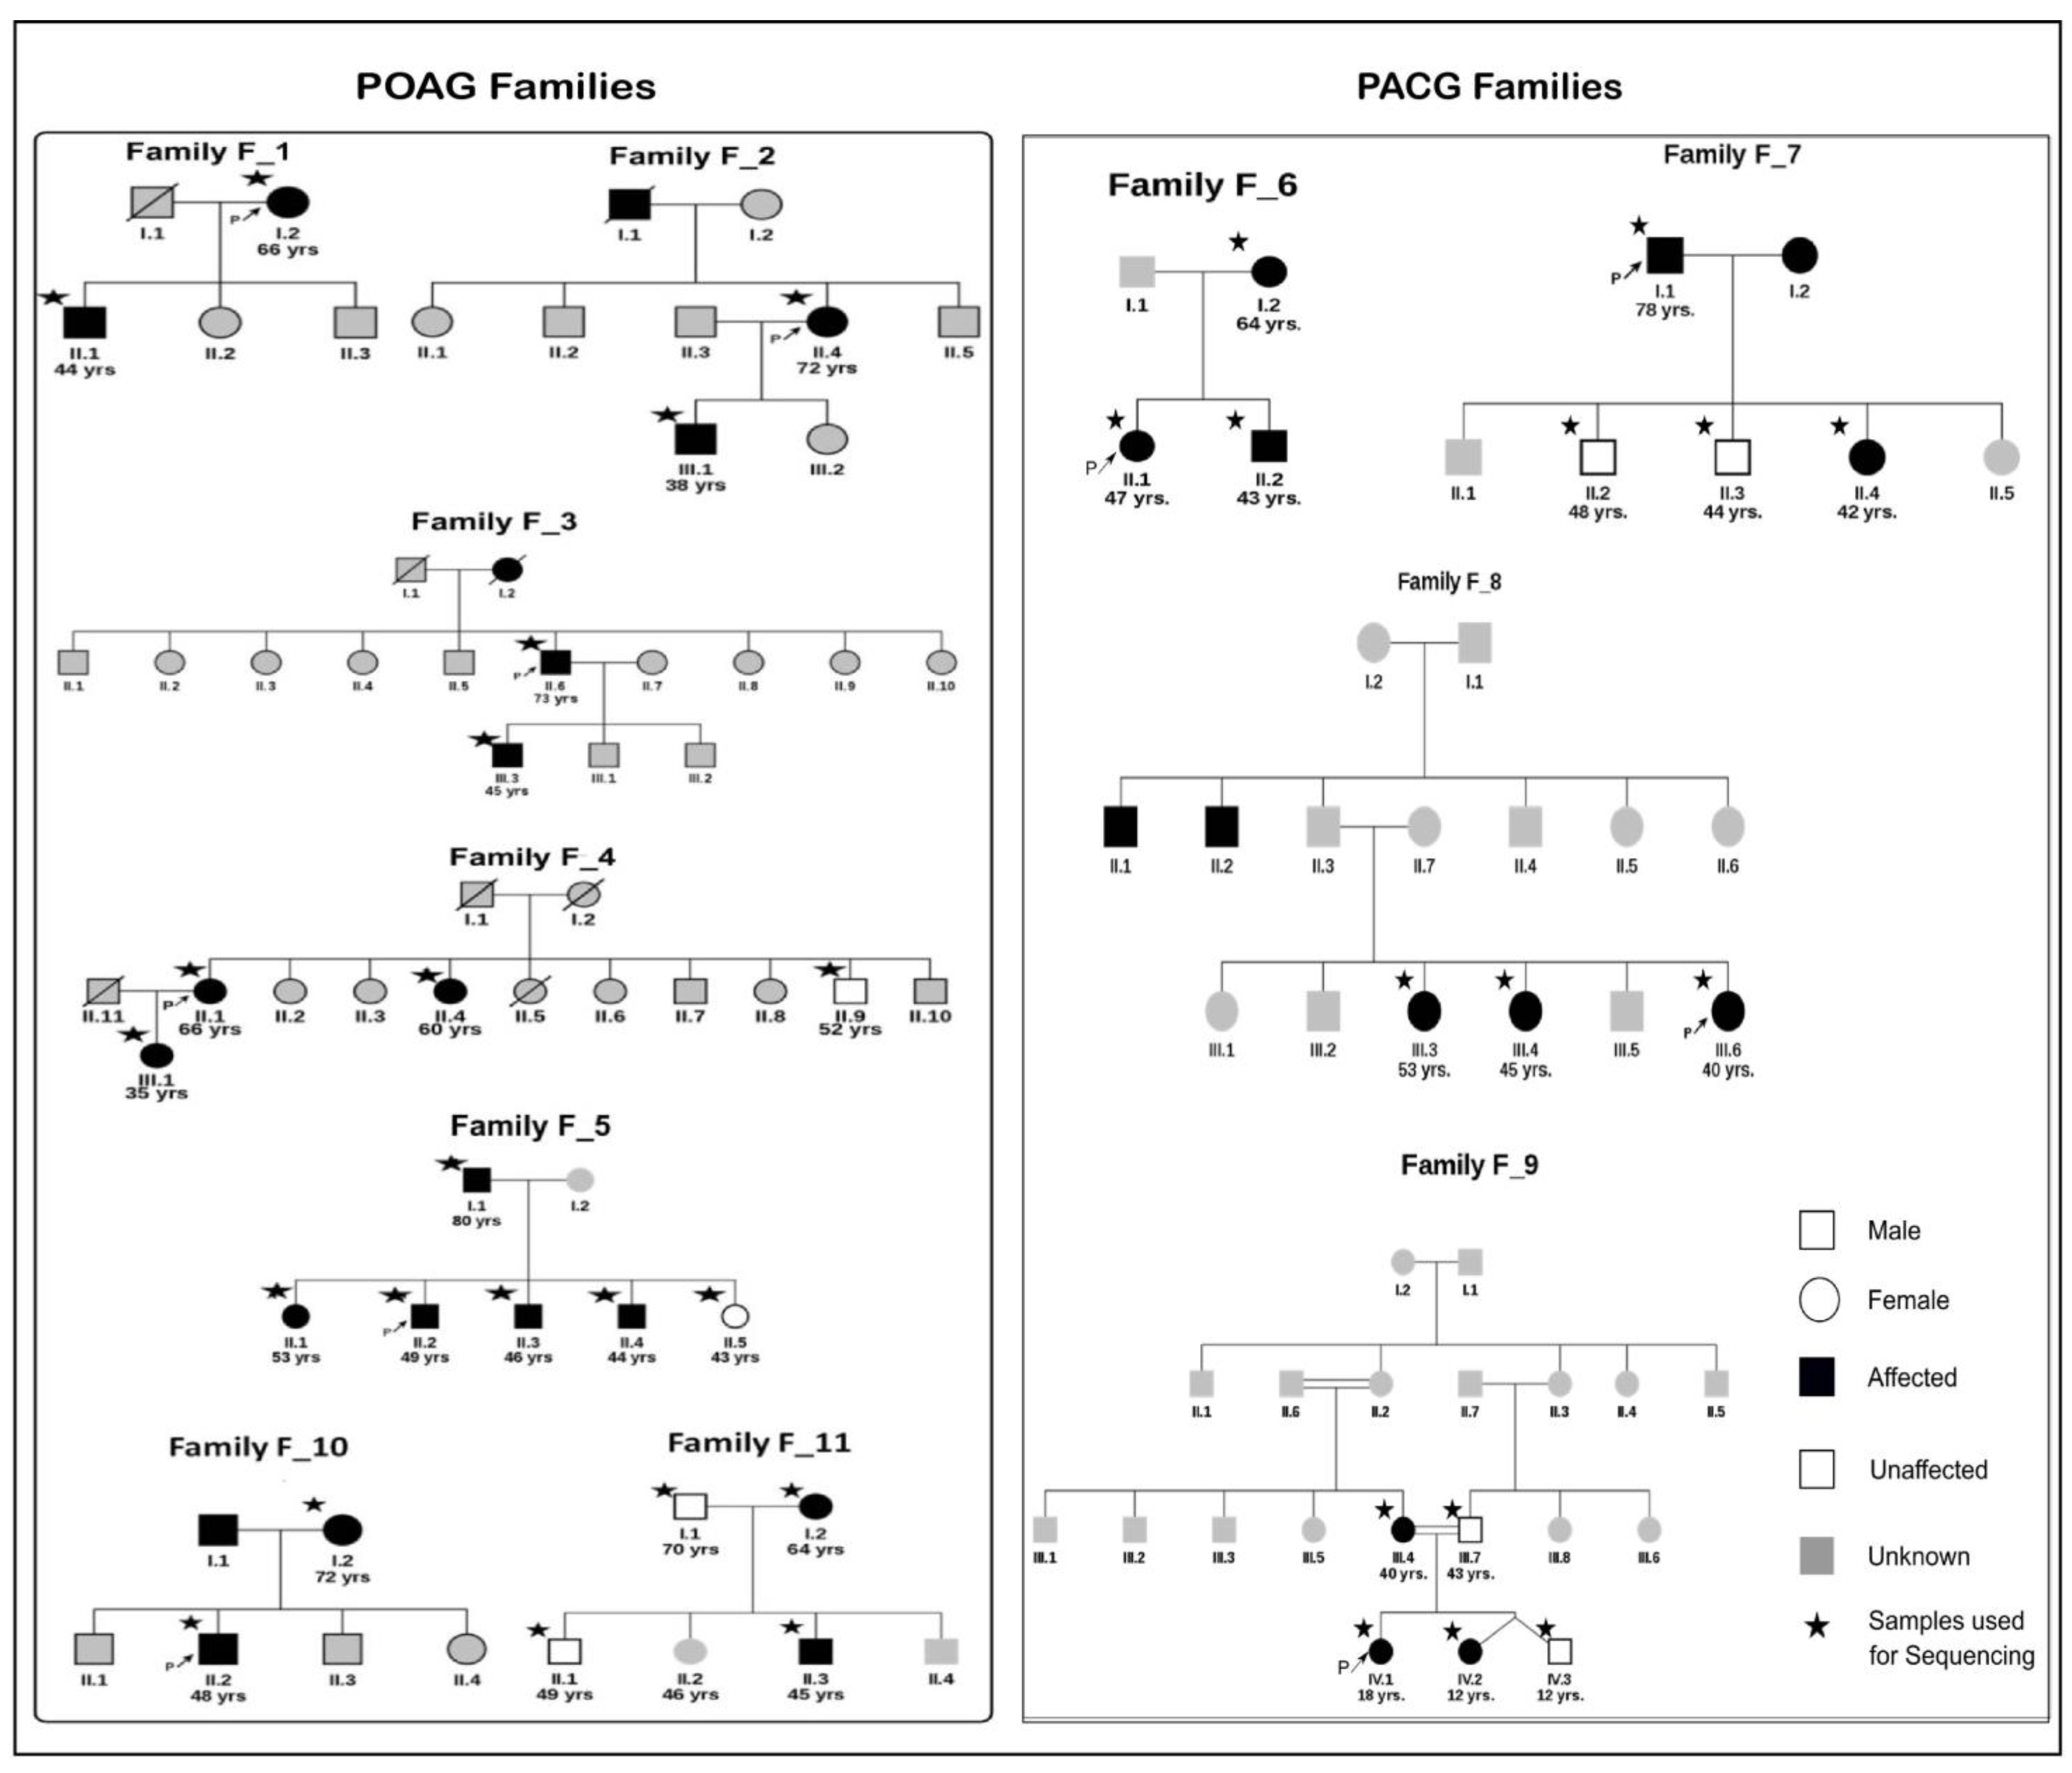
2.1. Clinical Diagnosis and Sample Collection
2.2. Screening of MYOC Mutations as an Exclusion Strategy
2.3. Whole-Exome Sequencing and Analysis
2.4. Identification of Candidate Variations and Prioritization
2.5. Known Gene Analysis
2.6. Genotyping of Prioritized Variations in a Validation Cohort
2.7. Immunohistochemistry (IHC)
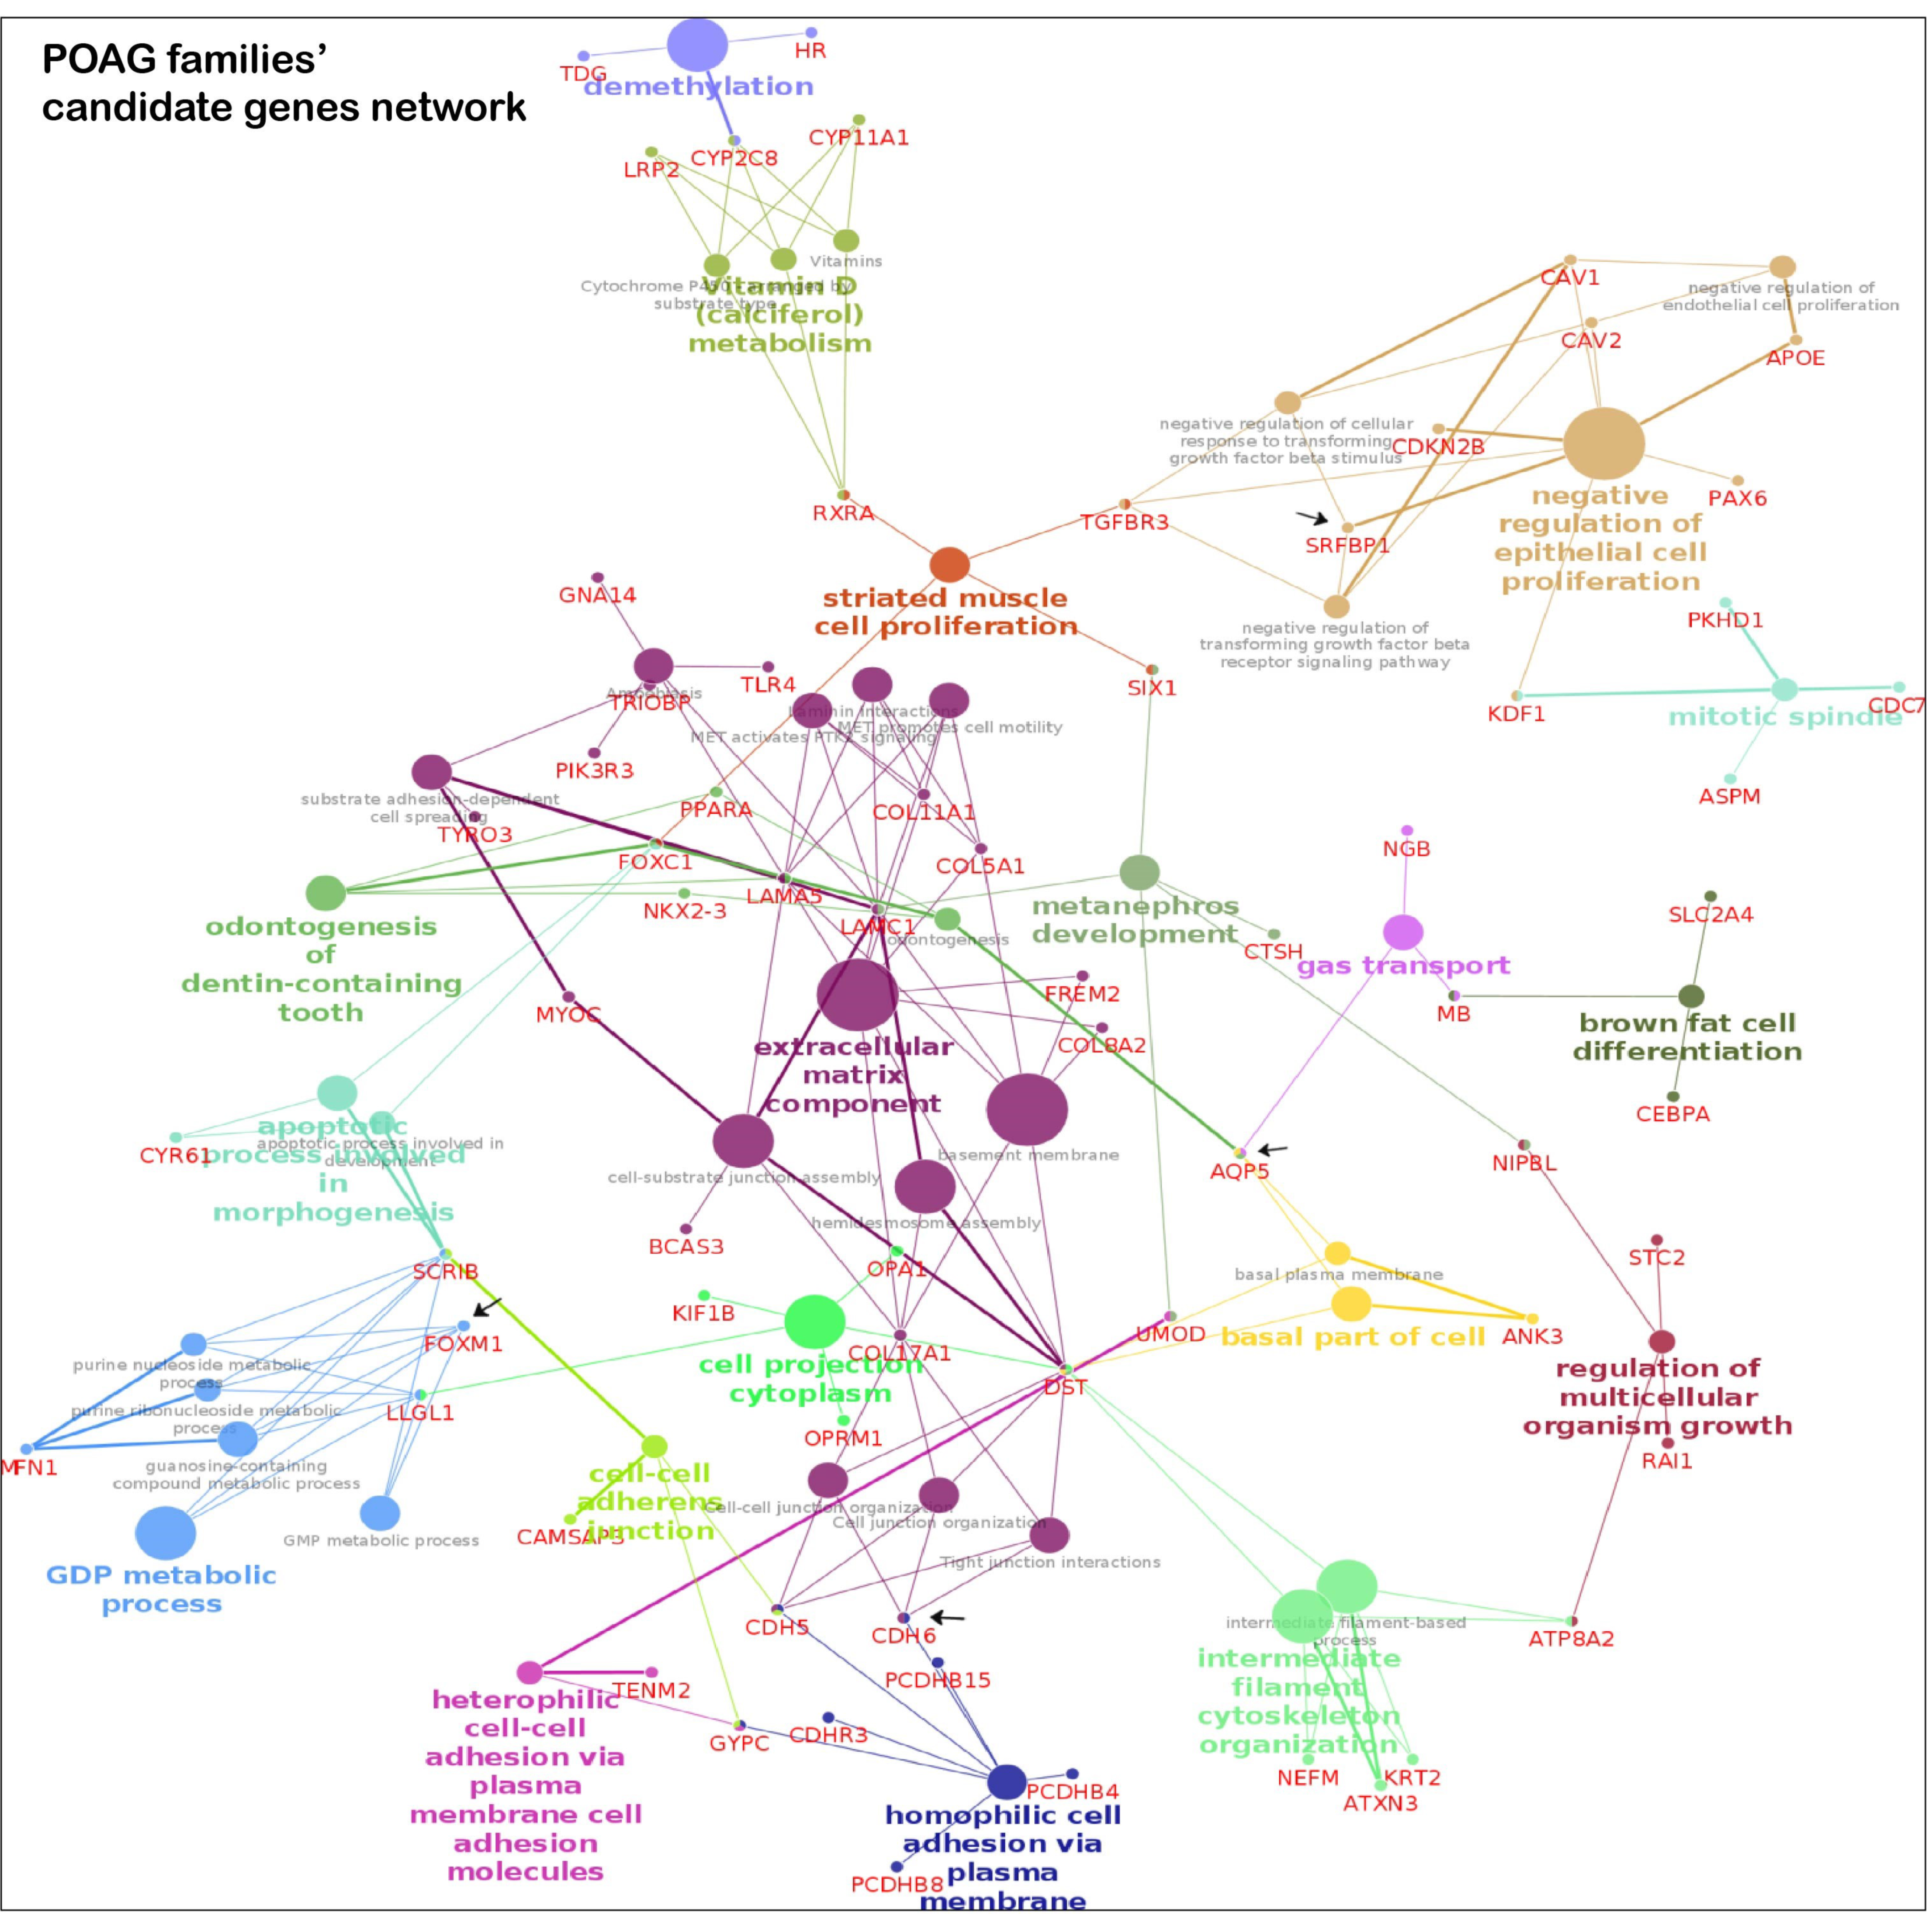
2.8. Gene Interaction and Pathway Analysis
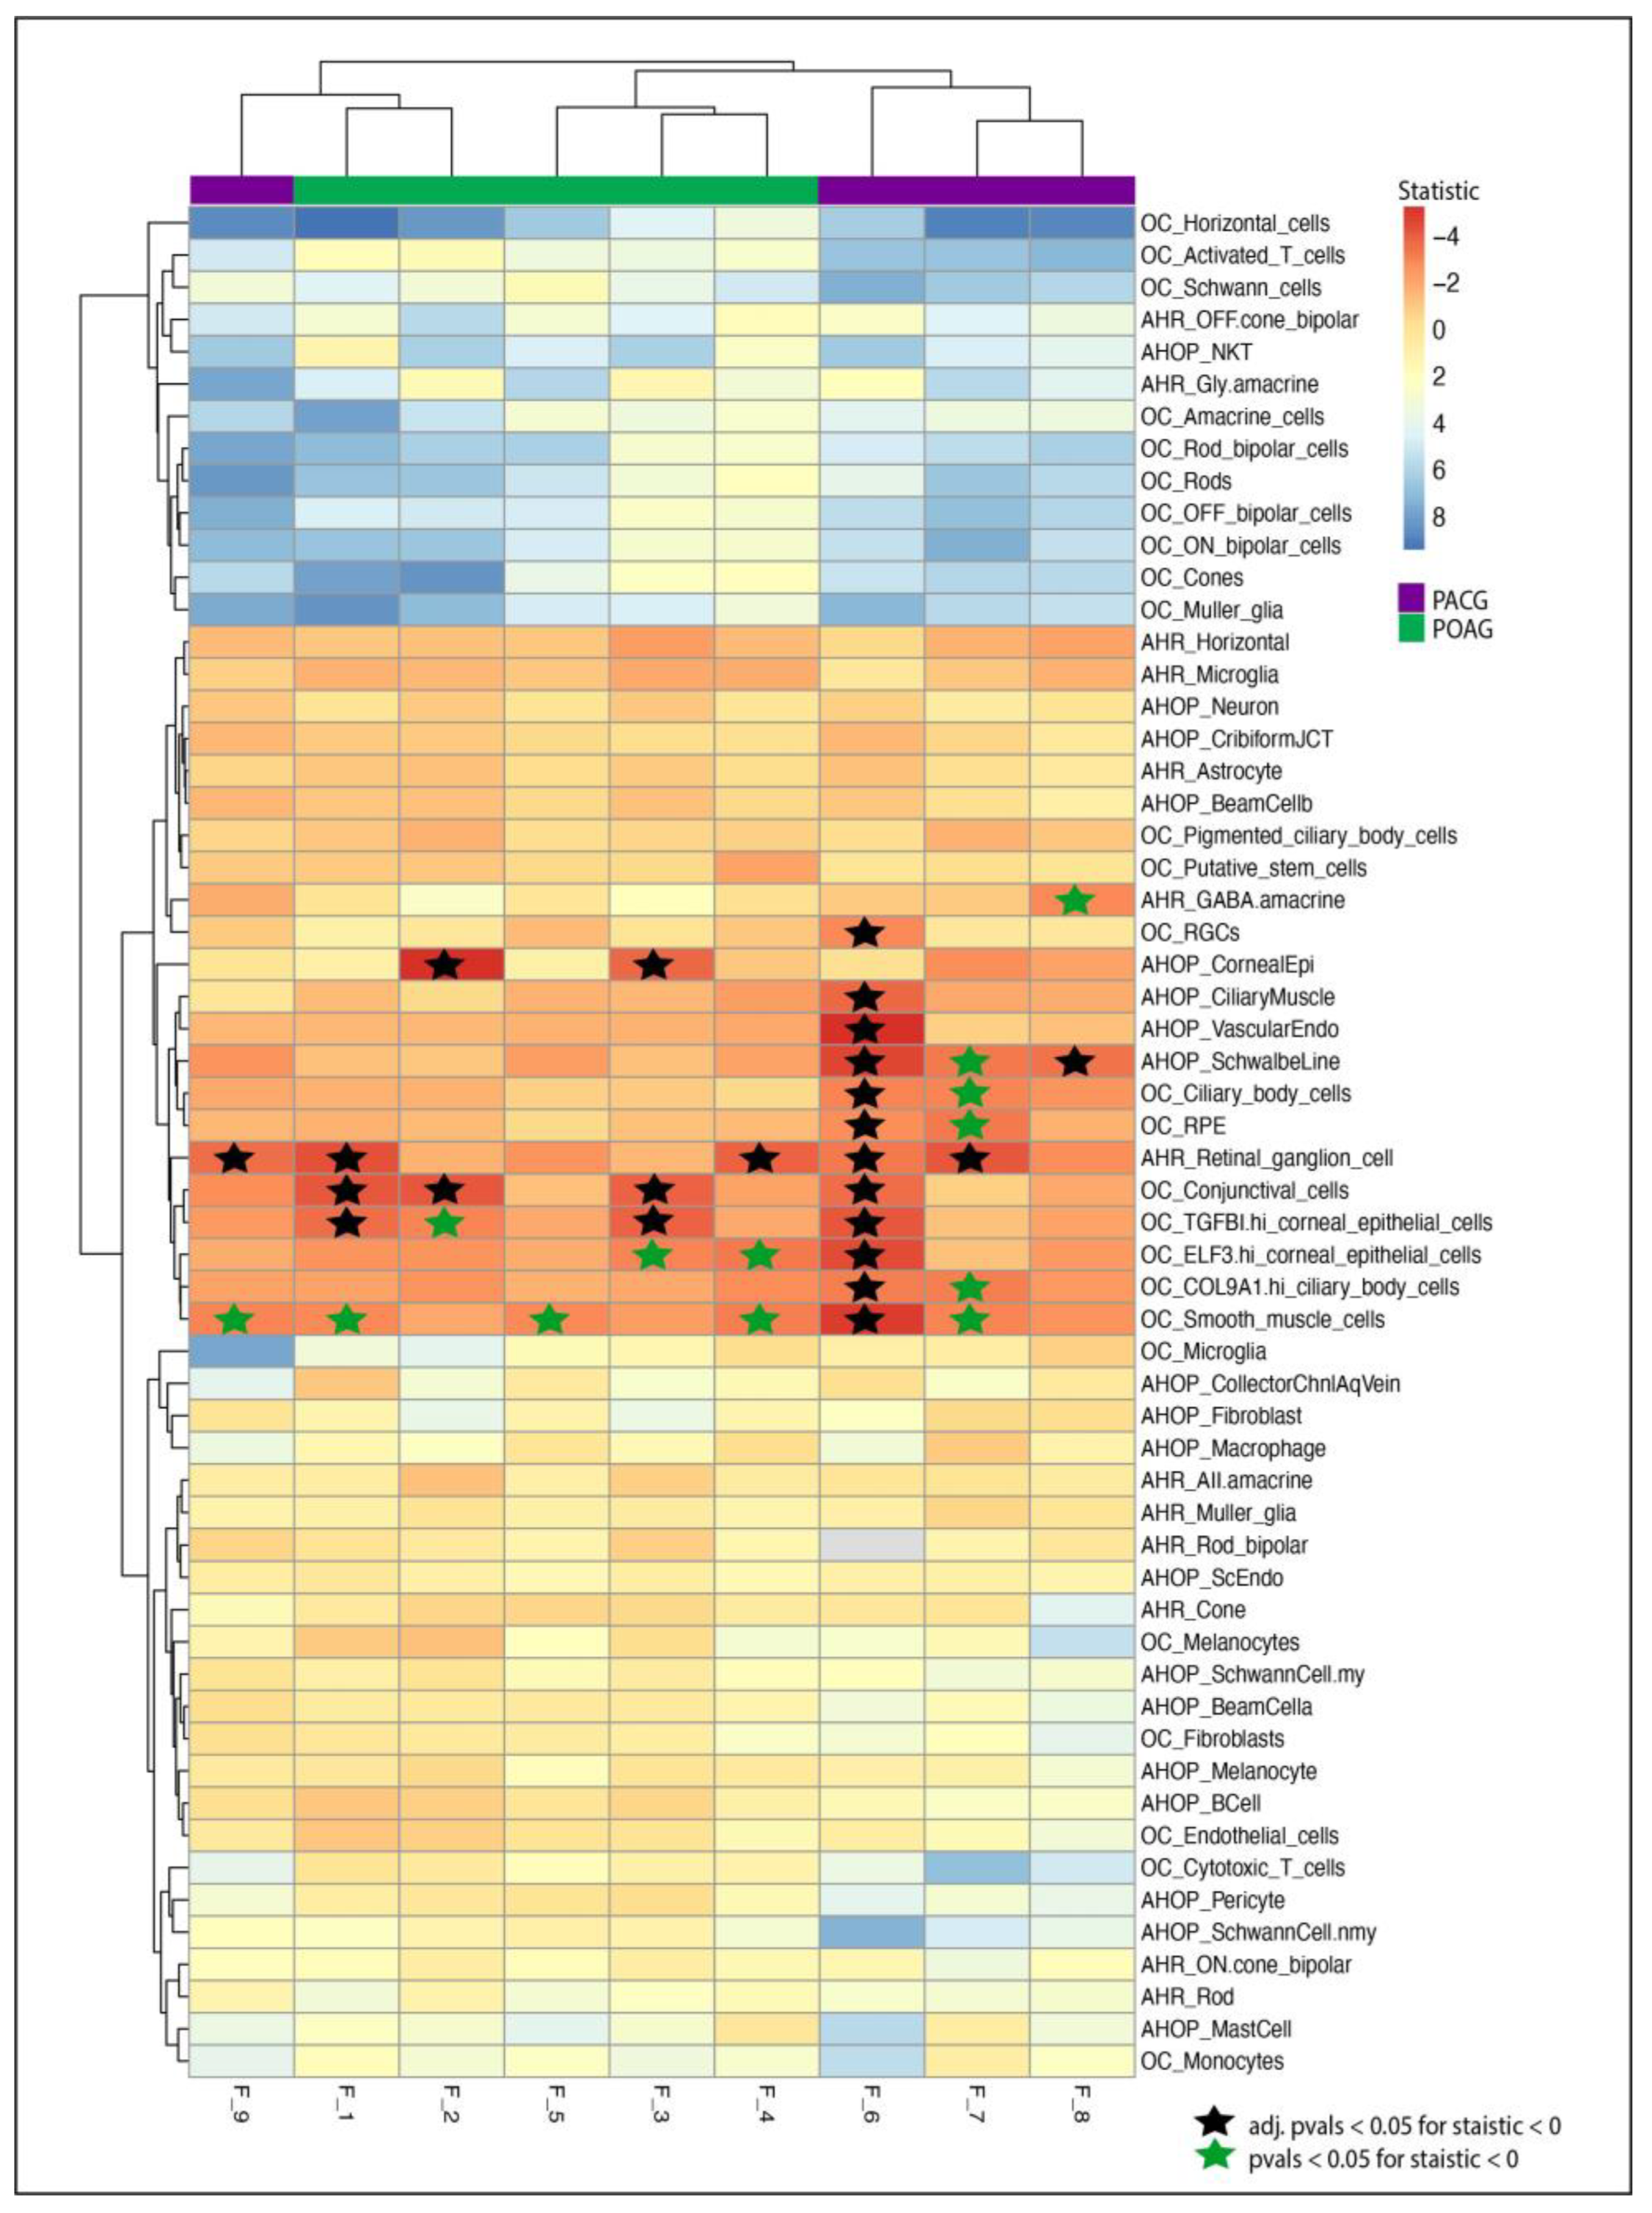
2.9. Expression Analysis
3. Results
3.1. Candidate Gene Screening Reveals Most Families Do Not Carry Causal Variants in Known Genes
3.2. Novel Candidate Genes Identified by Whole-Exome Sequencing
3.3. Single-Cell Transcriptomic Analysis Suggests Enrichment of Candidate Genes in Glaucoma-Related Tissues
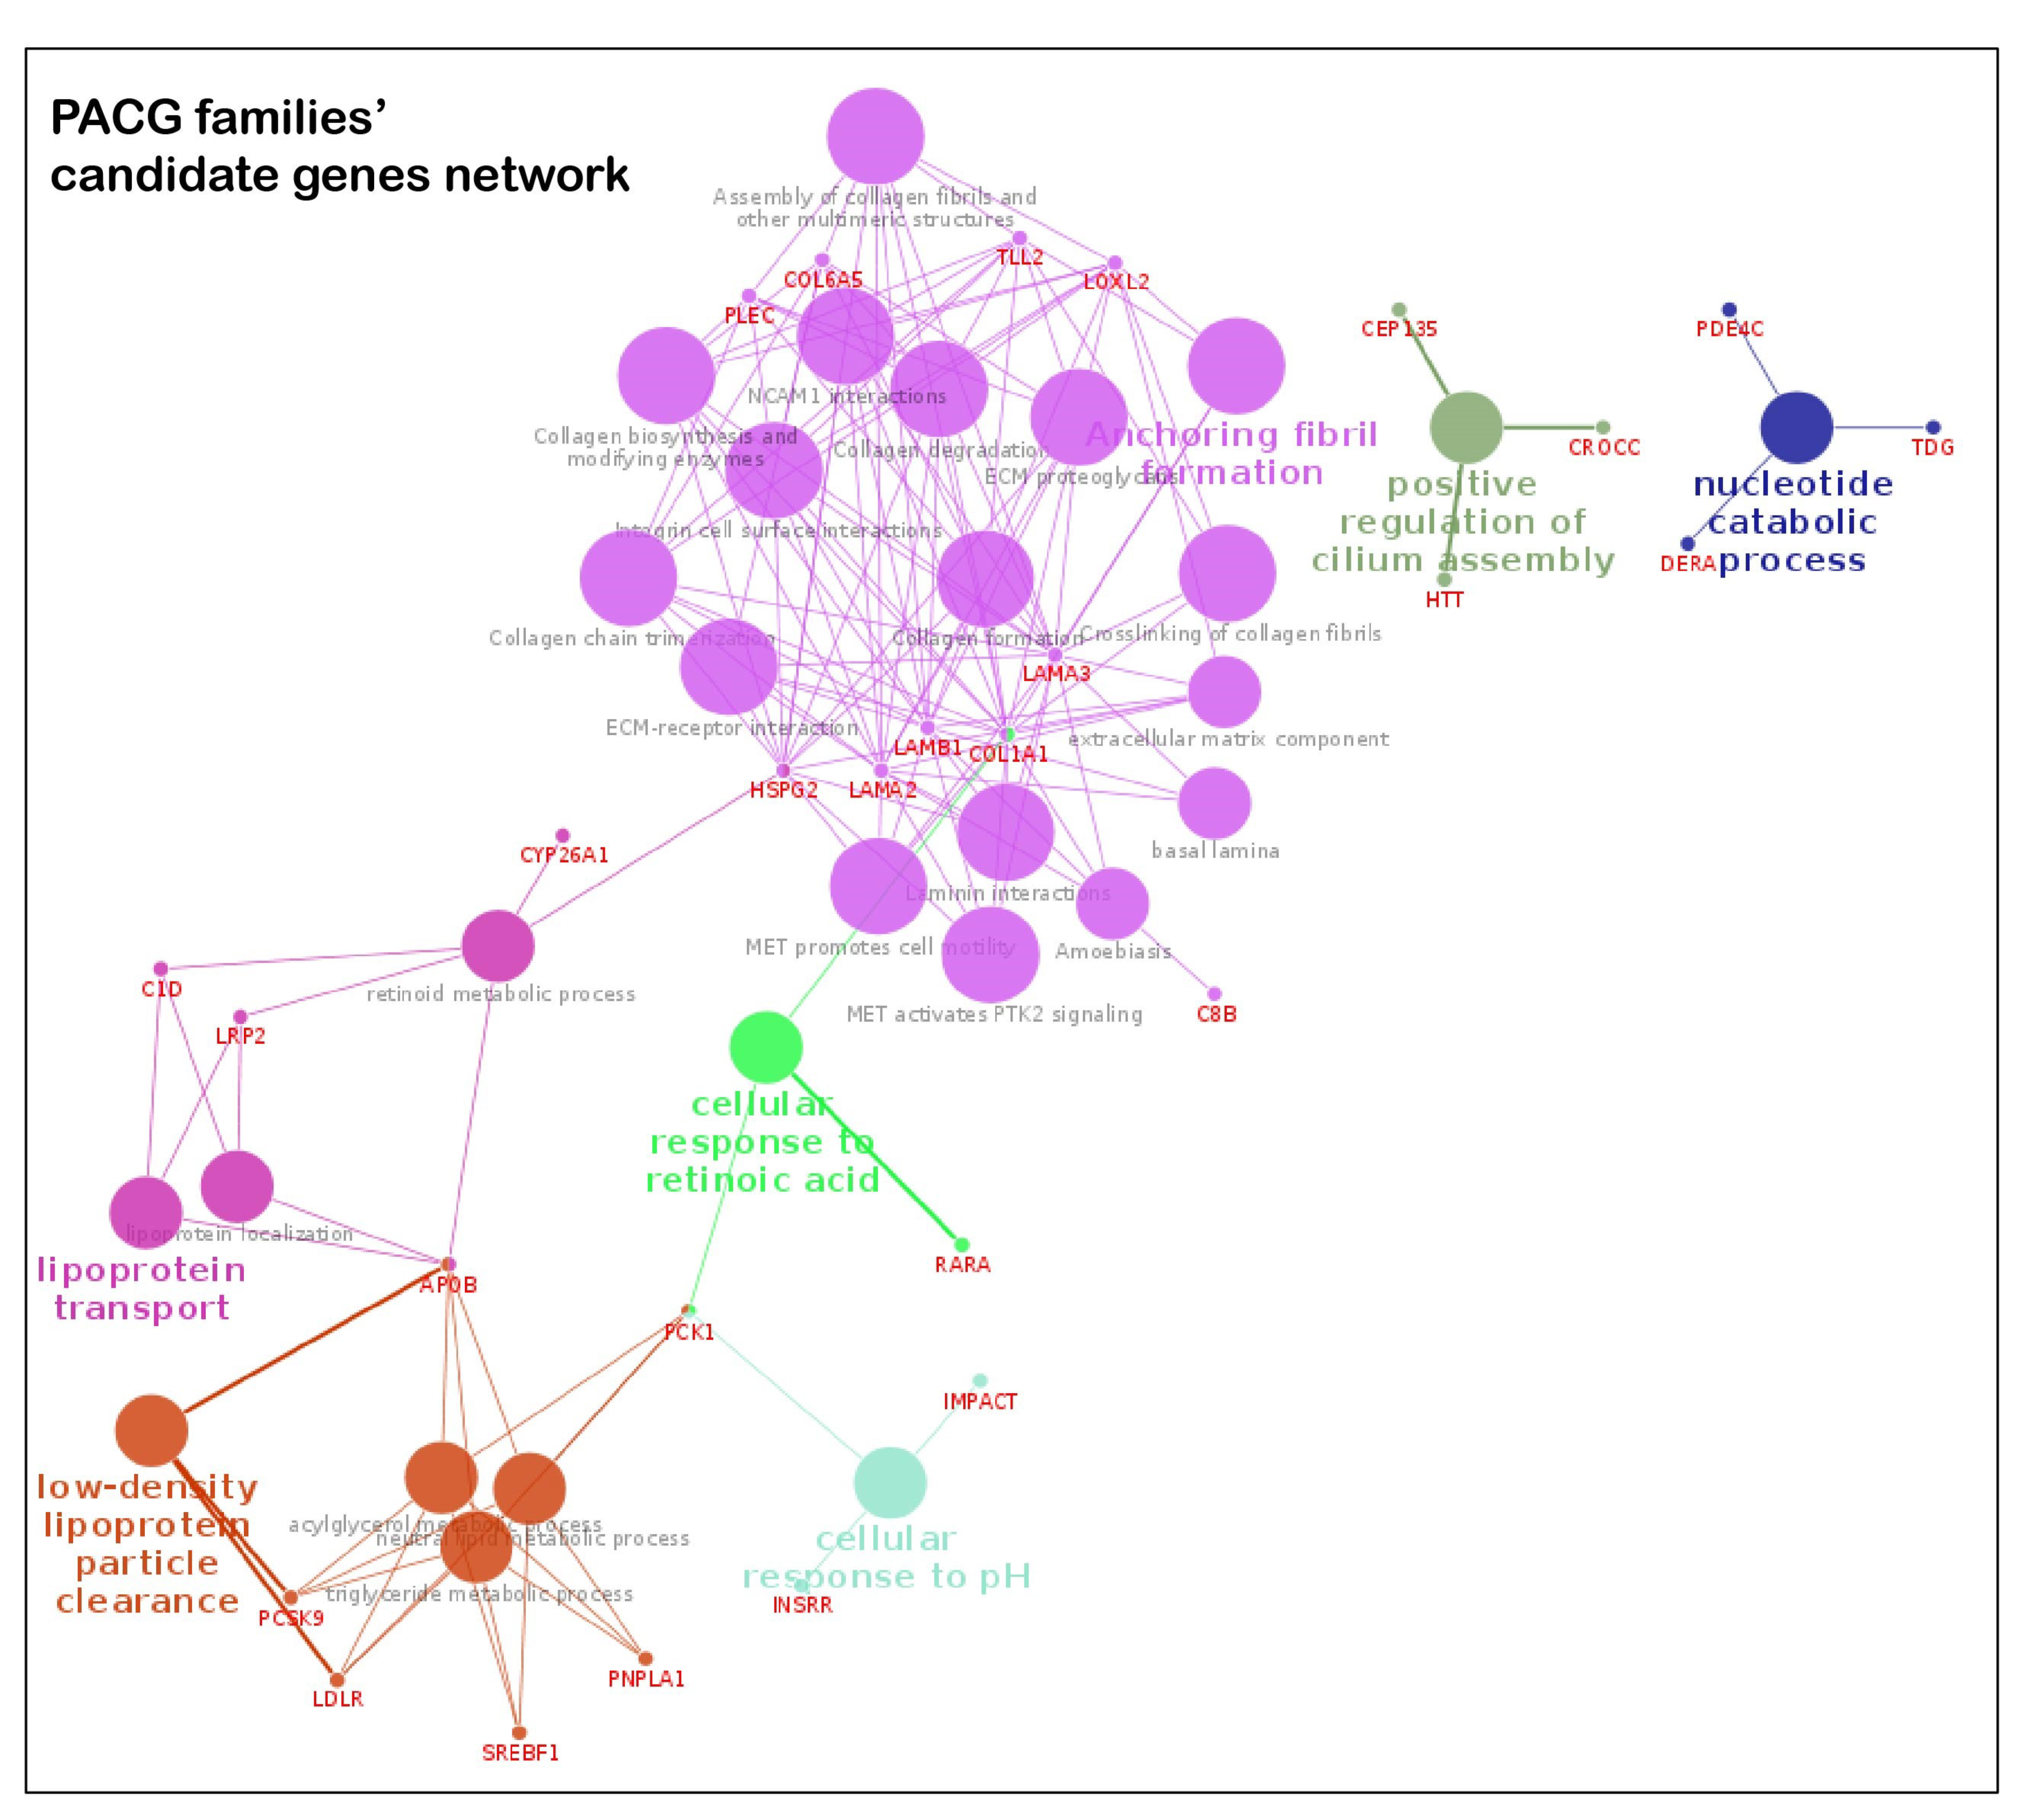
3.4. Key Pathways Involved in Families
3.5. Prioritized Genes Harbor Variations in Sporadic Glaucoma Patients
3.6. Specific Families with Interesting Findings
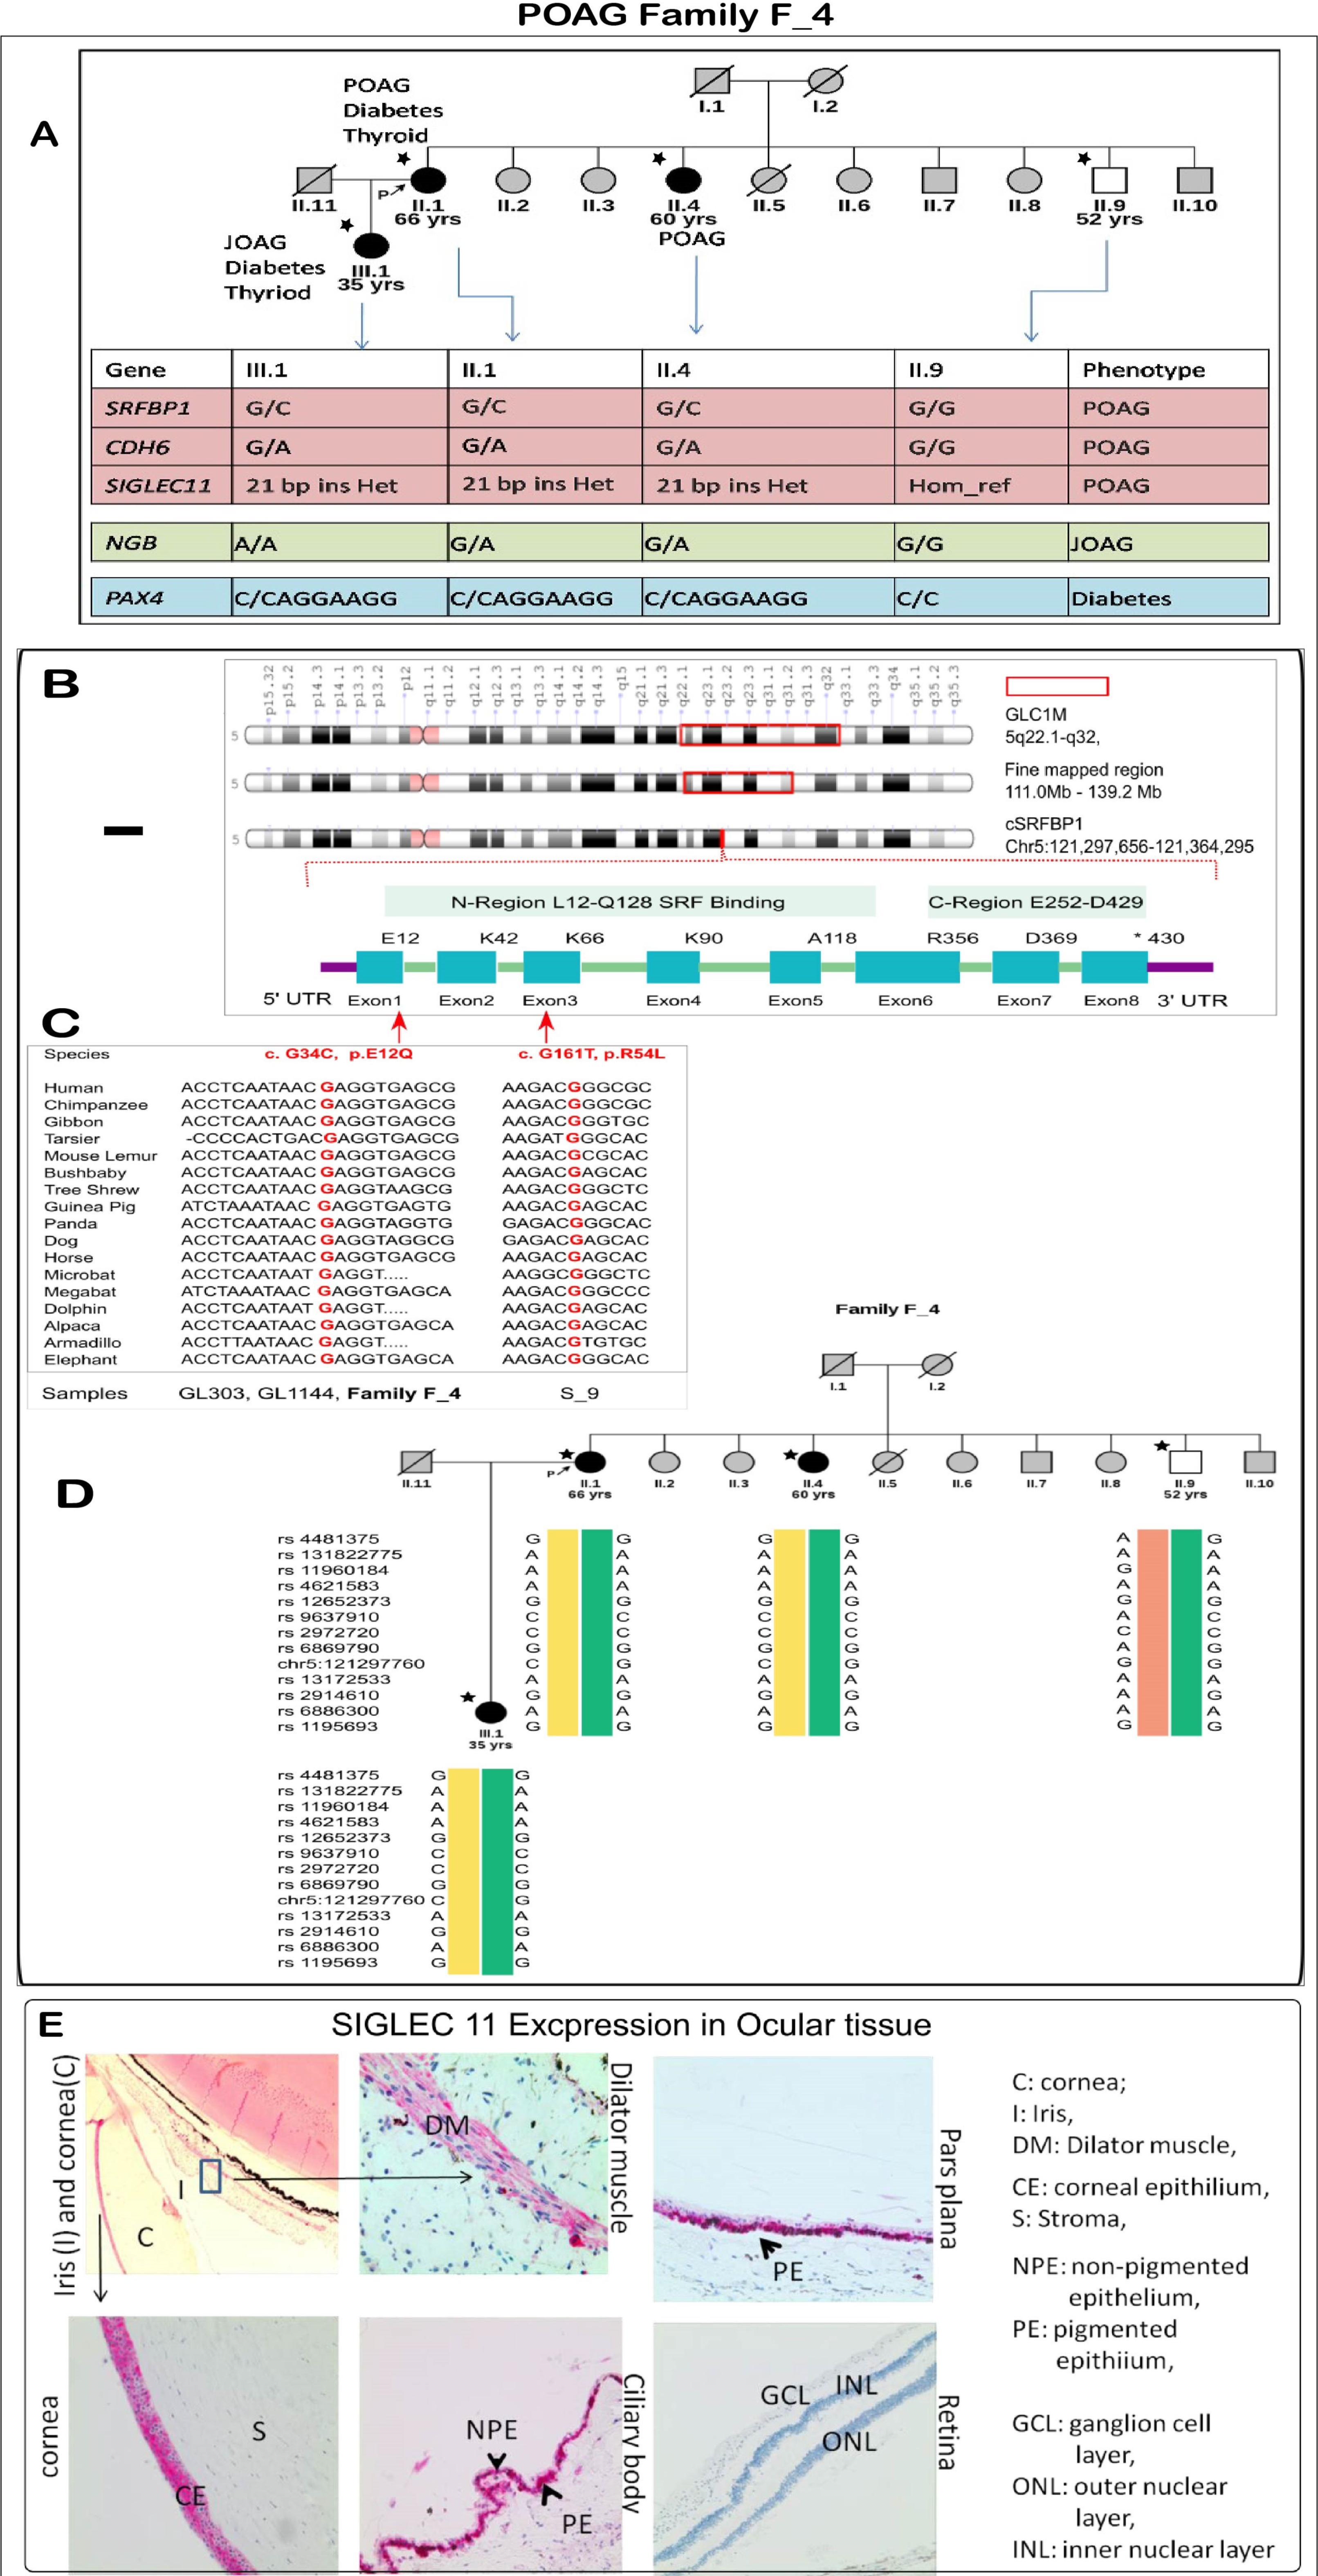
3.6.1. POAG Family F_4: A family with Variable Age of POAG Onset
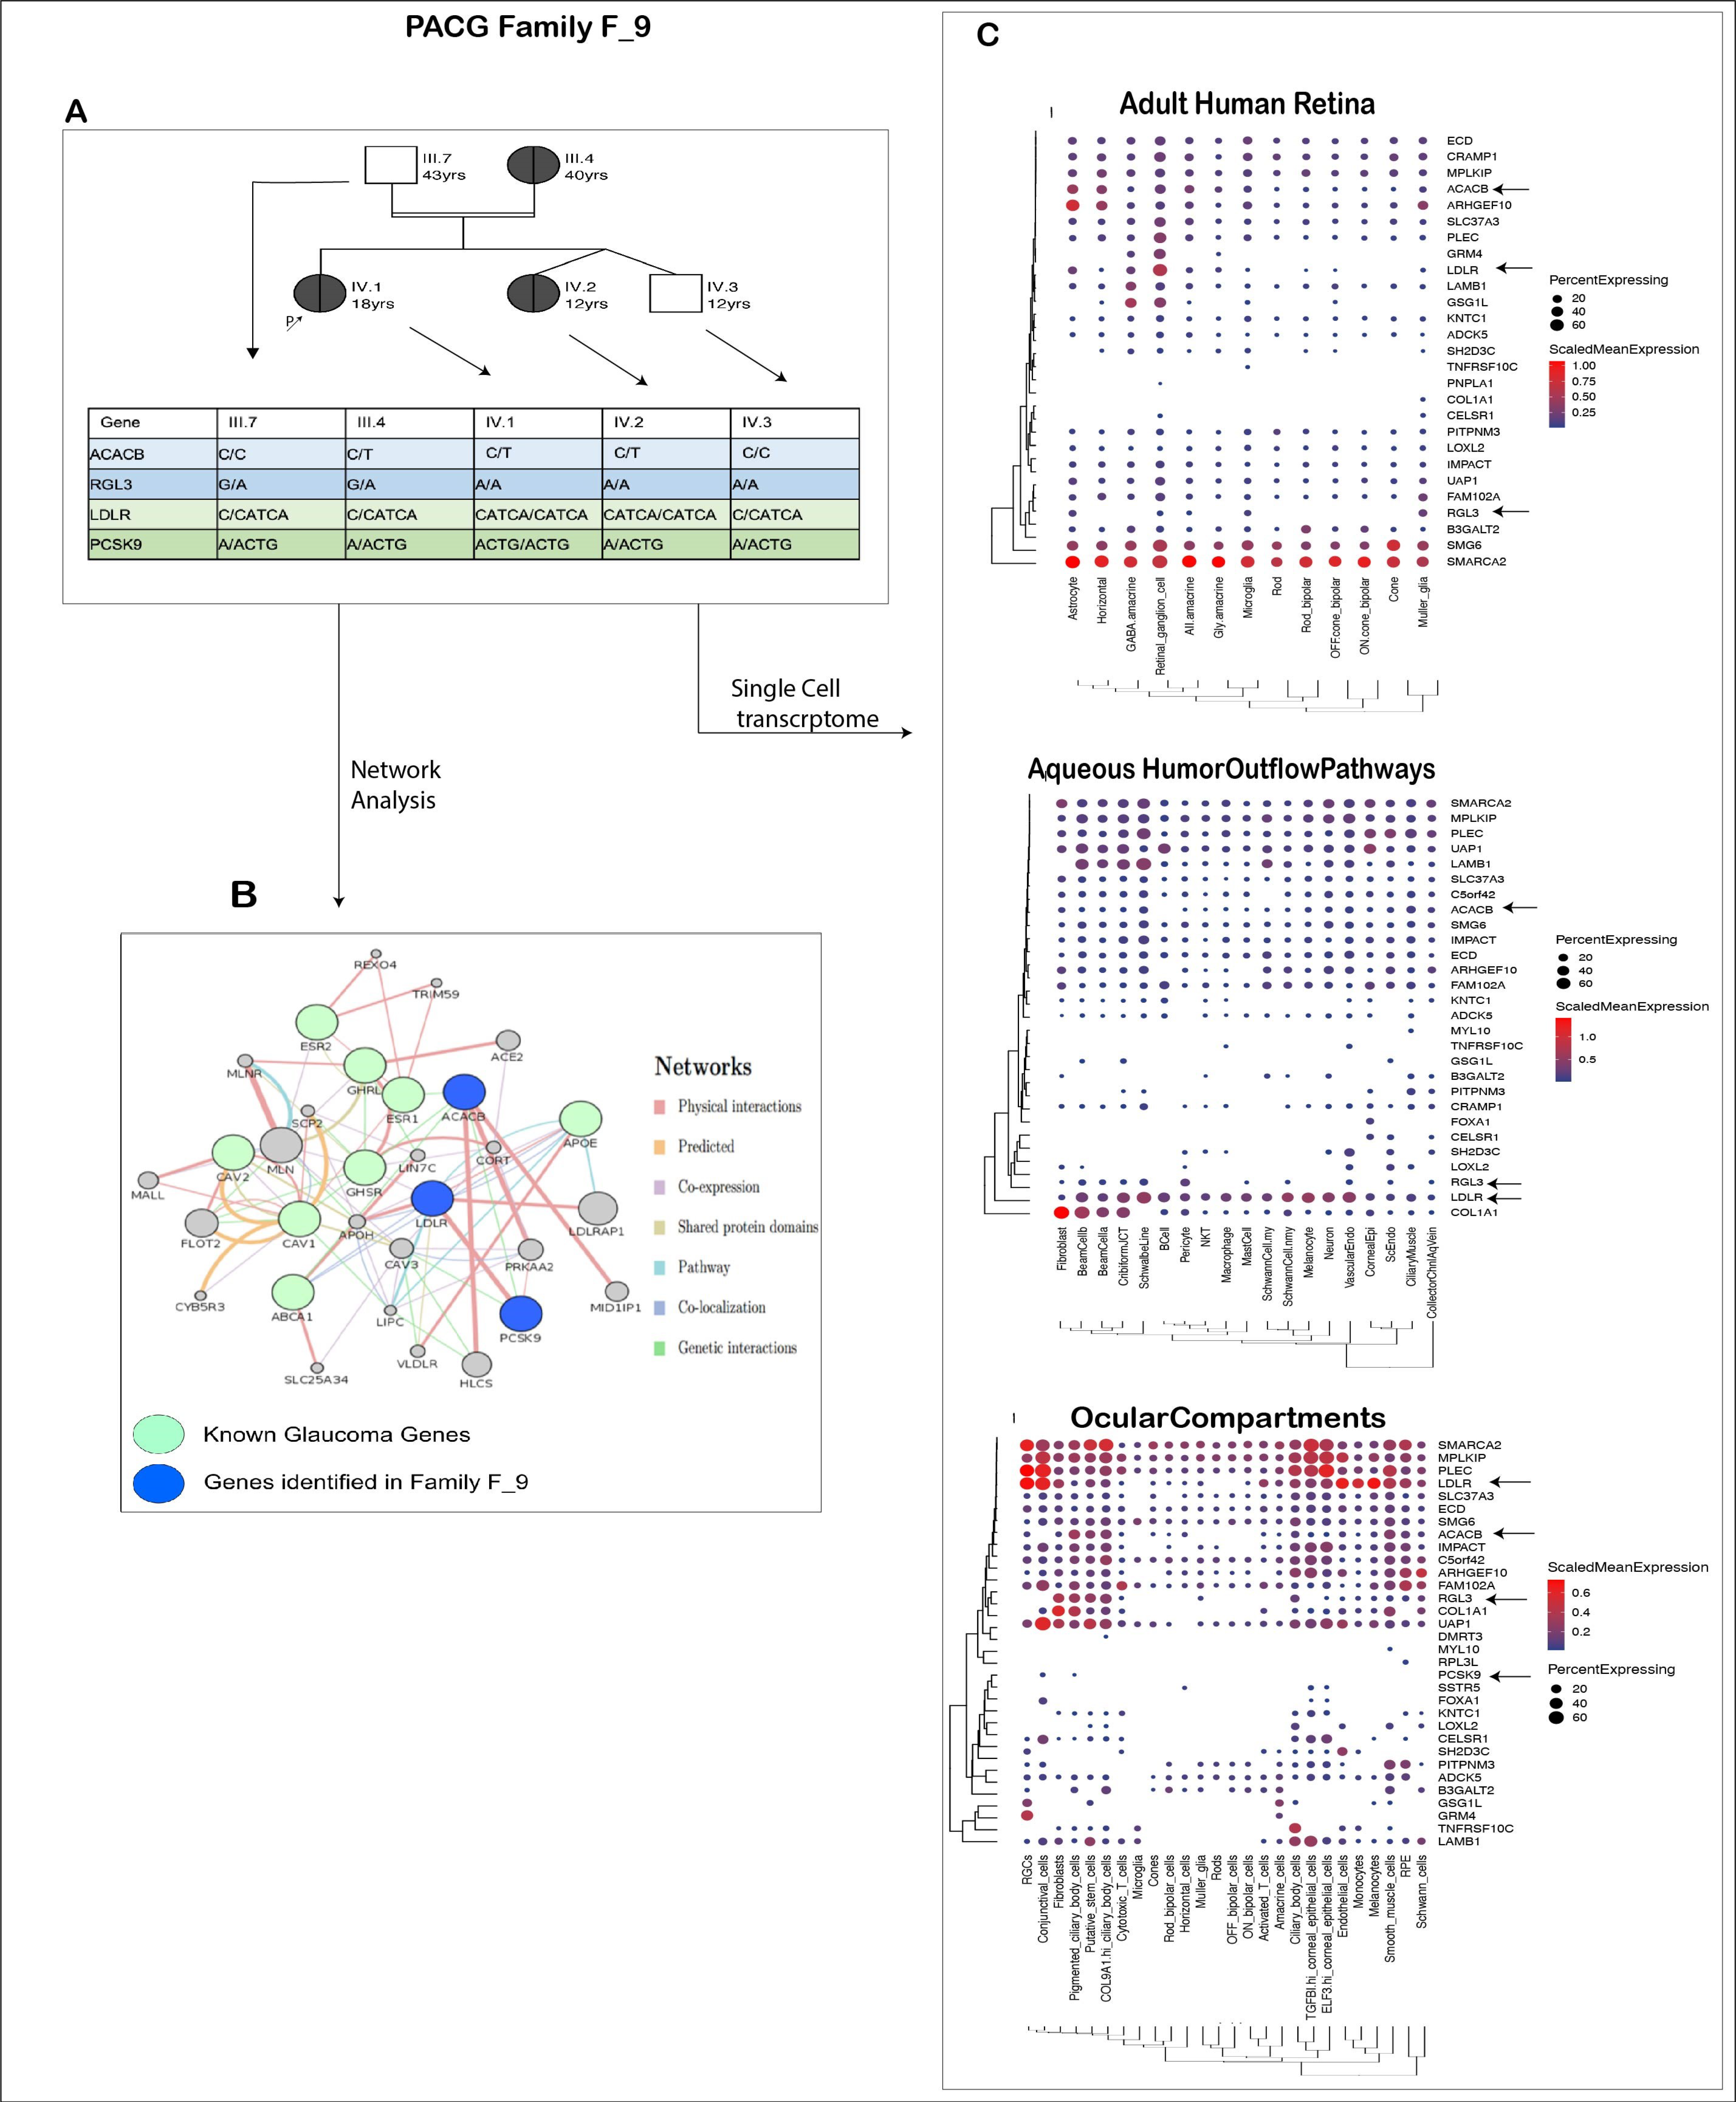
3.6.2. PACG Family: Genetic Basis of Co-Occurrence of PACG and Hypercholesterolemia in F_9
4. Discussion
Supplementary Materials
Author Contributions
Funding
Institutional Review Board Statement
Informed Consent Statement
Data Availability Statement
Acknowledgments
Conflicts of Interest
References
- Tham, Y.-C.; Li, X.; Wong, T.Y.; Quigley, H.A.; Aung, T.; Cheng, C.-Y. Global Prevalence of Glaucoma and Projections of Glaucoma Burden through 2040: A systematic review and meta-analysis. Ophthalmology 2014, 121, 2081–2090. [Google Scholar] [CrossRef] [PubMed]
- Tello, C.; Tran, H.V.; Liebmann, J.; Ritch, R. Angle closure: Classification, concepts, and the role of ultrasound biomicroscopy in diagnosis and treatment. Semin. Ophthalmol. 2002, 17, 69–78. [Google Scholar] [CrossRef]
- Casson, R.J.; Chidlow, G.; Wood, J.P.M.; Crowston, J.G.; Goldberg, I. Definition of glaucoma: Clinical and experimental concepts. Clin. Exp. Ophthalmol. 2012, 40, 341–349. [Google Scholar] [CrossRef]
- Gupta, N.; Weinreb, R.N. New definitions of glaucoma. Curr. Opin. Ophthalmol. 1997, 8, 38–41. [Google Scholar] [CrossRef]
- Kwon, Y.H.; Fingert, J.H.; Kuehn, M.H.; Alward, W.L.M. Primary Open-Angle Glaucoma. N. Engl. J. Med. 2009, 360, 1113–1124. [Google Scholar] [CrossRef]
- Asefa, N.G.; Neustaeter, A.; Jansonius, N.M.; Snieder, H. Heritability of glaucoma and glaucoma-related endophenotypes: Systematic review and meta-analysis. Surv. Ophthalmol. 2019, 64, 835–851. [Google Scholar] [CrossRef] [PubMed]
- He, M.; Wang, D.; Zheng, Y.; Zhang, J.; Yin, Q.; Huang, W.; Mackey, D.A.; Foster, P.J. Heritability of Anterior Chamber Depth as an Intermediate Phenotype of Angle-Closure in Chinese: The Guangzhou Twin Eye Study. Investig. Opthalmology Vis. Sci. 2008, 49, 81–86. [Google Scholar] [CrossRef] [PubMed]
- Gharahkhani, P.; Jorgenson, E.; Hysi, P.; Khawaja, A.P.; Pendergrass, S.; Han, X.; Ong, J.S.; Hewitt, A.W.; Segrè, A.V.; Rouhana, J.M.; et al. Genome-wide meta-analysis identifies 127 open-angle glaucoma loci with consistent effect across ancestries. Nat. Commun. 2021, 12, 1258. [Google Scholar] [CrossRef]
- Zhou, T.; Souzeau, E.; Siggs, O.M.; Landers, J.; Mills, R.; Goldberg, I.; Healey, P.R.; Graham, S.; Hewitt, A.W.; Mackey, D.A.; et al. Contribution of Mutations in Known Mendelian Glaucoma Genes to Advanced Early-Onset Primary Open-Angle Glaucoma. Investig. Opthalmology Vis. Sci. 2017, 58, 1537–1544. [Google Scholar] [CrossRef]
- Huang, X.; Li, M.; Guo, X.; Li, S.; Xiao, X.; Jia, X.; Liu, X.; Zhang, Q. Mutation Analysis of Seven Known Glaucoma-Associated Genes in Chinese Patients With Glaucoma. Investig. Opthalmology Vis. Sci. 2014, 55, 3594–3602. [Google Scholar] [CrossRef] [PubMed]
- Foster, P.J.; Buhrmann, R.; Quigley, H.A.; Johnson, G.J. The definition and classification of glaucoma in prevalence surveys. Br. J. Ophthalmol. 2002, 86, 238–242. [Google Scholar] [CrossRef] [PubMed]
- Banerjee, D.; Banerjee, A.; Mookherjee, S.; Vishal, M.; Mukhopadhyay, A.; Sen, A.; Basu, A.; Ray, K. Mitochondrial Genome Analysis of Primary Open Angle Glaucoma Patients. PLoS ONE 2013, 8, e70760. [Google Scholar] [CrossRef] [PubMed]
- Miller, S.A.; Dykes, D.D.; Polesky, H.F. A simple salting out procedure for extracting DNA from human nucleated cells. Nucleic Acids Res. 1988, 16, 1215. [Google Scholar] [CrossRef]
- Stone, E.M.; Fingert, J.H.; Alward, W.L.M.; Nguyen, T.D.; Polansky, J.R.; Sunden, S.L.F.; Nishimura, D.; Clark, A.F.; Nystuen, A.; Nichols, B.E.; et al. Identification of a Gene That Causes Primary Open Angle Glaucoma. Science 1997, 275, 668–670. [Google Scholar] [CrossRef]
- Alward, W.L.; Fingert, J.H.; Coote, M.A.; Johnson, A.T.; Lerner, S.F.; Junqua, D.; Durcan, F.J.; McCartney, P.J.; Mackey, D.A.; Sheffield, V.C.; et al. Clinical Features Associated with Mutations in the Chromosome 1 Open-Angle Glaucoma Gene (GLC1A). N. Engl. J. Med. 1998, 338, 1022–1027. [Google Scholar] [CrossRef] [PubMed]
- Fingert, J.; Héon, E.; Liebmann, J.M.; Yamamoto, T.; Craig, J.; Rait, J.; Kawase, K.; Hoh, S.-T.; Buys, Y.M.; Dickinson, J.; et al. Analysis of Myocilin Mutations in 1703 Glaucoma Patients From Five Different Populations. Hum. Mol. Genet. 1999, 8, 899–905. [Google Scholar] [CrossRef]
- Faucher, M.; Anctil, J.L.; Rodrigue, M.A.; Duchesne, A.; Bergeron, D.; Blondeau, P.; Cŏté, G.; Dubois, S.; Bergeron, J.; Arseneault, R.; et al. Founder TIGR/myocilin mutations for glaucoma in the Qué bec population. Hum. Mol. Genet. 2002, 11, 2077–2090. [Google Scholar] [CrossRef]
- Mukhopadhyay, A.; Acharya, M.; Mukherjee, S.; Ray, J.; Choudhury, S.; Khan, M.; Ray, K. Mutations in MYOC gene of Indian primary open angle glaucoma patients. Mol. Vis. 2002, 8, 442–448. [Google Scholar]
- Bolger, A.M.; Lohse, M.; Usadel, B. Trimmomatic: A flexible trimmer for Illumina sequence data. Bioinformatics 2014, 30, 2114–2120. [Google Scholar] [CrossRef]
- Li, H.; Durbin, R. Fast and accurate short read alignment with Burrows—Wheeler transform. Bioinformatics 2009, 25, 1754–1760. [Google Scholar] [CrossRef]
- Picard Tools-By Broad Institute. Broad Institute, GitHub Repository. 2018. Available online: http://broadinstitute.github.io/picard/ (accessed on 13 March 2018).
- DePristo, M.A.; Banks, E.; Poplin, R.; Garimella, K.V.; Maguire, J.R.; Hartl, C.; Philippakis, A.A.; Del Angel, G.; Rivas, M.A.; Hanna, M.; et al. A framework for variation discovery and genotyping using next-generation DNA sequencing data. Nat. Genet. 2011, 43, 491–498. [Google Scholar] [CrossRef] [PubMed]
- Wang, K.; Li, M.; Hakonarson, H. ANNOVAR: Functional annotation of genetic variants from high-throughput sequencing data. Nucleic Acids Res. 2010, 38, e164. [Google Scholar] [CrossRef] [PubMed]
- Paila, U.; Chapman, B.A.; Kirchner, R.; Quinlan, A. GEMINI: Integrative Exploration of Genetic Variation and Genome Annotations. PLoS Comput. Biol. 2013, 9, e1003153. [Google Scholar] [CrossRef] [PubMed]
- The 1000 Genomes Project Consortium. A global reference for human genetic variation. Nature 2015, 526, 68–74. [Google Scholar] [CrossRef] [PubMed]
- Lek, M.; Karczewski, K.J.; Minikel, E.V.; Samocha, K.E.; Banks, E.; Fennell, T.; O’Donnell-Luria, A.H.; Ware, J.S.; Hill, A.J.; Cummings, B.B.; et al. Analysis of protein-coding genetic variation in 60,706 humans. Nature 2016, 536, 285–291. [Google Scholar] [CrossRef]
- Kumar, P.; Henikoff, S.; Ng, P.C. Predicting the effects of coding non-synonymous variants on protein function using the SIFT algorithm. Nat. Protoc. 2009, 4, 1073–1081. [Google Scholar] [CrossRef]
- Adzhubei, I.A.; Schmidt, S.; Peshkin, L.; Ramensky, V.E.; Gerasimova, A.; Bork, P.; Kondrashov, A.S.; Sunyaev, S.R. A method and server for predicting damaging missense mutations. Nat. Methods 2010, 7, 248–249. [Google Scholar] [CrossRef]
- Chun, S.; Fay, J.C. Identification of deleterious mutations within three human genomes. Genome Res. 2009, 19, 1553–1561. [Google Scholar] [CrossRef]
- Schwarz, J.M.; Rödelsperger, C.; Schuelke, M.; Seelow, D. MutationTaster evaluates disease-causing potential of sequence alterations. Nat. Methods 2010, 7, 575–576. [Google Scholar] [CrossRef]
- Reva, B.; Antipin, Y.; Sander, C. Predicting the functional impact of protein mutations: Application to cancer genomics. Nucleic Acids Res. 2011, 39, e118. [Google Scholar] [CrossRef]
- Shihab, H.A.; Gough, J.; Cooper, D.N.; Day, I.N.M.; Gaunt, T.R. Predicting the functional consequences of cancer-associated amino acid substitutions. Bioinformatics 2013, 29, 1504–1510. [Google Scholar] [CrossRef] [PubMed]
- Kircher, M.; Witten, D.M.; Jain, P.; O‘Roak, B.J.; Cooper, G.M.; Shendure, J. A general framework for estimating the relative pathogenicity of human genetic variants. Nat. Genet. 2014, 46, 310–315. [Google Scholar] [CrossRef] [PubMed]
- Davydov, E.V.; Goode, D.; Sirota, M.; Cooper, G.M.; Sidow, A.; Batzoglou, S. Identifying a High Fraction of the Human Genome to be under Selective Constraint Using GERP++. PLoS Comput. Biol. 2010, 6, e1001025. [Google Scholar] [CrossRef] [PubMed]
- Cooper, G.M.; Stone, E.A.; Asimenos, G.; NISC Comparative Sequencing Program; Green, E.D.; Batzoglou, S.; Sidow, A. Distribution and intensity of constraint in mammalian genomic sequence. Genome Res. 2005, 15, 901–913. [Google Scholar] [CrossRef] [PubMed]
- Chen, E.Y.; Tan, C.M.; Kou, Y.; Duan, Q.; Wang, Z.; Meirelles, G.V.; Clark, N.R.; Ma’Ayan, A. Enrichr: Interactive and collaborative HTML5 gene list enrichment analysis tool. BMC Bioinform. 2013, 14, 128. [Google Scholar] [CrossRef]
- Kuleshov, M.V.; Jones, M.R.; Rouillard, A.D.; Fernandez, N.F.; Duan, Q.; Wang, Z.; Koplev, S.; Jenkins, S.L.; Jagodnik, K.M.; Lachmann, A.; et al. Enrichr: A comprehensive gene set enrichment analysis web server 2016 update. Nucleic Acids Res. 2016, 44, W90–W97. [Google Scholar] [CrossRef]
- Bindea, G.; Galon, J.; Mlecnik, B. CluePedia Cytoscape plugin: Pathway insights using integrated experimental and in silico data. Bioinformatics 2013, 29, 661–663. [Google Scholar] [CrossRef]
- Shannon, P.; Markiel, A.; Ozier, O.; Baliga, N.S.; Wang, J.T.; Ramage, D.; Amin, N.; Schwikowski, B.; Ideker, T. Cytoscape: A software environment for integrated models of Biomolecular Interaction Networks. Genome Res. 2003, 13, 2498–2504. [Google Scholar] [CrossRef]
- Wang, S.K.; Nair, S.; Li, R.; Kraft, K.; Pampari, A.; Patel, A.; Kang, J.B.; Luong, C.; Kundaje, A.; Chang, H.Y. Single-cell multiome of the human retina and deep learning nominate causal variants in complex eye diseases. Cell Genom. 2022, 2, 100164. [Google Scholar] [CrossRef]
- Gautam, P.; Hamashima, K.; Chen, Y.; Zeng, Y.; Bar Makovoz, B.; Parikh, B.H.; Lee, H.Y.; Lau, K.A.; Su, X.; Wong, R.C.B.; et al. Multi-species single-cell transcriptomic analysis of ocular compartment regulons. Nat. Commun. 2021, 12, 5675. [Google Scholar] [CrossRef]
- van Zyl, T.; Yan, W.; McAdams, A.; Peng, Y.-R.; Shekhar, K.; Regev, A.; Juric, D.; Sanes, J.R. Cell atlas of aqueous humor outflow pathways in eyes of humans and four model species provides insight into glaucoma pathogenesis. Proc. Natl. Acad. Sci. USA 2020, 117, 10339–10349. [Google Scholar] [CrossRef] [PubMed]
- Kassambara, A. ggpubr: ‘ggplot2’ Based Publication Ready Plots. Available online: https://cran.r-project.org/web/packages/ggpubr/index.html (accessed on 27 June 2020).
- Kirwan, R.P.; Wordinger, R.J.; Clark, A.F.; O’Brien, C.J. Differential global and extra-cellular matrix focused gene expression patterns between normal and glaucomatous human lamina cribrosa cells. Mol. Vis. 2009, 15, 76–88. [Google Scholar] [PubMed]
- Jiang, B.; Harper, M.M.; Kecova, H.; Adamus, G.; Kardon, R.H.; Grozdanic, S.D.; Kuehn, M.H. Neuroinflammation in advanced canine glaucoma. Mol. Vis. 2010, 16, 2092–2108. [Google Scholar]
- Chuang, J.-H.; Yarmishyn, A.A.; Hwang, D.-K.; Hsu, C.-C.; Wang, M.-L.; Yang, Y.-P.; Chien, K.-H.; Chiou, S.-H.; Peng, C.-H.; Chen, S.-J. Expression profiling of cell-intrinsic regulators in the process of differentiation of human iPSCs into retinal lineages. Stem Cell Res. Ther. 2018, 9, 140. [Google Scholar] [CrossRef]
- Weisschuh, N.; Alavi, M.V.; Bonin, M.; Wissinger, B. Identification of genes that are linked with optineurin expression using a combined RNAi–microarray approach. Exp. Eye Res. 2007, 85, 450–461. [Google Scholar] [CrossRef]
- Joe, M.K.; Kwon, H.S.; Cojocaru, R.; Tomarev, S.I. Myocilin Regulates Cell Proliferation and Survival. J. Biol. Chem. 2014, 289, 10155–10167. [Google Scholar] [CrossRef]
- Steele, M.R.; Inman, D.; Calkins, D.J.; Horner, P.J.; Vetter, M.L. Microarray Analysis of Retinal Gene Expression in the DBA/2J Model of Glaucoma. Investig. Opthalmology Vis. Sci. 2006, 47, 977–985. [Google Scholar] [CrossRef] [PubMed]
- He, S.; Park, Y.H.; Yorio, T.; Krishnamoorthy, R.R. Endothelin-Mediated Changes in Gene Expression in Isolated Purified Rat Retinal Ganglion Cells. Investig. Opthalmology Vis. Sci. 2015, 56, 6144–6161. [Google Scholar] [CrossRef]
- Howell, G.R.; Macalinao, D.G.; Sousa, G.L.; Walden, M.; Soto, I.; Kneeland, S.C.; Barbay, J.M.; King, B.L.; Marchant, J.K.; Hibbs, M.; et al. Molecular clustering identifies complement and endothelin induction as early events in a mouse model of glaucoma. J. Clin. Investig. 2011, 121, 1429–1444. [Google Scholar] [CrossRef] [PubMed]
- Lukas, T.J.; Miao, H.; Chen, L.; Riordan, S.M.; Li, W.; Crabb, A.M.; Wise, A.; Du, P.; Lin, S.M.; Hernandez, M.R. Susceptibility to glaucoma: Differential comparison of the astrocyte transcriptome from glaucomatous African American and Caucasian American donors. Genome Biol. 2008, 9, R111. [Google Scholar] [CrossRef]
- Nikolskaya, T.; Nikolsky, Y.; Serebryiskaya, T.; Zvereva, S.; Sviridov, E.; Dezso, Z.; Rahkmatulin, E.; Brennan, R.J.; Yankovsky, N.; Bhattacharya, S.K.; et al. Network analysis of human glaucomatous optic nerve head astrocytes. BMC Med Genom. 2009, 2, 24. [Google Scholar] [CrossRef] [PubMed]
- Davis, S.; Meltzer, P.S. GEOquery: A bridge between the Gene Expression Omnibus (GEO) and BioConductor. Bioinformatics 2007, 23, 1846–1847. [Google Scholar] [CrossRef] [PubMed]
- Gautier, L.; Cope, L.; Bolstad, B.M.; Irizarry, R.A. affy--analysis of Affymetrix GeneChip data at the probe level. Bioinformatics 2004, 20, 307–315. [Google Scholar] [CrossRef] [PubMed]
- Ritchie, M.E.; Phipson, B.; Wu, D.; Hu, Y.; Law, C.W.; Shi, W.; Smyth, G.K. limma powers differential expression analyses for RNA-sequencing and microarray studies. Nucleic Acids Res. 2015, 43, e47. [Google Scholar] [CrossRef]
- Jia, L.-Y.; Tam, P.O.-S.; Chiang, S.W.-Y.; Ding, N.; Chen, L.J.; Yam, G.H.-F.; Pang, C.-P.; Wang, N.-L. Multiple gene polymorphisms analysis revealed a different profile of genetic polymorphisms of primary open-angle glaucoma in northern Chinese. Mol. Vis. 2009, 15, 89–98. [Google Scholar]
- Pang, C.P.; Fan, B.J.; Canlas, O.; Wang, D.Y.; Dubois, S.; Tam, P.O.S.; Lam, D.S.C.; Raymond, V.; Ritch, R. A genome-wide scan maps a novel juvenile-onset primary open angle glaucoma locus to chromosome 5q. Mol. Vis. 2006, 12, 85–92. [Google Scholar] [PubMed]
- Fan, B.J.; Ko, W.C.; Wang, D.Y.; Canlas, O.; Ritch, R.; Lam, D.S.C.; Pang, C.P. Fine mapping of new glaucoma locus GLC1M and exclusion of neuregulin 2 as the causative gene. Mol. Vis. 2007, 13, 779–784. [Google Scholar] [PubMed]
- Hollander, A.I.D.; van Lith-Verhoeven, J.J.C.; Kersten, F.F.J.; Heister, J.G.A.M.; de Kovel, C.G.F.; Deutman, A.F.; Hoyng, C.B.; Cremers, F.P.M. Identification of novel locus for autosomal dominant butterfly shaped macular dystrophy on 5q21.2-q33.2. J. Med Genet. 2004, 41, 699–702. [Google Scholar] [CrossRef] [PubMed]
- Shimajiri, Y.; Sanke, T.; Furuta, H.; Hanabusa, T.; Nakagawa, T.; Fujitani, Y.; Kajimoto, Y.; Takasu, N.; Nanjo, K. A Missense Mutation of Pax4 Gene (R121W) Is Associated With Type 2 Diabetes in Japanese. Diabetes 2001, 50, 2864–2869. [Google Scholar] [CrossRef]
- Kanatsuka, A.; Tokuyama, Y.; Nozaki, O.; Matsui, K.; Egashira, T. [beta]-cell dysfunction in late-onset diabetic subjects carrying homozygous mutation in transcription factors NeuroD1 and Pax4. Metabolism 2002, 51, 1161–1165. [Google Scholar] [CrossRef]
- Danford, I.D.; Verkuil, L.D.; Choi, D.J.; Collins, D.W.; Gudiseva, H.V.; Uyhazi, K.E.; Lau, M.K.; Kanu, L.N.; Grant, G.R.; Chavali, V.R.; et al. Characterizing the “POAGome”: A bioinformatics-driven approach to primary open-angle glaucoma. Prog. Retin. Eye Res. 2017, 58, 89–114. [Google Scholar] [CrossRef] [PubMed]
- Janssen, S.F.; Gorgels, T.G.; Ramdas, W.D.; Klaver, C.C.; van Duijn, C.M.; Jansonius, N.M.; Bergen, A.A. The vast complexity of primary open angle glaucoma: Disease genes, risks, molecular mechanisms and pathobiology. Prog. Retin. Eye Res. 2013, 37, 31–67. [Google Scholar] [CrossRef]
- Gemenetzi, M.; Yang, Y.; Lotery, A.J. Current concepts on primary open-angle glaucoma genetics: A contribution to disease pathophysiology and future treatment. Eye 2012, 26, 355–369. [Google Scholar] [CrossRef] [PubMed]
- Greco, A.; Rizzo, M.I.; De Virgilio, A.; Gallo, A.; Fusconi, M.; de Vincentiis, M. Emerging Concepts in Glaucoma and Review of the Literature. Am. J. Med. 2016, 129, 1000.e7–1000.e13. [Google Scholar] [CrossRef]
- Burgess, L.G.; Uppal, K.; Walker, D.I.; Roberson, R.M.; Tran, V.; Parks, M.B.; Wade, E.A.; May, A.T.; Umfress, A.C.; Jarrell, K.L.; et al. Metabolome-Wide Association Study of Primary Open Angle Glaucoma. Investig. Opthalmology Vis. Sci. 2015, 56, 5020–5028. [Google Scholar] [CrossRef]
- Wang, S.; Xu, L.; Jonas, J.B.; Wang, Y.X.; You, Q.S.; Yang, H. Dyslipidemia and Eye Diseases in the Adult Chinese Population: The Beijing Eye Study. PLoS ONE 2012, 7, e26871. [Google Scholar] [CrossRef]
- Kashiwagi, E.; Masuno, K.; Fujisawa, K.; Matsushima, S.; Torii, M.; Takasu, N. Glaucoma in a New Zealand White Rabbit Fed High-cholesterol Diet. J. Toxicol. Pathol. 2012, 25, 51–53. [Google Scholar] [CrossRef] [PubMed][Green Version]
- McCann, P.; Hogg, R.E.; Fallis, R.; Azuara-Blanco, A. The Effect of Statins on Intraocular Pressure and on the Incidence and Progression of Glaucoma: A Systematic Review and Meta-Analysis. Investig. Opthalmology Vis. Sci. 2016, 57, 2729. [Google Scholar] [CrossRef]
- Gharahkhani, P.; Burdon, K.; Fogarty, R.; Sharma, S.; Hewitt, A.; Martin, S.; Law, M.H.; Cremin, K.; Bailey, J.C.; Loomis, S.J.; et al. Common variants near ABCA1, AFAP1 and GMDS confer risk of primary open-angle glaucoma. Nat. Genet. 2014, 46, 1120–1125. [Google Scholar] [CrossRef]
- Chen, Y.; Lin, Y.; Vithana, E.N.; Jia, L.; Zuo, X.; Wong, T.Y.; Chen, L.J.; Zhu, X.; Tam, P.O.S.; Gong, B.; et al. Common variants near ABCA1 and in PMM2 are associated with primary open-angle glaucoma. Nat. Genet. 2014, 46, 1115–1119. [Google Scholar] [CrossRef]
- Liao, R.; Ye, M.; Xu, X. An updated meta-analysis: Apolipoprotein E genotypes and risk of primary open-angle glaucoma. Mol. Vis. 2014, 20, 1025–1036. [Google Scholar]
- Thorleifsson, G.; Walters, G.B.; Hewitt, A.; Masson, G.; Helgason, A.; DeWan, A.; Sigurdsson, A.; Jonasdottir, A.; Gudjonsson, S.A.; Magnússon, K.P.; et al. Common variants near CAV1 and CAV2 are associated with primary open-angle glaucoma. Nat. Genet. 2010, 42, 906–909. [Google Scholar] [CrossRef] [PubMed]
- Aung, T.; Ocaka, L.; Ebenezer, N.D.; Morris, A.G.; Brice, G.; Child, A.H.; Hitchings, R.A.; Lehmann, O.J.; Bhattacharya, S.S. Investigating the association between OPA1 polymorphisms and glaucoma: Comparison between normal tension and high tension primary open angle glaucoma. Hum. Genet. 2002, 110, 513–514. [Google Scholar] [CrossRef] [PubMed]
- Stoilov, I.; Akarsu, A.N.; Sarfarazi, M. Identification of three different truncating mutations in cytochrome P4501B1 (CYP1B1) as the principal cause of primary congenital glaucoma (Buphthalmos) in families linked to the GLC3A locus on chromosome 2p21. Hum. Mol. Genet. 1997, 6, 641–647. [Google Scholar] [CrossRef] [PubMed]
- Li, Y.; Semaan, S.J.; Schlamp, C.L.; Nickells, R.W. Dominant inheritance of retinal ganglion cell resistance to optic nerve crush in mice. BMC Neurosci. 2007, 8, 19. [Google Scholar] [CrossRef]
- Dietz, J.A.; Maes, M.E.; Huang, S.; Yandell, B.S.; Schlamp, C.L.; Montgomery, A.D.; Allingham, R.R.; Hauser, M.A.; Nickells, R.W. Spink2 Modulates Apoptotic Susceptibility and Is a Candidate Gene in the Rgcs1 QTL That Affects Retinal Ganglion Cell Death after Optic Nerve Damage. PLoS ONE 2014, 9, e93564. [Google Scholar] [CrossRef]
- Kass, M.A.; Heuer, D.K.; Higginbotham, E.J.; Johnson, C.A.; Keltner, J.L.; Miller, J.P.; Parrish, R.K.; Wilson, M.R.; Gordon, M.O.; Ocular Hypertension Treatment Study Group. The Ocular Hypertension Treatment Study: A randomized trial determines that topical ocular hypotensive medication delays or prevents the onset of primary open-angle glaucoma. Arch. Ophthalmol. 2002, 120, 701–713, discussion 829–830. [Google Scholar] [CrossRef]
- Heijl, A.; Leske, M.C.; Bengtsson, B.; Hyman, L.; Bengtsson, B.; Hussein, M. and Early Manifest Glaucoma Trial Group. Reduction of intraocular pressure and glaucoma progression: Results from the Early Manifest Glaucoma Trial. Arch. Ophthalmol. 2002, 120, 1268–1279. [Google Scholar] [CrossRef]
- Johnson, E.C.; Morrison, J.C. Friend or Foe? Resolving the Impact of Glial Responses in Glaucoma. Eur. J. Gastroenterol. Hepatol. 2009, 18, 341–353. [Google Scholar] [CrossRef]
- Pasutto, F.; Matsumoto, T.; Mardin, C.Y.; Sticht, H.; Brandstätter, J.H.; Michels-Rautenstrauss, K.; Weisschuh, N.; Gramer, E.; Ramdas, W.D.; van Koolwijk, L.M.; et al. Heterozygous NTF4 Mutations Impairing Neurotrophin-4 Signaling in Patients with Primary Open-Angle Glaucoma. Am. J. Hum. Genet. 2009, 85, 447–456. [Google Scholar] [CrossRef] [PubMed]
- Libby, R.T.; Gould, D.B.; Anderson, M.G.; John, S.W. COMPLEX GENETICS OF GLAUCOMA SUSCEPTIBILITY. Annu. Rev. Genom. Hum. Genet. 2005, 6, 15–44. [Google Scholar] [CrossRef] [PubMed]
- Vranka, J.A.; Kelley, M.J.; Acott, T.S.; Keller, K.E. Extracellular matrix in the trabecular meshwork: Intraocular pressure regulation and dysregulation in glaucoma. Exp. Eye Res. 2015, 133, 112–125. [Google Scholar] [CrossRef] [PubMed]
- Zhu, G.; Wu, C.-J.; Zhao, Y.; Ashwell, J.D. Optineurin Negatively Regulates TNFα- Induced NF-κB Activation by Competing with NEMO for Ubiquitinated RIP. Curr. Biol. 2007, 17, 1438–1443. [Google Scholar] [CrossRef] [PubMed]
- Zanzoni, A.; Chapple, C.E.; Brun, C. Relationships between predicted moonlighting proteins, human diseases, and comorbidities from a network perspective. Front. Physiol. 2015, 6, 171. [Google Scholar] [CrossRef]
- Demetrius, L.A.; Magistretti, P.J.; Epellerin, L. Alzheimer’s disease: The amyloid hypothesis and the Inverse Warburg effect. Front. Physiol. 2015, 5, 522. [Google Scholar] [CrossRef]
- Wändell, P.; Carlsson, A.C.; Ljunggren, G. Systemic diseases and their association with open-angle glaucoma in the population of Stockholm. Int. Ophthalmol. 2022, 42, 1481–1489. [Google Scholar] [CrossRef]
- Yasuda, M.; Tanaka, Y.; Nishiguchi, K.M.; Ryu, M.; Tsuda, S.; Maruyama, K.; Nakazawa, T. Retinal transcriptome profiling at transcription start sites: A cap analysis of gene expression early after axonal injury. BMC Genom. 2014, 15, 1–15. [Google Scholar] [CrossRef]
- Kim, K.-H. REGULATION OF MAMMALIAN ACETYL-COENZYME A CARBOXYLASE. Annu. Rev. Nutr. 1997, 17, 77–99. [Google Scholar] [CrossRef]
- Boone, A.; Brownsey, R.; Elliott, J.; Kulpa, J.; Lee, W. Regulation of acetyl-CoA carboxylase. Biochem. Soc. Trans. 2006, 34, 223–227. [Google Scholar] [CrossRef]
- Brown, M.S.; Goldstein, J.L. A receptor-mediated pathway for cholesterol homeostasis. Science 1986, 232, 34–47. [Google Scholar] [CrossRef] [PubMed]
- Abifadel, M.; Varret, M.; Rabès, J.-P.; Allard, D.; Ouguerram, K.; Devillers, M.; Cruaud, C.; Benjannet, S.; Wickham, L.; Erlich, D.; et al. Mutations in PCSK9 cause autosomal dominant hypercholesterolemia. Nat. Genet. 2003, 34, 154–156. [Google Scholar] [CrossRef] [PubMed]
- Horton, J.D.; Cohen, J.C.; Hobbs, H.H. PCSK9: A convertase that coordinates LDL catabolism. J. Lipid Res. 2009, 50, S172–S177. [Google Scholar] [CrossRef]
- Domenici, L.; Origlia, N.; Falsini, B.; Cerri, E.; Barloscio, D.; Fabiani, C.; Sansò, M.; Giovannini, L. Rescue of Retinal Function by BDNF in a Mouse Model of Glaucoma. PLoS ONE 2014, 9, e115579. [Google Scholar] [CrossRef] [PubMed]
- Galindo-Romero, C.; Valiente-Soriano, F.J.; Jiménez-López, M.; García-Ayuso, D.; Villegas-Pérez, M.P.; Vidal-Sanz, M.; Agudo-Barriuso, M. Effect of Brain-Derived Neurotrophic Factor on Mouse Axotomized Retinal Ganglion Cells and Phagocytic Microglia. Investig. Opthalmology Vis. Sci. 2013, 54, 974–985. [Google Scholar] [CrossRef] [PubMed]
- Roh, M.; Zhang, Y.; Murakami, Y.; Thanos, A.; Lee, S.C.; Vavvas, D.G.; Benowitz, L.I.; Miller, J.W. Etanercept, a Widely Used Inhibitor of Tumor Necrosis Factor-α (TNF- α), Prevents Retinal Ganglion Cell Loss in a Rat Model of Glaucoma. PLoS ONE 2012, 7, e40065. [Google Scholar] [CrossRef]


Disclaimer/Publisher’s Note: The statements, opinions and data contained in all publications are solely those of the individual author(s) and contributor(s) and not of MDPI and/or the editor(s). MDPI and/or the editor(s) disclaim responsibility for any injury to people or property resulting from any ideas, methods, instructions or products referred to in the content. |
© 2023 by the authors. Licensee MDPI, Basel, Switzerland. This article is an open access article distributed under the terms and conditions of the Creative Commons Attribution (CC BY) license (https://creativecommons.org/licenses/by/4.0/).
Share and Cite
Narta, K.; Teltumbade, M.R.; Vishal, M.; Sadaf, S.; Faruq, M.; Jama, H.; Waseem, N.; Rao, A.; Sen, A.; Ray, K.; et al. Whole Exome Sequencing Reveals Novel Candidate Genes in Familial Forms of Glaucomatous Neurodegeneration. Genes 2023, 14, 495. https://doi.org/10.3390/genes14020495
Narta K, Teltumbade MR, Vishal M, Sadaf S, Faruq M, Jama H, Waseem N, Rao A, Sen A, Ray K, et al. Whole Exome Sequencing Reveals Novel Candidate Genes in Familial Forms of Glaucomatous Neurodegeneration. Genes. 2023; 14(2):495. https://doi.org/10.3390/genes14020495
Chicago/Turabian StyleNarta, Kiran, Manoj Ramesh Teltumbade, Mansi Vishal, Samreen Sadaf, Mohd. Faruq, Hodan Jama, Naushin Waseem, Aparna Rao, Abhijit Sen, Kunal Ray, and et al. 2023. "Whole Exome Sequencing Reveals Novel Candidate Genes in Familial Forms of Glaucomatous Neurodegeneration" Genes 14, no. 2: 495. https://doi.org/10.3390/genes14020495
APA StyleNarta, K., Teltumbade, M. R., Vishal, M., Sadaf, S., Faruq, M., Jama, H., Waseem, N., Rao, A., Sen, A., Ray, K., & Mukhopadhyay, A. (2023). Whole Exome Sequencing Reveals Novel Candidate Genes in Familial Forms of Glaucomatous Neurodegeneration. Genes, 14(2), 495. https://doi.org/10.3390/genes14020495