Article

The Identification of the Banana Endogenous Reference Gene MaSPS1 and the Construction of Qualitative and Quantitative PCR Detection Methods

1
College of Life Sciences, South China Agricultural University, Guangzhou 510642, China
2
College of Agriculture & Biology, Zhongkai University of Agriculture and Engineering, Guangzhou 510225, China
3
Institute of Fruit Tree Research, Guangdong Academy of Agricultural Sciences, Guangzhou 510640, China
*
Authors to whom correspondence should be addressed.
These authors contributed equally to this work.
Genes 2023, 14(12), 2116; https://doi.org/10.3390/genes14122116
Submission received: 29 October 2023 / Revised: 18 November 2023 / Accepted: 22 November 2023 / Published: 23 November 2023
(This article belongs to the Special Issue Genetically Modified Organisms (GMO) Biosafety)

Abstract

:
Endogenous reference genes play a crucial role in the qualitative and quantitative PCR detection of genetically modified crops. Currently, there are no systematic studies on the banana endogenous reference gene. In this study, the MaSPS1 gene was identified as a candidate gene through bioinformatics analysis. The conservation of this gene in different genotypes of banana was tested using PCR, and its specificity in various crops and fruits was also examined. Southern blot analysis showed that there is only one copy of MaSPS1 in banana. The limit of detection (LOD) test showed that the LOD of the conventional PCR method is approximately 20 copies. The real-time fluorescence quantitative PCR (qPCR) method also exhibited high specificity, with a LOD of approximately 10 copies. The standard curve of the qPCR method met the quantitative requirements, with a limit of quantification (LOQ) of 1.14 × 10⁻² ng—about 20 copies. Also, the qPCR method demonstrated good repeatability and stability. Hence, the above results indicate that the detection method established in this study has strong specificity, a low detection limit, and good stability. It provides a reliable qualitative and quantitative detection system for banana.

1. Introduction

Banana (Musa paradisiaca) is one of the world’s most important fruits and the fourth-largest food crop globally [1]. It is highly nutritious, has a high yield, and is widely popular [2]. During the growth and development of bananas, they are subjected to various biotic and abiotic stresses that can reduce their yield and quality [3]. Among the biotic stresses, Fusarium wilt is currently the most harmful disease to production. This disease is caused by the specialized strain of Fusarium oxysporum f. sp. Cubense [4]. Currently, there are no effective methods for its prevention and control during planting. To solve the challenge posed by Fusarium wilt, genetic engineering techniques, including gene-editing technologies, are considered viable options [5]. There have been multiple reports that genetically modified (GM) bananas show enhanced resistance to biotic and abiotic stresses [6,7].
In April 2023, the Philippines officially exempted gene-edited bananas resistant to browning in their regular banana varieties. This will further promote the commercialization process of GM bananas worldwide. To protect consumers’ right to know and choose, it is essential to label GM products. The first step in labeling bananas involves the detection of GM components. This requires the identification of a highly species-specific and low-copy endogenous reference gene [8]. An endogenous reference gene refers to a conserved DNA sequence with species specificity and a steady copy number that does not exhibit allelic variation [9]. With an endogenous reference gene, we can determine the presence of GM components, the percentage of GM components in a test sample, and the copy number of the sequence in the genome [10,11]. The percentage of GM is calculated as a ratio of the specific GM target with respect to an endogenous reference gene [10]. Therefore, endogenous reference genes are indispensable in GM crop research and detection [12]. To date, there have been no reports on qualitative and quantitative PCR detection methods for endogenous reference genes in banana.
To obtain a suitable endogenous reference gene for banana, this study focused on Sucrose phosphate synthase 1 (MaSPS1, GenBank NO. HG996469). We sequenced the MaSPS1 gene in different banana genotypes to compare its stability in different genomic types and determined its copy number through Southern blot analysis. The species specificity of MaSPS1 was tested using commercialized GM crops and fruit plants. Primers and probes of MaSPS1 were designed and tested for the establishment of a qualitative and quantitative PCR detection method. The limit of detection (LOD) of the qualitative method reached 1.14 × 10⁻² ng, while the quantitative PCR had a LOD of 5.70 × 10⁻³ ng, with a limit of quantification (LOQ) of 1.14 × 10⁻² ng. In summary, we identified MaSPS1 as an endogenous reference gene for banana and established qualitative and quantitative PCR detection methods for the detection of GM banana samples.

2. Materials and Methods

2.1. Experimental Materials

The different genome types of banana materials, Malaccensis (genotype AA), Brazilian banana (genotype AAA), FHIA-04 (genotype AAAA), French Sombre (genotype AAB), FHIA-21 (genotype AAAB), Musa ABB Pisang Awak (genotype ABB), Musa acuminata (genotype AA), Guangxi hongjiao (genotype AAA), and CB5 (genotype AAB), were provided by Dr. Ou Sheng (Institute of Fruit Tree Research, Guangdong Academy of Agricultural Sciences). Rapeseed (Brassica napus, genome AACC), rice (Oryza sativa), papaya (Carica Papaya), maize (Zea mays), soybean (Glycine max), cotton (Gossypium hirsutum), wheat (Triticum aestivum), mango (Mangifera indica), pomelo (Citrus maxima), green jujube (Ziziphus mauritiana), lemon (Citrus limon), orange (Citrus reticulata Blanco), jackfruit (Artocarpus heterophyllus), watermelon (Citrullus lanatus), and others were supplied by our laboratory.

2.2. DNA Extraction and Purification

A DNA secure Plant Kit (TIANGEN BIOTECH (BEIJING) Co., Ltd., Beijing, China) was used for total DNA extraction from the plant materials. The DNA concentration and purity were evaluated using a spectrophotometer (Eppendorf, Germany) combined with agarose gel electrophoresis.

2.3. Primers and Probes

The candidate banana endogenous reference gene, MaSPS1, was obtained through database analysis and a literature review. Primers and TaqMan probes were designed using Primer Express software version 2.0 (Applied Biosystems, Foster City, CA, USA) for MaSPS1-specific sequences (Table 1), which were synthesized by Sangon Biotech (Shanghai) Co. Ltd., Shanghai, China.

2.4. MaSPS1 Sequence Analysis

Five different genotypes of banana varieties, M. acuminata (AA), Guangxi hongjiao (AAA), CB5 (AAB), Musa ABB Pisang Awak (ABB), and FHIA-21 (AAAB), were selected for amplification and sequencing with the primers SPS-1F and SPS-1R, and the sequences of the amplified MaSPS1 gene of the five banana varieties were comparatively analyzed using SnapGene software.

2.5. MaSPS1 Genome Copy Number Analysis

A total of nine banana materials, as introduced in Section 2.1, were selected for Southern blot analysis. Based on the DNA sequence analysis, the restriction endonucleases BamH I and EcoR I (Takara Bio Inc., Kusatsu-Shiga, Japan), which are absent in this sequence, were selected to digest 3 µg of total genome DNA. The DIG High Prime DNA Labeling and Detection Starter Kit II for probe labeling (item number: 11585614910, Roche, Sigma-Aldrich (Shanghai, China)) was selected. The detailed roots were measured following the previously described method [13].

2.6. PCR Amplification Methods

Conventional PCR amplification was performed on a PCR instrument (T100TM Thermal Cycler, Bio-Rad, Hercules, CA, USA) in a final volume of 25 µL prepared as follows: 50 ng of the DNA template, 1 U of TaqTM HS DNA polymerase (Takara Bio Inc.), 0.5 µmol/L of each of the forward and reverse primers, and 0.2 mmol/L of the dNTP Mixture (Takara Bio Inc.). The amplification steps were as follows: pre-denaturation at 95 °C for 2 min, 35 cycles of denaturation at 95 °C for 30 s, annealing at 56 °C for 30 s, extension at 72 °C for 30 s, and a final extension at 72 °C for 10 min.
Real-time fluorescence quantitative PCR (qPCR) amplification was performed on a PCR instrument (CFX ConnectTM Real-Time PCR Detection System, Bio-Rad, USA) in a final volume of 20 µL prepared as follows: 2× TaKaRa Premix Ex TaqTM (Probe qPCR), 50 ng of the DNA template, 0.4 µmol/L of each of the forward and reverse primers, and 0.2 µmol/L of the probe. The amplification program was as follows: pre-denaturation at 95 °C for 3 min, 40 cycles of denaturation at 95 °C for 15 s, and annealing at 59 °C for 60 s (with the collection of fluorescence signals after annealing at 59 °C).

2.7. Specificity Detection of MaSPS1

The PCR templates for MaSPS1 specificity detection included banana, Musa ABB Pisang Awak, and seven common crops such as rapeseed, rice, papaya, maize, soybean, cotton, and wheat, as well as thirteen common fruits such as mango, pomelo, green jujube, lemon, orange, jackfruit, watermelon, wax apple, pear, grape, peach, cantaloupe, and strawberry. The samples for the specificity tests included Malaccensis, Brazilian banana, FHIA-04, French Sombre, FHIA-21, Musa ABB Pisang Awak, M. acuminata, Guangxi hongjiao, and CB5.

2.8. Limit of Detection Test for MaSPS1

In the limit of detection test for MaSPS1 as an endogenous reference gene, 5.70, 5.70 × 10⁻¹, 1.14 × 10⁻¹, 5.70 × 10⁻², 2.85 × 10⁻², 1.14 × 10⁻², 5.70 × 10⁻³, 2.85 × 10⁻³, and 1.43 × 10⁻³ ng of banana genomic DNA were added to each PCR reaction, respectively.

2.9. Standard Curve Construction and Limit of Quantification Test for qPCR

In the standard curve construction of qPCR, the banana genomic DNA of 1.14 × 10², 1.14 × 101, 1.14 × 100, 1.14 × 10⁻¹, 1.14 × 10⁻², and 5.70 × 10⁻³ ng was added to each PCR reaction. The standard curve equation is y = ax + b, where the Ct value is used as the y-axis and the logarithm of the copy number is used as the x-axis. The slope of the standard curve must be in the range of −3.6 to −3.1, the R2 value should be greater than or equal to 0.98, and the amplification efficiency must fall between 90% to 110%.

3. Results

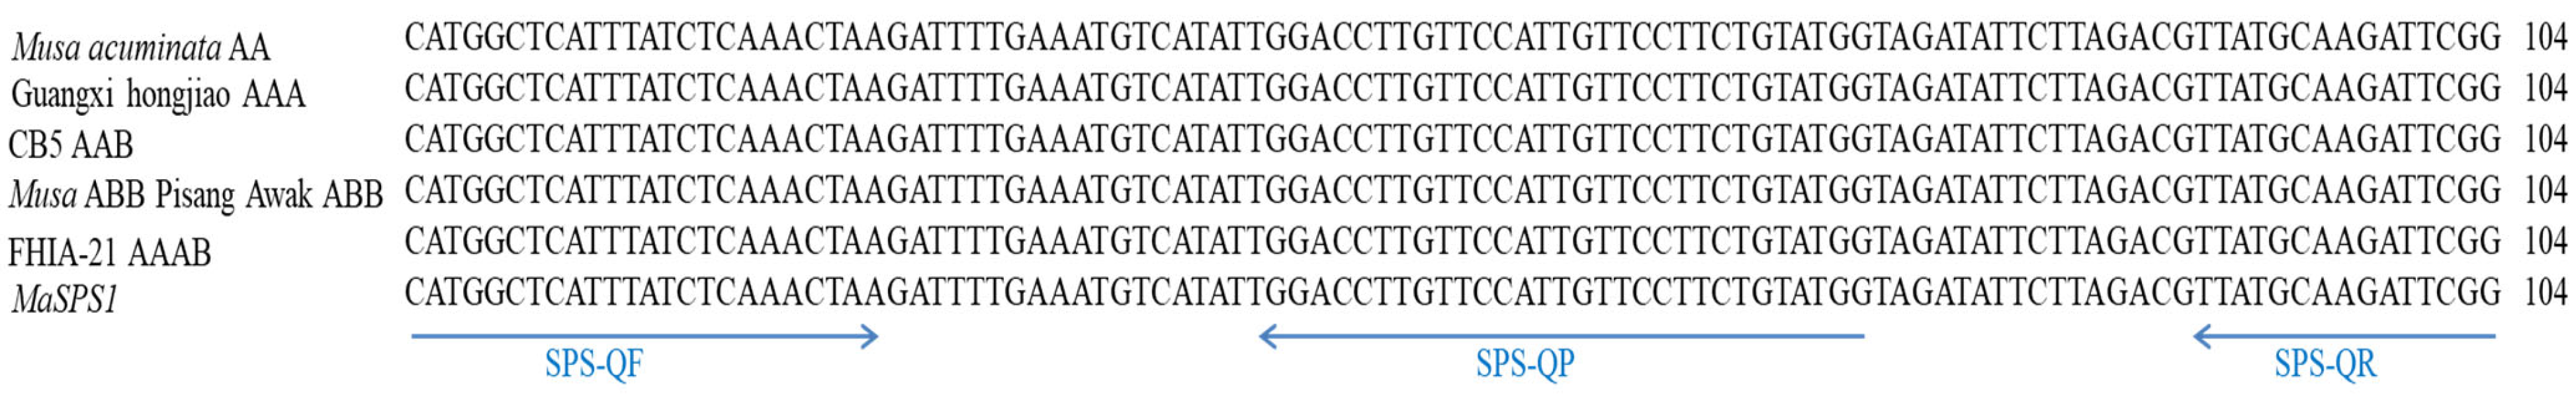
3.1. Sequence Analysis of MaSPS1

To screen and identify the endogenous reference gene in banana, we selected MaSPS1 as the candidate gene. And we chose five different banana varieties with distinct genotypes, including M. acuminata (AA), Guangxi hongjiao (AAA), CB5 (AAB), Musa ABB Pisang Awak (ABB), and FHIA-21 (AAAB), to sequence and analyze the conserved region. The results indicated that the amplified sequence was highly conserved. There were no differences observed between MaSPS1 and these five different banana varieties in the 104 bp of the PCR amplification sequence region (Figure 1). This suggests that this region sequence of MaSPS1 is highly conserved in the different genotypes of banana genomes and can be used as the amplification region in the method construction process.

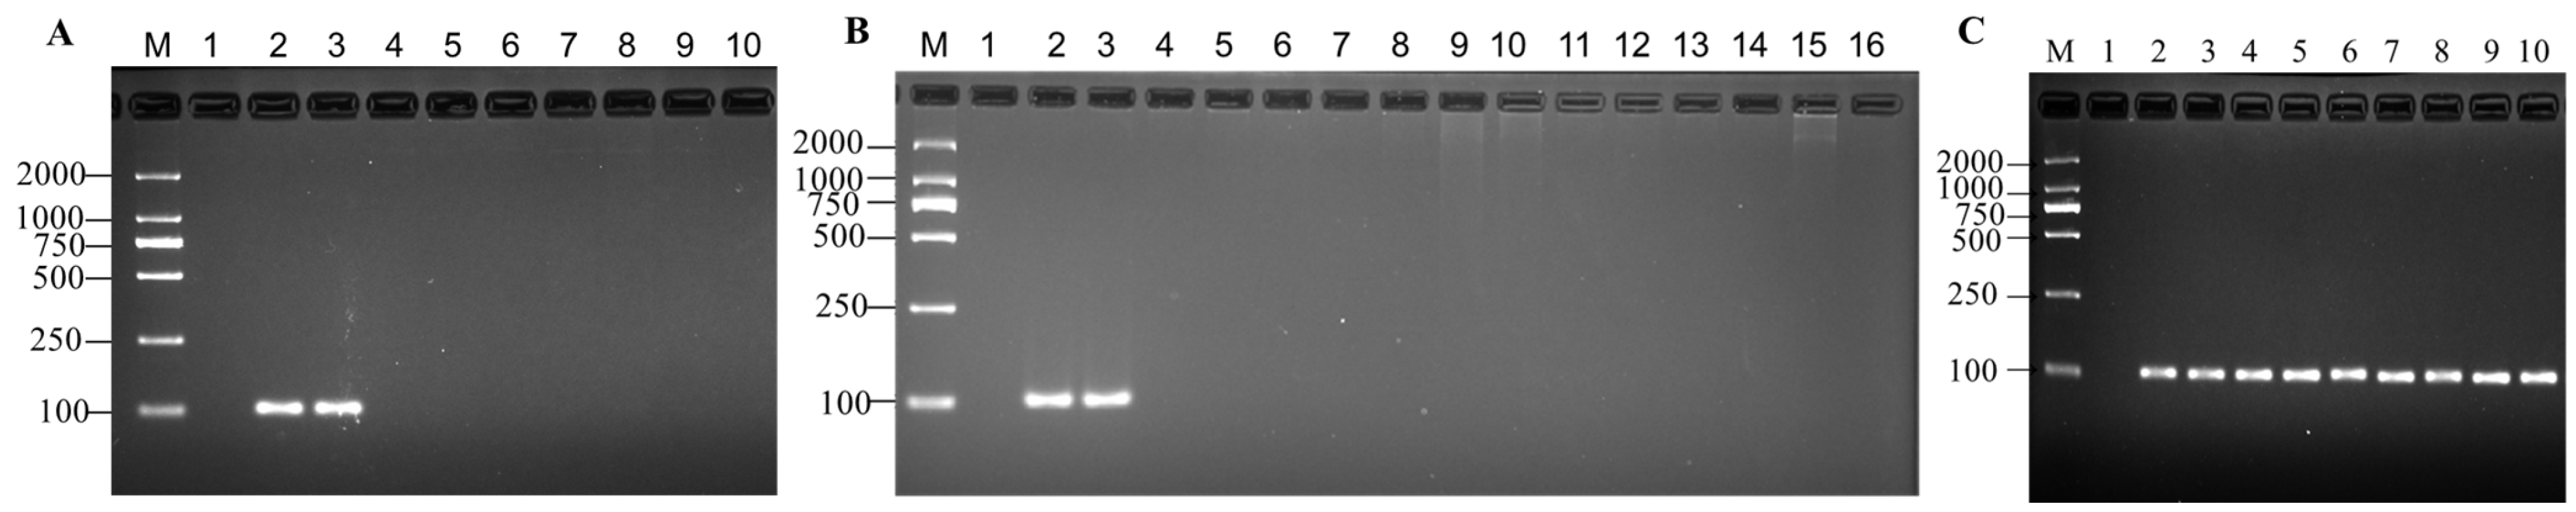
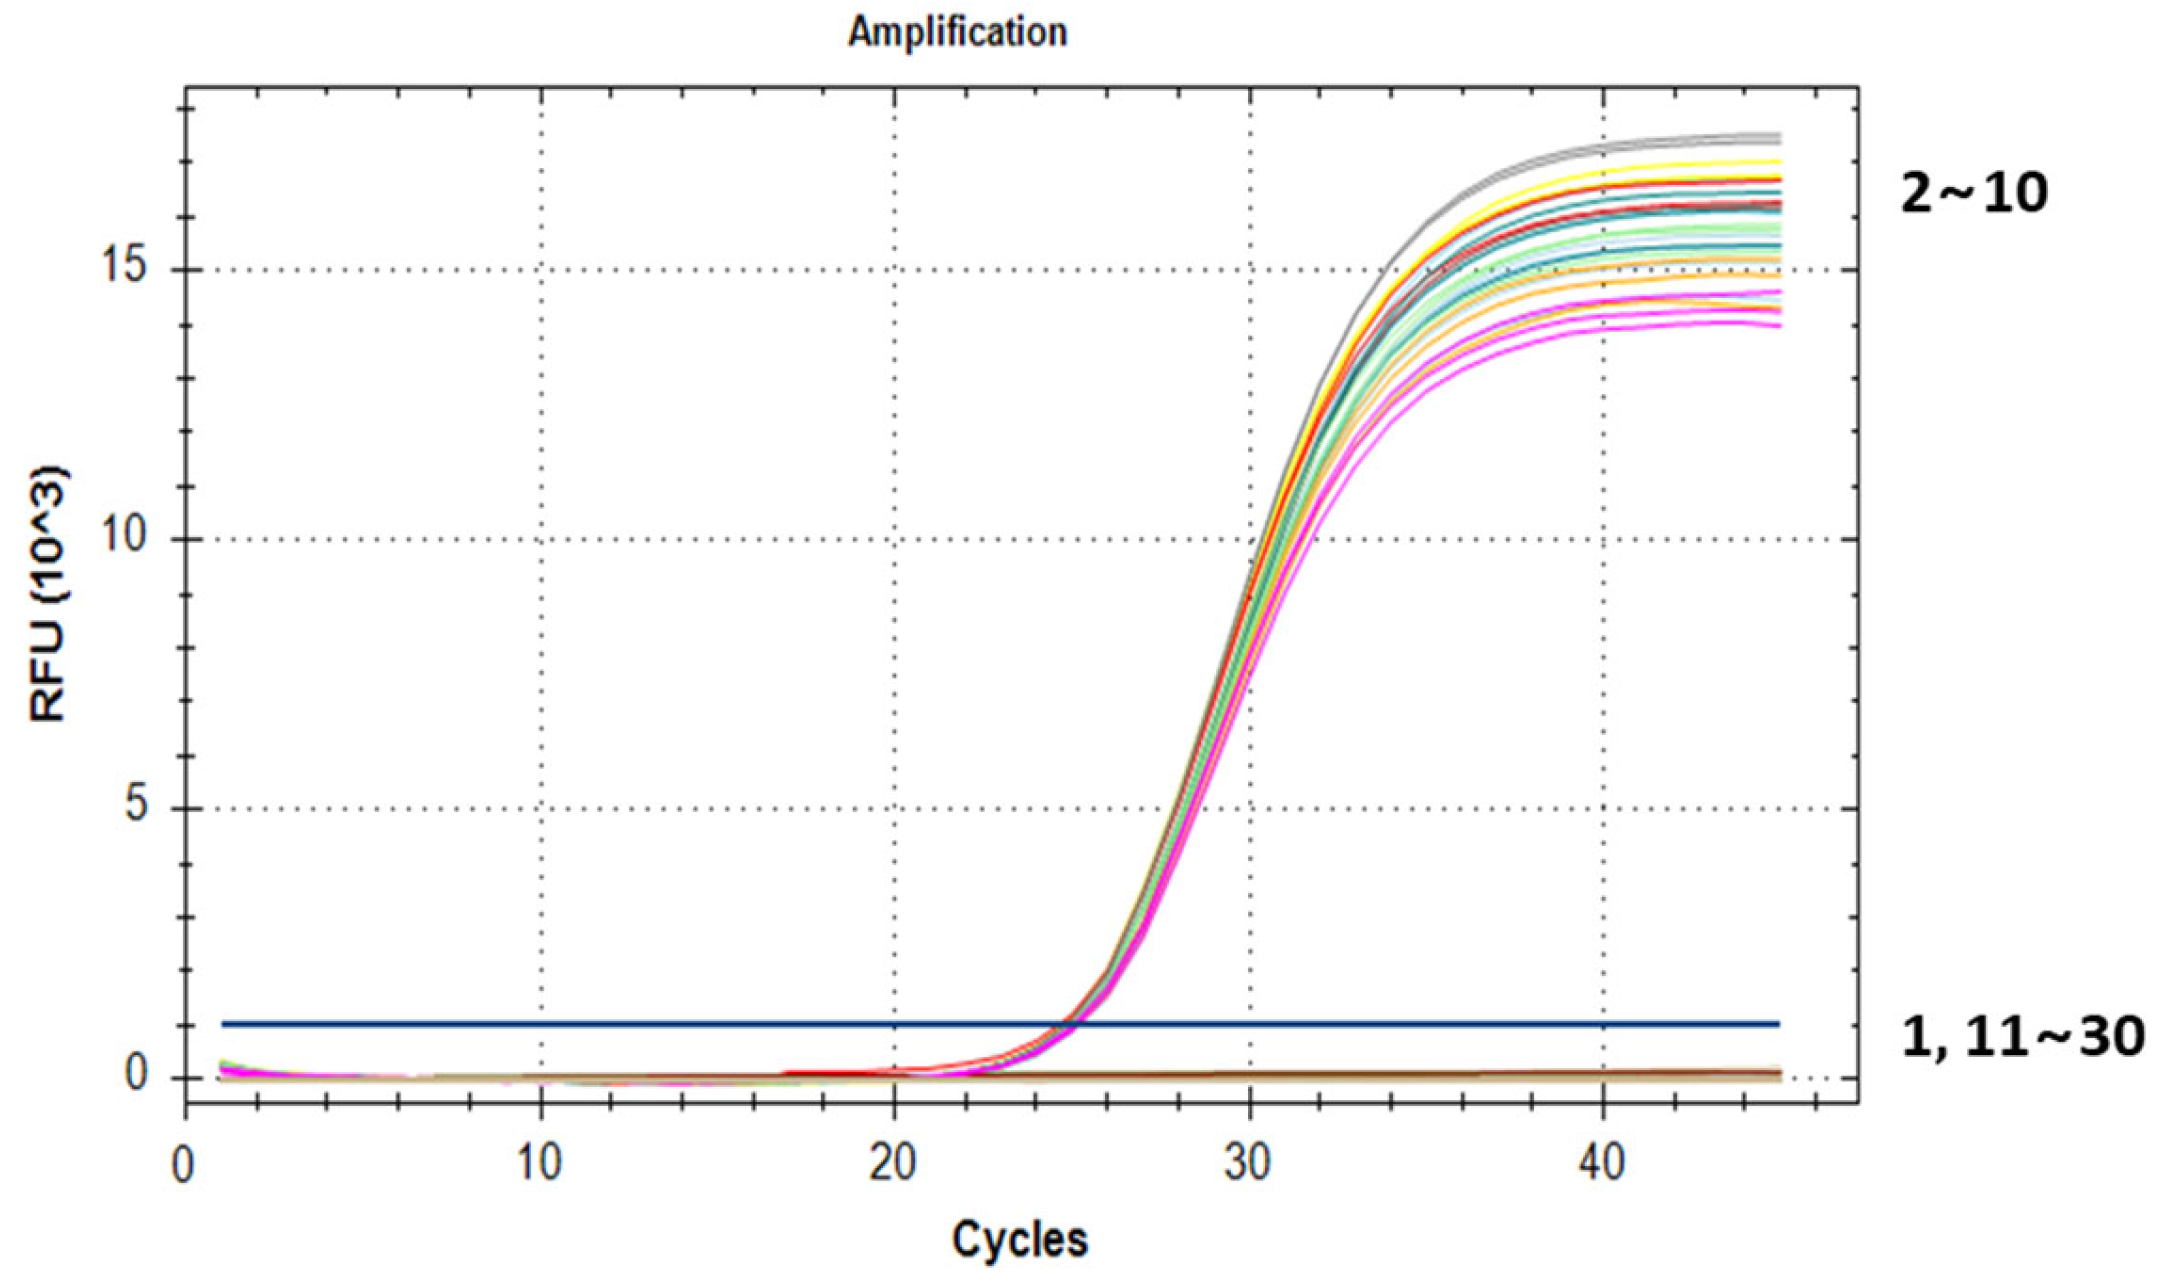
3.2. Specificity Test for MaSPS1

To identify the specificity of MaSPS1 in the banana genome, we selected commercially available GM crops such as rapeseed, maize, soybean, cotton, and papaya, as well as major crops, including wheat and rice, to amplify MaSPS1. The electrophoresis results showed that the 104 bp target band was amplified in banana and Musa ABB Pisang Awak, but not in the other crops (Figure 2A). Moreover, the fluorescence signal only appeared in the banana and Musa ABB Pisang Awak reactions during qPCR testing (Figure 3; Table 2). Bananas are both a tropical and subtropical form of fruit. Therefore, we also tested whether MaSPS1 could be amplified in mango, pomelo, green jujube, lemon, orange, jackfruit, watermelon, wax apple, pear, grape, peach, cantaloupe, and strawberry. Similarly, the 104 bp target band for MaSPS1 was only amplified in the banana and Musa ABB Pisang Awak but not in the other fruits (Figure 2B). The results of qPCR testing also showed that MaSPS1 had amplification signals only in bananas, and no effective amplification signals were detected in other fruits, which was consistent with the results of conventional PCR electrophoresis (Figure 3, Table 2).
To test the stability and specificity of MaSPS1 in the different banana genotypes, we conducted PCR testing and gel electrophoresis on nine banana materials, including the AA, AAA, AAAA, AAB, AAAB, and ABB genotypes. The results revealed that all of these banana materials were able to amplify a target band of 104 bp (Figure 2C). The results of the qPCR also revealed that the Ct values of MaSPS1 were similar in the different genotypes of the bananas tested, from 24.79 to 25.15 (Figure 3, Table 2). This indicated that the gene fragment is specific to the banana materials tested.

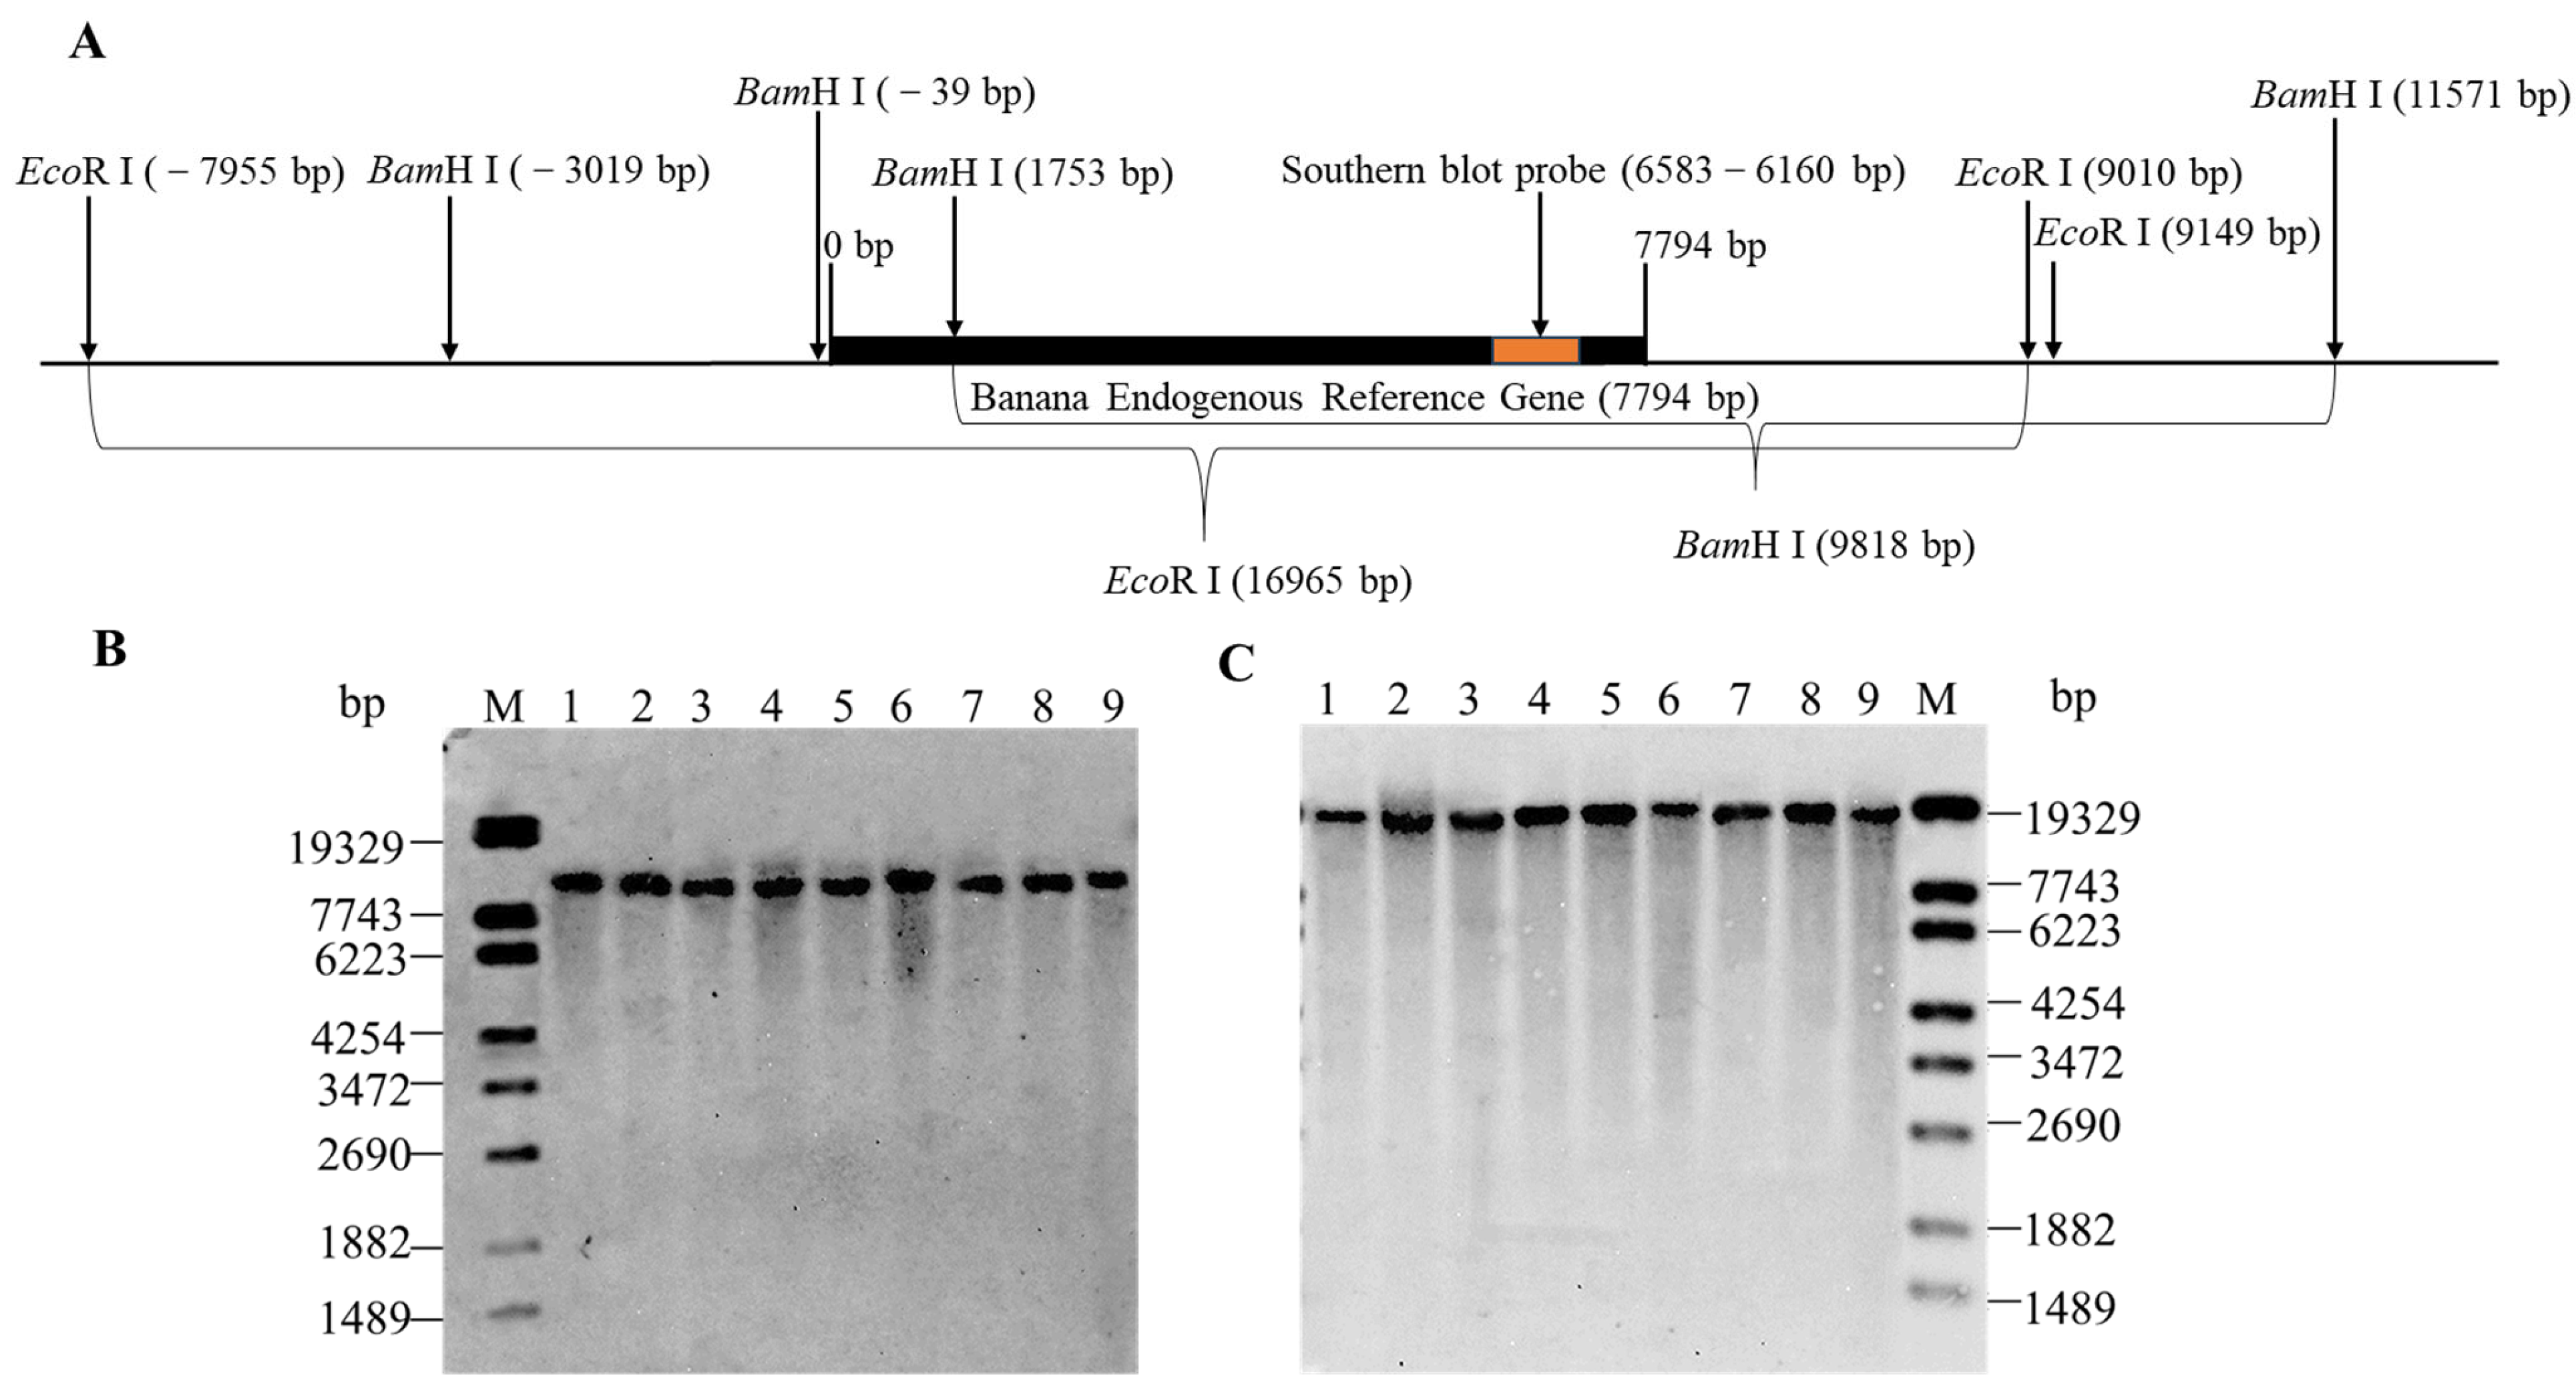
3.3. Determination of the Copy Number of MaSPS1 Using Southern Blot Analysis

To ascertain the copy number of the MaSPS1 gene in the banana genome, we analyzed the genomic sequence of MaSPS1 and found that there are no BamH I and EcoR I recognition sites (Figure 4A). Subsequently, we performed a Southern blot analysis after digesting the banana genomic DNA with BamH I and EcoR I. The results revealed that all nine banana varieties exhibited a distinct approximately 10 kb hybridization band when BamH I digestion was employed (Figure 4B). Likewise, all nine banana varieties displayed prominent hybridization bands at about 17 kb when EcoR I digestion was utilized (Figure 4C). These findings corroborate the results of the sequencing analysis (Figure 4A), indicating that the MaSPS1 gene exists as a single copy within the banana genome.

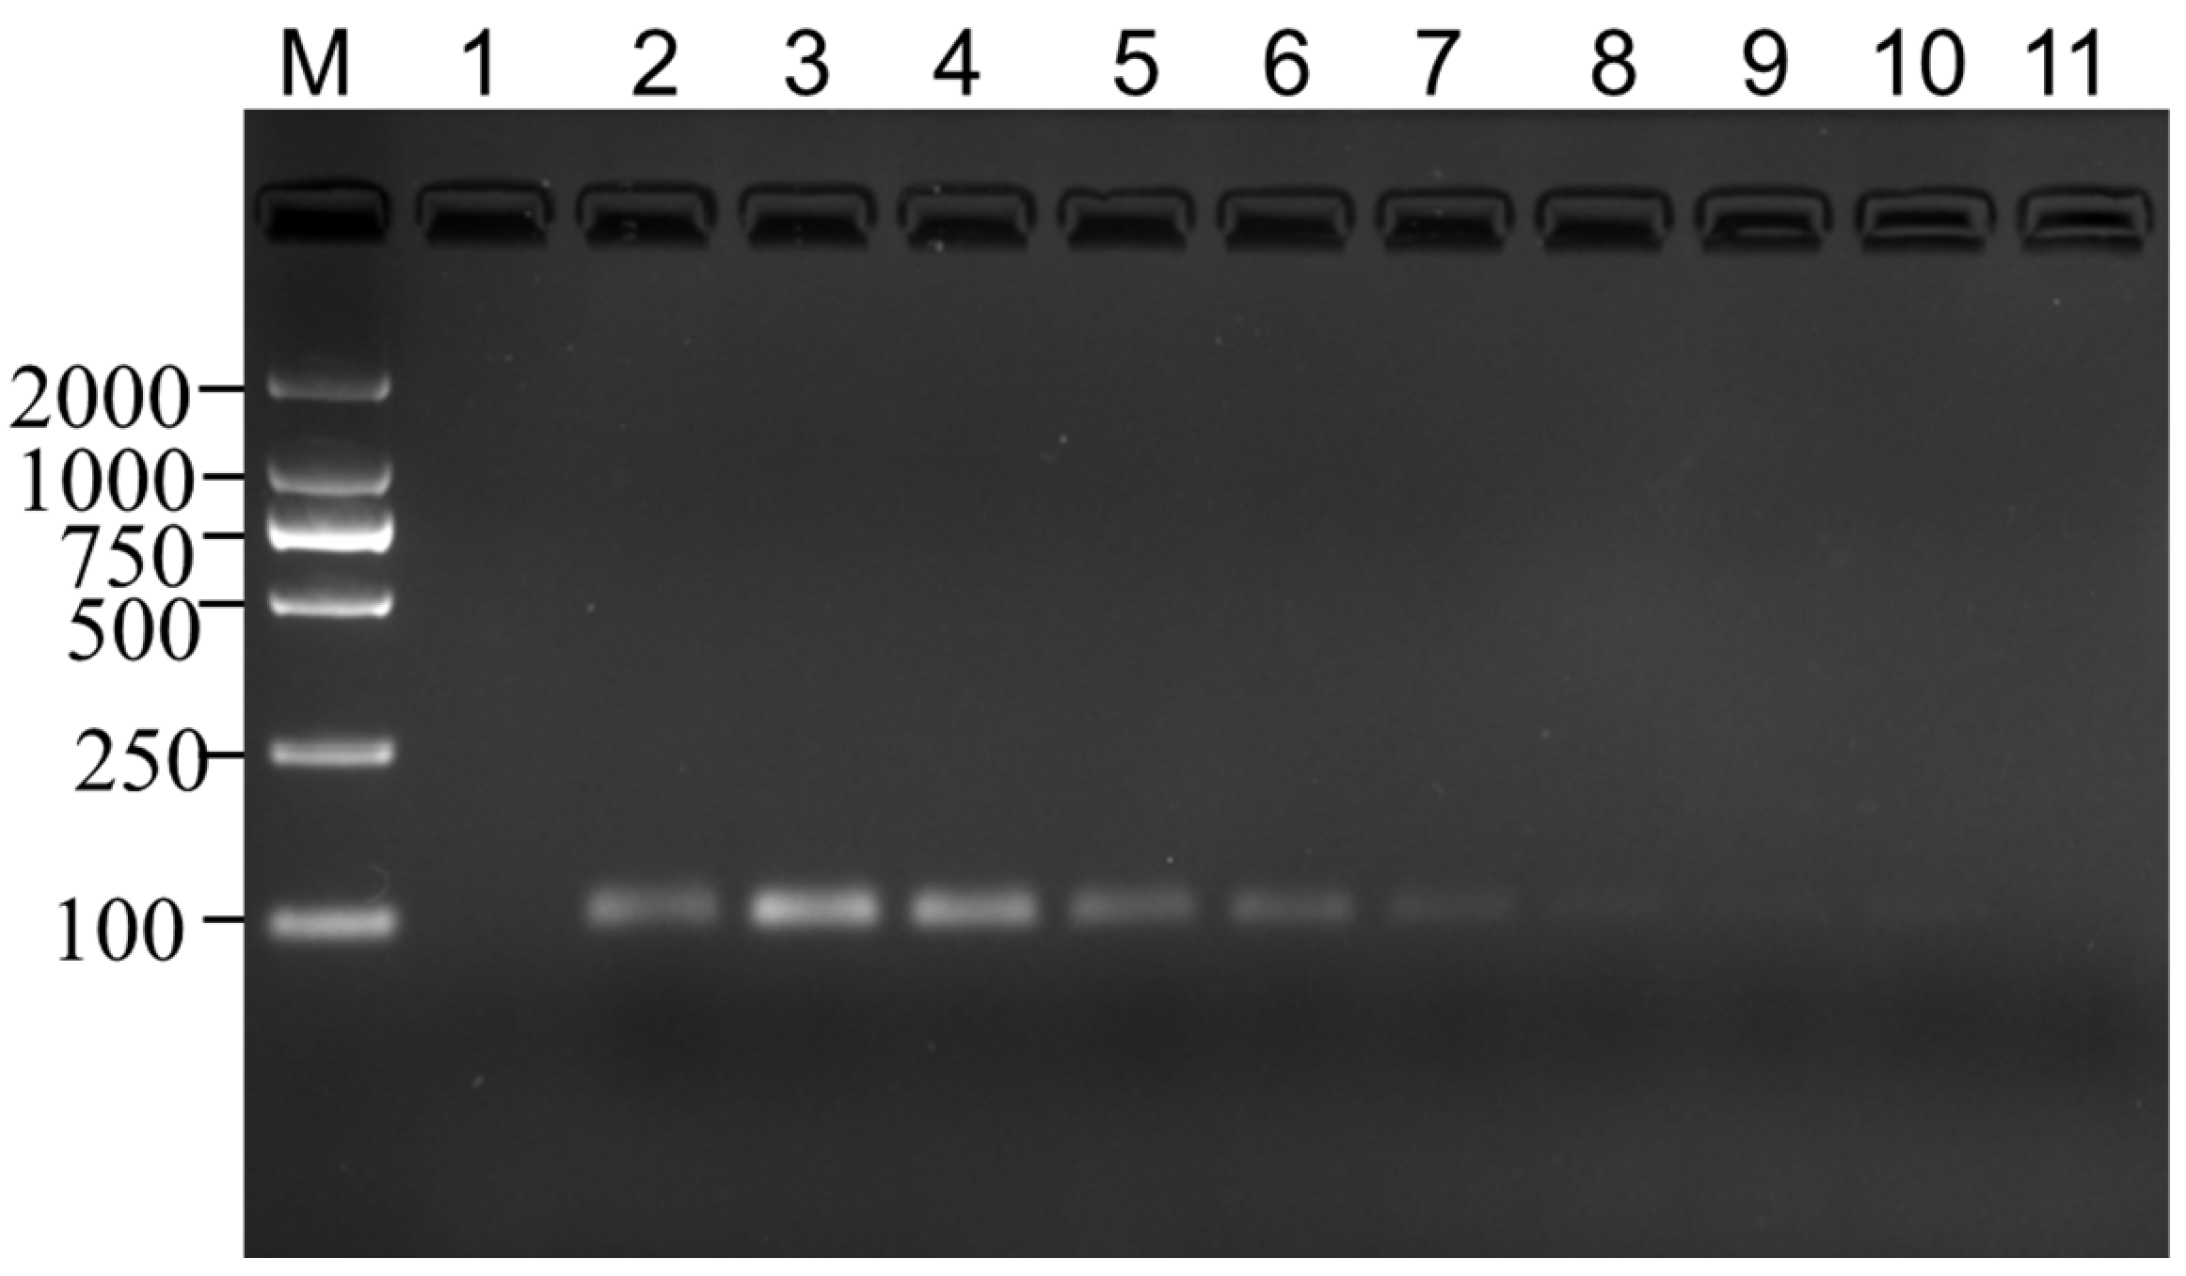
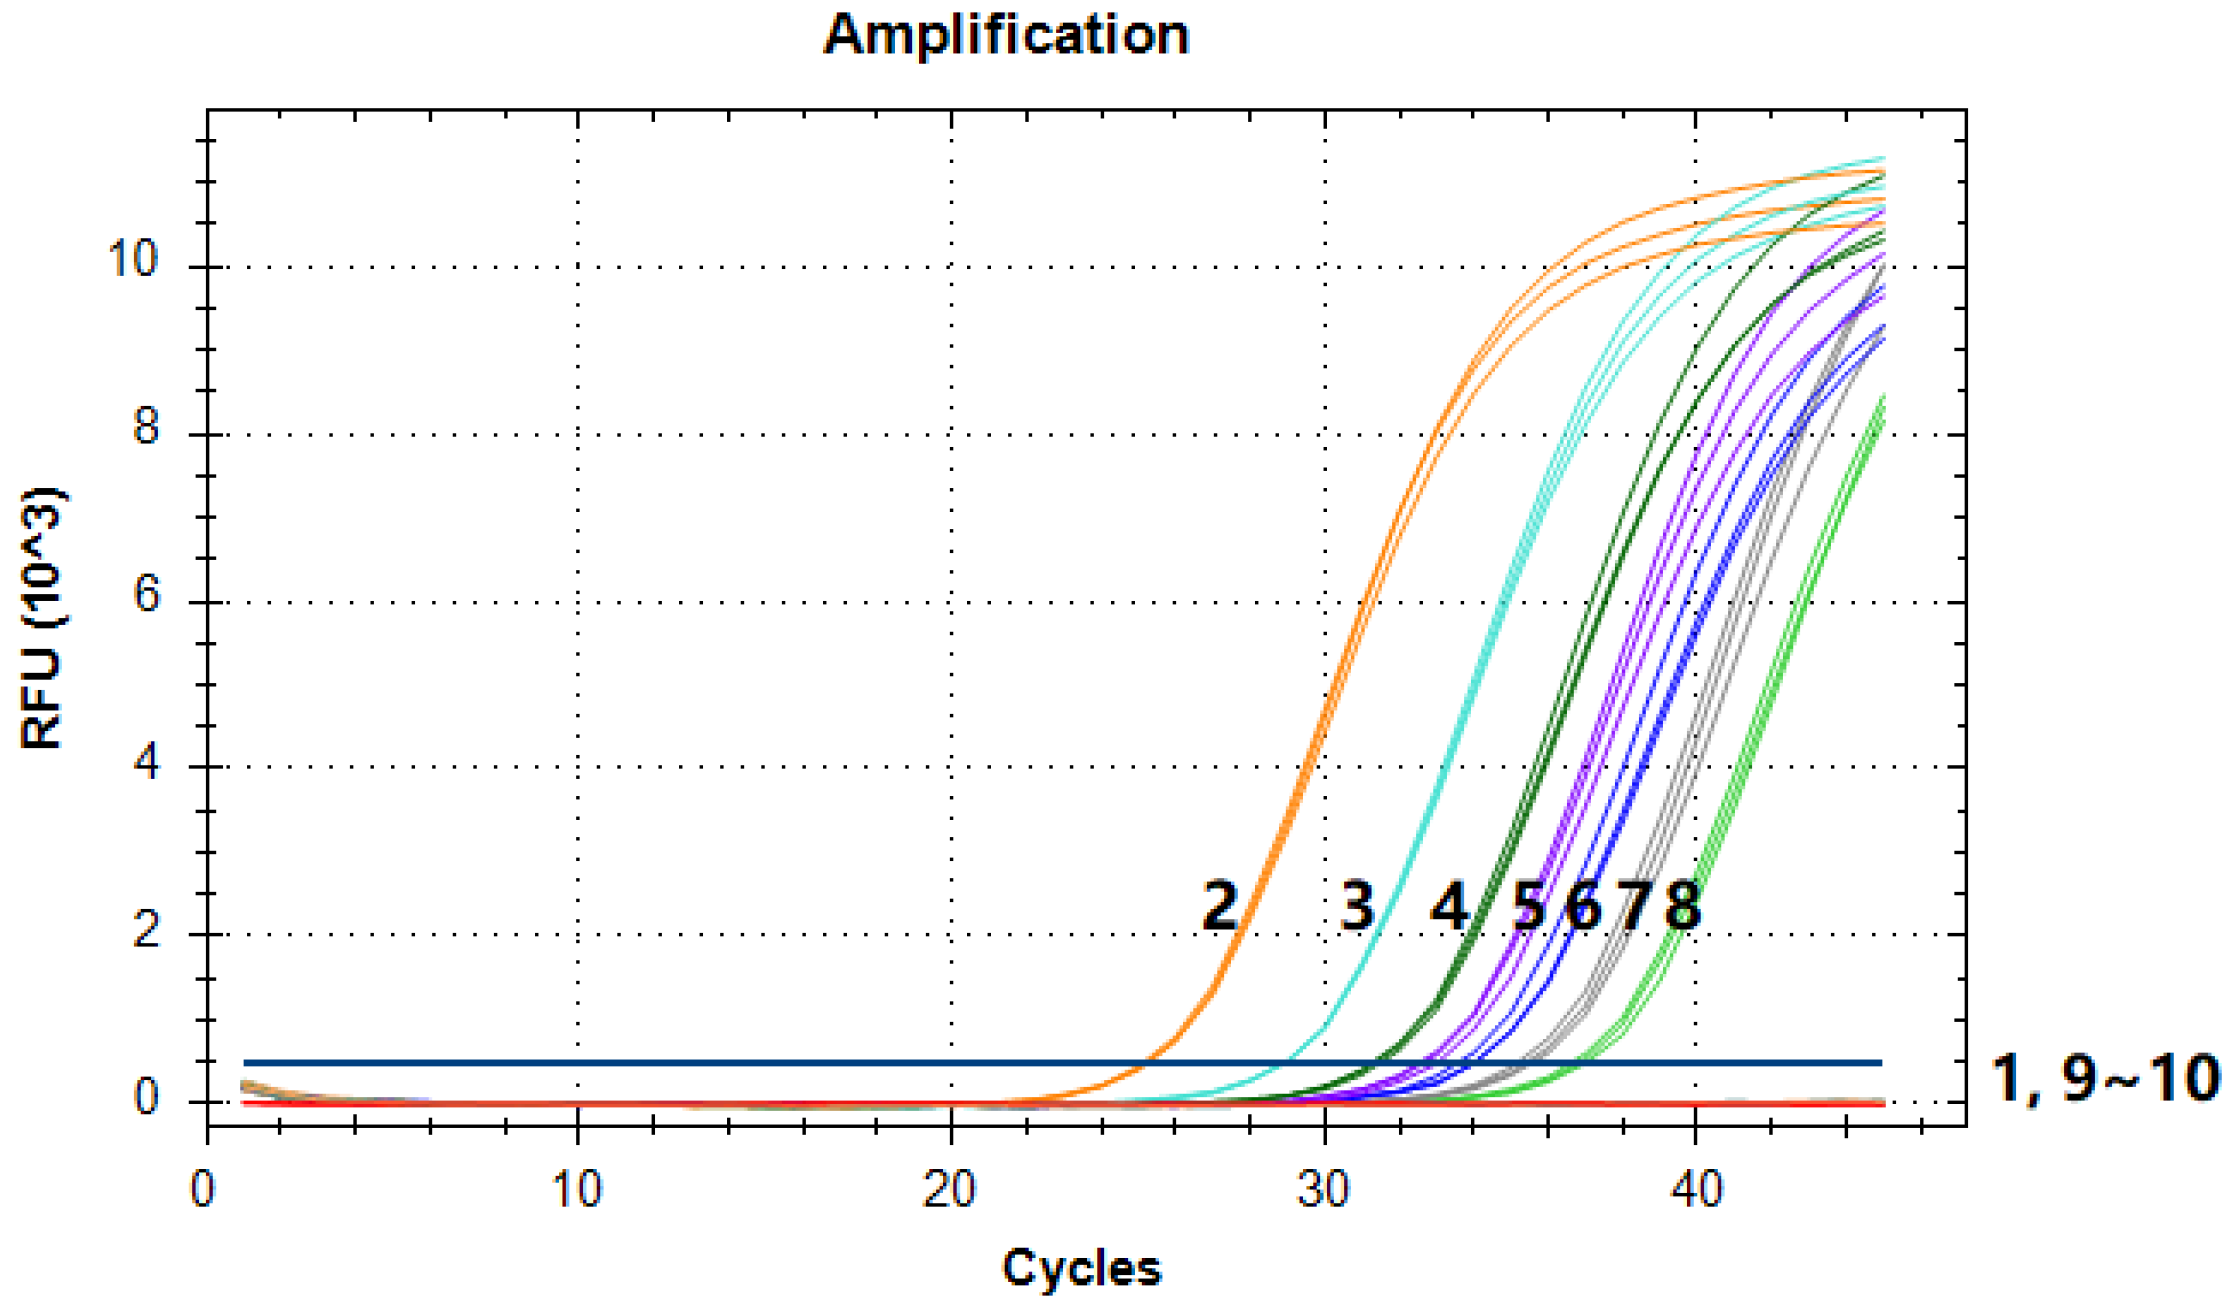
3.4. Limit of Detection Test

To validate the LOD of the banana endogenous reference gene detection method, we first carried out conventional PCR detection. The results revealed that when the genomic DNA template was 1.14 × 10⁻² ng, a clear target band could be seen in the electrophoresis test (equivalent to about 20 copies). Moreover, the brightness of the target band increased with the increase in the DNA template (Figure 5), indicating that the LOD of the conventional PCR detection method for the MaSPS1 endogenous reference gene is around 20 copies.
To further validate the LOD of the qPCR method for MaSPS1 as an endogenous reference gene, we performed fluorescence PCR with gradient concentrations of DNA. The results showed that when the DNA template quantity was 5.70 × 10⁻³ ng (about 10 copies) and above, typical amplification curves could be obtained. This suggested that the LOD of the quantitative PCR method for the MaSPS1 endogenous reference is around 10 copies (Figure 6; Table 3). Furthermore, the amplification curves between the same concentrations overlapped significantly and had high repeatability, indicating that the method has high stability and reliability.

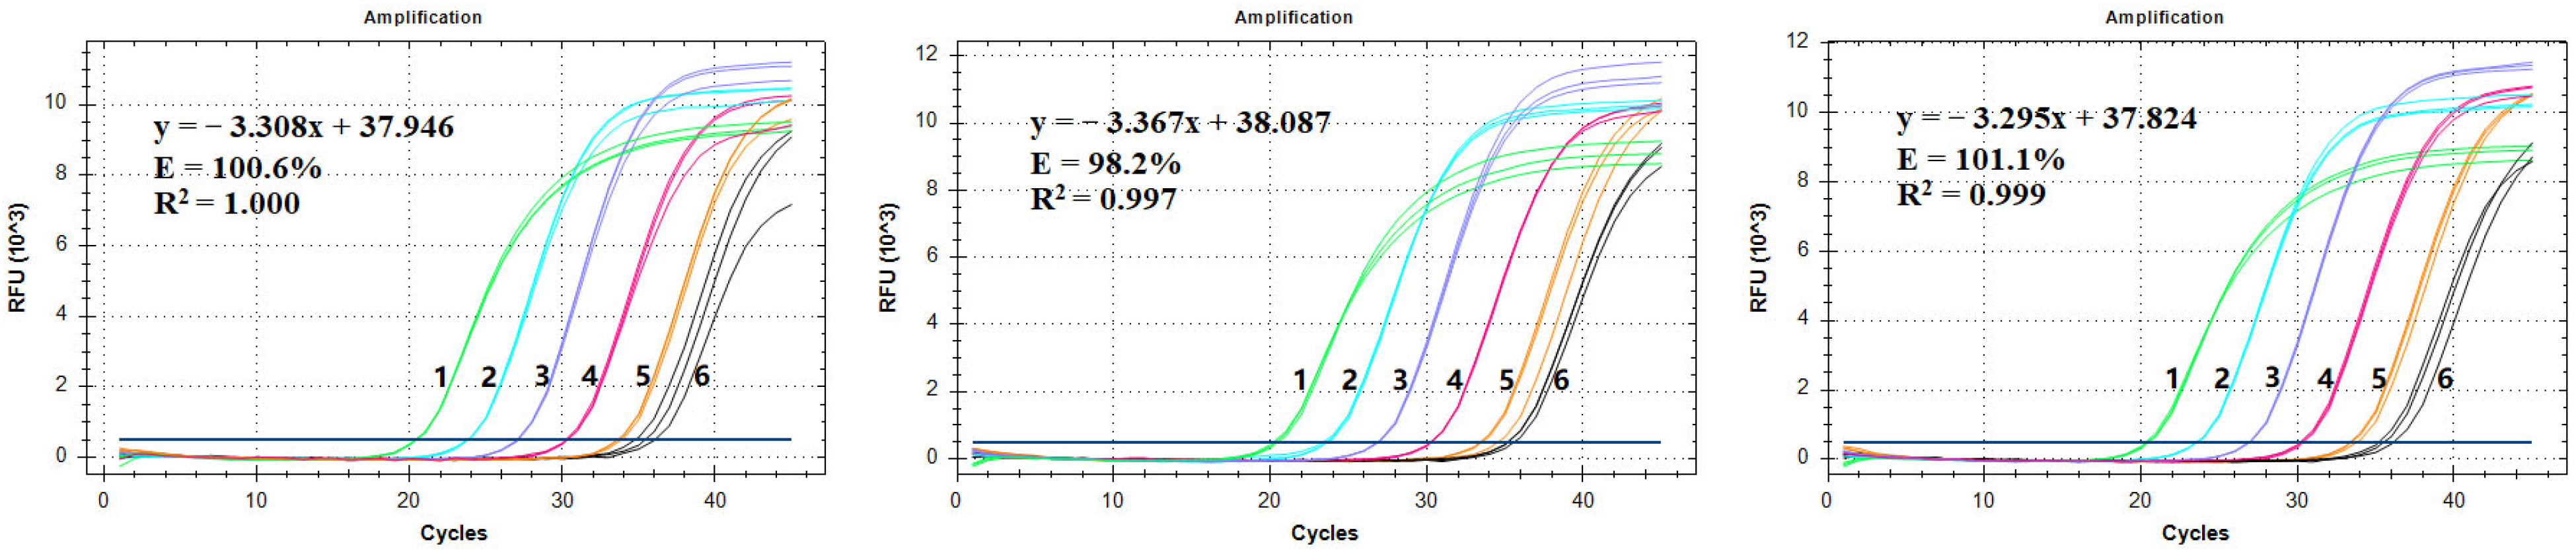
3.5. Construction of a Standard Curve and the LOQ Test

To validate the established qPCR detection method, we first diluted template genomic DNA with gradient concentrations. The amplification results for the five gradients of template DNA showed that the three technical repetitions of each sample were highly consistent (Figure 7A, Table 4). According to the standard curve, the amplification efficiency of MaSPS1 was 100.6% and the linear correlation coefficient R2 was 1.000 (Figure 7A), indicating that the established qPCR method could meet the quantitative detection requirements. Based on the results of gradient DNA detection, the relative deviation was 10.37% when the genomic template quantity was 1.14 × 10⁻² ng (Table 4). Therefore, the LOQ for this method is about 1.14 × 10⁻² ng (equivalent to about 20 copies).

3.6. Repeatability and Stability Tests for the qPCR Method

To assess the stability and reliability of the qPCR detection method established in this study, we conducted independent tests with different operators and different instruments. The results demonstrated that the amplification curves of the five gradient concentration standard samples were very similar (Figure 7). The amplification efficiencies were 100.6%, 98.2%, and 101.1%, and the linear correlation coefficients R2 were all higher than 0.99 (Figure 7; Table 5). Similar results were obtained for samples of the same concentration, with copy number quantification deviation biases all below 10% (Table 6). For the LOD of 5.70 × 10⁻³ ng banana genomic DNA, there was a relatively larger deviation in the amplification curve, but signals were still consistently detected (Figure 7; Table 6). These results indicated that the established qPCR method shows good repeatability and stability.

4. Discussion

Since the commercialization of GM plants, they have achieved rapid development over a span of more than 20 years, with significant growth in cultivation area and production value, leading to remarkable economic and ecological benefits [14]. Currently, a large area of GM crops is cultivated globally including maize, soybean, rapeseed, and cotton. GM papaya and alfalfa are also widely used in some countries [15]. Due to the substantial advantages of GM technology, it has also been successfully applied in vegetable and fruit research [16,17]. Bananas, being important fruits and food crops, have faced significant challenges due to the devastating impact of wilt disease, which has limited their yield and quality. GM technology, including gene-editing techniques, represents the most efficient method to combat Fusarium wilt effectively. In April 2023, gene-edited bananas in the Philippines received regulatory exemptions and they were set to be grown and sold alongside conventional bananas. This marks the future availability of various GM banana varieties. Therefore, the identification and study of endogenous reference genes, which are essential for GM crop research and detection, have become urgent and necessary.
Endogenous reference genes are necessary for the detection of GM plants. The amplification of endogenous reference genes is essential for confirming the identity of GM crops and calculating the content of GM components [10,11]. Currently, several endogenous reference genes have been developed and reported for various crops, including HMG I/Y in rapeseed [18], zSSIIb in maize [19], papain in papaya [20], Lectin in soybean [21], and GhPP4A14 in cotton [22]. These genes have been applied in multiple detection systems and have played pivotal roles in GM detection work. For example, the Lectin gene is used as a detection standard in both China and the European Union [23,24]. In this study, we identified MaSPS1, a highly conserved Sucrose phosphate synthase gene in banana. It demonstrated high conservation among different banana genotypes, and Southern blot analysis confirmed that it exists as a single copy in all detected banana genomes and is identical among different genotypes. Therefore, MaSPS1 possesses typical characteristics of an endogenous reference gene.
In GM component detection, the LOD is a crucial parameter that must be determined. According to literature reports, the LOD for conventional PCR is generally around 20 copies, while for qPCR, it is around 10 copies [25,26]. The LOD of the detection system established in this study is consistent with the reported results. The constructed standard curve for qPCR complies with the quantitative requirements, with a LOQ of 20 copies. Furthermore, this study tested the stability of the detection system with different operators and different machines. The results indicated that the detection limit was consistent across different operators and machine models. Overall, this study demonstrates that MaSPS1 is a stable and reliable endogenous reference gene suitable for qualitative and quantitative PCR detection in GM bananas.

Author Contributions

Conceptualization, L.Z. (Lingyan Zhou) and D.J.; methodology, Y.L. and W.Y.; software, Y.L. and L.Z. (Lili Zhu); validation, W.Y., Z.P. and W.C.; formal analysis, L.Z. (Lili Zhu) and Y.L.; resources, O.S. and J.Y.; data curation, L.Z. (Lili Zhu), Y.L. and Z.P.; writing—original draft preparation, L.Z. (Lili Zhu), Y.L. and Z.P.; writing—review and editing, L.Z. (Lingyan Zhou) and D.J.; supervision, D.J. and L.Z. (Lingyan Zhou); project administration, D.J.; funding acquisition, D.J. All authors have read and agreed to the published version of the manuscript.

Funding

This research was supported by the Science and Technology Innovation 2030 (2023ZD04062).

Institutional Review Board Statement

Not applicable.

Data Availability Statement

The data presented in this study are available in [The Identification of the Banana Endogenous Reference Gene MaSPS1 and the Construction of Qualitative and Quantitative PCR Detection Methods].

Conflicts of Interest

The authors declare no conflict of interest.

References

  1. Aurore, G.; Parfait, B.; Fahrasmane, L. Banana, raw materials for making processed food products. Trends Food Sci. Technol. 2009, 20, 78–91. [Google Scholar] [CrossRef]
  2. Wang, Z.; Miao, H.X.; Liu, J.H.; Xu, B.Y.; Yao, X.M.; Xu, C.Y.; Zhao, S.C.; Fang, X.D.; Jia, C.H.; Wang, J.Y.; et al. Musa balbisiana genome reveals subgenome evolution and functional divergence. Nat. Plants 2019, 5, 810–821. [Google Scholar] [CrossRef] [PubMed]
  3. Marín, D.H.; Romero, R.A.; Guzmán, M.; Sutton, T.B. Black Sigatoka: An Increasing Threat to Banana Cultivation. Plant Dis. 2003, 87, 208–222. [Google Scholar] [CrossRef] [PubMed]
  4. Stokstad, E. GM banana shows promise against deadly fungus strain. Science 2017, 358, 979. [Google Scholar] [CrossRef] [PubMed]
  5. Tripathi, L.; Ntui, V.O.; Tripathi, J.N. CRISPR/Cas9-based genome editing of banana for disease resistance. Curr. Opin. Plant Biol. 2020, 56, 118–126. [Google Scholar] [CrossRef] [PubMed]
  6. Namukwaya, B.; Tripathi, L.; Tripathi, J.N.; Arinaitwe, G.; Mukasa, S.B.; Tushemereirwe, W.K. Transgenic banana expressing Pflp gene confers enhanced resistance to Xanthomonas wilt disease. Transgenic Res. 2012, 21, 855–865. [Google Scholar] [CrossRef] [PubMed]
  7. Xu, Y.; Liu, J.H.; Jia, C.H.; Hu, W.; Song, S.; Xu, B.Y.; Jin, Z.Q. Overexpression of an banana aquaporin gene MaPIP1;1 enhances tolerance to multiple abiotic stresses in transgenic banana and analysis of its interacting transcription factors. Front. Plant Sci. 2021, 25, 780544. [Google Scholar] [CrossRef]
  8. Wang, C.; Jiang, L.X.; Rao, J.; Liu, Y.N.; Yang, L.T.; Zhang, D.B. Evaluation of four genes in rice for their suitability as endogenous reference standards in quantitative PCR. J. Agric. Food Chem. 2010, 58, 11543–11547. [Google Scholar] [CrossRef]
  9. Chaouachi, M.; Giancola, S.; Romaniuk, M.; Laval, V.; Bertheau, Y.; Brunel, D. A strategy for designing multi-taxa specific reference gene systems. Example of application--ppi Phosphofructokinase (ppi-PPF) used for the detection and quantification of three taxa: Maize (Zea mays); cotton (Gossypium hirsutum) and rice (Oryza sativa). J. Agric. Food Chem. 2007, 55, 8003–8010. [Google Scholar] [CrossRef]
  10. Dalla Costa, L.; Martinelli, L. Development of a real-time PCR method based on duplo target plasmids for determining an unexpected genetically modified soybean intermix with feed components. J. Agric. Food Chem. 2007, 55, 1264–1273. [Google Scholar] [CrossRef]
  11. Guo, J.C.; Yang, L.T.; Liu, X.; Zhang, H.B.; Qian, B.J.; Zhang, D.B. Applicability of the chymopapain gene used as endogenous reference gene for transgenic huanong no. 1 papaya detection. J. Agric. Food Chem. 2009, 57, 6502–6509. [Google Scholar] [CrossRef] [PubMed]
  12. Deng, T.T.; Huang, W.S.; Ren, J.A.; Ma, X.L.; Ge, Y.Q.; Chen, Y. Verification and applicability of endogenous reference genes for quantifying GM rice by digital PCR. Anal. Biochem. 2019, 15, 113442. [Google Scholar] [CrossRef] [PubMed]
  13. Jiang, D.G.; Lu, S.; Zhou, H.; Wu, X.J.; Zhuang, C.X.; Liu, Y.G.; Mei, M.T. Mapping of the rice (Oryza sativa L.) thermo-sensitive genic male sterile gene tms5 with EST and SSR markers. Chin. Sci. Bull. 2006, 51, 417–420. [Google Scholar] [CrossRef]
  14. International Service for the Acquisition of Agri-Biotech Applications (ISAAA). Available online: https://www.isaaa.org/resources/publications/briefs/55/default.asp (accessed on 8 October 2023).
  15. Kumar, K.; Gambhir, G.; Dass, A.; Tripathi, A.K.; Singh, A.; Jha, A.K.; Yadava, P.; Choudhary, M.; Rakshit, S. Genetically modified crops: Current status and future prospects. Planta 2020, 251, 91. [Google Scholar] [CrossRef] [PubMed]
  16. Kaur, M.; Sharma, P. Recent advances in cucumber (Cucumis sativus L.). J. Hortic. Sci. Biotechnol. 2021, 97, 3–23. [Google Scholar] [CrossRef]
  17. Marette, S.; Disdier, A.C.; Beghin, J.C. A comparison of EU and US consumers’ willingness to pay for gene-edited food: Evidence from apples. Appetite 2021, 159, 105064. [Google Scholar] [CrossRef] [PubMed]
  18. Weng, H.; Pan, A.H.; Yang, L.T.; Zhang, C.M.; Liu, Z.L.; Zhang, D.B. Estimating number of transgene copies in transgenic rapeseed by real-time PCR assay with HMG I/Y as an endogenous reference gene. Plant Mol. Biol. 2004, 22, 289–300. [Google Scholar] [CrossRef]
  19. Yang, L.T.; Guo, J.C.; Pan, A.H.; Zhang, H.B.; Zhang, K.W.; Wang, Z.M.; Zhang, D.B. Event-specific quantitative detection of nine genetically modified maizes using one novel standard reference molecule. J. Agric. Food Chem. 2007, 55, 15–24. [Google Scholar] [CrossRef]
  20. Xu, W.T.; Bai, W.B.; Guo, F.; Luo, Y.B.; Yuan, Y.F.; Huang, K.L. A papaya-specific gene; papain; used as an endogenous reference gene in qualitative and real-time quantitative PCR detection of transgenic papayas. Eur. Food Res. Technol. 2008, 228, 301–309. [Google Scholar] [CrossRef]
  21. Debode, F.; Marien, A.; Janssen, E.; Berben, G. Design of multiplex calibrant plasmids; their use in GMO detection and the limit of their applicability for quantitative purposes owing to competition effects. Anal. Bioanal. Chem. 2010, 396, 2151–2164. [Google Scholar] [CrossRef]
  22. Artico, S.; Nardeli, S.M.; Neto, O.B.O.; Grossi-de-Sa, M.F.; Alves-Ferreira, M. Identification and evaluation of new reference genes in Gossypium hirsutumfor accurate normalization of real-time quantitative RT-PCR data. BMC Plant Biol. 2010, 10, 49. [Google Scholar] [CrossRef] [PubMed]
  23. Mandaci, M.; Cakir, O.; Turgut Kara, N.; Meriç, S.; Ari, S. Detection of genetically modified organisms in soy products sold in Turkish market. Food Sci. Technol. 2014, 34, 717–722. [Google Scholar] [CrossRef]
  24. Yuan, J.Q.; Chang, H.; Zhao, J.H.; Tang, Z.W.; Shi, Z.Y.; Wang, J.D. Detection of transgenic components in animal feeds on Shanxi markets. Sheng Wu Gong Cheng Xue Bao 2016, 32, 1576–1589. [Google Scholar] [PubMed]
  25. Jiang, L.X.; Yang, L.T.; Rao, J.; Guo, J.C.; Wang, S.; Liu, J.; Lee, S.H.; Zhang, D.B. Development and in-house validation of the event-specific qualitative and quantitative PCR detection methods for genetically modified cotton MON15985. J. Sci. Food Agric. 2010, 90, 402–408. [Google Scholar] [CrossRef]
  26. Yang, C.; Zhang, D.B.; Yang, L.T. Development of event-specific PCR detection methods for genetically modified tomato Huafan No. 1. J. Sci. Food Agric. 2013, 93, 652–660. [Google Scholar] [CrossRef]
Figure 1. Sequence analysis of the MaSPS1 gene. Note: The position of the forward (SPS-QF) and reverse (SPS-QR) primers and fluorescence probes (SPS-QP) of the amplified sequence are indicated separately in the sequence. Five different banana varieties with distinct genotypes, M. acuminata (AA), Guangxi hongjiao (AAA), CB5 (AAB), Musa ABB Pisang Awak (ABB), and FHIA-21 (AAAB), were selected for analysis.
Genes 14 02116 g001
Figure 2. Conventional PCR to verify MaSPS1 gene specificity. (A) Specific amplification of MaSPS1 in crops. 1~10: blank control, banana, Musa ABB Pisang Awak, rapeseed, rice, papaya, maize, soybean, cotton, and wheat, respectively. The 104 bp target band was only amplified in the banana and Musa ABB Pisang Awak reactions. (B) Specific amplification of MaSPS1 in fruits. 1~16: blank control, banana, Musa ABB Pisang Awak, mango, grapefruit, green jujube, lemon, orange, jackfruit, watermelon, wax apple, pear, grape, peach, cantaloupe, and strawberry, respectively. The 104 bp target band was only amplified in the banana and Musa ABB Pisang Awak reactions. (C) Specific amplification of MaSPS1 in the different genotypes of banana. 1~10: blank control, Malaccensis (AAA), Brazilian banana (AAA), FHIA-04 (AAAA), French Sombre (AAB), FHIA-21 (AAAB), Musa ABB Pisang Awak (ABB), M. acuminata (AAA), Guangxi hongjiao (AAA), and CB5 (AAB), respectively. All of these banana materials were able to amplify a specific target band of 104 bp.
Genes 14 02116 g002
Figure 3. Real-time fluorescence quantitative PCR (qPCR) to verify MaSPS1 specificity. 1: blank control; 2~10: Malaccensis, Brazilian banana, FHIA-04, French Sombre, FHIA-21, Musa ABB Pisang Awak, M. acuminata, Guangxi hongjiao, and CB5 had amplification signals; 11~30: rapeseed, rice, papaya, maize, soybean, cotton, wheat, mango, grapefruit, green jujube, lemon, orange, jackfruit, watermelon, wax apple, pear, grape, peach, cantaloupe, and strawberry.
Genes 14 02116 g003
Figure 4. Southern blot analysis the copy number of MaSPS1 in the banana genome. (A) Enzymatic cleavage site analysis of the MaSPS1 genomic sequence. Southern blot with BamH I (B) and EcoR I (C) digestion of banana genomic DNA. The hybridization band was about 10 kb when BamH I digestion was employed for all nine banana varieties in (B). The hybridization band was about 17 kb when EcoR I digestion was utilized (C). 1~9: Malaccensis (AA), Brazilian banana (AAA), FHIA-04 (AAAA), French Sombre (AAB), FHIA-21 (AAAB), Musa ABB Pisang Awak (ABB), M. acuminata (AAA), Guangxi hongjiao (AAA), and CB5 (AAB).
Genes 14 02116 g004
Figure 5. Conventional PCR LOD test for MaSPS1. 1~11: blank control, positive control, 5.70 × 100, 5.70 × 10⁻¹, 1.14 × 10⁻¹, 5.70 × 10⁻², 2.85 × 10⁻², 1.14 × 10⁻², 5.70 × 10⁻³, 2.85 × 10⁻³, and 1.43 × 10⁻³ ng of banana genomic DNA. A clear 104 bp target band was seen when the template was 1.14 × 10⁻² ng and above.
Genes 14 02116 g005
Figure 6. qPCR LOD test for MaSPS1. 1~10: blank control, 5.70 × 100, 5.70 × 10⁻¹, 1.14 × 10⁻¹, 5.70 × 10⁻², 2.85 × 10⁻², 1.14 × 10⁻², 5.70 × 10⁻³, 2.85 × 10⁻³, and 1.43 × 10⁻³ ng of banana genomic DNA. Amplification curves could be obtained when the template was 5.70 × 10⁻³ ng and above.
Genes 14 02116 g006
Figure 7. qPCR repeatability and stability test for MaSPS1. (AC) are the amplification curves and standard curves of the qPCR test under different models of three operators; 1~6: 1.14 × 10², 1.14 × 101, 1.14 × 100, 1.14 × 10⁻¹, 1.14 × 10⁻², and 5.70 × 10⁻³ ng of banana genomic DNA.
Genes 14 02116 g007
Table 1. Sequence information of the primers and probes used in the study.
PurposePrimers/Probe NameSequence (5′–3′)Amplicon (bp)
Sequencing analysisSPS-1FCAAACAACGGGAAGCCTTTTTC1170
SPS-1RCCTTTTCGCCTTCTGATAGTTC
Southern blot probeSPS-2FCTGATAATTTGTTCGTAGACC423
SPS-2RCCGAATCTTGCATAACGTCTAA
PCR amplificationSPS-QFCATGGCTCATTTATCTCAAACTAA104
SPS-QRCCGAATCTTGCATAACGTCTAA
SPS-QPFAM-GGACCTTGTTCCATTGTTCCTTCTGTATGG-BHQ1
Table 2. Ct values of MaSPS1 from the plant species in qPCR.
Plant SpeciesCt ValueMean CtSDRSD
Repeat 1Repeat 2Repeat 3
Blank controlN/AN/AN/A
Malaccensis25.0324.7724.5824.790.230.91%
Brazilian banana25.2025.1025.1525.150.050.20%
FHIA-0425.0525.1124.9625.040.080.30%
French Sombre25.1225.0325.0425.060.050.20%
FHIA-2125.0524.9724.9424.990.060.23%
Musa ABB Pisang Awak25.1625.0025.0725.080.080.32%
M. acuminata24.7025.0824.7924.860.200.80%
CB524.9924.9825.1125.030.070.29%
Guangxi hongjiao24.9224.7624.8124.830.080.33%
RapeseedN/AN/AN/A
RiceN/AN/AN/A
PapayaN/AN/AN/A
MaizeN/AN/AN/A
SoybeanN/AN/AN/A
CottonN/AN/AN/A
WheatN/AN/AN/A
MangoN/AN/AN/A
GrapefruitN/AN/AN/A
Green jujubeN/AN/AN/A
LemonN/AN/AN/A
OrangeN/AN/AN/A
JackfruitN/AN/AN/A
WatermelonN/AN/AN/A
Wax appleN/AN/AN/A
PearN/AN/AN/A
GrapeN/AN/AN/A
PeachN/AN/AN/A
CantaloupeN/AN/AN/A
StrawberryN/AN/AN/A
Table 3. Copy number test for MaSPS1 in qPCR.
DNA ConcentrationSignal Rate (Positive Signals)Copy Number
ng/reactionCopies/reactionMeanSDRSD
5.70 × 10010,0003/39351.2353.123.78%
5.70 × 10−110003/3987.314.931.51%
1.14 × 10−12003/3231.514.716.36%
5.70 × 10−21003/3101.914.8814.59%
2.85 × 10−2503/351.78.2916.03%
1.14 × 10−2203/320.82.4811.94%
5.70 × 10−3103/38.81.0612.07%
2.85 × 10−350/3N/A
1.43 × 10−32.50/3N/A
Table 4. LOQ test for MaSPS1 in qPCR.
DNA ConcentrationCt ValueCopy Number
ng/reactionCopies/
reaction
Repeat 1Repeat 2Repeat 3MeanSDRSDMeanSDRSD
1.14 × 102200,00020.3920.3420.4020.380.030.16%204,983.74613.072.25%
1.14 × 10120,00023.7423.7623.8223.770.040.18%19,269.5554.912.88%
1.14 × 100200027.0927.0627.0227.060.040.13%1959.847.992.45%
1.14 × 10−120030.3030.2730.2030.260.050.17%211.37.603.59%
1.14 × 10−22033.6033.5733.8533.670.150.46%19.72.0410.37%
5.70 × 10−31036.0434.7335.3935.390.661.85%6.42.8344.52%
Table 5. qPCR standard curve repeatability test for MaSPS1.
Test NumberAmplification EfficiencyR2SlopeY-Intercept
Test 1100.6%1.000−3.30837.946
Test 298.2%0.997−3.36738.087
Test 3101.1%0.999−3.29537.824
Table 6. qPCR copy number repeatability test for MaSPS1.
DNA ConcentrationTest 1 Copy NumberTest 2 Copy NumberTest 3 Copy Number
ng/reactionCopies/
reaction
MeanBiasMeanBiasMeanBias
1.14 × 102200,000204,755.52.4%185,916.07.0%193,029.03.5%
1.14 × 10120,00019,252.33.7%21,091.15.5%21,280.56.4%
1.14 × 10020001958.42.1%2107.25.4%1996.40.2%
1.14 × 10−1200211.25.6%210.75.4%195.52.2%
1.14 × 10−22019.61.8%19.62.2%20.31.4%
5.70 × 10−3106.436.4%6.733.0%4.851.9%
Disclaimer/Publisher’s Note: The statements, opinions and data contained in all publications are solely those of the individual author(s) and contributor(s) and not of MDPI and/or the editor(s). MDPI and/or the editor(s) disclaim responsibility for any injury to people or property resulting from any ideas, methods, instructions or products referred to in the content.

