Article

FOS Inhibits the Differentiation of Intramuscular Adipocytes in Goats

1
College of Animal Science and Veterinary, Southwest Minzu University, Chengdu 610041, China
2
Key Laboratory of Qinghai-Tibetan Plateau Animal Genetic Resource Reservation and Utilization, Ministry of Education, Southwest Minzu University, Chengdu 610041, China
3
Key Laboratory of Sichuan Province for Qinghai-Tibetan Plateau Animal Genetic Resource Reservation and Exploitation, Southwest Minzu University, Chengdu 610041, China
4
Chengdu Women’s and Children’s Central Hospital, School of Medicine, University of Electronic Science and Technology of China, Chengdu 611731, China
*
Author to whom correspondence should be addressed.
Genes 2023, 14(11), 2088; https://doi.org/10.3390/genes14112088
Submission received: 27 September 2023 / Revised: 14 November 2023 / Accepted: 14 November 2023 / Published: 17 November 2023
(This article belongs to the Special Issue Genetics and Genomics of Sheep and Goat)

Abstract

:
Goat intramuscular fat (IMF) deposition is precisely regulated by many key genes as well as transcription factors. Nevertheless, the potential of the regulators of goat IMF deposition remains undefined. In this work, we reported that the transcription factor FOS is expressed at a low level at the early differentiation stage and at a high level in late differentiation. The overexpression of FOS inhibited intramuscular adipocyte lipid accumulation and significantly downregulated the expressions of PPARγ, C/EBPβ, C/EBPα, AP2, SREBP1, FASN, ACC, HSL, and ATGL. Consistently, the knockdown of FOS, facilitated by two distinct siRNAs, significantly promoted intramuscular adipocyte lipid accumulation. Moreover, our analysis revealed multiple potential binding sites for FOS on the promoters of PPARγ, C/EBPβ, and C/EBPα. The expression changes in PPARγ, C/EBPβ, and C/EBPα during intramuscular adipogenesis were opposite to that of FOS. In summary, FOS inhibits intramuscular lipogenesis in goats and potentially negatively regulates the expressions of PPARγ, C/EBPβ, and C/EBPα genes. Our research will provide valuable data for the underlying molecular mechanism of the FOS regulation network of intramuscular lipogenesis.

1. Introduction

Owing to rising consumer awareness of meat-associated quality, consumer demand for high-quality goat meat has increased significantly [1]. Meat quality is influenced by various factors, in which the IMF content plays a critical role in determining meat-quality traits [2]. An appropriate IMF content can improve the tenderness, juiciness, and flavor of meat products [3]. Animal IMF deposition results from a combination of adipocyte proliferation and hypertrophy. Adipocyte differentiation is a critical pathway for animal IMF accumulation, which is tightly controlled by numerous important genes and transcription factors [4]. Therefore, it is very important to unravel the molecular mechanism by which key transcription factors regulate the differentiation of adipocytes in goats.
The transcription factor FOS is a nuclear-like protein with a basic leucine zipper encoded by the proto-oncogene c-fos. FOS is a transcription factor superfamily, including FOS, v-FOS, FOSB, Fra1, and Fra2, which together with members of the proto-oncogene JUN family (c-Jun, JunB, and JunD) and the activating transcription factor (ATF) protein family constitute the AP-1 transcription factor complex [5,6]. FOS is involved in a variety of biogenic processes in vivo and is closely linked to the differentiation of chondrocytes and osteoclasts, as well as tumor formation and carcinogenesis [7,8,9,10]. It has been reported that FOS regulates the growth and differentiation of adipocytes [11]. For example, the knockdown of the FOS gene reduced lipid droplet accumulation and inhibited the differentiation of 3T3-L1 adipocytes [12]. Meanwhile, another study showed that all-trans retinoic acid (atRA) stimulated the interaction of retinoic acid receptor γ (RARγ) with FOS protein, hindering the binding of FOS to PPARγ2, which resulted in a reduction in the expression of PPARγ2 and, ultimately, hindering the differentiation of 3T3-L1 adipocytes [13]. Congenital generalized lipodystrophy (CGL) refers to a syndrome of adipocyte dysplasia caused by mutations in the FOS gene promoter in CGL patients, resulting in a reduced expression of FOS that interferes with preadipocyte differentiation [14]. Therefore, considering the variations between species, the effect of FOS on adipogenesis in goat intramuscular adipocytes should be clarified.
This study aims to investigate the impact of FOS on the regulation of adipogenesis in goat intramuscular preadipocytes. First, the localization of FOS expression was detected in goat intramuscular precursor adipocytes. Subsequently, the expression levels of FOS were detected at various stages of lipogenesis in goat intramuscular adipocytes. Then, the role of FOS in intramuscular preadipocyte differentiation was determined by loss and gain of function using siRNAs and an overexpression vector. In addition, the potential target genes of FOS were predicted and compared with FOS, they exhibited contrasting expression patterns at various stages of lipogenesis in intramuscular adipocytes. Taken together, our study results indicate that FOS negatively regulates goat intramuscular adipogenesis and provides new information about the role of FOS in adipogenesis.

2. Materials and Methods

2.1. Cell Culture

The animal experimentation study received approval from the Laboratory Animal Ethics Committee at Southwest Minzu University and the Animal Disease Control Center in Sichuan Province, China. Jianzhou Daer goats (Capra hircus) (N 3) were purchased from Sichuan Tiandi Goat Biological Engineering Co., Ltd. (Chengdu, China). Goat intramuscular preadipocytes were isolated and cultured in accordance with previously described methods [15,16]. Concisely, Longissimus dorsi muscle samples were collected from seven-day-old Jianzhou Daer goats (N = 3), and the samples were sheared. Intramuscular preadipocytes were isolated by digestion with 2 mg/mL of collagenase type II (Gibco, Thermo, Waltham, MA, USA). Finally, the preadipocytes were cultured in growth medium DMEM/F12 supplemented with 10% FBS and 1% P/S.

2.2. Construction of Overexpression Vector, siRNA Synthesis, Cell Transfection

Briefly, the coding region of the goat FOS gene was amplified using RT-PCR, and the Kpn I and Hind III sites were selected as upstream and downstream cleavage sites, respectively, for primer design (Table 1 shows the sequences of the primers.) and for cloning. The FOS overexpression plasmid was digested with restriction enzymes (TaKaRa, Kusatsu, Shiga, Japan) and ligated with T4 DNA ligase (TaKaRa, Kusatsu, Shiga, Japan). The bacterial solution confirmed as positive by PCR was proliferated, and the plasmid was extracted and identified by restriction endonuclease digestion and sequencing. (Biological Biotechnology Co., Ltd., Chengdu, China). Two individual siRNAs targeted for goat FOS and a negative control (NC) siRNA were synthesized by Gene Pharma (Shanghai, China). The sequences of the NC and si-RNAs were as follows:
siRNA1: (5′-GUUCCUUCUAUGCAGATTUCUGCUGCAUAGAAGGAACTT-3′);
siRNA2: (5′-GAGAUUGCCAAUCGCUGATTUCAGCAGAUUGGCAAUCUCTT-3′);
NC: (5′-UUCUCCGAACGUGUCACGUT TACGUGACACGUUCGGAGAATT-3′).
Goat FOS overexpression vector and siRNA transfections were performed using TurboFect (Thermo, Waltham, MA, USA). Intramuscular preadipocytes were transfected with the transfection reagent (Thermo, Waltham, MA, USA) at a 70% confluence. Then, the medium was changed to a medium containing 50 µmol/L of oleic acid, and differentiation was induced for 2 days at 16 h post transfection.

2.3. Oil Red O Staining

The cell culture method was the same as that described above. First, goat intramuscular adipocytes were fixed with 4% formaldehyde for 20 min at room temperature. The Oil Red O staining was performed according to the method described by Xiong et al. [15]. Next, Oil Red O dye was added to each well for staining for 15 min. After the stained adipocytes were washed twice with PBS, 200 μL of PBS was added again as the background to observe the shape of the lipid droplets using a microscope (Olympus, Tokyo, Japan). Finally, 1 mL of isopropanol was added to dissolve the Oil Red O dye, and the absorbance value of each well was measured at 490 nm.

2.4. Bodipy Staining and DAPI Staining

Bodipy and DAPI stainings were performed according to the method described by Chen et al. [16]. Bodipy and DAPI dyes were first diluted in PBS at a ratio of 1:1000. Then, Bodipy dye was added to each well, and the adipocytes were stained for 10 min away from light and washed again with PBS, and DAPI dye was added for another 10 min. Finally, the aggregation of lipid droplets in adipocytes was observed under a fluorescence microscope and photographed.

2.5. Cell RNA Extraction and Quantitative Real-Time PCR

Total RNA was isolated from harvested intramuscular adipocytes, using RNAiso Plus (TaKaRa, Kusatsu, Shiga, Japan). Briefly, goat intramuscular adipocytes were collected and resuspended using RNAiso Plus. Chloroform was added, and the suspension was shaken vigorously and then allowed to stand, followed by centrifugation. The supernatant was then aspirated and transferred to a new tube. Isopropyl alcohol was added to precipitate the RNA, and centrifugation was performed. The liquid above the sediment was discarded, and the precipitate was washed with DEPC ethanol and then centrifuged repeatedly. The supernatant was discarded, and the RNA precipitate was allowed to air-dry. Finally, an appropriate amount of DEPC water was added to dissolve the RNA. The A260/A280 values of the RNA were determined as in the range 1.8–2.0 using a UV spectrophotometer, which met the test requirements. cDNA was reverse-transcribed using a reverse-transcriptase kit (Thermo, Waltham, MA, USA) and the quantitative PCR spiking system described by Chen et al. [16]. The UXT gene was used as an internal control. The qPCR primer sequences are listed in Table 1.

2.6. Measurement of Cellular Triglyceride Levels

Intramuscular adipocytes were collected after 2 days of differentiation induction and were lysed according to the instructions of the triglyceride determination kit (Applygen, Beijing, China), and the triglyceride content was determined according to the procedures described in the manufacturer’s instructions.

2.7. Western Blotting

The total protein from the goat intramuscular adipocytes was extracted using RIPA cell lysate on ice. According to the instructions of the BCA protein assay kit (Biosharp, Shanghai, China), the protein concentration of each sample was determined and denatured at 100 °C. Western blotting analyses were performed as previously described in the literature [17,18]. In brief, each sample was loaded at 30 µg/lane and subjected to 12% SDS-PAGE, and the protein was transferred to a PVDF membrane (Millipore, Billerica, MA, USA). The protein membranes were then incubated with different antibodies at 4 °C. PPARγ, C/EBPβ, and β-actin antibodies (Abcam, Cambridge, UK) were diluted at a ratio of 1:1000. A horseradish peroxidase (HRP)-labeled secondary antibody was diluted at a 1:5000 ratio (Abways, Shanghai, China) and incubated for 1 h at room temperature. Finally, immunodetection was performed using ECL substrate reagents (Bio-Rad, Hercules, CA, USA).

2.8. Statistical Analysis

All the data were analyzed for significance using SPSS 26.0 software and expressed as mean ± SEM. The qPCR images were generated using GraphPad Prism 8.0 software. Student’s two-tailed t-test was utilized to analyze comparisons between two groups. The one-way ANOVA test was utilized to analyze comparisons between multiple groups, and Duncan’s method was used to demonstrate the significance of the data, where “*” means a significant difference (p < 0.05) and “**” means an extremely significant difference (p < 0.01).

3. Results

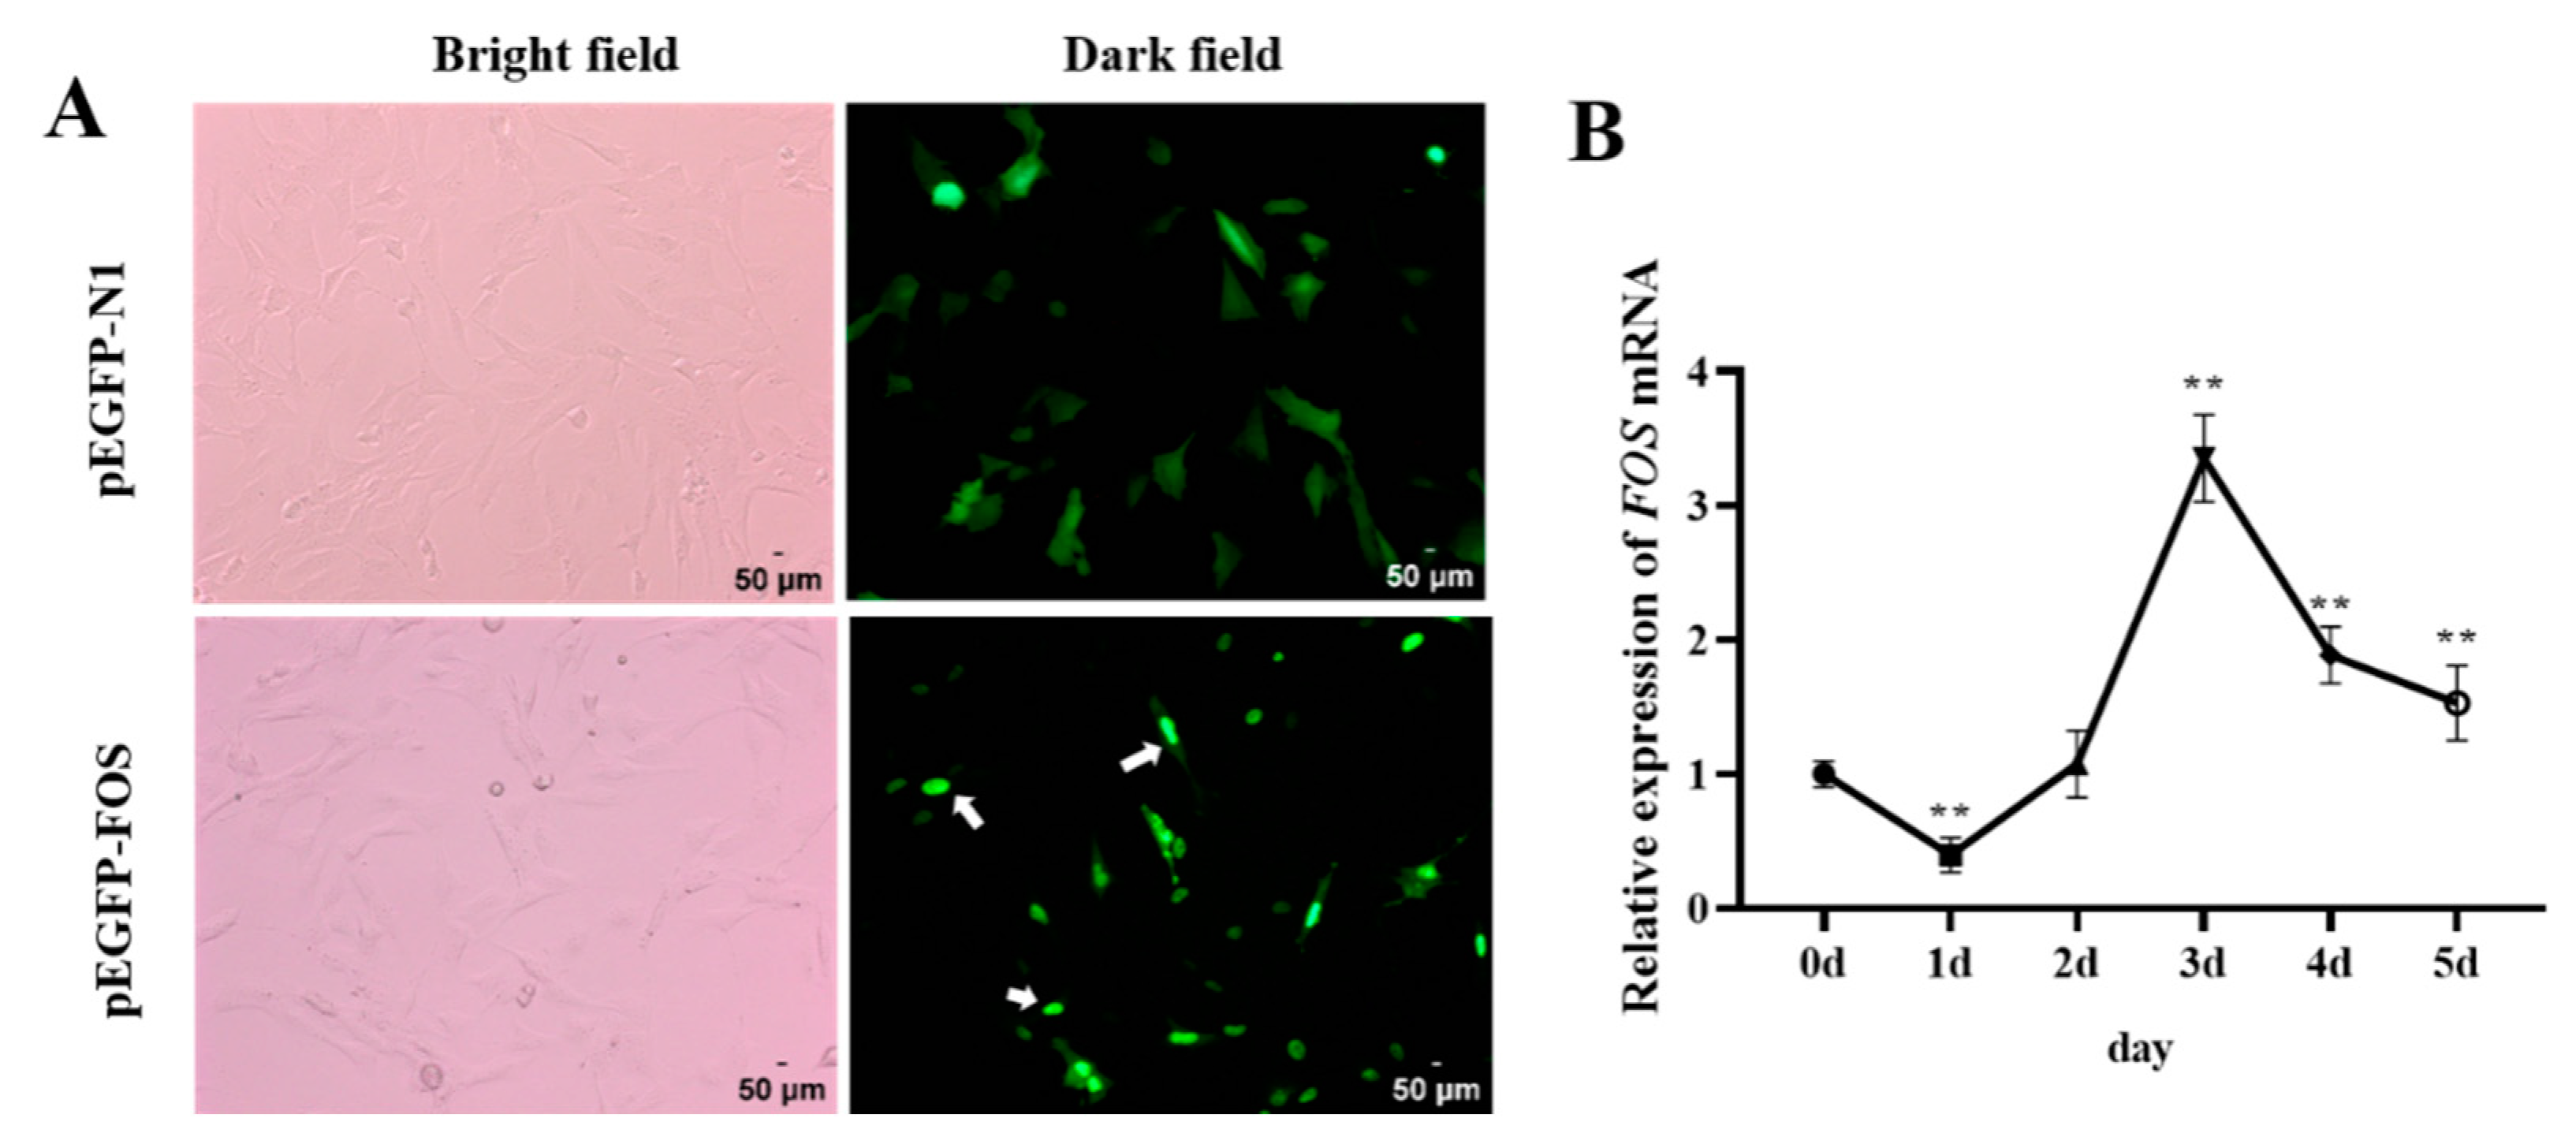
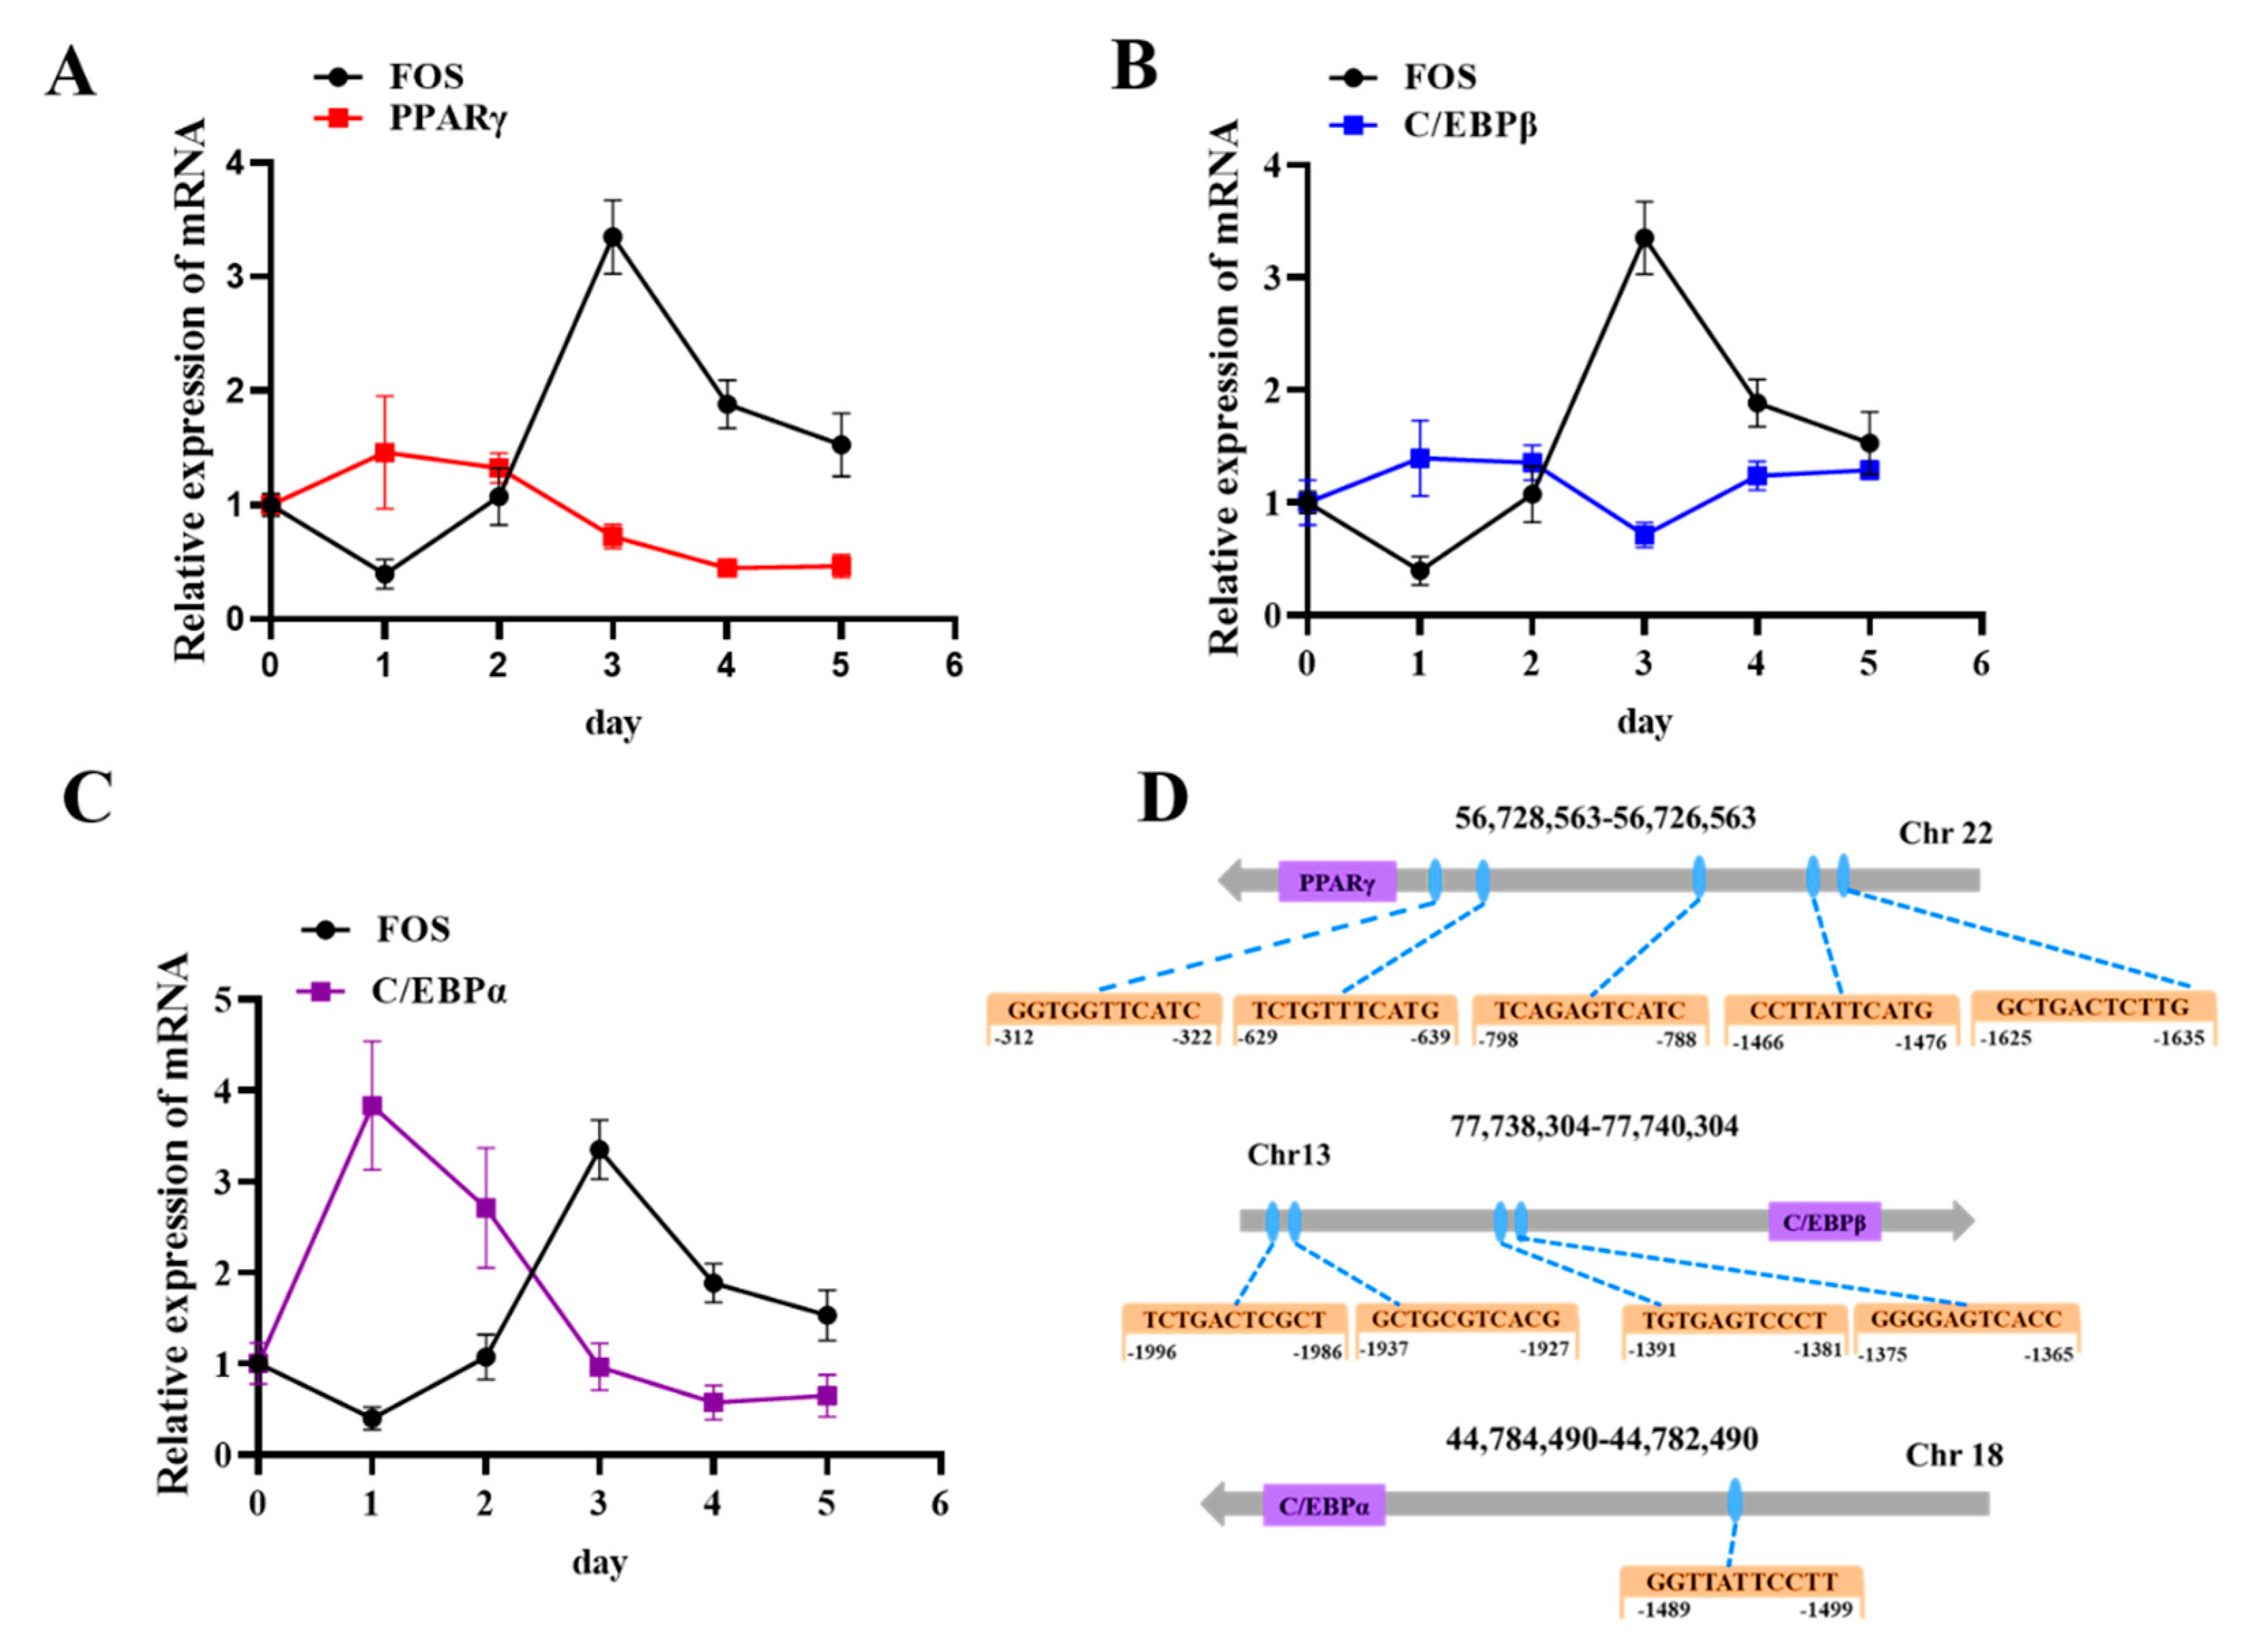
3.1. Subcellular Localization and Expression Patterns of FOS during Differentiation of Goat Intramuscular Adipocytes

Previous research has found that in COS-1 cells, 95% of the FOS proteins are localized in the nucleus, and 5% are in the cytoplasm [19]. To investigate whether the localization of FOS in goat intramuscular adipocytes is consistent with that in COS-1 cells, the FOS overexpression vector (pEGFP-FOS) and pEGFP-N1 were separately transfected in goat intramuscular preadipocytes for 16 h and were observed under an inverted fluorescence microscope. The results showed that the green fluorescence of the pEGFP-N1 vector was uniformly distributed in the whole cell, while the green fluorescence of the FOS protein was mainly distributed in the nucleus (Figure 1A). It was further confirmed that FOS was a nucleoprotein-like protein, and we speculated that the goat FOS protein might mainly play its biological role in the nucleus. Next, the mRNA expression changes in FOS were analyzed during intramuscular adipocyte differentiation. The expression of the FOS gene was low on day 1, reached its highest level on day 3 post-differentiation, and then downregulated after day 4 (Figure 1B). These data suggested that FOS may regulate intramuscular fat production in the late stage of differentiation.

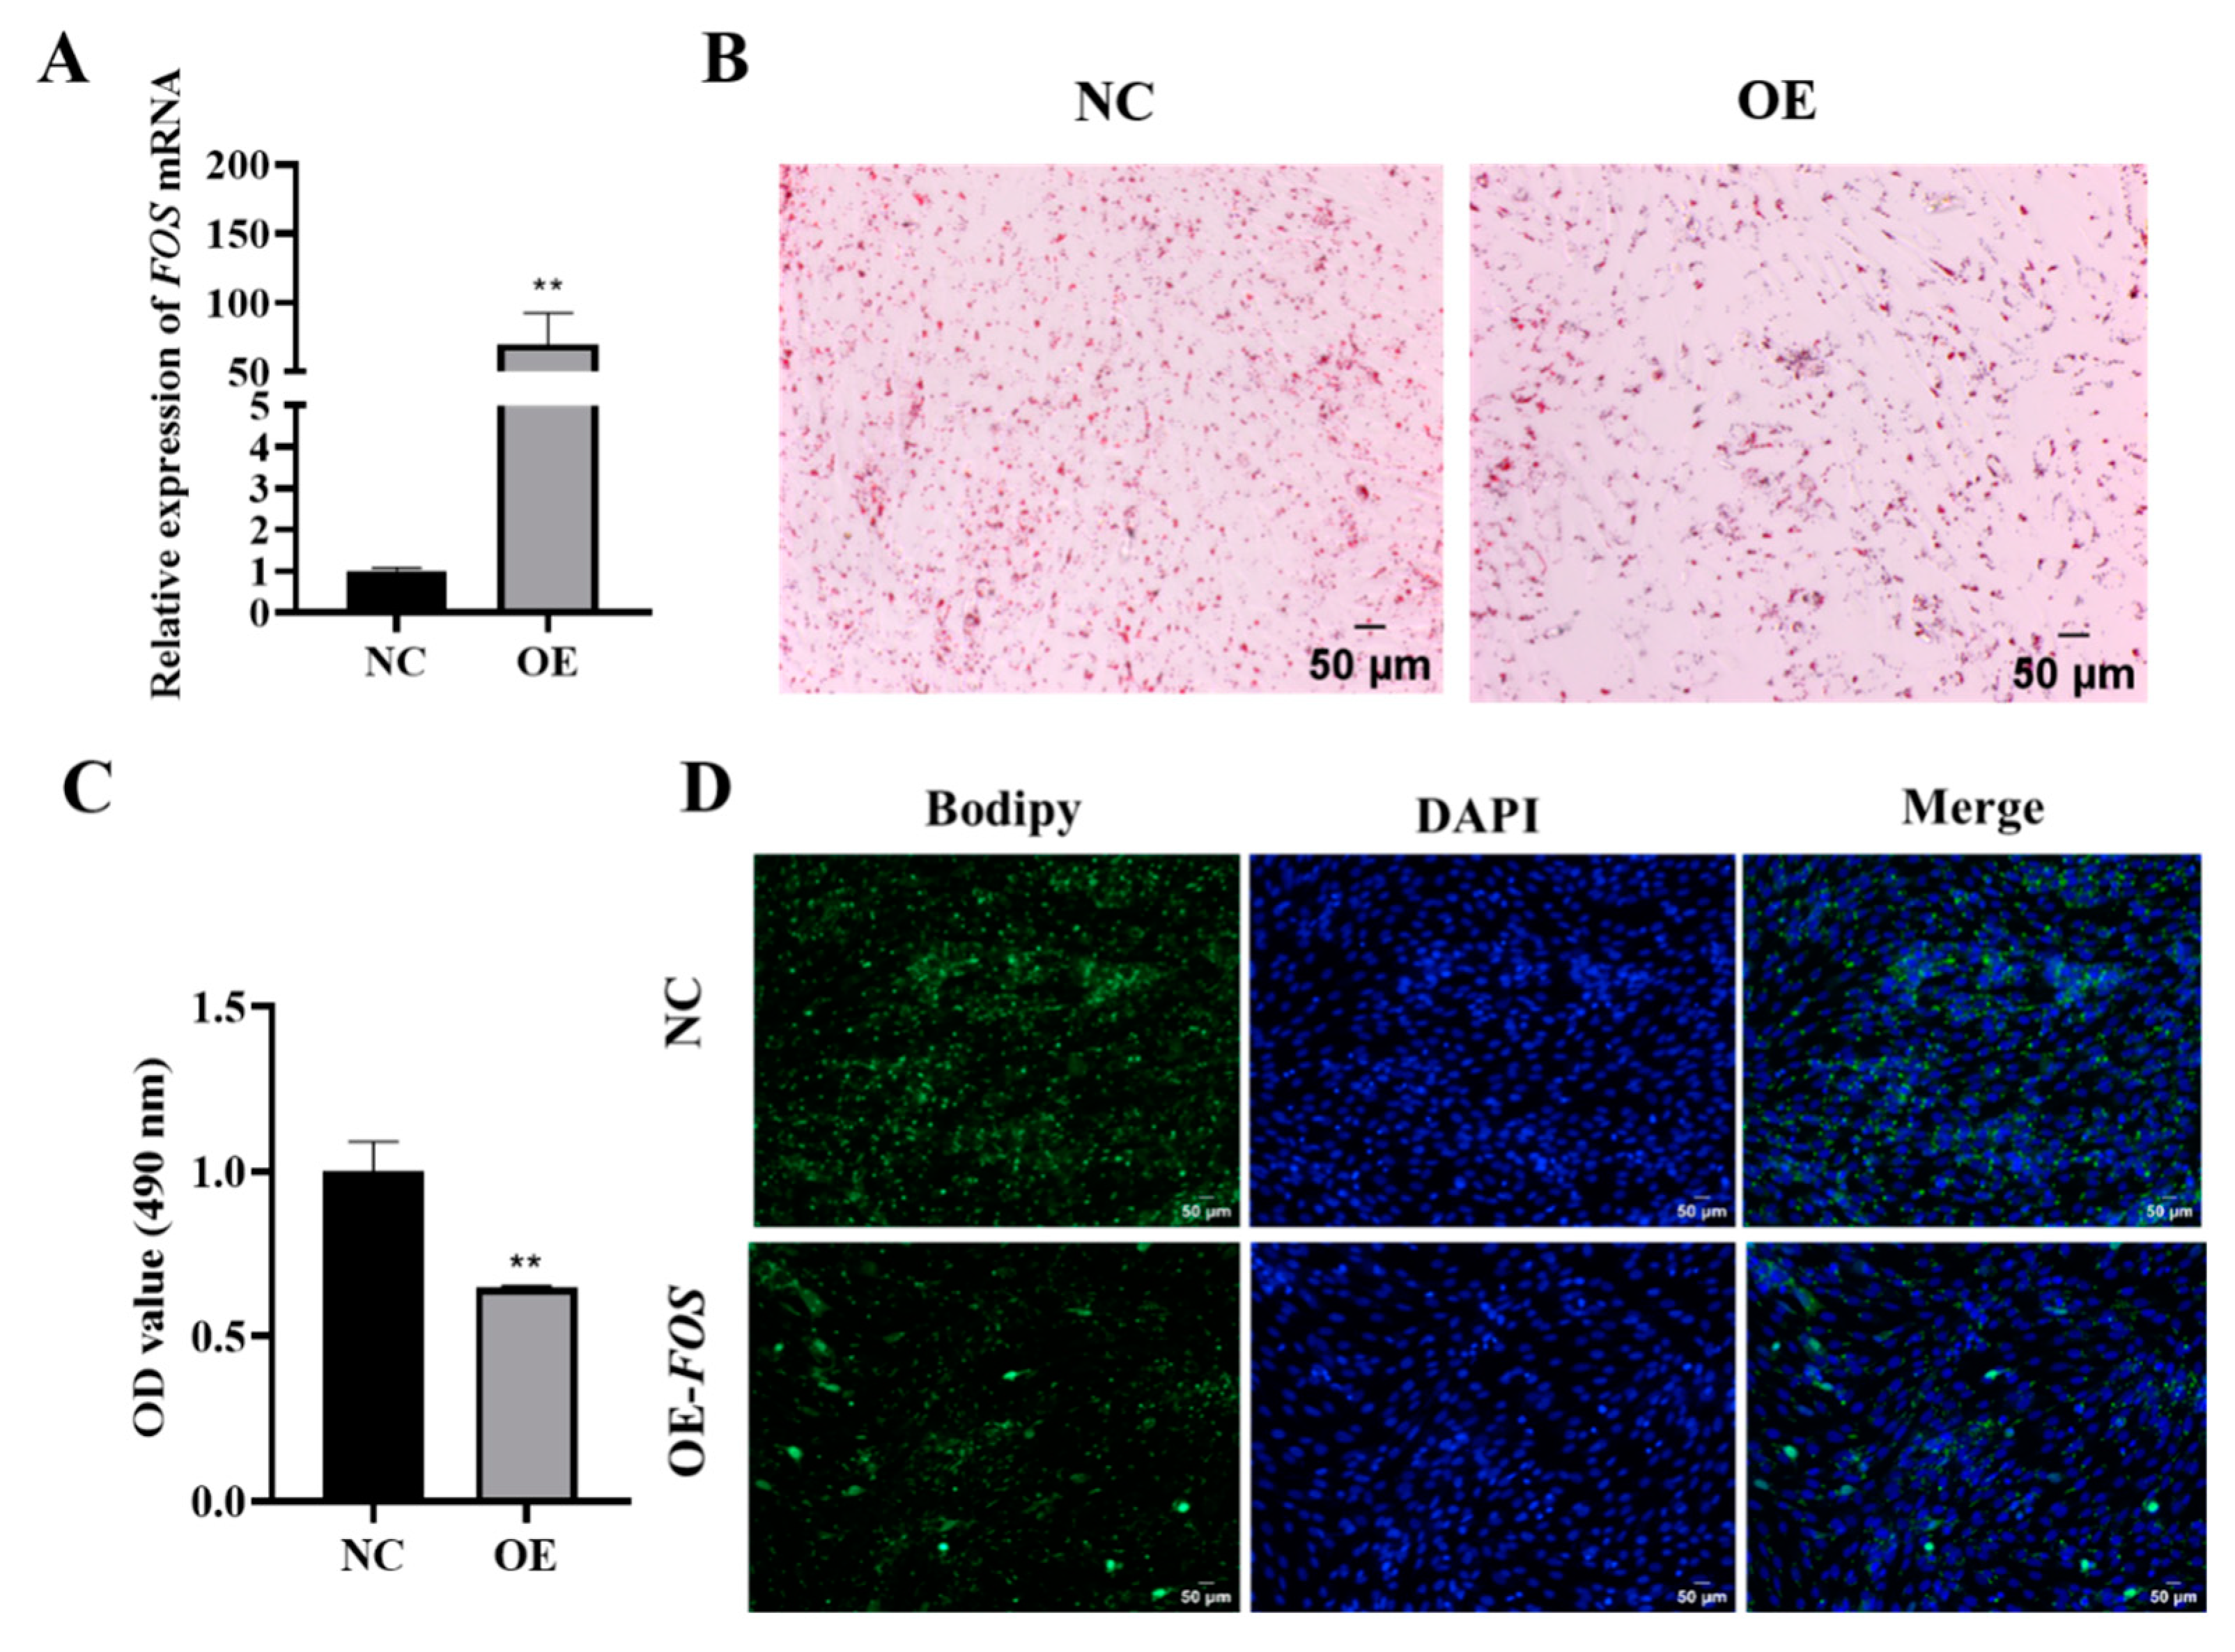
3.2. Overexpression of FOS Inhibits Goat Intramuscular Preadipocyte Differentiation

To investigate the mechanism by which FOS regulates lipid production in goat intramuscular adipocytes, a pEGFP-FOS overexpression vector was constructed and transfected in goat intramuscular preadipocytes, and the overexpression efficiency was then detected using qPCR. The qPCR analysis showed a significant 70-fold increase (p < 0.01) in the expression of FOS compared to that of the NC (Figure 2A). Furthermore, the Oil Red O staining and extraction assay demonstrated that the overexpression of FOS hindered lipid droplet aggregation in goat intramuscular adipocytes (Figure 2B,C). The Bodipy staining results also showed the same trend. (Figure 2D). These data indicate that the overexpression of FOS inhibited intramuscular fat deposition in goats.
Adipocyte differentiation is a major pathway of intramuscular fat deposition in animals and is precisely regulated by a series of key genes and transcription factors [20,21]. To further explore the possible mechanism of the inhibition of lipid droplet aggregation in goat intramuscular adipocytes by the expression of FOS, the expressions of lipogenesis-related genes were also detected. The mRNA levels of AP2, PPARγ, C/EBPβ, C/EBPα, and SREBP1 were significantly decreased in the FOS overexpression group compared to those of the NC (p < 0.05) (Figure 3A). In addition, the genes related to lipid metabolism, such as FASN, ACC, HSL, and ATGL, were highly significantly downregulated, and LPL was highly significantly upregulated (p < 0.01) (Figure 3B,C). However, the cellular TG content was not different in the NC and FOS overexpression group (Figure 3D). PPARγ and C/EBPβ protein expressions were inhibited in the FOS overexpression group (Figure 3E). In summary, the overexpression of FOS inhibits the expression of genes related to adipogenesis.

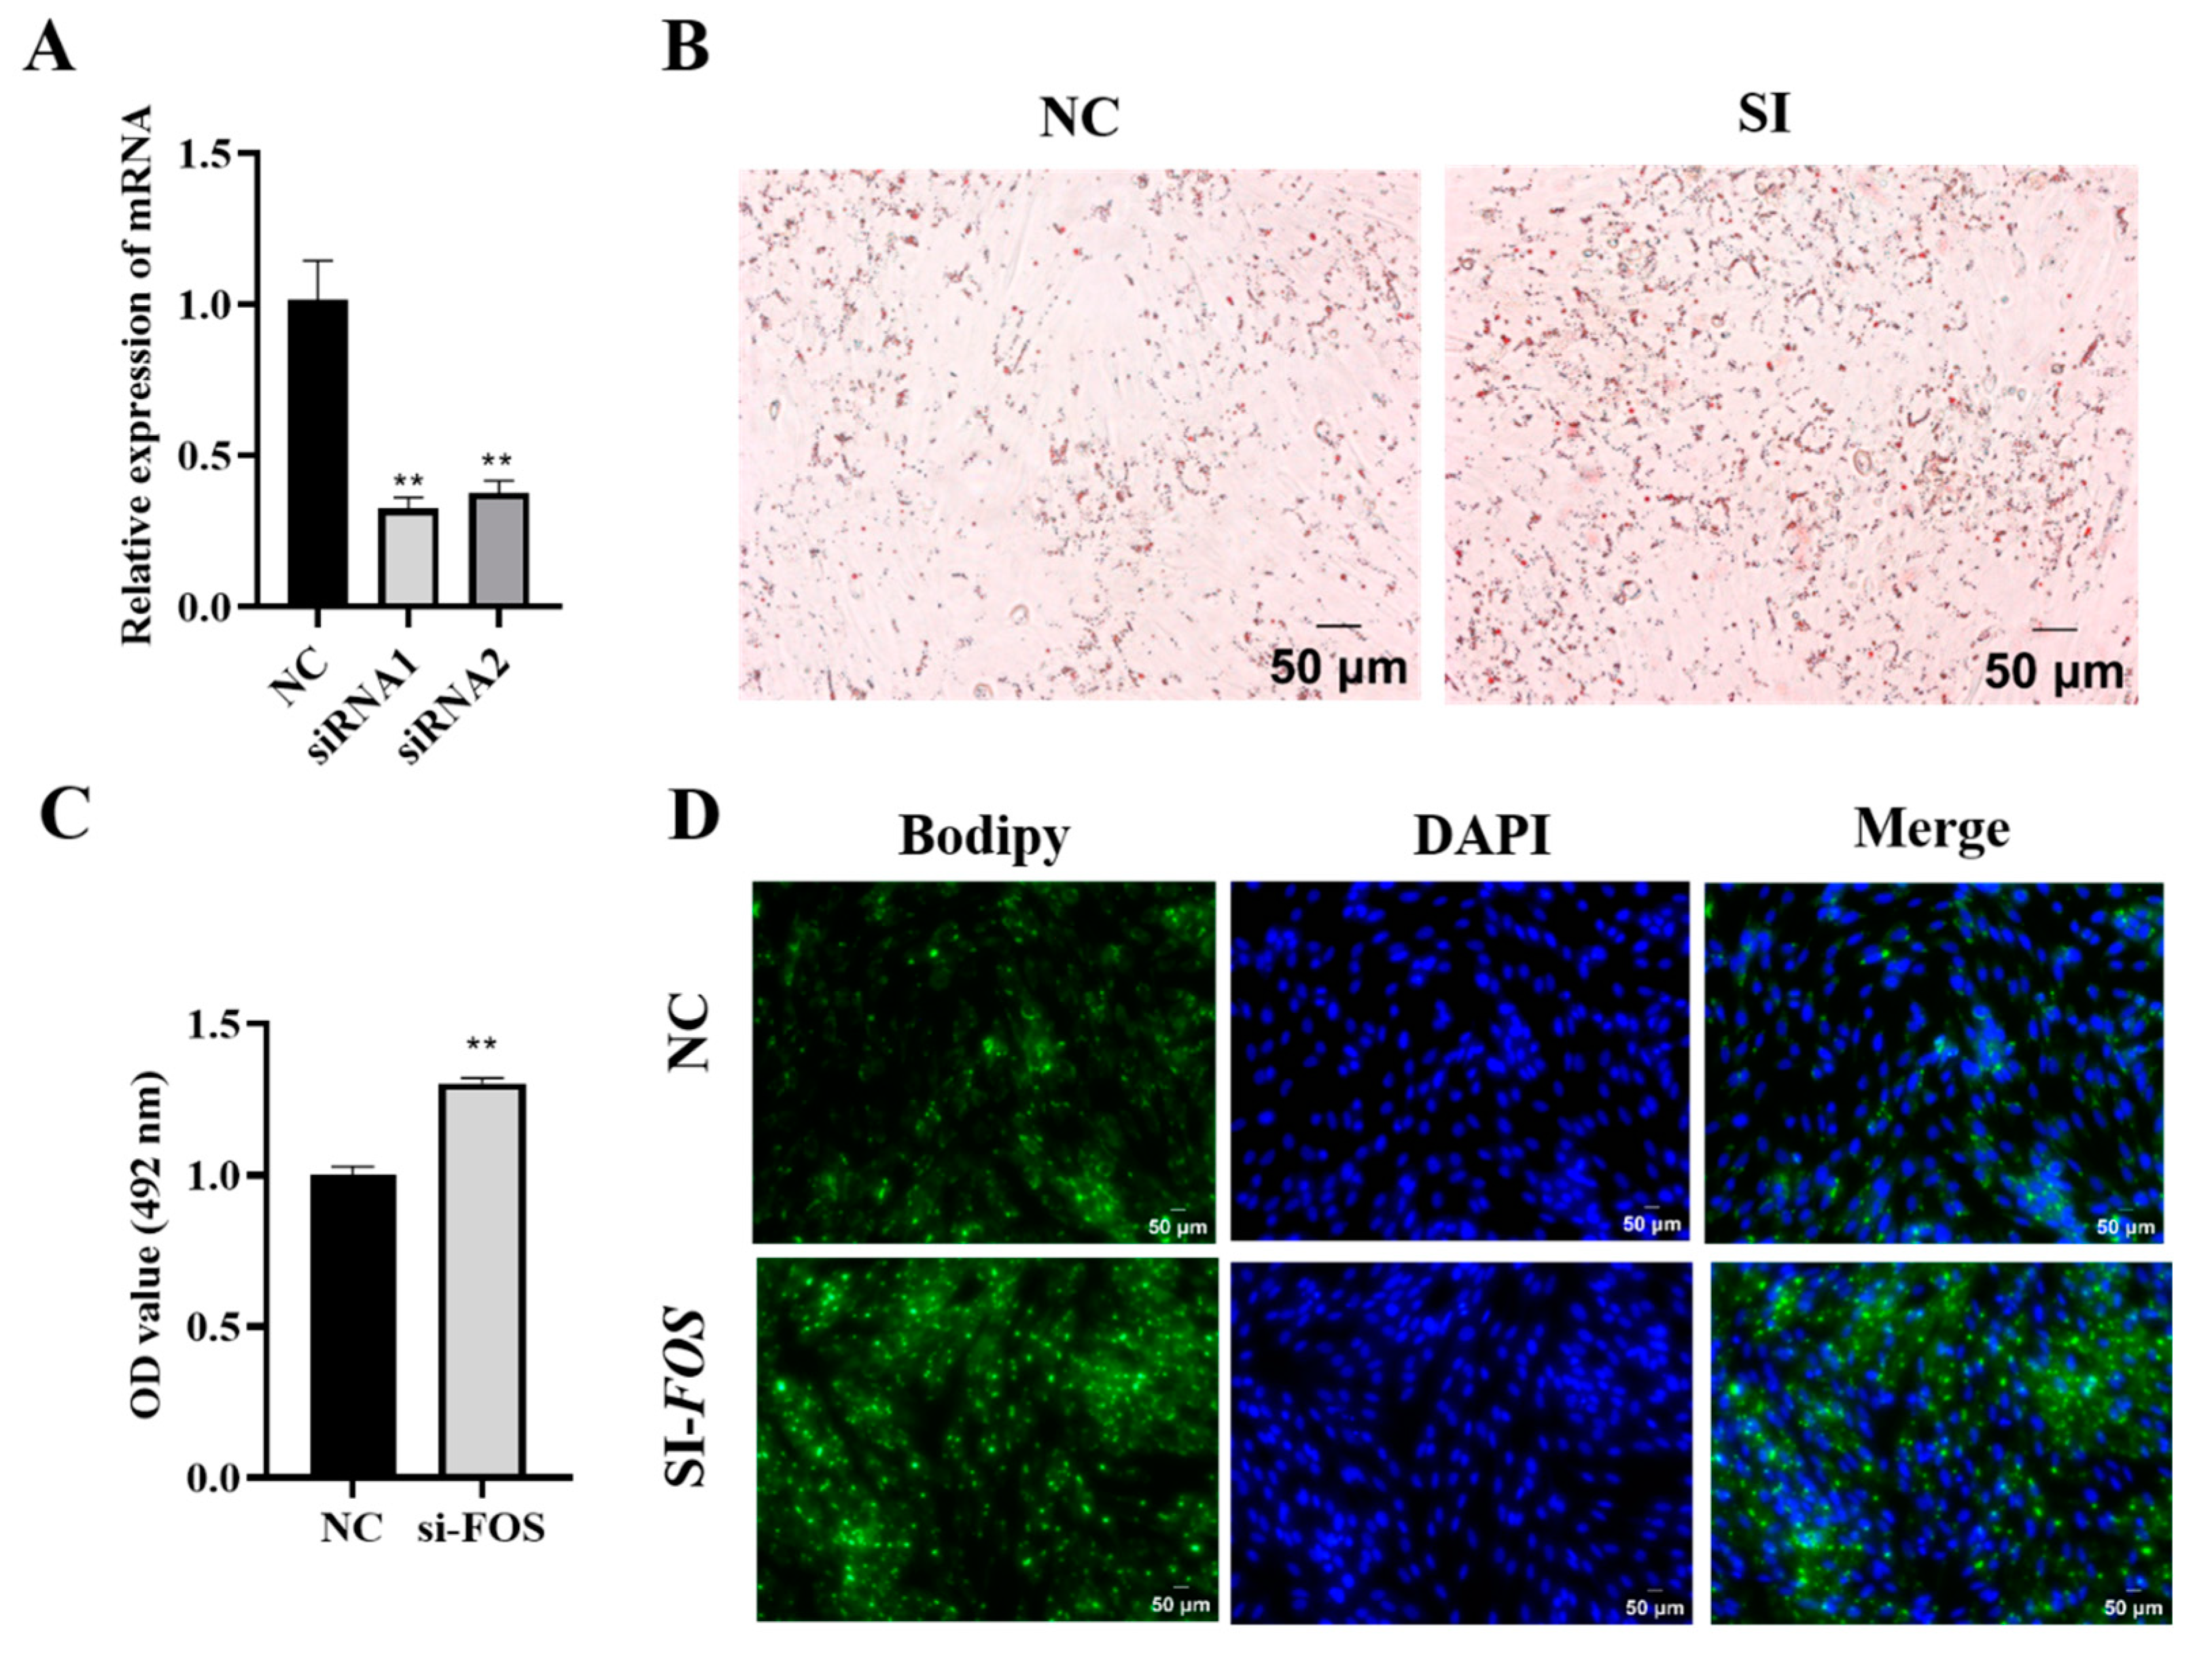
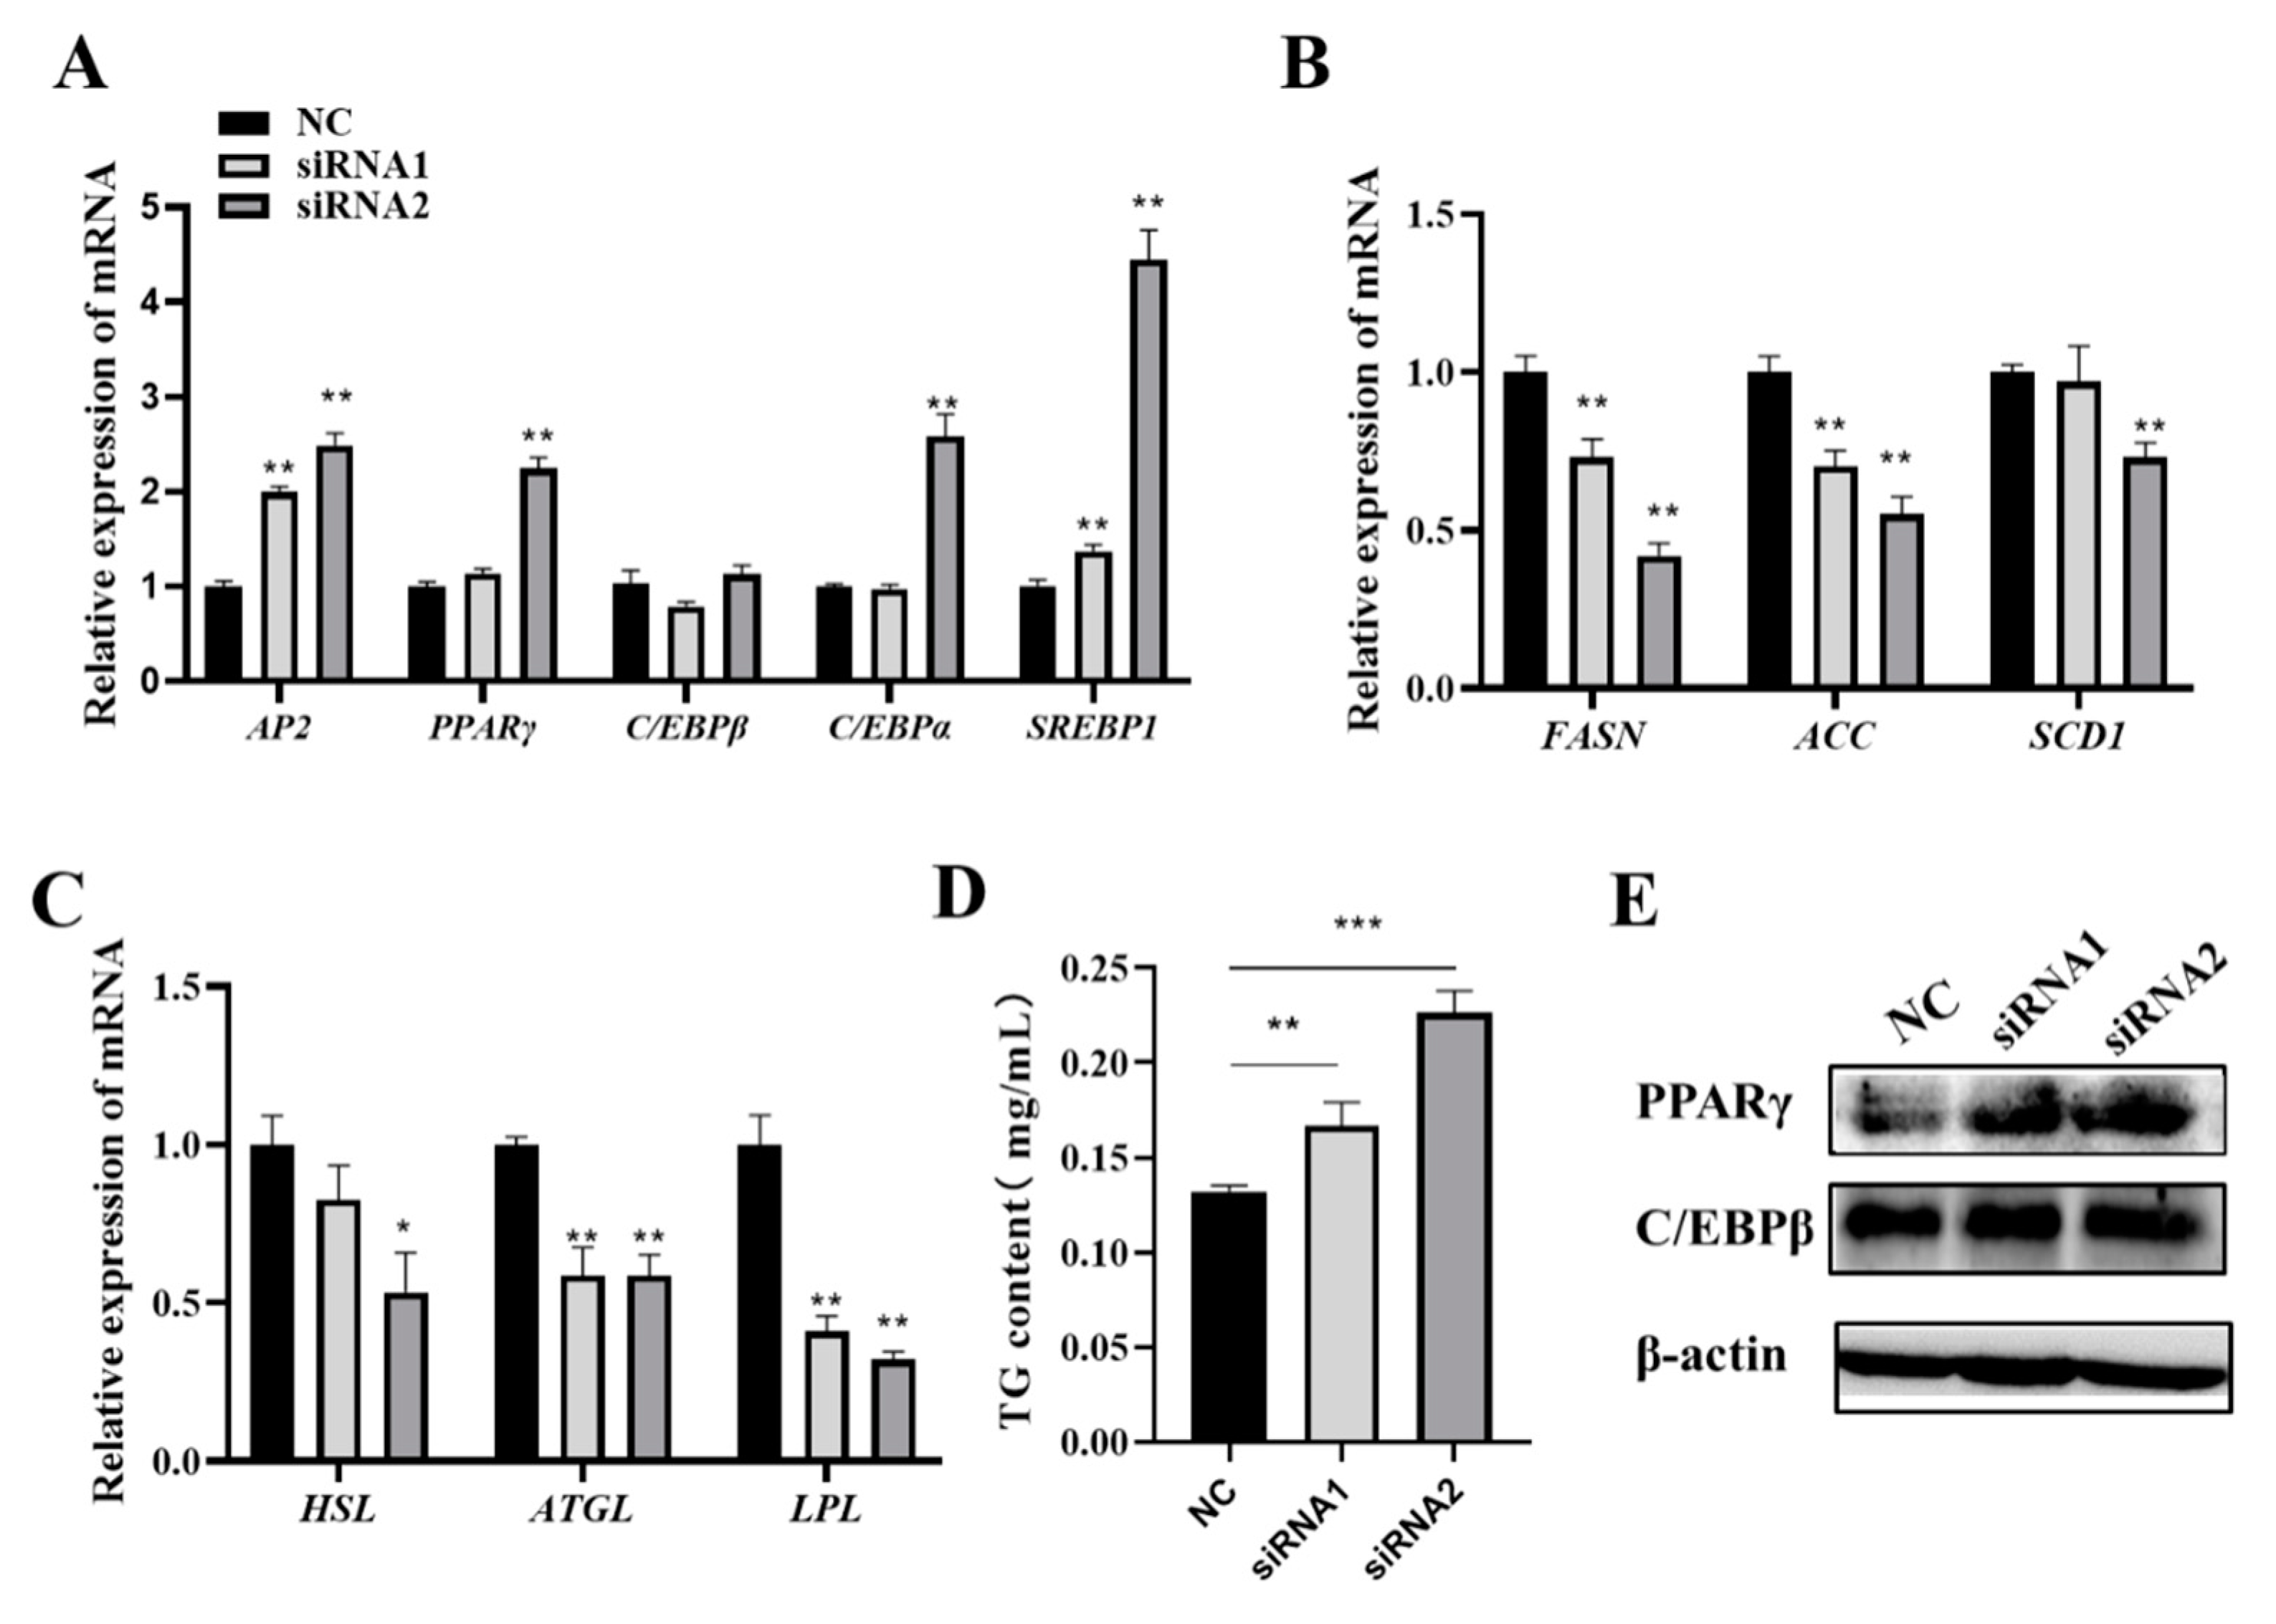
3.3. Knockdown of FOS Promotes Goat Intramuscular Preadipocyte Differentiation

Next, the knockdown of the FOS was achieved using siRNA-mediated techniques in the intramuscular adipocytes of goats. The results showed that the interference efficiency of siRNA1 was 48% and that of siRNA2 was 40% (Figure 4A) compared to those of the NC group. Oil Red O staining and its extraction revealed that the knockdown of FOS significantly promoted lipid droplet aggregation in goat intramuscular adipocytes. (Figure 4B,C). The Bodipy staining results showed the same trend (Figure 4D). In short, the above data suggested that reduced FOS expression increased lipid accumulation.
The expression of lipogenic-related genes was examined after knocking down FOS in adipocytes. The mRNA levels of AP2, PPARγ, C/EBPα, and SREBP1 were significantly increased in the knockdown groups (Figure 5A). Surprisingly, the expressions of lipogenic and lipolysis genes, including FASN, ACC, SCD1, HSL, ATGL, and LPL, were significantly suppressed (p < 0.05) (Figure 5B,C), but the TG content was significantly increased in the knockdown groups (Figure 5D). Meanwhile, PPARγ and C/EBPβ expressions were increased in the knockdown groups (Figure 5E). These results suggested that the loss of function of FOS promoted the expression of intramuscular adipocyte differentiation genes.

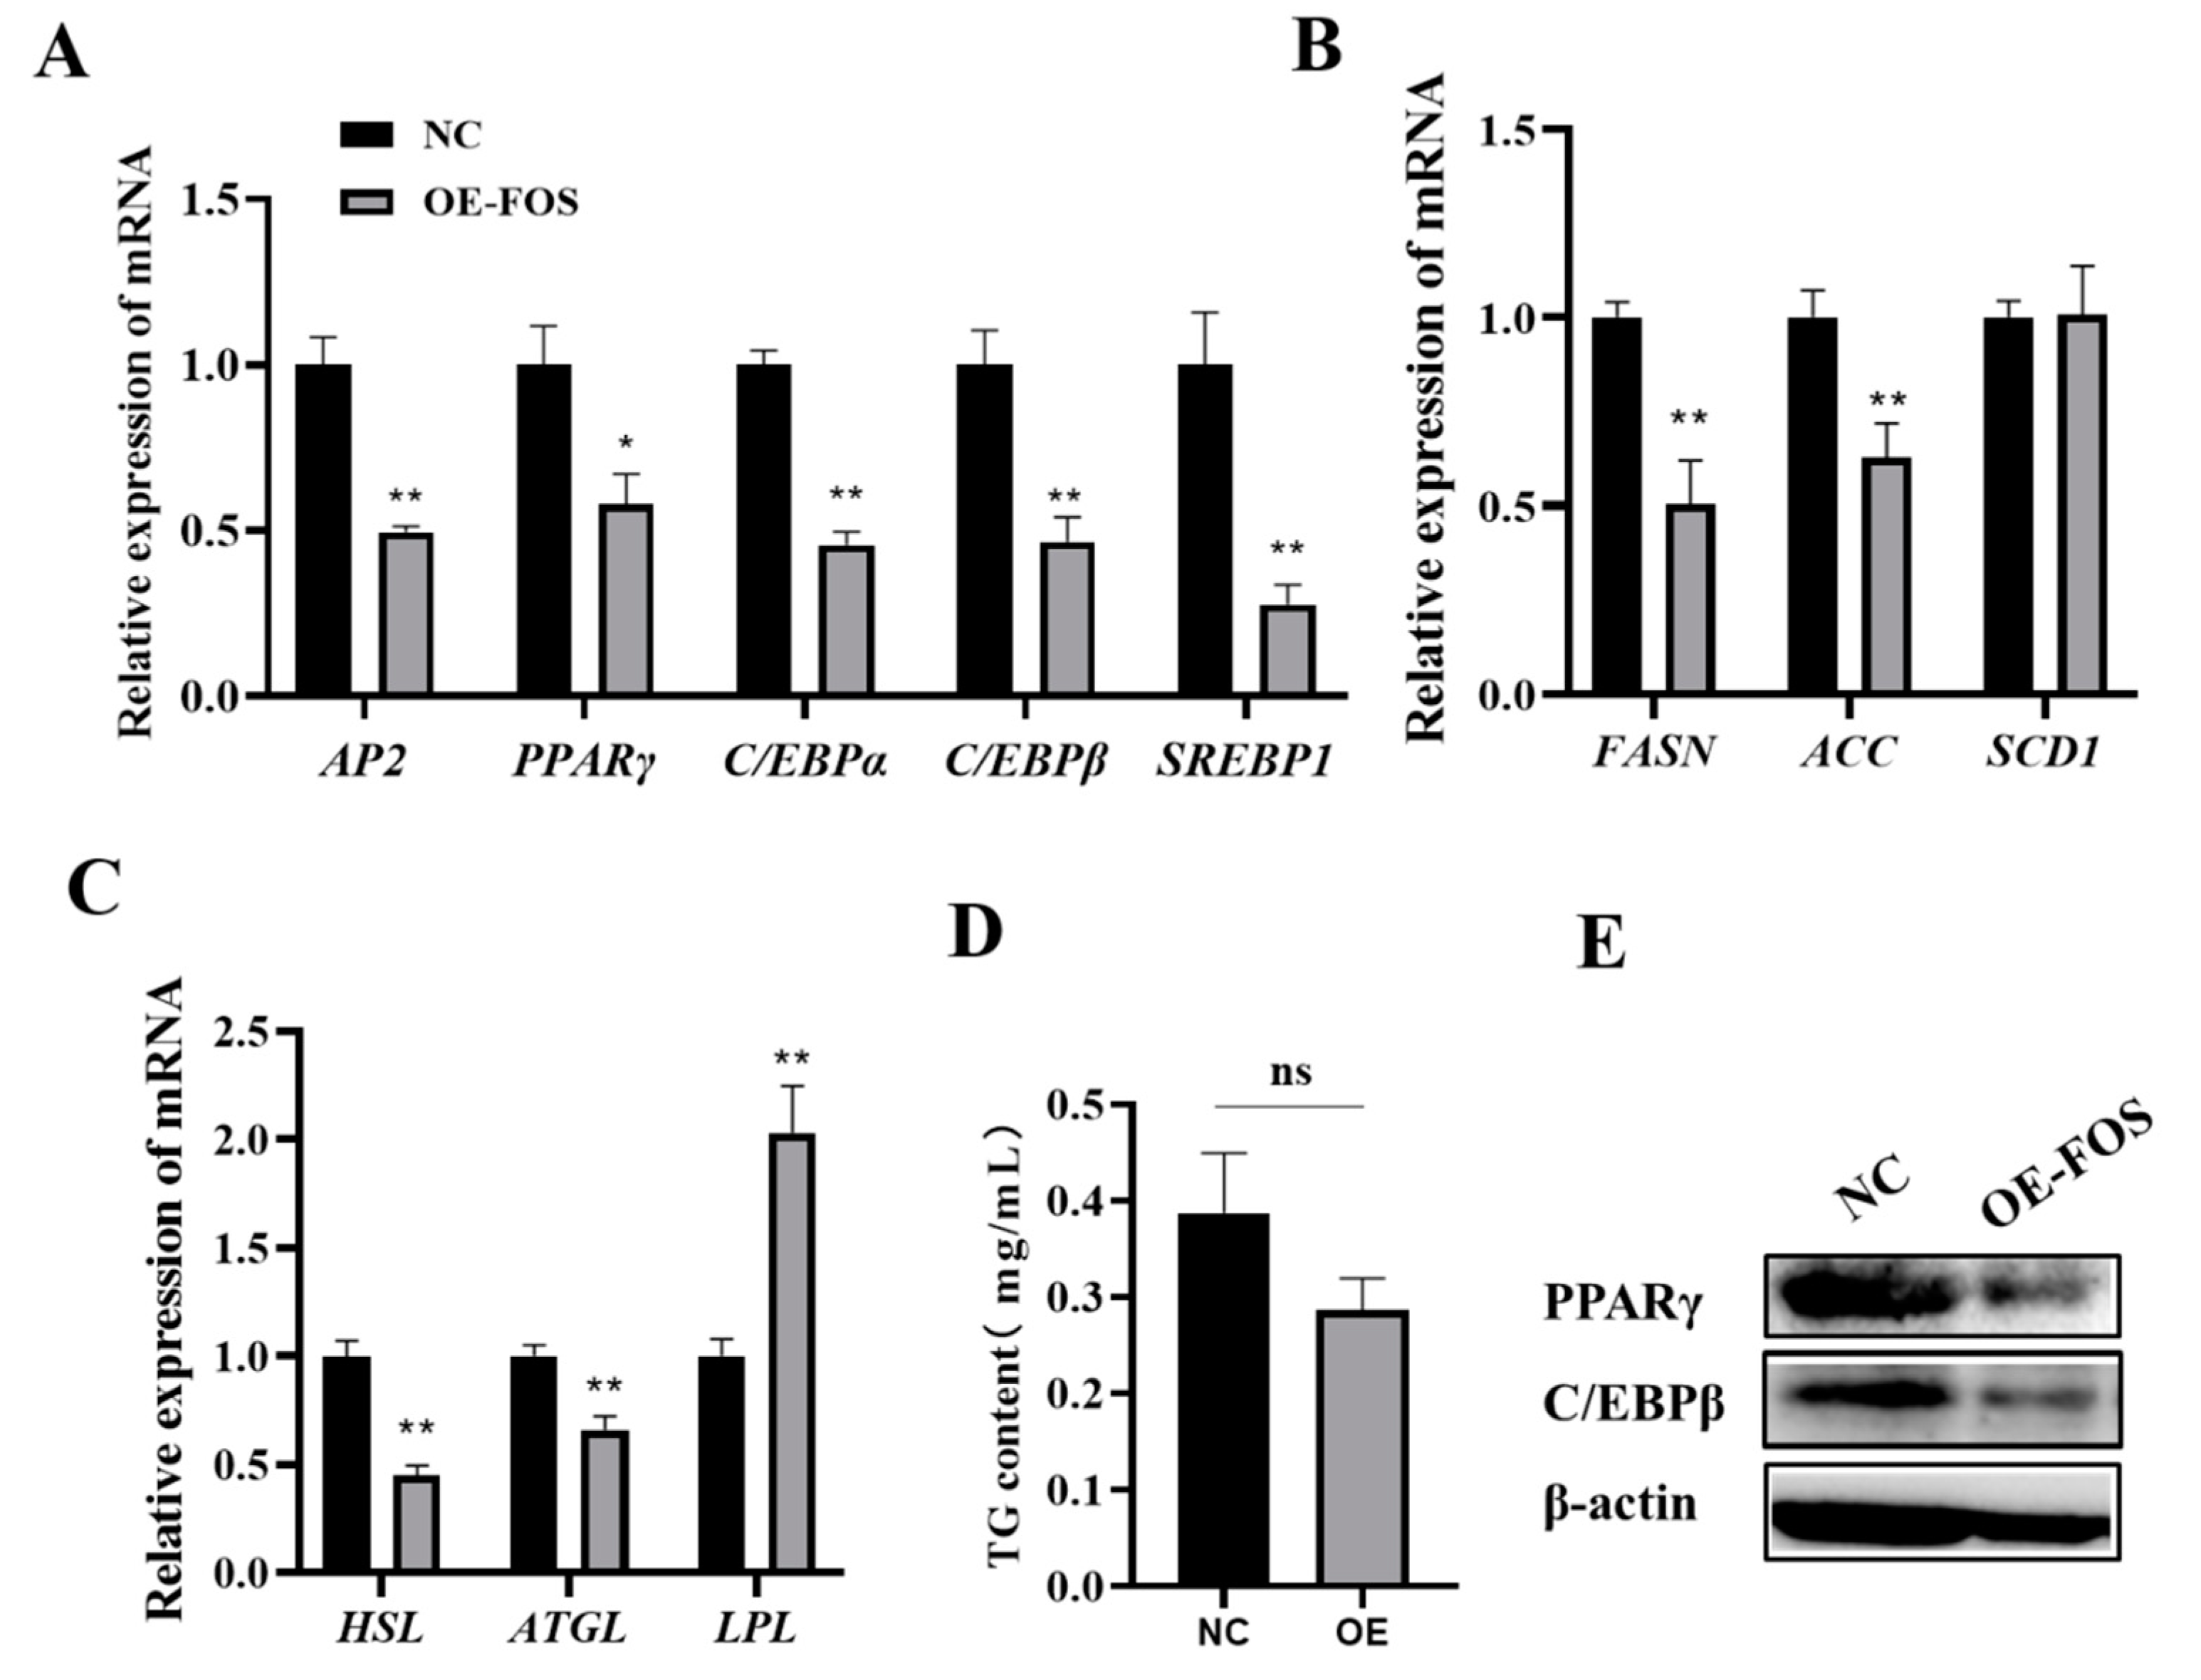
3.4. FOS Affects Intramuscular Preadipocyte Differentiation by Targeting PPARγ, C/EBPβ, and C/EBPα

As FOS was found to be a negative regulator of goat preadipocyte differentiation and to repress the expression of adipogenic genes, we hypothesized that FOS may inhibit lipid deposition by targeting downstream genes. According to the relevant literature, FOS can bind to PPARγ and C/EBP promoter sequences and regulate their expressions. Consequently, the expression changes in PPARγ, C/EBPβ, and C/EBPα were examined in adipocytes induced to differentiate from day 0 to day 5. The results showed that the expressions of PPARγ, C/EBPβ, and C/EBPα were opposite to that of FOS in adipocytes induced to differentiate (Figure 6A–C). Then, the transcriptional binding DNA motif of FOS was analyzed using JASPARsoftware (https://jaspar.elixir.no/ 27 September 2023), and the promoter sequences, including PPARγ, C/EBPβ, and C/EBPα, were downloaded from the NCBI website (https://www.ncbi.nlm.nih.gov/ 27 September 2023). As shown in Figure 6D, PPARγ, C/EBPβ, and C/EBPα were predicted as potential targets of FOS, with multiple potential binding sites in their respective promoter regions. All together, these data suggested that FOS may influence intramuscular adiposity by regulating the expressions of PPARγ, C/EBPβ, and C/EBPα.

4. Discussion

Intramuscular fat deposition is precisely regulated by numerous key genes and transcription factors. Therefore, it is important to reveal the transcription factors that influence adipogenesis to enhance intramuscular fat deposition. Herein, we presented evidence that FOS serves as a negative regulator of intramuscular adipocyte differentiation. Our research provides important theoretical support for refining the molecular network of the key transcription factors regulating intramuscular fat deposition in goats. Previous studies have reported that FOS is encoded by the proto-oncogene c-fos, a nuclear-like protein with an alkaline zipper. In COS-1 cells, 95% of the FOS proteins are localized in the nucleus, and 5% are in the cytoplasm [19]. In this study, we have demonstrated that FOS is localized in the nucleus in goat intramuscular adipocytes and is a nuclear-like protein. We hypothesized that goat FOS proteins may play their biological roles mainly in the nucleus. Barutcu found that the sustained expression of FOS inhibits the terminal differentiation of primary muscle progenitor cells [22]. To investigate the expression pattern of FOS during the differentiation of goat intramuscular adipocytes, the changes in FOS expression in intramuscular adipocytes were examined from day 0 to day 5 of differentiation, and the results revealed that FOS is lowly expressed in the pre-differentiation stage and highly expressed in the late differentiation stage. As mentioned above, we speculated that FOS may play a role in the late stage of differentiation, and the following results suggested that FOS is a negative regulator of genes related to intramuscular lipid droplet aggregation and lipogenesis in goats. First, the overexpression of FOS reduced the intramuscular adipocyte lipid content, as confirmed by the Oil Red O and Bodipy staining results. Moreover, the overexpression of FOS inhibited the expressions of intramuscular adipogenic genes, such as PPARγ, which is a major transcription factor in adipogenesis and has two isozymes, PPARγ1 and PPARγ2 [23]. Previous studies have demonstrated that γ1 was highly expressed in adipose, liver, spleen, and heart tissues, whereas γ2 was highly expressed in adipose tissue; yet, lower expression levels of γ1 and γ2 were found in skeletal muscle tissue [24]. The overexpression of PPARγ2 stimulated intramuscular preadipocyte differentiation in pigs and promoted the expression of lipogenesis-related genes [25]. In addition to PPARγ, the C/EBP family is the major regulator of adipocyte differentiation [26]. The C/EBP transcription factor family includes six members; currently, the most influential on adipocyte differentiation are C/EBPα, β, and δ [27]. It has been shown that PPARγ and C/EBPα are involved in regulating late adipocyte differentiation and control the expressions of downstream genes, such as aP2 and LPL [4]. C/EBPβ is highly expressed in early adipocyte differentiation, and its expression level is gradually downregulated in late adipocyte differentiation [28]. Taken together, PPARγ, C/EBPα, and C/EBPβ are essential factors for adipocyte differentiation. Our results demonstrated that overexpression of FOS inhibits the expression of C/EBPα and C/EBPβ, which is one of the reasons for impaired adipocyte differentiation. LPL is highly expressed in adipose tissue, muscle, and liver [29], and catalyzes the hydrolysis of triglycerides to glycerol and free fatty acids [30]. Overexpression of LPL attenuates lipid droplet accumulation and improves glucose metabolism in the liver of HFD-fed mice [31]. Our results showed that LPL was upregulated in FOS-overexpressing cells and was downregulated in the knockdown cells. We hypothesized that the main reason for the inhibition of lipid accumulation by the overexpression of FOS was a decrease in triglyceride synthesis, which was also supported by a decrease in the mRNA level of LPL in siRNA-treated cells. What is surprising is that the lipid metabolism-related genes, FASN, ACC, HSL, and ATGL, were significantly downregulated in overexpression and knockdown cells. FASN can produce long-chain fatty acids in the presence of malonyl coenzyme A, whereas ACC is the rate-limiting enzyme for the biosynthesis of long-chain fatty acids, and both are key enzymes in lipogenesis [32,33]. ATGL catalyzes the conversion from triglycerides to diacylglycerols and fatty acids, and the knockout of ATGL in vascular stromal cells and fibroblasts resulted in a decrease in TG hydrolase activity and an increase in TG content [34]. HSL is also a lipolytic enzyme, and adipocyte-specific HSL-knockout mice exhibit excessive hepatic fat accumulation and diminished lipolytic activity after being fed a high-fat diet [35]. The extent of fat deposition depends on the balance between TG synthesis and catabolism [36]. When the ability to synthesize triglycerides decreases faster than the rate of catabolism, this leads to a decrease in triglyceride levels and, conversely, an increase. This is one of the main reasons that the overexpression of FOS inhibited lipid accumulation, whereas the knockdown of FOS promoted lipid accumulation. It has been reported that FOS proteins are highly expressed in NASH mice, and microRNA29c can regulate the course of NASH by targeting FOS proteins [37]. The specific binding from SPARC to C-FOS leads to a decrease in AP-1 activity, which inhibits adipogenesis but promotes osteoclast differentiation [38]. These previous findings are inconsistent with the results of this study, and we speculated that the various roles played by FOS in adipogenesis may be attributed to species variations and inconsistent mechanisms of action.
Bioinformatics analysis has demonstrated that PPARγ, C/EBPβ, and C/EBPα promoters possess multiple binding sites for FOS. Moreover, it has been reported that PPARγ, C/EBPα, and C/EBPβ exhibit promoter-binding activities with FOS [13,39,40,41]. Therefore, we hypothesized that PPARγ, C/EBPα, and C/EBPβ may be potential target genes for the FOS regulation of intramuscular adipocyte differentiation in goats. The experimental results indicated that the mRNA levels of PPARγ, C/EBPβ, and C/EBPα changed during intramuscular adipogenesis and were opposite to that of FOS. Meanwhile, the expression levels of PPARγ and C/EBPα were remarkably upregulated after the knockdown of FOS. It is a discrepancy that the knockdown of c-Fos inhibits 3T3-L1 cell differentiation by affecting the PPARγ2 promoter activity [12]. We hypothesized that the inconsistent regulatory effects of FOS on PPARγ may be due to differences in species and cell types. This might also be because FOS is not a single transcription factor but is a part of the AP-1 complex. It has been reported that FOS forms heterodimers with JUN and ATF, which then bind to specific sequences within the regulatory regions of target genes [42,43]. Perhaps, because of differences in the dimer composition in adipocytes, the activation or repression effect on target genes was different [42]. It has been shown that C/EBPα could interact with FOS and strongly induce monocytic differentiation [44]. In addition, the overexpressions of FOS and its family members, Fra-1 and FosB, affect lipogenesis by inhibiting C/EBP activity [45,46]. As mentioned above, we speculated that FOS may influence intramuscular adiposity by regulating the expressions of PPARγ, C/EBPβ, and C/EBPα.

5. Conclusions

In conclusion, our findings highlight that FOS serves as an inhibitory factor in the differentiation of intramuscular adipocytes in goats. This inhibition is associated with notable changes in the levels of key adipogenic transcription factors, including PPARγ, C/EBPβ, and C/EBPα, along with alterations in the expressions of critical lipid-metabolism genes, such as FASN, ACC, and LPL. These results not only underscore the potential of FOS as a novel target for improving the quality of goat meat but also provide essential data for further investigation into the intricate molecular mechanisms governing the FOS regulatory network in IMF deposition.

Author Contributions

Conceptualization, T.H., Y.L. (Yaqiu Lin) and R.L.; methodology, T.H., Y.L. (Yaqiu Lin) and R.L.; software and formal analysis, T.H., Z.L., C.G., Y.X., S.S., J.X., Y.L. (Yanyan Li), Y.W. (Youli Wang) and Y.L. (Yaqiu Lin); validation, T.H., Z.L. and C.G.; resources, Y.L. (Yaqiu Lin) and T.H.; writing—original draft preparation, T.H.; writing—review and editing, Y.L. (Yaqiu Lin) and J.X.; supervision, J.X., Y.W. (Yong Wang), R.L., Y.W. (Youli Wang) and Y.L. (Yanyan Li). All authors have read and agreed to the published version of the manuscript.

Funding

This work was supported by the National Natural Sciences Foundation of China (32072723), Natural Science Foundation of Sichuan Province (23NSFSC1804), Sichuan Science and Technology Program (2022JDTD0030, 2019YJ0258), and Southwest Minzu University Double World-Class Project (XM2023011) and by the Fundamental Research Funds for the Central Universities, Southwest Minzu University (2022NYXXS026).

Institutional Review Board Statement

The experimental protocols were approved by the Laboratory Animal Ethics Committee of Southwest Minzu University. The experimental animal certification number was 2020086, 2020.

Data Availability Statement

Data are contained within the article.

Conflicts of Interest

The authors declare no conflict of interest.

Abbreviations

IMFIntramuscular fat
AP-1Activator protein-1
PPARγPeroxisome proliferator-activated receptor γ
C/EBPβCCAAT enhancer binding protein β
C/EBPαCCAAT enhancer binding protein α
AP2Fatty-acid binding protein
SREBP1Sterol regulatory element binding protein-1
FASNFatty-acid synthase
ACCAcetyl-coenzyme A carboxylase
SCD1Stearoyl-coenzyme A desaturase 1
HSLHormone-sensitive lipase
ATGLAdipose triglyceride lipase
LPLLipoprotein lipase
UXTUbiquitously expressed transcript gene
NCNegative control
OEOverexpression
HFD-fedHigh-fat-diet feed
NASHNonalcoholic steatohepatitis
SPARCSecreted protein acidic and rich in cysteine

References

  1. Jia, W.; Di, C.; Shi, L. Applications of lipidomics in goat meat products: Biomarkers, structure, nutrition interface and future perspectives. J. Proteom. 2023, 6, 104753. [Google Scholar] [CrossRef] [PubMed]
  2. Xiao, C.; Wei, T.; Liu, L.X.; Liu, J.Q.; Wang, C.X.; Yuan, Z.Y.; Ma, H.H.; Jin, H.G.; Zhang, L.C.; Cao, Y. Whole-Transcriptome Analysis of Preadipocyte and Adipocyte and Construction of Regulatory Networks to Investigate Lipid Metabolism in Sheep. Front. Genet. 2021, 29, 662143. [Google Scholar] [CrossRef] [PubMed]
  3. Hocquette, J.F.; Gondret, F.; Baéza, E.; Médale, F.; Jurie, C.; Pethick, D.W. Intramuscular fat content in meat-producing animals: Development, genetic and nutritional control, and identification of putative markers. Animal 2010, 4, 303–319. [Google Scholar] [CrossRef] [PubMed]
  4. Liu, S.; Huang, J.; Wang, X.; Ma, Y. Transcription factors regulate adipocyte differentiation in beef cattle. Anim. Genet. 2020, 51, 351–357. [Google Scholar] [CrossRef] [PubMed]
  5. Milde-Langosch, K. The Fos family of transcription factors and their role in tumourigenesis. Eur. J. Cancer 2005, 41, 2449–2461. [Google Scholar] [CrossRef] [PubMed]
  6. Choi, Y.; Rosewell, K.L.; Brännström, M.; Akin, J.W.; Curry, T.E.; Jo, M. FOS, a Critical Downstream Mediator of PGR and EGF Signaling Necessary for Ovulatory Prostaglandins in the Human Ovary. J. Clin. Endocrinol. Metab. 2018, 103, 4241–4252. [Google Scholar] [CrossRef] [PubMed]
  7. Dalhäusser, A.K.; Rössler, O.G.; Thiel, G. Regulation of c-Fos gene transcription by stimulus-responsive protein kinases. Gene 2022, 5, 146284. [Google Scholar] [CrossRef]
  8. Iwatsuki, M.; Matsuoka, M. Fluoride-induced c-Fos expression in MC3T3-E1 osteoblastic cells. Toxicol. Mech. Methods 2016, 26, 132–138. [Google Scholar] [CrossRef]
  9. Tong, X.; Chen, M.; Song, R.; Zhao, H.; Bian, J.; Gu, J.; Liu, Z. Overexpression of c-Fos reverses osteoprotegerin-mediated suppression of osteoclastogenesis by increasing the Beclin1-induced autophagy. J. Cell. Mol. Med. 2020, 25, 937–945. [Google Scholar] [CrossRef]
  10. Racca, A.C.; Prucca, C.G.; Caputto, B.L. Fra-1 and c-Fos N-Terminal Deletion Mutants Impair Breast Tumor Cell Proliferation by Blocking Lipid Synthesis Activation. Front. Oncol. 2019, 19, 544. [Google Scholar] [CrossRef]
  11. Distel, R.; Ro, H.; Rosen, B.; Groves, D.; Spiegelman, B. Nucleoprotein complexes that regulate gene expression in adipocyte differentiation: Direct participation of c-fos. Cell 1987, 49, 835–844. [Google Scholar] [CrossRef] [PubMed]
  12. Xiao, H.; LeBlanc, S.E.; Wu, Q.; Konda, S.; Salma, N.; Marfella, C.G.A.; Ohkawa, Y.; Imbalzano, A.N. Chromatin accessibility and transcription factor binding at the PPARγ2 promoter during adipogenesis is protein kinase A-dependent. J. Cell. Physiol. 2010, 226, 86–93. [Google Scholar] [CrossRef] [PubMed]
  13. Wang, X.; Yang, P.; Liu, J.; Wu, H.; Yu, W.; Zhang, T.; Fu, H.; Liu, Y.; Hai, C. RARγ-C-Fos-PPARγ2 signaling rather than ROS generation is critical for all-trans retinoic acid-inhibited adipocyte differentiation. Biochimie 2014, 106, 121–130. [Google Scholar] [CrossRef] [PubMed]
  14. Chen, K.; Wang, L.; Yang, W.; Wang, C.; Hu, G.; Mo, Z. Profiling of differentially expressed genes in adipose tissues of multiple symmetric lipomatosis. Mol. Med. Rep. 2017, 16, 6570–6579. [Google Scholar] [CrossRef] [PubMed]
  15. Xiong, Y.; Wang, Y.; Xu, Q.; Li, A.; Yue, Y.; Ma, Y.; Lin, Y. LKB1 Regulates Goat Intramuscular Adipogenesis Through Focal Adhesion Pathway. Front. Physiol. 2021, 13, 755598. [Google Scholar] [CrossRef] [PubMed]
  16. Chen, D.; Lin, Y.; Zhao, N.; Wang, Y.; Li, Y. Hoxa5 Inhibits the Proliferation and Induces Adipogenic Differentiation of Subcutaneous Preadipocytes in Goats. Animals 2022, 21, 1859. [Google Scholar] [CrossRef] [PubMed]
  17. Chen, D.; Li, Y.; Hu, T.; Gong, C.; Lu, G.; Ma, X.; Wang, Y.; Wang, Y.; Lin, Y. PDZK1-Interacting Protein 1(PDZKIP1) Inhibits Goat Subcutaneous Preadipocyte Differentiation through Promoting Autophagy. Animals 2023, 14, 1046. [Google Scholar] [CrossRef] [PubMed]
  18. Xu, Q.; Li, Y.; Lin, S.; Wang, Y.; Zhu, J.; Lin, Y. KLF4 Inhibits the Differentiation of Goat Intramuscular Preadipocytes Through Targeting C/EBPβ Directly. Front. Genet. 2021, 4, 663759. [Google Scholar] [CrossRef]
  19. Campos, M.; Kroon, E.; Gentz, R.; Ferreira, P. Protein domains involved in nuclear transport of Fos. Cell Biol. Int. 1999, 23, 81–88. [Google Scholar] [CrossRef]
  20. White, U.A.; Stephens, J.M. Transcriptional factors that promote formation of white adipose tissue. Mol. Cell. Endocrinol. 2010, 318, 10–14. [Google Scholar] [CrossRef]
  21. Lefterova, M.I.; Lazar, M.A. New developments in adipogenesis. Trends Endocrinol. Metab. 2009, 20, 107–114. [Google Scholar] [CrossRef]
  22. Barutcu, A.R.; Elizalde, G.; Gonzalez, A.E.; Soni, K.; Rinn, J.L.; Wagers, A.J.; Almada, A.E. Prolonged FOS activity disrupts a global myogenic transcriptional program by altering 3D chromatin architecture in primary muscle progenitor cells. Skelet. Muscle 2022, 15, 20. [Google Scholar] [CrossRef]
  23. Jing, Y.; Mu, F.; Xing, X.; Huang, J.; Lou, M.; Xu, H.; Ning, B.; Lou, Y.; Gao, Z.; Luo, H.; et al. Knockout and Restoration Reveal Differential Functional Roles of PPARγ1 and PPARγ2 in Chicken Adipogenesis. J. Agric. Food Chem. 2022, 70, 14959–14973. [Google Scholar] [CrossRef] [PubMed]
  24. Vidal-Puig, A.; Jimenez-Liñan, M.; Lowell, B.; Hamann, A.; Hu, E.; Spiegelman, B.; Flier, J.; Moller, D. Regulation of PPAR gamma gene expression by nutrition and obesity in rodents. J. Clin. Investig. 1996, 97, 2553–2561. [Google Scholar] [CrossRef] [PubMed]
  25. Gu, H.; Zhou, Y.; Yang, J.; Li, J.; Peng, Y.; Zhang, X.; Miao, Y.; Jiang, W.; Bu, G.; Hou, L.; et al. Targeted overexpression of PPARγ in skeletal muscle by random insertion and CRISPR/Cas9 transgenic pig cloning enhances oxidative fiber formation and intramuscular fat deposition. FASEB J. 2021, 35, e21308. [Google Scholar] [CrossRef] [PubMed]
  26. Ghaben, A.; Scherer, P. Adipogenesis and metabolic health. Nat. Rev. Mol. Cell Biol. 2019, 20, 242–258. [Google Scholar] [CrossRef] [PubMed]
  27. Moseti, D.; Regassa, A.; Kim, W.-K. Molecular Regulation of Adipogenesis and Potential Anti-Adipogenic Bioactive Molecules. Int. J. Mol. Sci. 2016, 19, 124. [Google Scholar] [CrossRef]
  28. Cao, H.; Zhang, S.; Shan, S.; Sun, C.; Li, Y.; Wang, H.; Yu, S.; Liu, Y.; Guo, F.; Zhai, Q.; et al. Ligand-dependent corepressor (LCoR) represses the transcription factor C/EBPβ during early adipocyte differentiation. J. Biol. Chem. 2017, 292, 18973–18987. [Google Scholar] [CrossRef] [PubMed]
  29. Davies, B.S.J.; Beigneux, A.P.; Fong, L.G.; Young, S.G. New wrinkles in lipoprotein lipase biology. Curr. Opin. Lipidol. 2012, 23, 35–42. [Google Scholar] [CrossRef]
  30. Liu, G.; Xu, J.-N.; Liu, D.; Ding, Q.; Liu, M.-N.; Chen, R.; Fan, M.; Zhang, Y.; Zheng, C.; Zou, D.-J.; et al. Regulation of plasma lipid homeostasis by hepatic lipoprotein lipase in adult mice. J. Lipid Res. 2016, 57, 1155–1161. [Google Scholar] [CrossRef]
  31. Bader, M.; Shimizu, K.; Nishimuta, S.; Fukumura, Y.; Michinaga, S.; Egusa, Y.; Hase, T.; Terada, T.; Sakurai, F.; Mizuguchi, H.; et al. Liver-specific overexpression of lipoprotein lipase improves glucose metabolism in high-fat diet-fed mice. PLoS ONE 2022, 13, e0274297. [Google Scholar]
  32. Zhao, L.; Li, F.; Liu, T.; Yuan, L.; Zhang, X.; Zhang, D.; Li, X.; Zhang, Y.; Zhao, Y.; Song, Q.; et al. Ovine ELOVL5 and FASN genes polymorphisms and their correlations with sheep tail fat deposition. Gene 2022, 10, 145954. [Google Scholar] [CrossRef] [PubMed]
  33. Hu, G.; Wang, S.; Tian, J.; Chu, L.; Li, H. Epistatic effect between ACACA and FABP2 gene on abdominal fat traits in broilers. J. Genet. Genom. 2010, 37, 505–512. [Google Scholar] [CrossRef] [PubMed]
  34. Xie, H.; Heier, C.; Kien, B.; Vesely, P.W.; Tang, Z.; Sexl, V.; Schoiswohl, G.; Strießnig-Bina, I.; Hoefler, G.; Zechner, R.; et al. Adipose triglyceride lipase activity regulates cancer cell proliferation via AMP-kinase and mTOR signaling. Biochim. Et Biophys. Acta (BBA) Mol. Cell Biol. Lipids 2020, 1865, 158737. [Google Scholar] [CrossRef] [PubMed]
  35. Pajed, L.; Taschler, U.; Tilp, A.; Hofer, P.; Kotzbeck, P.; Kolleritsch, S.; Radner, F.P.W.; Pototschnig, I.; Wagner, C.; Schratter, M.; et al. Advanced lipodystrophy reverses fatty liver in mice lacking adipocyte hormone-sensitive lipase. Commun. Biol. 2021, 10, 323. [Google Scholar] [CrossRef] [PubMed]
  36. Song, Z.; Xiaoli, A.; Yang, F. Regulation and Metabolic Significance of De Novo Lipogenesis in Adipose Tissues. Nutrients 2018, 29, 1383. [Google Scholar] [CrossRef] [PubMed]
  37. Cai, C.; Chen, D.-Z.; Tu, H.-X.; Chen, W.-K.; Ge, L.-C.; Fu, T.-T.; Tao, Y.; Ye, S.-S.; Li, J.; Lin, Z.; et al. MicroRNA-29c Acting on FOS Plays a Significant Role in Nonalcoholic Steatohepatitis Through the Interleukin-17 Signaling Pathway. Front. Physiol. 2021, 1, 597449. [Google Scholar] [CrossRef]
  38. Hatori, T.; Maeda, T.; Suzuki, A.; Takahashi, K.; Kato, Y. SPARC is a decoy counterpart for c-Fos and is associated with osteoblastic differentiation of bone marrow stromal cells by inhibiting adipogenesis. Mol. Med. Rep. 2023, 27, 50. [Google Scholar] [CrossRef]
  39. Diehl, A.M.; Yang, S.Q. Regenerative changes in C/EBPα and C/EBPß expression modulate binding to the C/EBP site in the c-fos promoter. Hepatology 1994, 19, 447–456. [Google Scholar] [CrossRef]
  40. Cui, T.X.; Kwok, R.; Schwartz, J. Cooperative regulation of endogenous cAMP-response element binding protein and CCAAT/enhancer-binding protein β in GH-stimulated c-fos expression. J. Endocrinol. 2007, 196, 89–100. [Google Scholar] [CrossRef]
  41. Hai, T.; Curran, T. Cross-family dimerization of transcription factors Fos/Jun and ATF/CREB alters DNA binding specificity. Proc. Natl. Acad. Sci. USA 1991, 88, 3720–3724. [Google Scholar] [CrossRef] [PubMed]
  42. Wagner, E.; Eferl, R. Fos/AP-1 proteins in bone and the immune system. Immunol. Rev. 2005, 208, 126–140. [Google Scholar] [CrossRef] [PubMed]
  43. Hasenfuss Sebastian, C.; Bakiri, L.; Thomsen Martin, K.; Williams Evan, G.; Auwerx, J.; Wagner Erwin, F. Regulation of Steatohepatitis and PPARγ Signaling by Distinct AP-1 Dimers. Cell Metab. 2014, 19, 84–95. [Google Scholar] [CrossRef] [PubMed]
  44. Cai, D.H.; Wang, D.; Keefer, J.; Yeamans, C.; Hensley, K.; Friedman, A.D. C/EBPα:AP-1 leucine zipper heterodimers bind novel DNA elements, activate the PU.1 promoter and direct monocyte lineage commitment more potently than C/EBPα homodimers or AP-1. Oncogene 2007, 27, 2772–2779. [Google Scholar] [CrossRef] [PubMed]
  45. Kveiborg, M.; Sabatakos, G.; Chiusaroli, R.; Wu, M.; Philbrick, W.M.; Horne, W.C.; Baron, R. ΔFosB Induces Osteosclerosis and Decreases Adipogenesis by Two Independent Cell-Autonomous Mechanisms. Mol. Cell. Biol. 2023, 24, 2820–2830. [Google Scholar] [CrossRef] [PubMed]
  46. Luther, J.; Driessler, F.; Megges, M.; Hess, A.; Herbort, B.; Mandic, V.; Zaiss, M.M.; Reichardt, A.; Zech, C.; Tuckermann, J.P.; et al. Elevated Fra-1 expression causes severe lipodystrophy. J. Cell Sci. 2011, 124, 1465–1476. [Google Scholar] [CrossRef]
Figure 1. Subcellular localization of FOS and expression patterns during differentiation of goat intramuscular adipocytes. (A) The upper panels show the localization of PEGFP-N1, and the bottom panels show the localization of the FOS protein in intramuscular adipocytes, as indicated by the white arrow in the figure. The scale bar represents 50 µm. (B) The expression changes in FOS during 0–5 days of induced differentiation of goat intramuscular adipocytes (n = 6). “**” means an extremely significant difference (P < 0.01).
Genes 14 02088 g001
Figure 2. Overexpression of FOS inhibits goat intramuscular adipocyte differentiation. (A) Overexpression efficiency of FOS detected using qPCR (n = 6). (B,C) Oil Red O staining (×200) (n = 3), scale bar represents 50 µm, and the value of OD at 490 nm. (D) Bodipy and DAPI stainings (×200); scale bar represents 50 µm. The green fluorescence represents lipid droplets. “**” means an extremely significant difference (P < 0.01).
Genes 14 02088 g002
Figure 3. Overexpression of FOS suppresses the expression of adipogenesis genes. (AC) The expressions of AP2, PPARγ, C/EBPβ, C/EBPα, SREBP1, FASN, ACC, SCD1, HSL, ATGL, and LPL in goat intramuscular adipocytes in NC and OE groups. (D) The cellular TG levels in goat intramuscular adipocytes in negative control (NC) and overexpression of FOS treatment groups. (E) Protein expressions of PPARγ and C/EBPβ. “*” means a significant difference (P < 0.05), “**” means an extremely significant difference (P < 0.01) and “ns” means no difference.
Genes 14 02088 g003
Figure 4. Knockdown of FOS increases accumulation of lipid droplets in goat intramuscular adipocytes. (A) The knockdown efficiency of the FOS detection. (B,C) Oil Red O staining (×200), scale bar represents 50 µm, and the value of OD at 490 nm. (D) Bodipy and DAPI stainings (×200); scale bar represents 50 µm. The green fluorescence represents lipid droplets. “**” means an extremely significant difference (P < 0.01).
Genes 14 02088 g004
Figure 5. Knockdown of FOS upregulates positive adipocyte differentiation genes and downregulates lipid metabolism-related genes. (AC) The expressions of lipogenic-related genes in the NC and knockdown FOS groups. (D) Detection of cellular TG contents in the NC and FOS knockdown groups. (E) PPARγ and C/EBPβ protein expression levels in NC and knockdown FOS groups. “*” means a significant difference (P < 0.05), “**” means an extremely significant difference (P < 0.01) and “***” means an extremely significant difference (P < 0.001).
Genes 14 02088 g005
Figure 6. FOS exhibits an expression pattern opposite to those of PPARγ, C/EBPβ, and C/EBPα during adipocyte differentiation. (A) the PPARγ expression trend during intramuscular adipogenesis (n = 6). (B) The C/EBPβ expression trend during intramuscular adipogenesis. (C) The C/EBPα expression trend during intramuscular adipogenesis. (D) FOS binding sites on the promoters of PPARγ and C/EBPβ. Blue circles represent the FOS binding sites.
Genes 14 02088 g006
Table 1. Primers for quantitative real-time PCR (qPCR).
GeneForward Primer (5′-3′)Reverse Primer (5′-3′)
FOSGCTTCAACGCCGACTACGAGAAGGAGTCTGCCGGTGAGTG
AP2TGAAGTCACTCCAGATGACAGGTGACACATTCCAGCACCAGC
PPARγAAGCGTCAGGGTTCCACTATGGAACCTGATGGCGTTATGAGAC
C/EBPβCAAGAAGACGGTGGACAAGCAACAAGTTCCGCAGGGTG
C/EBPαCCGTGGACAAGAACAGCAACAGGCGGTCATTGTCACTGGT
SREBP1AAGTGGTGGGCCTCTCTGAGCAGGGGTTTCTCGGACT
FASNTGTGCAACTGTGCCCTAGGTCCTCTGAGCAGCGTGT
ACCGGAGACAAACAGGGACCATTATCAGGGACTGCCGAAAC
SCD1TCGTGCCGTGGTATCTATGGGGGGTTGATGGTCTTGTCGT
HSLAGGGTCATTGCCGACTTCCGTCTCGTTGCGTTTGTAGTGC
ATGLGGAGCTTATCCAGGCCAATGTGCGGGCAGATGTCACTCT
LPLGAGGCCTTGGAGATGTGGACAATTGCACCGGTACGCCTTA
UXTGCAAGTGGATTTGGGCTGTAACATGGAGTCCTTGGTGAGGTTGT
Disclaimer/Publisher’s Note: The statements, opinions and data contained in all publications are solely those of the individual author(s) and contributor(s) and not of MDPI and/or the editor(s). MDPI and/or the editor(s) disclaim responsibility for any injury to people or property resulting from any ideas, methods, instructions or products referred to in the content.

