Article

Impacts of Population Size and Domestication Process on Genetic Diversity and Genetic Load in Genus Ovis

1
CAS Key Laboratory of Animal Ecology and Conservation Biology, Institute of Zoology, Chinese Academy of Sciences (CAS), Beijing 100101, China
2
College of Life Sciences, University of Chinese Academy of Sciences (UCAS), Beijing 100049, China
3
College of Animal Science and Technology, China Agricultural University, Beijing 100193, China
4
Institute of Animal Science, Tibet Academy of Agricultural and Animal Husbandry Sciences, Lhasa 850009, China
*
Author to whom correspondence should be addressed.
These authors contributed equally to this work.
Genes 2023, 14(10), 1977; https://doi.org/10.3390/genes14101977
Submission received: 26 September 2023 / Revised: 19 October 2023 / Accepted: 20 October 2023 / Published: 23 October 2023
(This article belongs to the Special Issue Systematic Analysis and Application of Omics Data in Animal Breeding)

Abstract

:
In theoretical biology, a prevailing hypothesis posits a profound interconnection between effective population size (Ne), genetic diversity, inbreeding, and genetic load. The domestication and improvement processes are believed to be pivotal in diminishing genetic diversity while elevating levels of inbreeding and increasing genetic load. In this study, we performed a whole genome analysis to quantity genetic diversity, inbreeding, and genetic load across seven wild Ovis species and five domesticated sheep breeds. Our research demonstrates that the genetic load and diversity of species in the genus Ovis have no discernible impact on recent Ne, and three species within the subgenus Pachyceros tend to carry a higher genetic load and lower genetic diversity patterns. The results coincide with these species’ dramatic decline in population sizes within the subgenus Pachyceros ~80–250 thousand years ago. European mouflon presented with the lowest Ne, lower genetic diversity, and higher individual inbreeding coefficient but a lower genetic load (missense and LoF). This suggests that the small Ne of European mouflon could reduce harmful mutations compared to other species within the genus Ovis. We showed lower genetic diversity in domesticated sheep than in Asiatic mouflon, but counterintuitive patterns of genetic load, i.e., lower weak genetic load (missense mutation) and no significant difference in strong genetic load (LoF mutation) between domestic sheep and Asiatic mouflon. These findings reveal that the “cost of domestication” during domestication and improvement processes reduced genetic diversity and purified weak genetic load more efficiently than wild species.

1. Introduction

The effective population size (Ne) describes the population size caused by genetic drift under the random sampling of genetic variants in a finite population, which plays a pivotal role in molding the dynamics of genetic drift and natural selection within populations [1,2]. Previous studies have shown smaller effective population size (Ne) values correlated with reductions in genetic diversity and increases in mutation burden (genetic variations are more likely to be deleterious than beneficial and a major cause of variation in fitness-related traits among individuals), respectively [1,2]. Nevertheless, the relationships between effective population size (Ne), genetic diversity, and genetic load were changeable, as demonstrated in prior studies among certain species [3,4,5].
Compared with wild species, the domestication process and artificial selection were imposed for domesticated species. One hypothesized cost of domestication suggested that the processes of domestication and improvement result in an increased mutation burden [6]. Recent studies supported the hypothesis that domesticated species had higher genetic load than their wild ancestors [7,8,9,10]. However, domestication and improvement processes may affect patterns of the mutation burden across various species. The domestication process led to the purging of large-effect deleterious mutations while amplifying the burden of small-effect mutations in maize [10]. The improvement processes led to a reduction of genetic diversity and increased the genetic load in chickens [7], dogs [8], and crops [9]. It is essential to note that the relationship between domestication, improvement, and genetic load is multifaceted and influenced by many factors [6]. Therefore, clarifying the impacts of population size, the domestication process, and the improvement in genetic diversity and load brought a considerable challenge.
Wild and domesticated sheep in the genus Ovis provided an excellent model by which to investigate relationships between effective population size, the process of domestication and improvement, and genetic load/genetic diversity. Seven wild species in the genus Ovis exhibit a wide intercontinental distribution in Eurasia and North America [11], and the main driving force of evolution is nature selection, except for in the case of European mouflon (Ovis musimon, EMUF) [12,13]. The domesticated sheep originated from Asiatic mouflon (Ovis orientalis, AMUF) approximately 11,000 years ago in the Fertile Crescent [14,15,16], and the process of improvement after domestication reshaped the genomic features of sheep [17] and produced various phenotypes [18]. In this study, we focused on exploring the effects of effective population size (Ne) on the genetic diversity and genetic load of wild Ovis species and further investigate the impacts of the domestication and improvement process on the genetic diversity and genetic load on AMUF, three native breeds (Tibetan sheep, TIB; Finnsheep, FIN; Shetland sheep, SHE) and two improved breeds (super-fine-wool Merino, MSF; fine-wool Merino, MFW), of which Tibetan sheep is a native breed which has adapted to the Qinghai–Tibetan Plateau environments, and Finnsheep and Shetland sheep are primitive breeds on the periphery of northwest Europe [14].

2. Materials and Methods

2.1. Data Collecting

Whole genome sequencing data of 123 individuals were retrieved from NCBI and a previous study [19]. The dataset encompassed three categories: (i) 71 wild sheep (3 Ovis musimon, 31 Ovis orientalis, 9 Ovis vignei, 8 Ovis ammon, 8 Ovis nivicola, 6 Ovis dalli, and 6 Ovis canadensis); (ii) 32 native individuals (15 Tibetan sheep, 10 Finnland sheep, and 7 Shetland sheep); and (iii) 20 improved samples (20 Chinese Merino) (Table 1, Supplementary Table S1).

2.2. SNP Calling

Whole genome sequencing (WGS) data were initially trimmed using Trimmomatic v0.3917 [20] and subsequently aligned to the sheep reference genome Oar_rambouillet_v1.0 (GCF_002742125.1) (https://www.ncbi.nlm.nih.gov/datasets/genome/GCF_002742125.1/, last accessed on 17 June 2023) via BWA v0.7.17-r1188 mem [21] with default parameters. We further filtered BAM files with the MarkDuplicates module of Picard v2.18.12 (http://broadinstitute.github.io/picard/, last accessed on 17 June 2023) to remove duplicates and detected single nucleotide polymorphisms (SNPs) with the GATK best-practice recommendations [22]. We first generated the GVCF file of each sample via the HaplotypeCaller module. Secondly, all GVCF files were merged via the CombineGVCFs module, and the raw SNPs were called using the GenotypeGVCFs module. The biallelic SNPs were selected by the SelectVariants module in GATK and further by the VariantFiltering module of the GATK with the following parameters: “QUAL < 30.0||QD < 2.0||MQ < 40.0||FS > 60.0||SOR > 3.0||MQRankSum < −12.5||ReadPosRankSum < −8.0”. We further trimmed the SNPs using vcftools v0.1.17 [23] with the following criteria: (i) missing rate > 0.90; (ii) minor allele frequency (MAF) > 0.01; (iii) SNPs in autosomes. A total of 60,369,351 autosomal SNPs were identified.

2.3. Estimating Index of Genetic Diversity and Calculating Runs of Homozygosity (ROH)

Nucleotide diversity (π) was calculated using all sites with VCFtools v0.1.17 [23] for seven wild species and five domestic sheep breeds, with a sliding window of 2 Mb and a 1 Mb sliding step. We further calculated the heterozygosity of individuals using PLINK v1.90b6.26 [24] with the “-het” option.
The ROH were identified using detectRUNS v0.9.6 [25] with the following parameters: (i) maxOppRun = 0 [26]; (ii) maxMissRun = 0 [26]; (iii) minSNP = 230 [27]; (iv) –homozyg-kb 250 [26]; and (v) maxGap = 106 [26]. Then, the FROH was calculated as the percentage of the autosome genome covered by ROH for each sample [28].
F R O H = i L R O H i L a u t o s o m e ,
where LROHi is the length of ROHi of individual i; and Lautosome is the autosomal genome length.

2.4. Estimates of Effective Population Size (Ne)

We estimated the recent effective population size (Ne) of all seven wild sheep species by SNeP v1.1 [29], which inferred the Ne based on the equation E r 2 = 1 / 1 + 4 N e c , where c is recombination rate and r2 is the correlation coefficient between pairs of loci [30]. We implemented the analysis with the default setting except for sample size and recombination rates. The sample size was corrected to 2, and the recombination rate was adjusted using the “svedf” option. We estimated the Ne 100 generations ago to scale population dynamics using the different SNP marker distance bins.

2.5. Estimate of Genetic Load

To estimate mutation burden, we first inferred the ancestral allelic state of each SNP following the EPO pipeline with modification (https://ftp.ensembl.org/pub/release-65/fasta/ancestral_alleles/pan_troglodytes_ancestor_CHIMP2.1.4_e65.README, last accessed on 12 June 2023). First, the goat reference genomic sequences (GCA_001704415.2) (https://www.ncbi.nlm.nih.gov/datasets/genome/GCF_001704415.2/, last accessed on 12 June 2023) were aligned against the sheep genome (GCF_002742125.1) (https://www.ncbi.nlm.nih.gov/datasets/genome/GCF_002742125.1/, last accessed on 17 June 2023) using minimap2 v2.24-r1122 [31]. Second, goat SNP was called via bcftools v1.16 [32] with default setting and merged with the dataset generated from all the domestic and wild sheep individuals. Finally, we filtered out the sites with different alleles among goats and Ovis and defined each SNP’s ancestral state as the goats’ allele state.
Subsequently, we inferred the deleterious mutations of the polarized SNPs dataset using SnpEff v5.1d [33]. The analyses were run using the sheep reference genome (GCF_002742125.1) (https://www.ncbi.nlm.nih.gov/datasets/genome/GCF_002742125.1/, last accessed on 17 June 2023) annotation file (https://ftp.ncbi.nlm.nih.gov/genomes/all/annotation_releases/9940/103/GCF_002742125.1_Oar_rambouillet_v1.0/GCF_002742125.1_Oar_rambouillet_v1.0_genomic.gff.gz, last accessed on 17 June 2023) with the “-lof” option. Deleterious mutation SNPs were categorized as loss of function (“LOF”) and missense mutations. We first counted the total heterozygotes and derived homozygotes per individual for LoF and missense sites to investigate how mutation load varies across species and populations. We assessed the whole genetic load by calculating the number of derived alleles [34]. The potential and realized genetic loads [35] were estimated based on the number of heterozygous and homozygous mutations.

3. Results

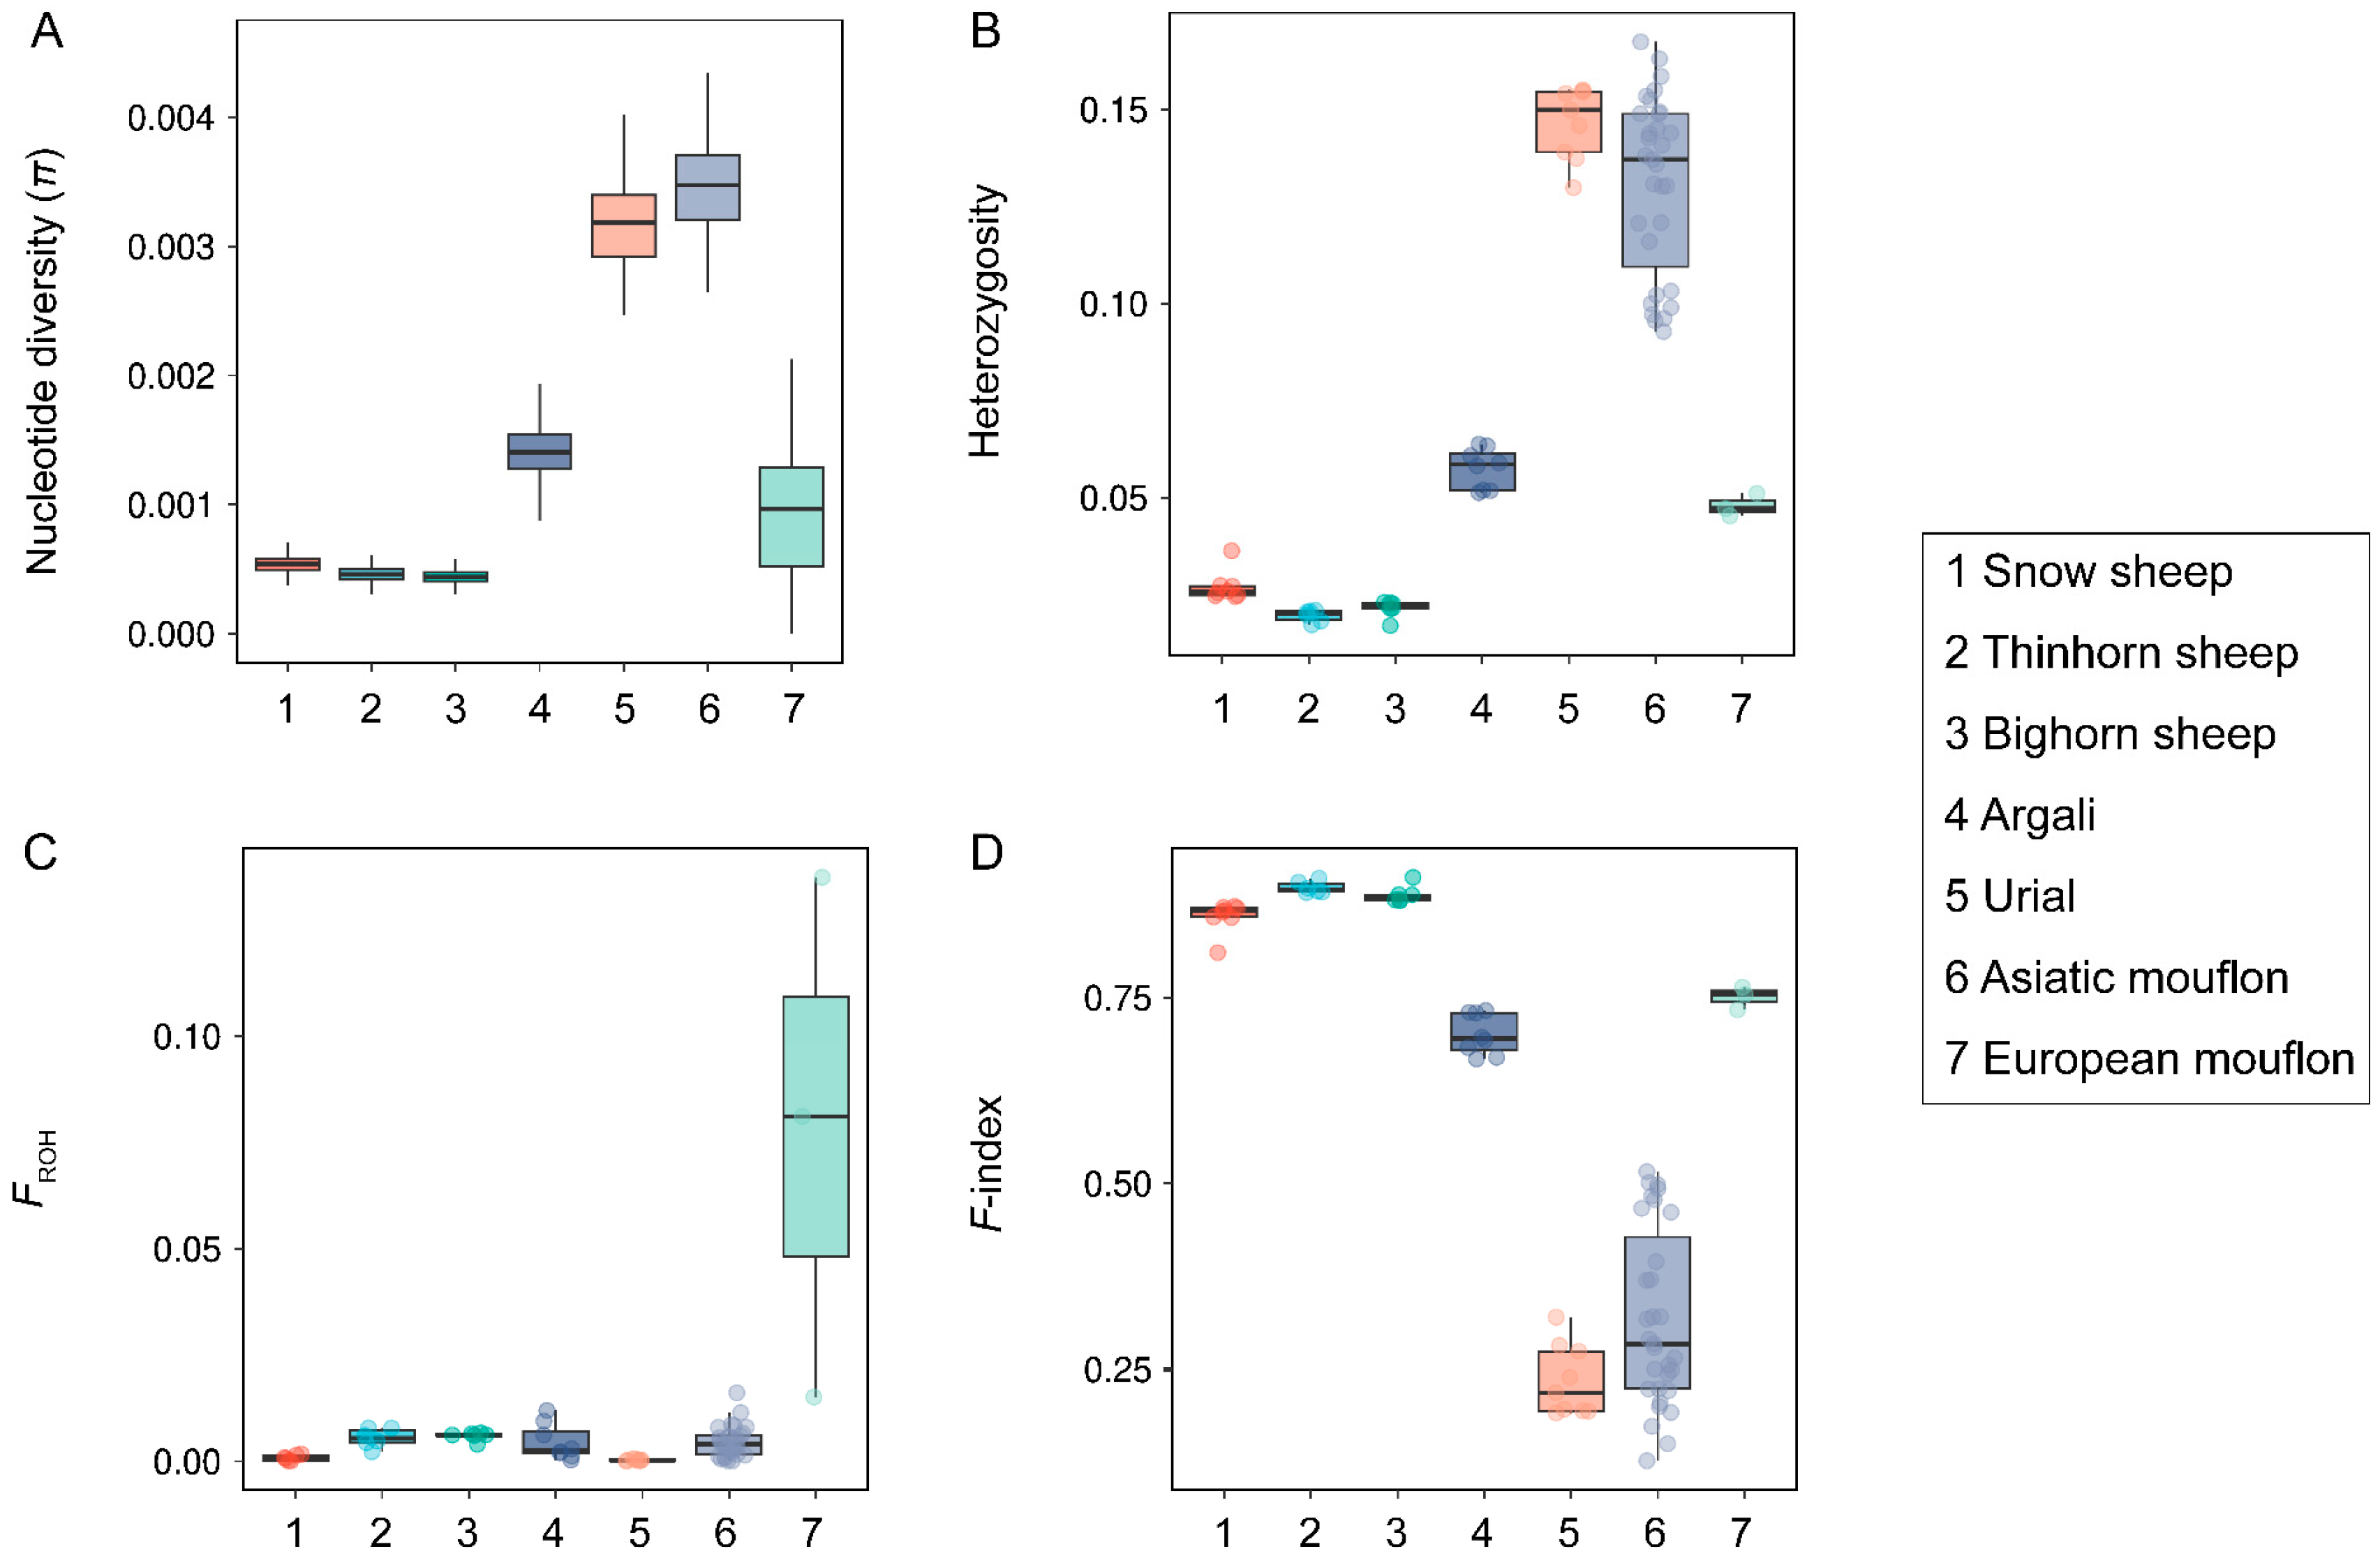
3.1. Genetic Diversity Pattern

We collected whole genome resequencing data for 123 individuals from seven wild species and five domesticated sheep breeds (Supplementary Table S1). A total of 60,369,351 high-quality SNPs were identified.
With genus Ovis, we observed extensive variation of genetic diversity among species (Figure 1), and Asiatic mouflon and Bighorn sheep showed the highest π (0.00326) and the lowest π (0.00043) (Figure 1A), respectively. Four species (European mouflon, Asiatic mouflon, Urial, and Argali) exhibited higher genetic diversity and lower inbreeding compared to three species of subgenus Pachyceros (Snow sheep, Thinhorn sheep, and Bighorn sheep) (Figure 1). More similar patterns of π (0.00043–0.00053), heterozygosity (0.0196–0.0270), FROH (0.0008–0.0059), and F-index (0.8590–0.8980) were observed within three species in subgenus Pachyceros (Figure 1 and Supplementary Table S3), which suggested that three species in subgenus Pachyceros may have similar demographic history. Within the subgenus Pachyceros, Snow sheep (SOWS) showed the lowest FROH (0.0008), which was significantly lower than that found for the other two American wild species (both p = 0.002, Wilcoxon) (Figure 1C). The genetic diversity (π and heterozygosity) and inbreeding coefficients (FROH and F-index) of Argali are at an intermediate level between Moufloniforms and Pachyceriforms (Figure 1). However, an exception was observed in Moufloniforms; the European mouflon possessed the lowest genetic diversity and highest inbreeding among four species (European mouflon, Asiatic mouflon, Urial, and Argali) (Figure 1A,B,D) and exhibited the highest FROH (0.0778) among all the wild sheep (Figure 1C). In contrast, Urial and Asiatic mouflon within Moufloniforms displayed the lowest FROH (0.0003) and F-index (0.2344) and the highest π (0.00326) and heterozygosity (0.1467) (Figure 1). The results indicate a specific evolutionary history of European mouflon.

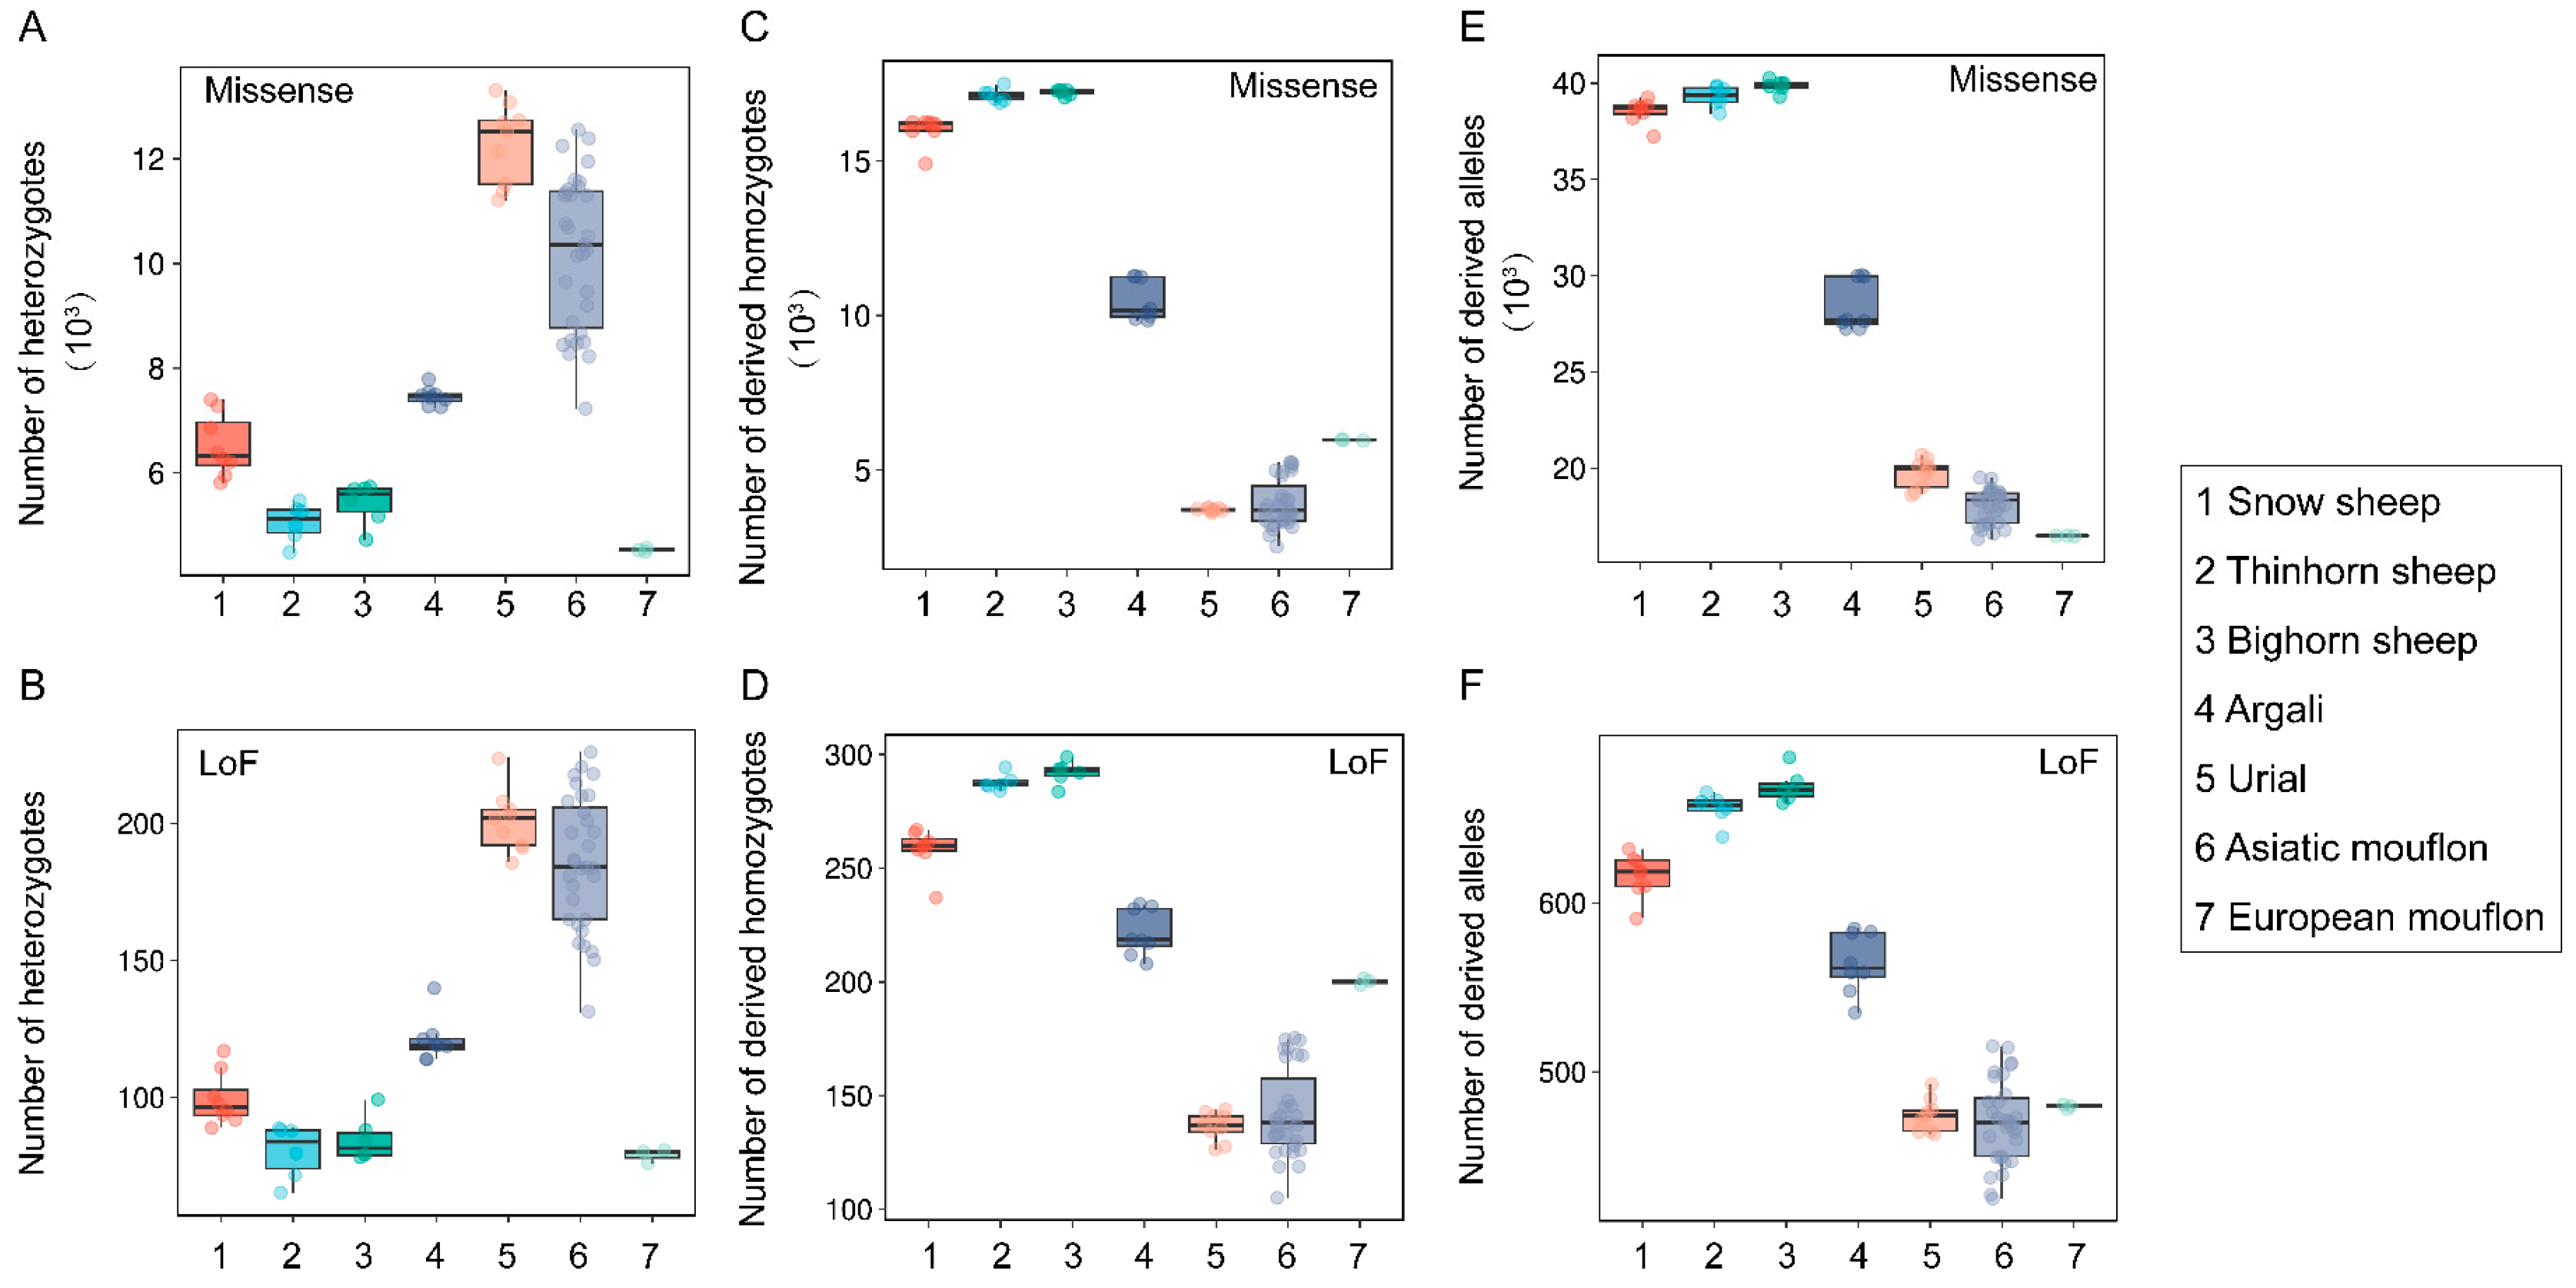
3.2. Genetic Load Comparisons among Wild Species within the Genus Ovis

Extensive variation in both heterozygotes- and homozygous-derived missense or LoF variants was observed among the seven species (Figure 2). Three species of subgenus Pachyceros showed similar patterns of genetic load and possessed lower heterozygosity-derived missense and LoF variants than Argali, Urial, and Asiatic mouflon (Figure 2A,B). In contrast, higher homozygous-derived missense and LoF variant genotypes and allelic-derived variants were observed in three species of subgenus Pachyceros than Argali, Urial, and Asiatic mouflon (Figure 2C–F). We also observed a specific pattern in European mouflon contrasting with the other species within Moufloniforms, which possessed the lowest heterozygous-derived variants (Figure 2A,B). We further characterized the potential load and the realized load using the number of heterozygotes- and homozygotes-derived variants with the methodologies described in Bertorelle et al. [36] and Grossen et al. [37]. Our results unveiled an opposite genetic load pattern between subgenus Pachyceros and other species within Ovis; Snow sheep, Thinhorn sheep, and Bighorn sheep showed lower potential loads and higher realized loads than Argali, Urial, and Asiatic mouflon (Figure 2A–D). Considering the overall mutation load (Figure 2E,F), our results indicated that subgenus Pachyceros has a higher mutation load.

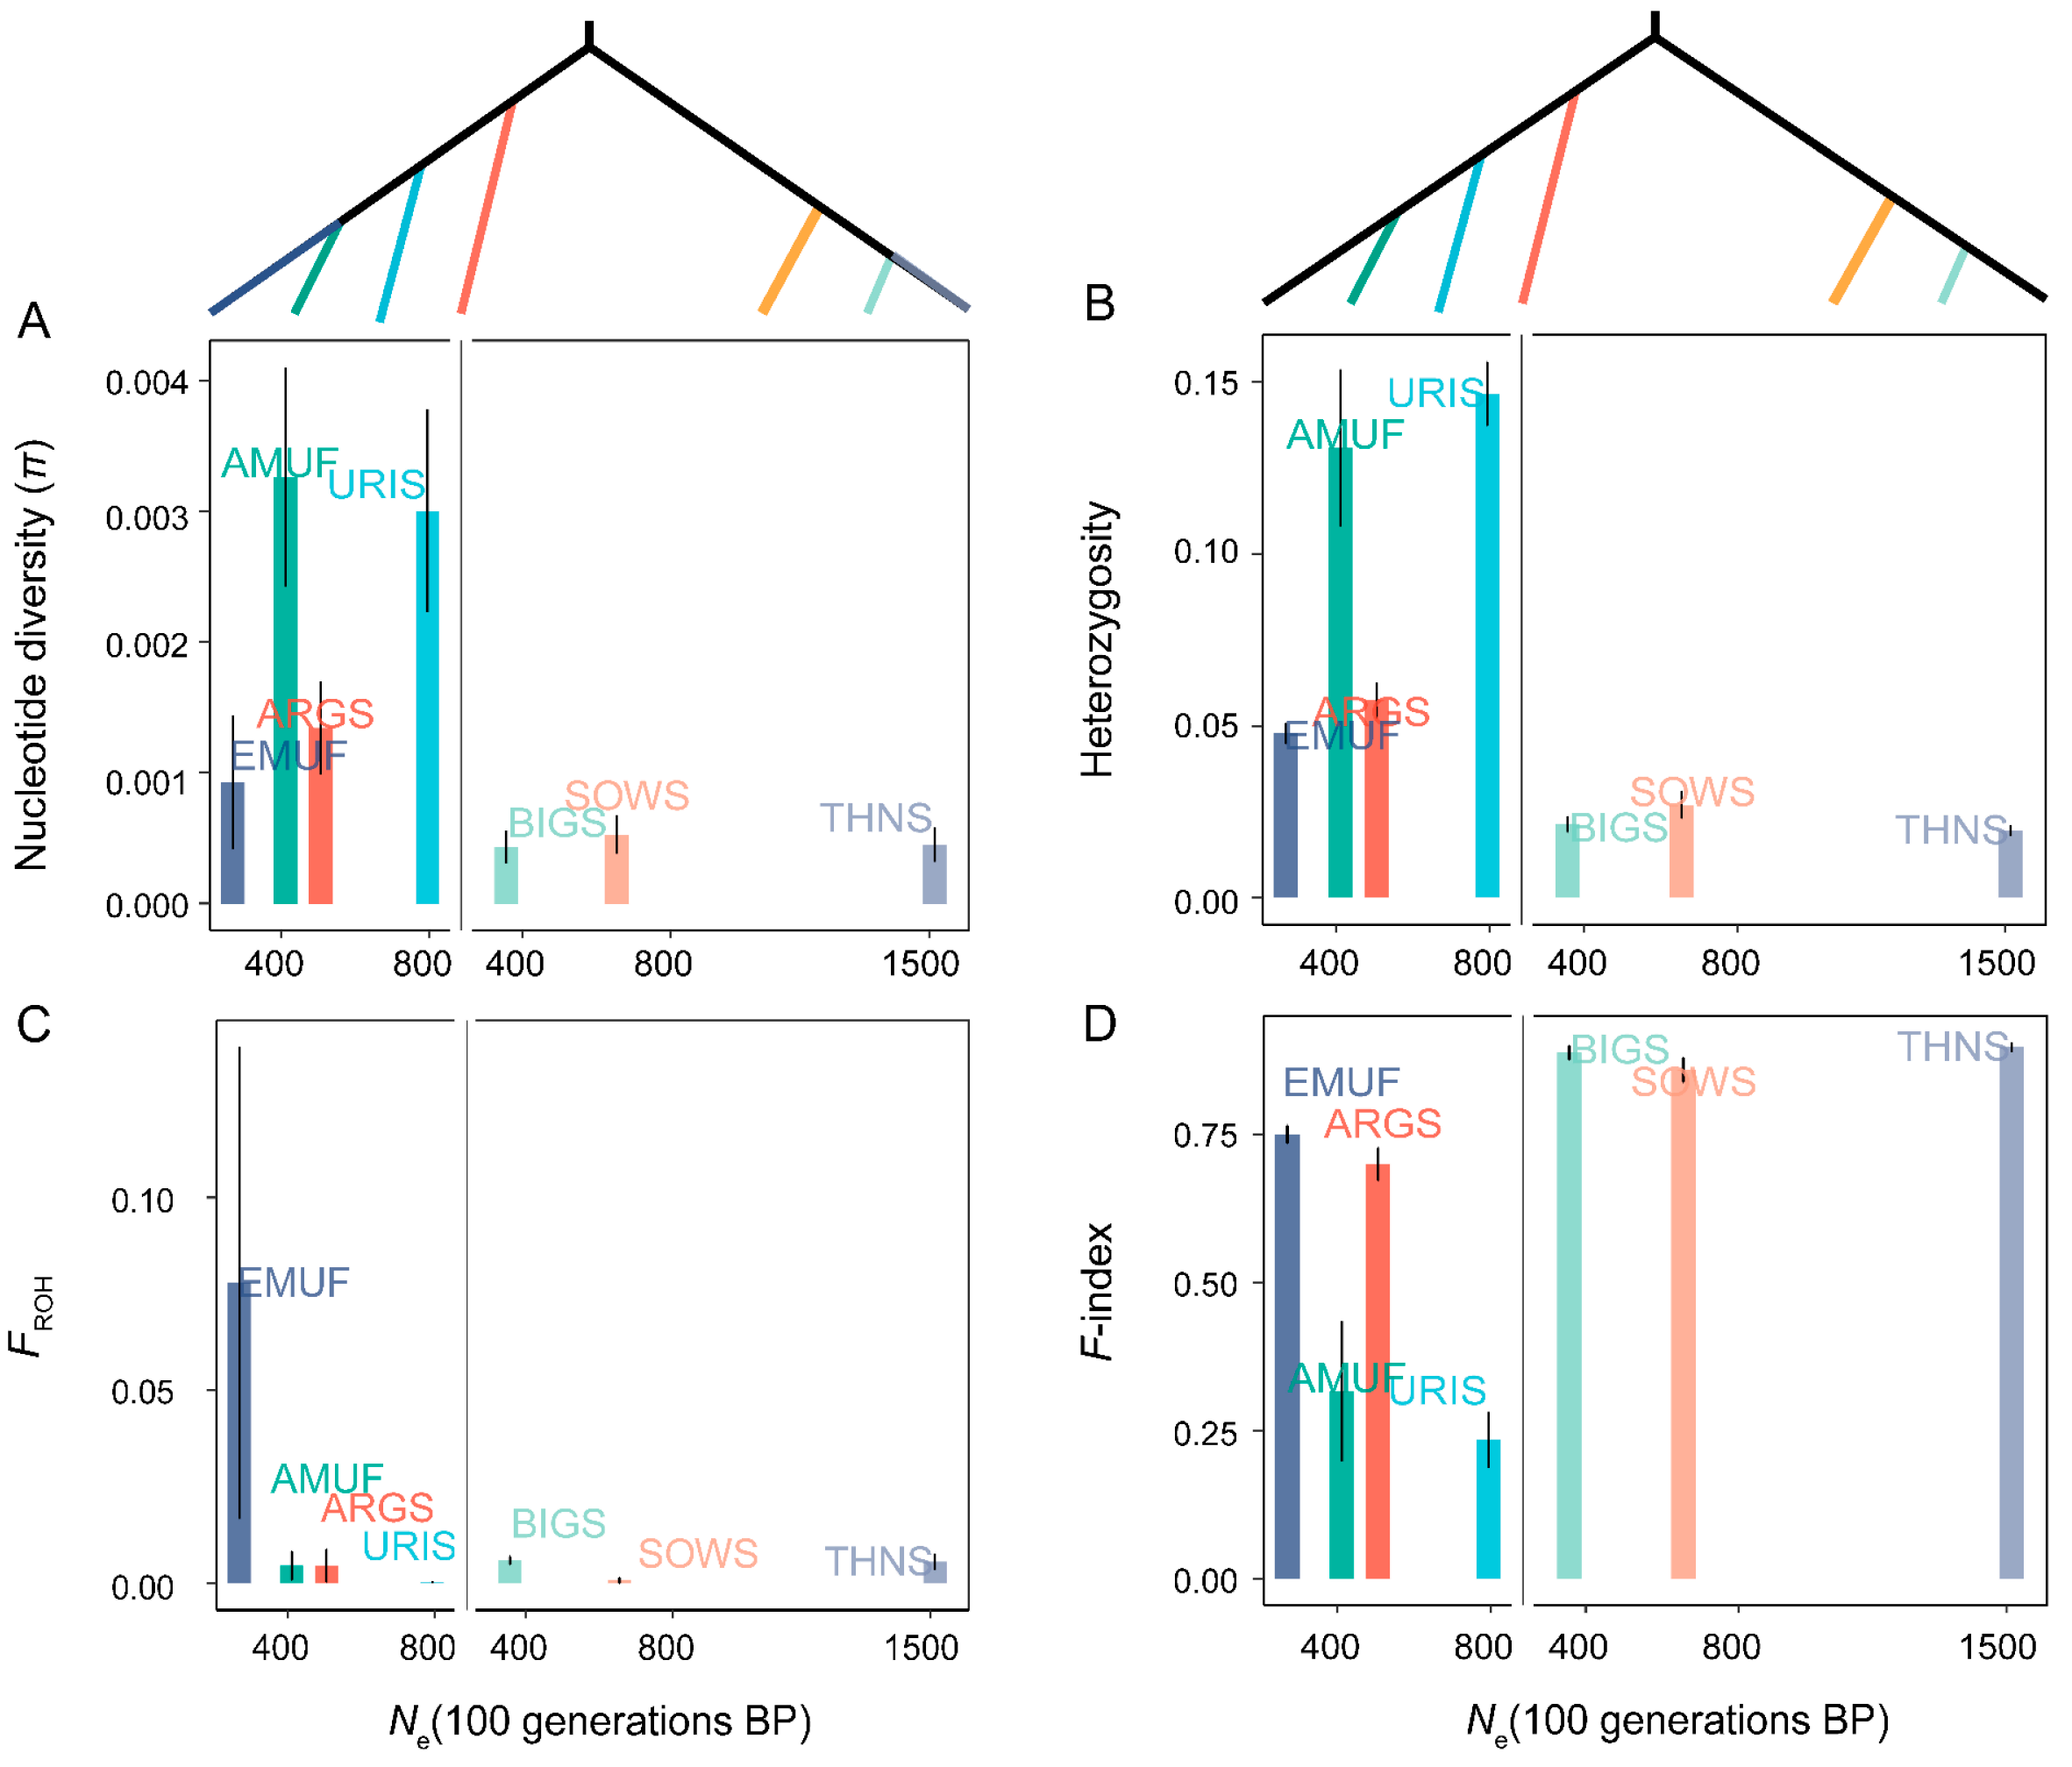
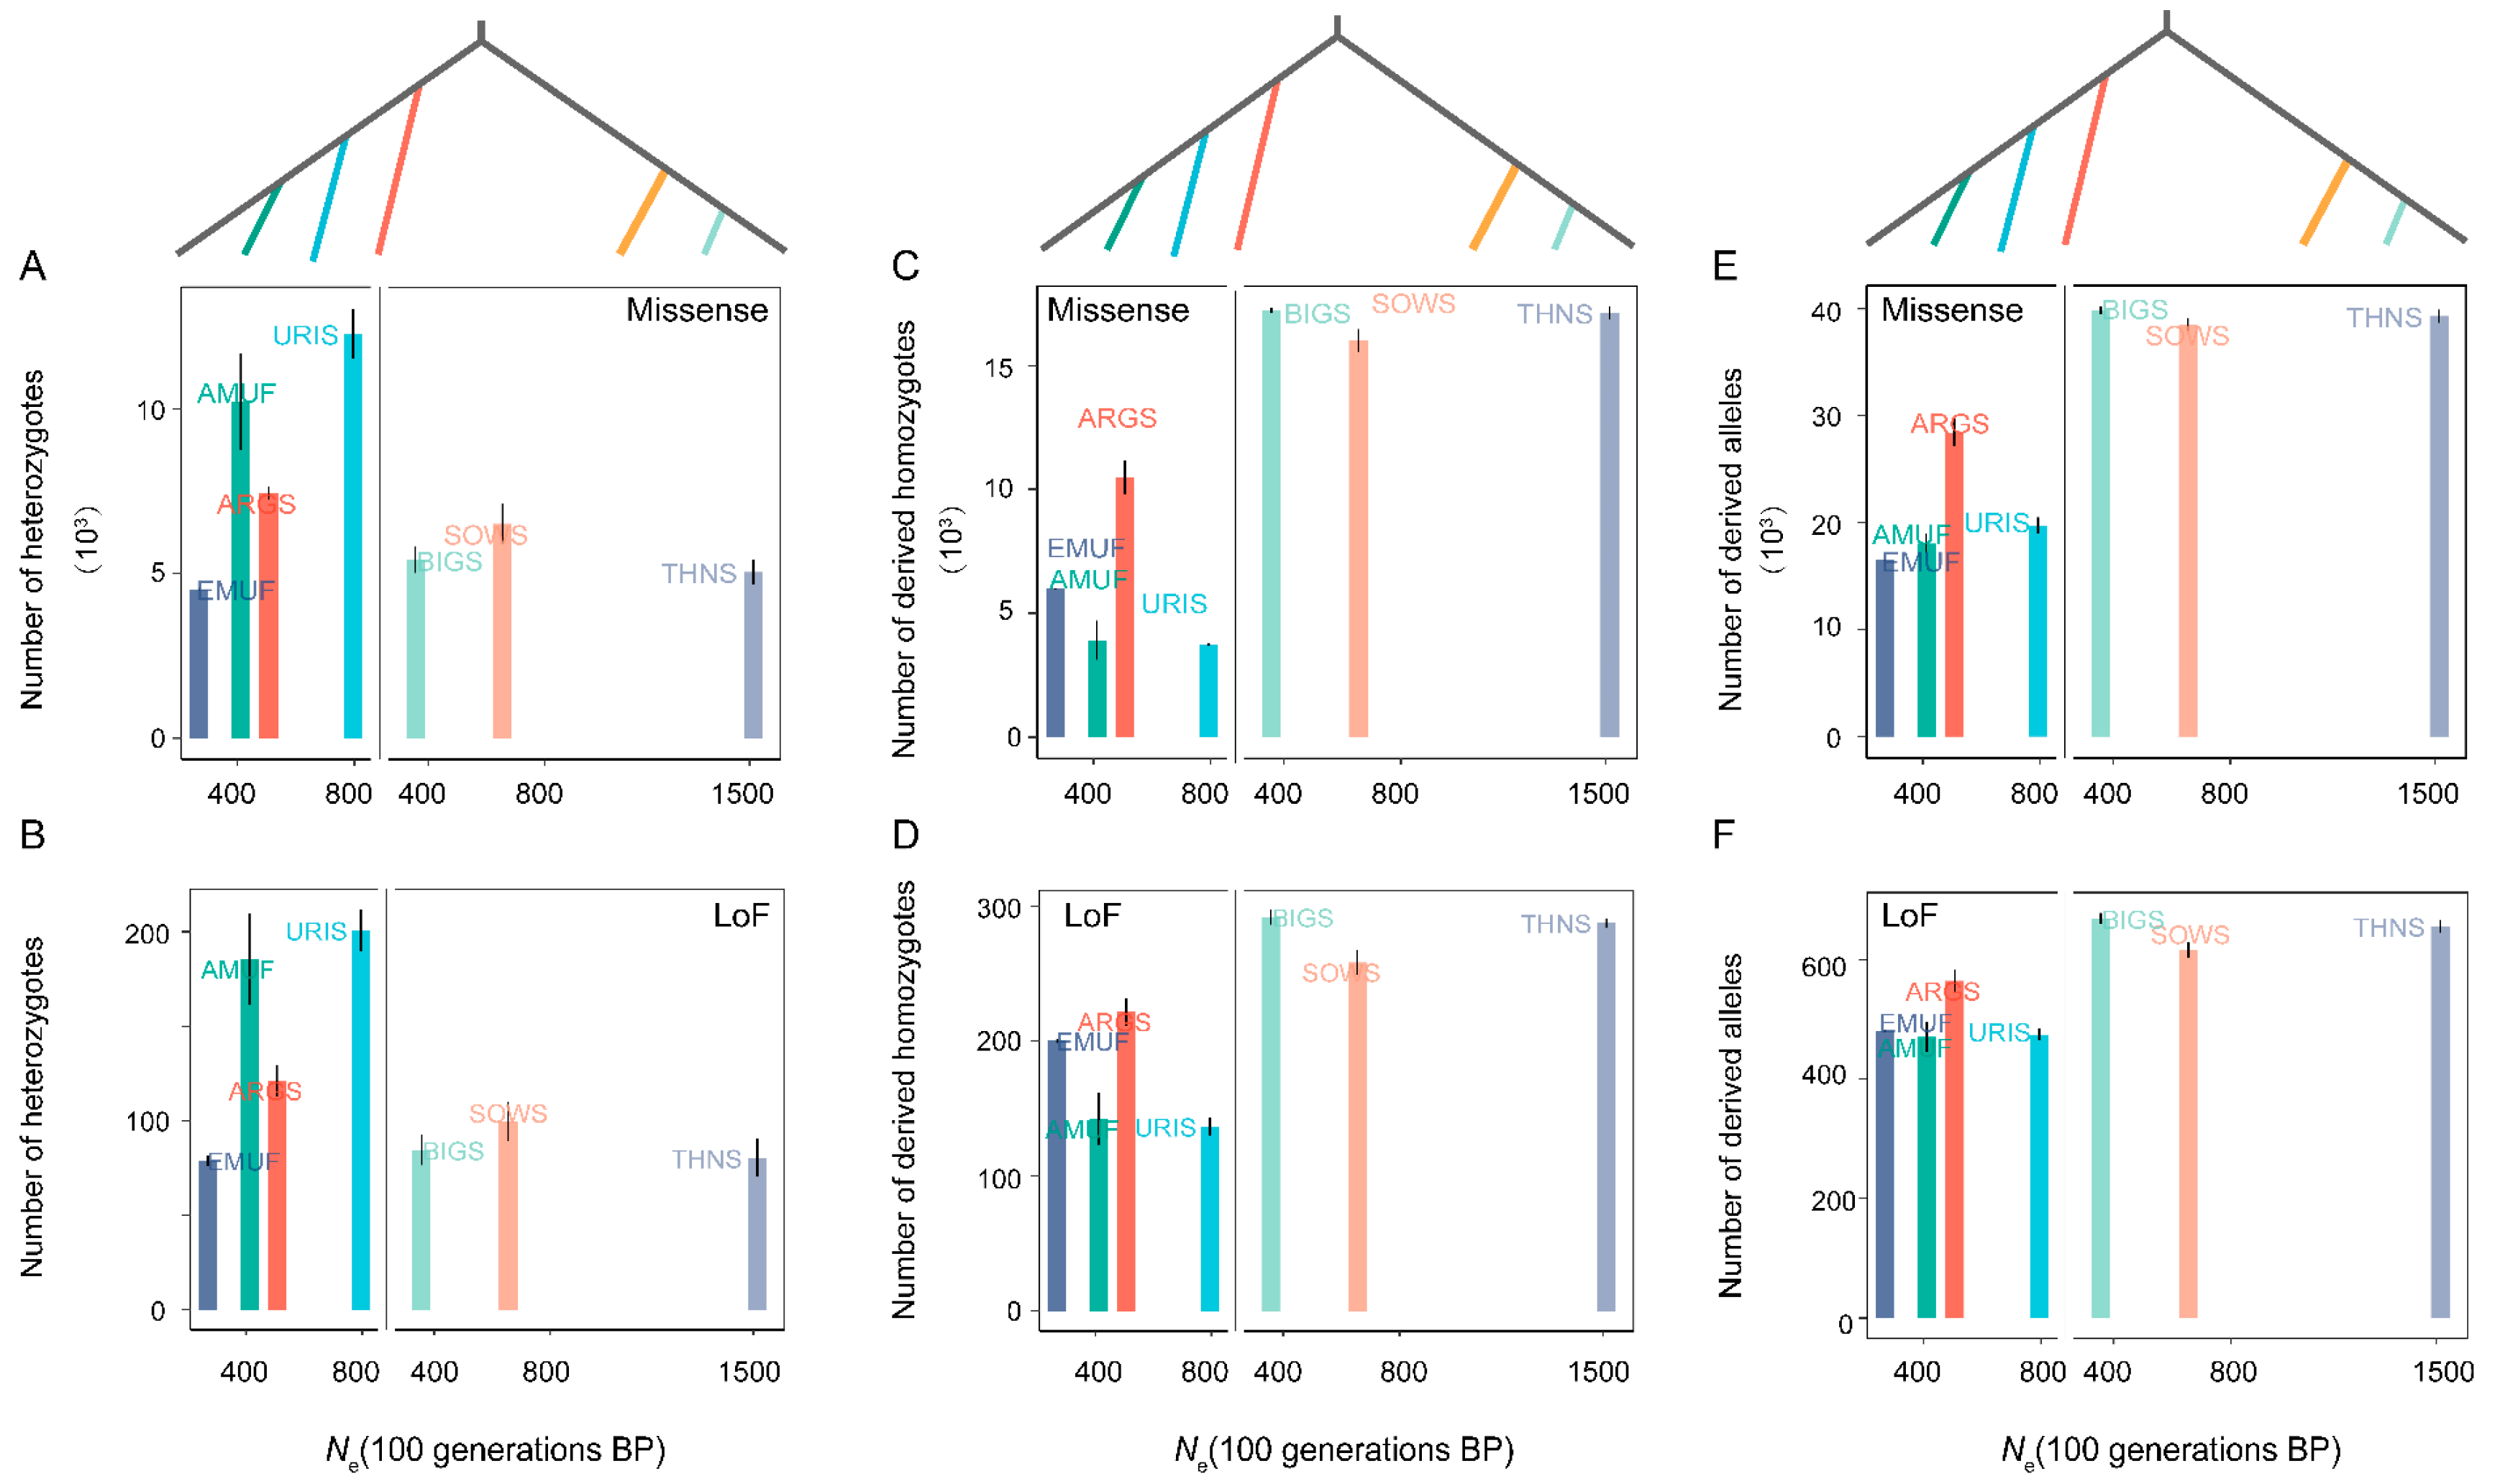
3.3. Genetic Load and Effective Population Size (Ne)

We estimated the Ne of seven species over the last 100 generations using the SNeP method to assess the impact of recent effective population size. Genetic diversity increases with effective population size under the neutral theory [3]. We hypothesized that lower Ne would coincide with reduced genetic diversity and increased genetic load in wild sheep. However, our analysis did not find a correlation between Ne and genetic diversity across all seven Ovis species (Figure 3). Interestingly, we observed different Ne of three species in subgenus Pachyceros (Ne-BIG = 356.73; Ne-SOWS = 654.79; Ne-THNS = 1513.19) and similar genetic diversity and individual inbreeding coefficient patterns (Figure 1 and Figure 3).
A comparatively similar pattern was detected in the genetic load across seven species over the last 100 generations. We did not observe any significant correlation between Ne and the number of heterozygotes, derived homozygotes, and the total number of derived allelic variants for both Missense and LoF mutations (Figure 4). To eliminate the potential effect of phylogeny, we further investigate the relationships between Ne and genetic load within Pachyceriforms and Moufloniforms/Argaliforms, respectively. We also found no correlation between Ne and the number of heterozygotes-derived missense variants, the number of heterozygotes-derived LoF variants, the number of homozygous-derived LoF variants, the total number of allelic-derived missense variants, and the total number of allelic-derived LoF variants (Figure 4). Similar to the genetic diversity pattern, three species in the subgenus Pachyceros (Ne-BIG = 356.73; Ne-SOWS = 654.79; Ne-THNS = 1513.19) showed similar values of genetic load.

3.4. Relationships of Domestication and Improvement Process with Genetic Diversity and Genetic Load

To investigate the effects of the domestication and improvement process on genetic diversity and genetic load, we further calculated the genetic diversity and genetic load of native breeds (Finnsheep, Shetland sheep, and Tibetan sheep) and improved breeds (Chinese Merino sheep).
We found that the Asiatic mouflon population presented significantly higher nucleotide diversity (π) than both native sheep (p < 0.001) and improved sheep (p < 0.001), and the native sheep possessed higher π than the improved sheep (p < 0.001) (Figure 5A). Additionally, the Asiatic mouflon population showed higher heterozygosity than the native populations (p < 0.01), which showed lower heterozygosity than the improved sheep breeds (p < 0.001). However, the heterozygosity of the improved species was significantly higher than that of the native breeds (p < 0.001) and not considerably different from Asiatic mouflon (p > 0.05) (Figure 5B). FROH and F-index were lower in improved breeds than in native breeds (p < 0.05) (Figure 5C,D), and the result conflicts with the hypothesis of improved processes decreasing genetic diversity. We also evaluated the impact of domestication and improvement processes on genetic load for missense and LoF mutations (Figure 6). We observed alternative genetic load patterns for missense and LoF mutations in Asiatic mouflon and domesticated sheep (Figure 6). The mutation load for missense (number of homozygous and total number of alleles) was higher in Asiatic mouflon than in domestic sheep (p < 0.01) (Figure 6A,C,E). Still, the mutation load for LoF (number of heterozygotes and number of homozygous) was not significantly different between Asiatic mouflon and domesticated sheep (Figure 6B,D,F). We also observed lower mutation load for missense in improved breeds than in native populations (p < 0.01) (Figure 6C,E), and there was no significant difference in mutation load for LoF among improved breeds than native populations (p > 0.05) (Figure 6D,F). The results suggested that domestication may purify weak genetic load (missense mutation) more efficiently in domestic and improvement populations.

4. Discussion

The domestication and improvement processes exert different evolutionary forces on sheep, such as bottleneck, artificial selection, and the relaxation of selective pressures. They may reshape genomic characteristics (e.g., genetic diversity, mutation burden) [6,17,38,39]. Then, the diffusion of domesticated sheep with humans and dramatic growth in population size may be a risk to the survival of relative species by competing resources, isolating habitat, and genetic erosion [19,40,41]. Understanding how evolutionary factors (e.g., Ne) cause genetic diversity and deleterious mutations is vital to sheep breeding and wild species conservation [2,42].

4.1. Genetic Diversity and Mutation Burden among Wild Species

Nucleotide diversity and heterozygosity are pivotal metrics in assessing the conservation status of wild species, exerting influences on factors such as fitness, inbreeding, and genetic load [43]. We calculated a suite of genetic parameters, including nucleotide diversity (π), heterozygosity, FROH, F-index, and genetic load (Tables S3 and S4). Significant variations in genetic diversity and mutation burden were observed among species (Figure 1 and Figure 2). These observations are consistent with the population structure observed in Chen et al. and Upadhyay et al., in which Bighorn sheep, Thinhorn sheep, and Snow sheep form a cluster; Urial sheep, Asiatic mouflon, and European mouflon form a cluster; and Argali form a unique cluster [11,44]. We made an intriguing observation of subgenus Pachyceros, all species of which presented similar genetic diversity (lower genetic diversity and heightened inbreeding coefficients) (Figure 1) and deleterious mutation (increased genetic load) patterns. The alternative pattern among subgenus Pachyceros and other species within Ovis is consistent with the phylogeny of Ovis. Two genetic clades were clarified based on multiple accounts [44,45,46], and three species within subgenus Pachyceros dramatically declined in population size ~80–250 thousand years ago [11], which may be caused by the genomic landscape. These findings emphasize the need for augmented conservation efforts towards subgenus Pachyceros. All three species are still categorized as “Least Concern” by the IUCN Red List (https://www.iucnredlist.org/, last accessed on 20 July 2023).
European mouflon presents a distinctive case, with the lowest genetic diversity, the highest inbreeding coefficient, and a lower genetic load (Figure 1 and Figure 2). The results could be ascribed to feral species’ specific history [13,47,48]. The feralization of European mouflon is accompanied by founder effects and bottleneck events, reducing genetic diversity and increasing inbreeding and genetic load. However, we did not observe elevated genetic load in European mouflon, which could have been subjected to a combination of genetic drift and the purging of deleterious mutations through increased inbreeding and purifying selection in small populations [4]. Argali exhibits intermediary levels of genetic diversity and genetic load compared to the other species (Figure 1 and Figure 2). This suggests the potential role of Argali as a genetic bridge facilitating gene flow between subgenus Pachyceros and other species within Ovis [11,44].

4.2. Ne and Genetic Load

The effective population size (Ne) is a critical parameter in population genetics and is indirectly related to genetic load via genetic drift [49]. However, patterns of inconsistency were observed. Smaller Ne might purge deleterious mutations via purifying selection and genetic drift in Island foxes and kākāpō [4,5] and enhance the accumulation of mutation burden in killer whale and Island songbirds [1,50]. Conversely, some studies suggest that larger populations could harbor a higher potential genetic load, while smaller populations might have a higher realized genetic load [35].
Our analysis demonstrated that recent effective population size has no relationship with genetic load across seven species within Ovis (Figure 4). The three species in subgenus Pachyceros tend to carry a higher genetic load and lower genetic diversity patterns (Figure 1 and Figure 2). In addition, we identified a specific species—European mouflon—with the lowest Ne, lower genetic diversity, and higher inbreeding but lower genetic load (missense and LoF). This suggests that the small Ne of European mouflon reduced the number of deleterious mutations more efficiently compared to other species within the genus Ovis [13]. We also found extensive variants of Ne among Bighorn sheep, Thinhorn sheep, and Snow sheep (Figure 4), and an almost identical demographic history ~80–250 thousand years ago [11,44]. The result, combined with similar genetic diversity and genetic load patterns in subgenus Pachyceros, suggested that the dramatic decline in population sizes throughout history shaped Ovis’s genetic diversity and genetic load pattern.

4.3. Cost of Domestication

In the “cost of domestication” hypothesis, domestication and the improvement processes are expected to reduce genetic diversity and increase genetic load [51]. Our results revealed that the domestication process in sheep led to a decrease in genetic diversity and an increase in inbreeding (Figure 5). Conversely, the improvement process resulted in lower π and higher heterozygosity and reduced inbreeding in improved populations compared to native breeds. These observations could be attributed to hybridization in the improved process. For example, Merino sheep originated from hybridization involving multiple breeds [52], which may explain the increased heterozygosity and decreased inbreeding. Similar patterns have been observed in other livestock species, such as pigs [53] and cows [54], suggesting that hybridization can enhance the heterozygosity level of breeds.
Our analysis revealed that domestication and improvement did not influence large-effect mutations (LoF mutations) (Figure 6B,D,F), which could be attributed to a strong purge of large-effect mutations in all populations [53]. However, we observed a reduction in weak genetic load in native and improved populations (Figure 6C,E); the pattern coincides with smaller populations purging weak genetic load (missense) more efficiently [54]. Further validations, such as simulations, are necessary in order to explore this relationship comprehensively.

5. Conclusions

This study illuminates new insights into the impact of effective population size, domestication, and improvement processes on genetic diversity and mutation burden. Our research demonstrates that genus Ovis’s genetic load and diversity have no discernible impact on recent Ne. We also observed lower genetic diversity in domesticated sheep than in Asiatic mouflon and counterintuitive patterns of genetic load, i.e., lower missense mutations in domestic sheep than in Asiatic mouflon, indicating that domestication and improvement processes lower the weak genetic load (missense) more efficiently. Collectively, this study underscores the need for a more nuanced and comprehensive understanding of these multifaceted relationships and emphasizes the critical role of genomics in species conservation and animal breeding.

Supplementary Materials

The following supporting information can be downloaded at: https://www.mdpi.com/article/10.3390/genes14101977/s1, Table S1: Sample informations in this study; Table S2: Effective population size (Ne) of 7 wild Ovis species before 100 generations; Table S3: Summary of genomic diversity of 7 wild Ovis species; Table S4: Wilcoxon test of AMUF, Landraces and Improved populations for genetic diversity and mutation load.

Author Contributions

F.L. and L.S. conceived and supervised the study. D.W. conducted the data analysis. D.W., F.L. and H.S.-D. wrote the manuscript, and F.L., H.S.-D. and L.S. revised the paper. All authors have read and agreed to the published version of the manuscript.

Funding

This study was financially supported by grants from the National Natural Science Foundation of China (Nos. 32061133010 and 31972527), the National Key Research and Development Program-Key Projects (2021YFD1200900 and 2021YFD1300904), and the Second Tibetan Plateau Scientific Expedition and Research Program (STEP) (No. 2019QZKK0501).

Institutional Review Board Statement

Not applicable.

Informed Consent Statement

Not applicable.

Data Availability Statement

All data were downloaded from NCBI.

Conflicts of Interest

The authors declare no conflict of interest.

Code Availability:

All scripts used for this work were performed using open-source software tools and are available from the corresponding authors upon request.

References

  1. Leroy, T.; Rousselle, M.; Tilak, M.-K.; Caizergues, A.E.; Scornavacca, C.; Recuerda, M.; Fuchs, J.; Illera, J.C.; De Swardt, D.H.; Blanco, G.; et al. Island songbirds as windows into evolution in small populations. Curr. Biol. 2021, 31, 1303–1310.e4. [Google Scholar] [CrossRef] [PubMed]
  2. Montgomery, M.E.; Woodworth, L.M.; Nurthen, R.K.; Gilligan, D.M.; Briscoe, D.A.; Frankham, R. Relationships between population size and loss of genetic diversity: Comparisons of experimental results with theoretical predictions. Conserv. Genet. 2000, 1, 33–43. [Google Scholar] [CrossRef]
  3. Buffalo, V. Quantifying the relationship between genetic diversity and population size suggests natural selection cannot explain Lewontin’s Paradox. eLife 2021, 10, e67509. [Google Scholar] [CrossRef] [PubMed]
  4. Dussex, N.; van der Valk, T.; Morales, H.E.; Wheat, C.W.; Díez-del-Molino, D.; von Seth, J.; Foster, Y.; Kutschera, V.E.; Guschanski, K.; Rhie, A.; et al. Population genomics of the critically endangered kākāpō. Cell Genom. 2021, 1, 100002. [Google Scholar] [CrossRef]
  5. Robinson, J.A.; Brown, C.; Kim, B.Y.; Lohmueller, K.E.; Wayne, R.K. Purging of Strongly Deleterious Mutations Explains Long-Term Persistence and Absence of Inbreeding Depression in Island Foxes. Curr. Biol. 2018, 28, 3487–3494. [Google Scholar] [CrossRef] [PubMed]
  6. Moyers, B.T.; Morrell, P.L.; McKay, J.K. Genetic Costs of Domestication and Improvement. J. Hered. 2017, 109, 103–116. [Google Scholar] [CrossRef] [PubMed]
  7. Wang, M.-S.; Zhang, J.-J.; Guo, X.; Li, M.; Meyer, R.; Ashari, H.; Zheng, Z.-Q.; Wang, S.; Peng, M.-S.; Jiang, Y.; et al. Large-scale genomic analysis reveals the genetic cost of chicken domestication. BMC Biol. 2021, 19, 118. [Google Scholar] [CrossRef]
  8. Marsden, C.D.; Ortega-Del Vecchyo, D.; O’Brien, D.P.; Taylor, J.F.; Ramirez, O.; Vilà, C.; Marques-Bonet, T.; Schnabel, R.D.; Wayne, R.K.; Lohmueller, K.E. Bottlenecks and selective sweeps during domestication have increased deleterious genetic variation in dogs. Proc. Natl. Acad. Sci. USA 2016, 113, 152–157. [Google Scholar] [CrossRef]
  9. Gaut, B.S.; Seymour, D.K.; Liu, Q.; Zhou, Y. Demography and its effects on genomic variation in crop domestication. Nat. Plants 2018, 4, 512–520. [Google Scholar] [CrossRef]
  10. Samayoa, L.F.; Olukolu, B.A.; Yang, C.J.; Chen, Q.; Stetter, M.G.; York, A.M.; Sanchez-Gonzalez, J.d.J.; Glaubitz, J.C.; Bradbury, P.J.; Romay, M.C.; et al. Domestication reshaped the genetic basis of inbreeding depression in a maize landrace compared to its wild relative, teosinte. PLoS Genet. 2021, 17, e1009797. [Google Scholar] [CrossRef]
  11. Chen, Z.-H.; Xu, Y.-X.; Xie, X.-L.; Wang, D.-F.; Aguilar-Gómez, D.; Liu, G.-J.; Li, X.; Esmailizadeh, A.; Rezaei, V.; Kantanen, J.; et al. Whole-genome sequence analysis unveils different origins of European and Asiatic mouflon and domestication-related genes in sheep. Commun. Biol. 2021, 4, 1307. [Google Scholar] [CrossRef] [PubMed]
  12. Barbato, M.; Hailer, F.; Orozco-terWengel, P.; Kijas, J.; Mereu, P.; Cabras, P.; Mazza, R.; Pirastru, M.; Bruford, M.W. Genomic signatures of adaptive introgression from European mouflon into domestic sheep. Sci. Rep. 2017, 7, 7623. [Google Scholar] [CrossRef] [PubMed]
  13. Hermans, W.A. The European mouflon. Ovis musimon. Tijdschr. Voor Diergeneeskd. 1996, 121, 515–517. [Google Scholar]
  14. Chessa, B.; Pereira, F.; Arnaud, F.; Amorim, A.; Goyache, F.; Mainland, I.; Kao, R.R.; Pemberton, J.M.; Beraldi, D.; Stear, M.J.; et al. Revealing the History of Sheep Domestication Using Retrovirus Integrations. Science 2009, 324, 532–536. [Google Scholar] [CrossRef]
  15. Maher, L.A.; Richter, T.; Stock, J.T. The Pre-Natufian Epipaleolithic: Long-term Behavioral Trends in the Levant. Evol. Anthropol. Issues News Rev. 2012, 21, 69–81. [Google Scholar] [CrossRef]
  16. Zeder, M.A. Domestication and early agriculture in the Mediterranean Basin: Origins, diffusion, and impact. Proc. Natl. Acad. Sci. USA 2008, 105, 11597–11604. [Google Scholar] [CrossRef]
  17. Li, X.; Yang, J.; Shen, M.; Xie, X.-L.; Liu, G.-J.; Xu, Y.-X.; Lv, F.-H.; Yang, H.; Yang, Y.-L.; Liu, C.-B.; et al. Whole-genome resequencing of wild and domestic sheep identifies genes associated with morphological and agronomic traits. Nat. Commun. 2020, 11, 2815. [Google Scholar] [CrossRef]
  18. Kalds, P.; Zhou, S.; Gao, Y.; Cai, B.; Huang, S.; Chen, Y.; Wang, X. Genetics of the phenotypic evolution in sheep: A molecular look at diversity-driving genes. Genet. Sel. Evol. 2022, 54, 61. [Google Scholar] [CrossRef]
  19. Lv, F.-H.; Cao, Y.-H.; Liu, G.-J.; Luo, L.-Y.; Lu, R.; Liu, M.-J.; Li, W.-R.; Zhou, P.; Wang, X.-H.; Shen, M.; et al. Whole-genome resequencing of worldwide wild and domestic sheep elucidates genetic diversity, introgression and agronomically important loci. Mol. Biol. Evol. 2022, 39, msab353. [Google Scholar] [CrossRef]
  20. Bolger, A.M.; Lohse, M.; Usadel, B. Trimmomatic: A flexible trimmer for Illumina sequence data. Bioinformatics 2014, 30, 2114–2120. [Google Scholar] [CrossRef]
  21. Li, H. Aligning sequence reads, clone sequences and assembly contigs with BWA-MEM. arXiv 2013, arXiv:1303.3997. [Google Scholar]
  22. McKenna, A.; Hanna, M.; Banks, E.; Sivachenko, A.; Cibulskis, K.; Kernytsky, A.; Garimella, K.; Altshuler, D.; Gabriel, S.; Daly, M.; et al. The Genome Analysis Toolkit: A MapReduce framework for analyzing next-generation DNA sequencing data. Genome Res. 2010, 20, 1297–1303. [Google Scholar] [CrossRef] [PubMed]
  23. Danecek, P.; Auton, A.; Abecasis, G.; Albers, C.A.; Banks, E.; DePristo, M.A.; Handsaker, R.E.; Lunter, G.; Marth, G.T.; Sherry, S.T.; et al. The variant call format and VCFtools. Bioinformatics 2011, 27, 2156–2158. [Google Scholar] [CrossRef] [PubMed]
  24. Chang, C.C.; Chow, C.C.; Tellier, L.C.; Vattikuti, S.; Purcell, S.M.; Lee, J.J. Second-generation PLINK: Rising to the challenge of larger and richer datasets. Gigascience 2015, 4, s13742-015. [Google Scholar] [CrossRef]
  25. Biscarini, F.; Cozzi, P.; Gaspa, G.; Marras, G. detectRUNS: Detect Runs of Homozygosity and Runs of Heterozygosity in Diploid Genomes; CRAN (The Comprehensive R Archive Network): Vienna, Austria, 2018. [Google Scholar]
  26. Gorssen, W.; Meyermans, R.; Janssens, S.; Buys, N. A publicly available repository of ROH islands reveals signatures of selection in different livestock and pet species. Genet. Sel. Evol. 2021, 53, 2. [Google Scholar] [CrossRef]
  27. Meyermans, R.; Gorssen, W.; Buys, N.; Janssens, S. How to study runs of homozygosity using PLINK? A guide for analyzing medium density SNP data in livestock and pet species. BMC Genom. 2020, 21, 94. [Google Scholar] [CrossRef] [PubMed]
  28. Shi, L.; Wang, L.; Liu, J.; Deng, T.; Yan, H.; Zhang, L.; Liu, X.; Gao, H.; Hou, X.; Wang, L.; et al. Estimation of inbreeding and identification of regions under heavy selection based on runs of homozygosity in a Large White pig population. J. Anim. Sci. Biotechnol. 2020, 11, 46. [Google Scholar] [CrossRef]
  29. Barbato, M.; Orozco-terWengel, P.; Tapio, M.; Bruford, M.W. SNeP: A tool to estimate trends in recent effective population size trajectories using genome-wide SNP data. Front. Genet. 2015, 6, 109. [Google Scholar] [CrossRef]
  30. Sved, J.A. Linkage disequilibrium and homozygosity of chromosome segments in finite populations. Theor. Popul. Biol. 1971, 2, 125–141. [Google Scholar] [CrossRef]
  31. Li, H. Minimap2: Pairwise alignment for nucleotide sequences. Bioinformatics 2018, 34, 3094–3100. [Google Scholar] [CrossRef]
  32. Danecek, P.; Bonfield, J.K.; Liddle, J.; Marshall, J.; Ohan, V.; Pollard, M.O.; Whitwham, A.; Keane, T.; McCarthy, S.A.; Davies, R.M.; et al. Twelve years of SAMtools and BCFtools. Gigascience 2021, 10, giab008. [Google Scholar] [CrossRef] [PubMed]
  33. Cingolani, P.; Platts, A.; Wang, L.; Coon, M.; Nguyen, T.; Wang, L.; Land, S.J.; Lu, X.; Ruden, D.M. A program for annotating and predicting the effects of single nucleotide polymorphisms, SnpEff: SNPs in the genome of Drosophila melanogaster strain w1118; iso-2; iso-3. Fly 2012, 6, 80–92. [Google Scholar] [CrossRef] [PubMed]
  34. Humble, E.; Stoffel, M.A.; Dicks, K.; Ball, A.D.; Gooley, R.M.; Chuven, J.; Pusey, R.; Remeithi, M.A.; Koepfli, K.-P.; Pukazhenthi, B.; et al. Conservation management strategy impacts inbreeding and mutation load in scimitar-horned oryx. Proc. Natl. Acad. Sci. USA 2023, 120, e2210756120. [Google Scholar] [CrossRef]
  35. Mathur, S.; DeWoody, J.A. Genetic load has potential in large populations but is realized in small inbred populations. Evol. Appl. 2021, 14, 1540–1557. [Google Scholar] [CrossRef] [PubMed]
  36. Bertorelle, G.; Raffini, F.; Bosse, M.; Bortoluzzi, C.; Iannucci, A.; Trucchi, E.; Morales, H.E.; van Oosterhout, C. Genetic load: Genomic estimates and applications in non-model animals. Nat. Rev. Genet. 2022, 23, 492–503. [Google Scholar] [CrossRef]
  37. Grossen, C.; Guillaume, F.; Keller, L.F.; Croll, D. Purging of highly deleterious mutations through severe bottlenecks in Alpine ibex. Nat. Commun. 2020, 11, 1001. [Google Scholar] [CrossRef]
  38. Morrell, P.L.; Buckler, E.S.; Ross-Ibarra, J. Crop genomics: Advances and applications. Nat. Rev. Genet. 2012, 13, 85–96. [Google Scholar] [CrossRef]
  39. Alberto, F.J.; Boyer, F.; Orozco-terWengel, P.; Streeter, I.; Servin, B.; de Villemereuil, P.; Benjelloun, B.; Librado, P.; Biscarini, F.; Colli, L.; et al. Convergent genomic signatures of domestication in sheep and goats. Nat. Commun. 2018, 9, 813. [Google Scholar] [CrossRef]
  40. Cheng, H.; Zhang, Z.; Wen, J.; Lenstra, J.A.; Heller, R.; Cai, Y.; Guo, Y.; Li, M.; Li, R.; Li, W.; et al. Long divergent haplotypes introgressed from wild sheep are associated with distinct morphological and adaptive characteristics in domestic sheep. PLoS Genet. 2023, 19, e1010615. [Google Scholar] [CrossRef]
  41. IUCN. The IUCN Red List of Threatened Species. 2020. Available online: https://www.iucnredlist.org (accessed on 25 June 2023).
  42. Orellana, M.-R.; López-Pujol, J.; Blanché, C.; Bosch, M. Relationships between heterozygosity and fitness in the Iberian threatened larkspur Delphinium bolosii (Ranunculaceae). Flora Morphol. Distrib. Funct. Ecol. 2007, 202, 161–168. [Google Scholar] [CrossRef]
  43. Grueber, C.E.; Wallis, G.P.; Jamieson, I.G. Heterozygosity–fitness correlations and their relevance to studies on inbreeding depression in threatened species. Mol. Ecol. 2008, 17, 3978–3984. [Google Scholar] [CrossRef]
  44. Upadhyay, M.; Kunz, E.; Sandoval-Castellanos, E.; Hauser, A.; Krebs, S.; Graf, A.; Blum, H.; Dotsev, A.; Okhlopkov, I.; Shakhin, A.; et al. Whole genome sequencing reveals a complex introgression history and the basis of adaptation to subarctic climate in wild sheep. Mol. Ecol. 2021, 30, 6701–6717. [Google Scholar] [CrossRef] [PubMed]
  45. Rezaei, H.R.; Naderi, S.; Chintauan-Marquier, I.C.; Taberlet, P.; Virk, A.T.; Naghash, H.R.; Rioux, D.; Kaboli, M.; Pompanon, F. Evolution and taxonomy of the wild species of the genus Ovis (Mammalia, Artiodactyla, Bovidae). Mol. Phylogenet. Evol. 2010, 54, 315–326. [Google Scholar] [CrossRef] [PubMed]
  46. Lv, F.-H.; Peng, W.-F.; Yang, J.; Zhao, Y.-X.; Li, W.-R.; Liu, M.-J.; Ma, Y.-H.; Zhao, Q.-J.; Yang, G.-L.; Wang, F.; et al. Mitogenomic Meta-Analysis Identifies Two Phases of Migration in the History of Eastern Eurasian Sheep. Mol. Biol. Evol. 2015, 32, 2515–2533. [Google Scholar] [CrossRef] [PubMed]
  47. Brivio, F.; Ciuti, S.; Pipia, A.; Grignolio, S.; Apollonio, M. Livestock displace European mouflon from optimal foraging sites. Eur. J. Wildl. Res. 2022, 68, 30. [Google Scholar] [CrossRef]
  48. Ptak, G.; Clinton, M.; Barboni, B.; Muzzeddu, M.; Cappai, P.; Tischner, M.; Loi, P. Preservation of the Wild European Mouflon: The First Example of Genetic Management Using a Complete Program of Reproductive Biotechnologies. Biol. Reprod. 2002, 66, 796–801. [Google Scholar] [CrossRef] [PubMed]
  49. Wang, J.; Santiago, E.; Caballero, A. Prediction and estimation of effective population size. Heredity 2016, 117, 193–206. [Google Scholar] [CrossRef]
  50. Kardos, M.; Zhang, Y.; Parsons, K.M.; Kang, H.; Xu, X.; Liu, X.; Matkin, C.O.; Zhang, P.; Ward, E.J.; Hanson, M.B.; et al. Inbreeding depression explains killer whale population dynamics. Nat. Ecol. Evol. 2023, 7, 675–686. [Google Scholar] [CrossRef]
  51. Lu, J.; Tang, T.; Tang, H.; Huang, J.; Shi, S.; Wu, C.-I. The accumulation of deleterious mutations in rice genomes: A hypothesis on the cost of domestication. Trends Genet. 2006, 22, 126–131. [Google Scholar] [CrossRef]
  52. Ciani, E.; Lasagna, E.; D’Andrea, M.; Alloggio, I.; Marroni, F.; Ceccobelli, S.; Delgado Bermejo, J.; Sarti, F.; Kijas, J.; Lenstra, J.; et al. Merino and Merino-derived sheep breeds: A genome-wide intercontinental study. Genet. Sel. Evol. 2015, 47, 64. [Google Scholar] [CrossRef]
  53. Dussex, N.; Morales, H.E.; Grossen, C.; Dalén, L.; van Oosterhout, C. Purging and accumulation of genetic load in conservation. Trends Ecol. Evol. 2023, 38, 961–969. [Google Scholar] [CrossRef] [PubMed]
  54. van der Valk, T.; Gonda, C.M.; Silegowa, H.; Almanza, S.; Sifuentes-Romero, I.; Hart, T.; Hart, J.; Detwiler, K.M.; Guschanski, K. The genome of the endangered Dryas monkey provides new insights into the evolutionary history of the vervets. Mol. Biol. Evol. 2019, 37, 183–194. [Google Scholar] [CrossRef] [PubMed]
Figure 1. The genetic diversity and individual coefficients of seven wild Ovis species: (A) nucleotide diversity (π) of seven wild species within the genus Ovis; (B) heterozygosity of seven wild species within the genus Ovis; (C) individuals inbreeding coefficients (FROH) of seven wild species within the genus Ovis; (D) F-index of seven wild species within genus Ovis.
Genes 14 01977 g001
Figure 2. The genetic load of seven wild species within the genus Ovis: (A) the number of heterozygotes-derived missense variants; (B) the number of heterozygotes-derived LoF variants; (C) the number of homozygous-derived missense variants; (D) the number of homozygous-derived LoF variants; (E) total number of allelic-derived missense variants; (F) total number of allelic-derived LoF variants.
Genes 14 01977 g002
Figure 3. The relationship between Ne and genetic diversity among seven wild species within the genus Ovis: (A) nucleotide diversity (π); (B) heterozygosity; (C) individuals inbreeding coefficients (FROH); (D) F-index.
Genes 14 01977 g003
Figure 4. The relationship between genetic load and Ne among seven wild species within the genus Ovis: (A) the number of heterozygotes-derived missense variants; (B) the number of heterozygotes-derived LoF variants; (C) the number of homozygous-derived missense variants; (D) the number of homozygous-derived LoF variants; (E) total number of allelic-derived missense variants; (F) total number of allelic-derived LoF variants.
Genes 14 01977 g004
Figure 5. The genetic diversity and individual coefficients of Asiatic mouflon, native, and improved sheep breeds: (A) nucleotide diversity (π) of Asiatic mouflon, native, and improved sheep breeds; (B) heterozygosity of Asiatic mouflon, native, and improved sheep breeds; (C) individuals inbreeding coefficients (FROH) of Asiatic mouflon, native, and improved sheep breeds; (D) F-index of Asiatic mouflon, native, and improved sheep breeds, *: p < 0.05; **: p < 0.01.
Genes 14 01977 g005
Figure 6. The genetic load of Asiatic mouflon, native, and improved sheep breeds: (A) the number of heterozygotes-derived missense variants; (B) the number of heterozygotes-derived LoF variants; (C) the number of homozygous-derived missense variants; (D) the number of homozygous-derived LoF variants; (E) total number of allelic-derived missense variants; (F) total number of allelic-derived LoF variants, *: p < 0.05; **: p < 0.01.
Genes 14 01977 g006
Table 1. Summary of sample information.
Breed/SpeciesAbbr.GroupNumber of IndividualCountryData
Europe Mouflon
(Ovis musimon)
EMUFWild species3FinlandWGS
Asiatic Mouflon
(Ovis orientalis)
AMUFWild species31IranWGS
Urial
(Ovis vignei)
URISWild species9IranWGS
Argali
(Ovis ammon)
ARGSWild species8ChinaWGS
Snow
(Ovis nivicola)
SOWSWild species8RussiaWGS
Thinhorn
(Ovis dalli)
THNSWild species6CanadaWGS
Bighorn
(Ovis canadensis)
BIGSWild species6CanadaWGS
TibetanTBTNative breed15ChinaWGS
FinnFINNative breed10FinlandWGS
ShetlandSHENative breed7The NetherlandsWGS
Chinese Merino (super fine wool)MSFImproved breed10ChinaWGS
Chinese Merino
(fine wool)
MFWImproved breed10ChinaWGS
Disclaimer/Publisher’s Note: The statements, opinions and data contained in all publications are solely those of the individual author(s) and contributor(s) and not of MDPI and/or the editor(s). MDPI and/or the editor(s) disclaim responsibility for any injury to people or property resulting from any ideas, methods, instructions or products referred to in the content.

