
Lipogenic Gene Single Nucleotide Polymorphic DNA Markers Associated with Intramuscular Fat, Fat Melting Point, and Health-Beneficial Omega-3 Long-Chain Polyunsaturated Fatty Acids in Australian Pasture-Based Bowen Genetics Forest Pastoral Angus, Hereford, and Wagyu Beef Cattle

 , , ,
, , ,  and
and
Abstract
1. Introduction
2. Materials and Methods
2.1. Animal Ethics
2.2. Animals and Management
2.3. Muscle Biopsy Sampling Procedure
2.4. Determination of Fatty Acid Profile, Intramuscular Fat, and Fat Melting Point
2.4.1. Determination of Intramuscular Fat
2.4.2. Determination of Fat Melting Point
2.4.3. Determination of Fatty Acid Composition
2.5. Blood Collection and Genomic DNA Isolation
2.6. Primer Design, Long-Range Amplification of Target Genes, PCR Clean-Up Products, Library Preparation, Sequencing, and Bioinformatics Analysis
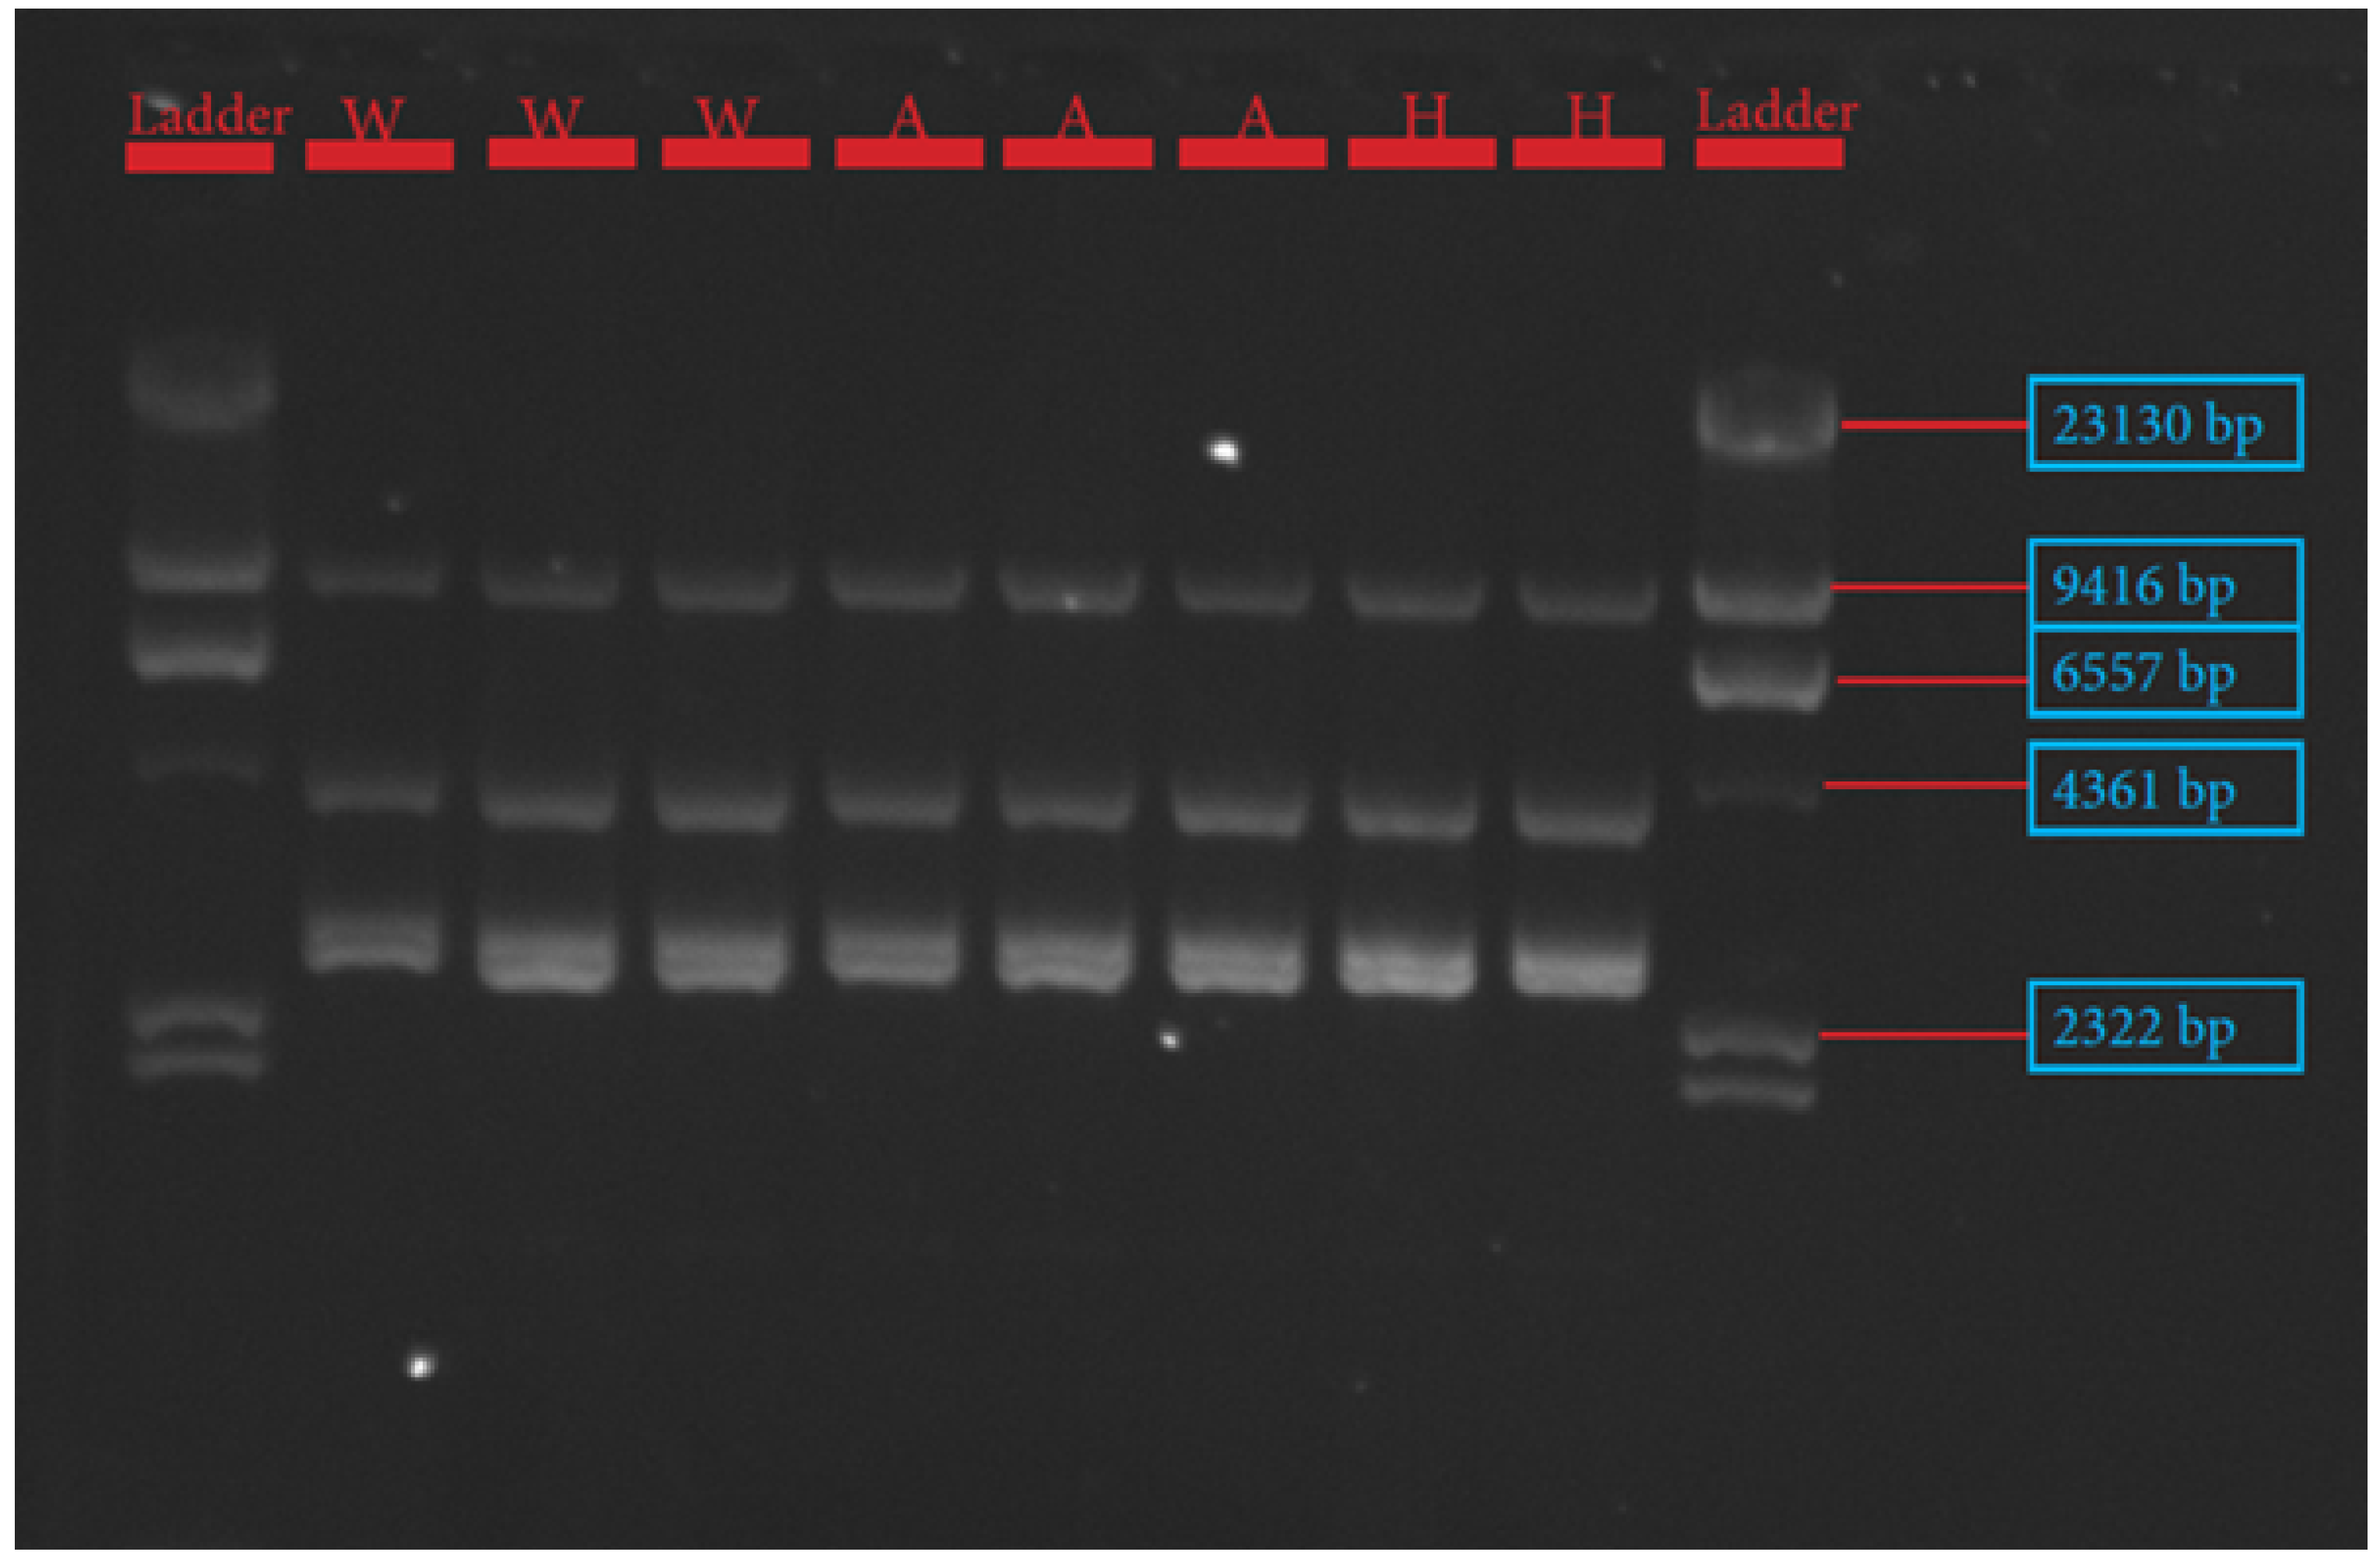
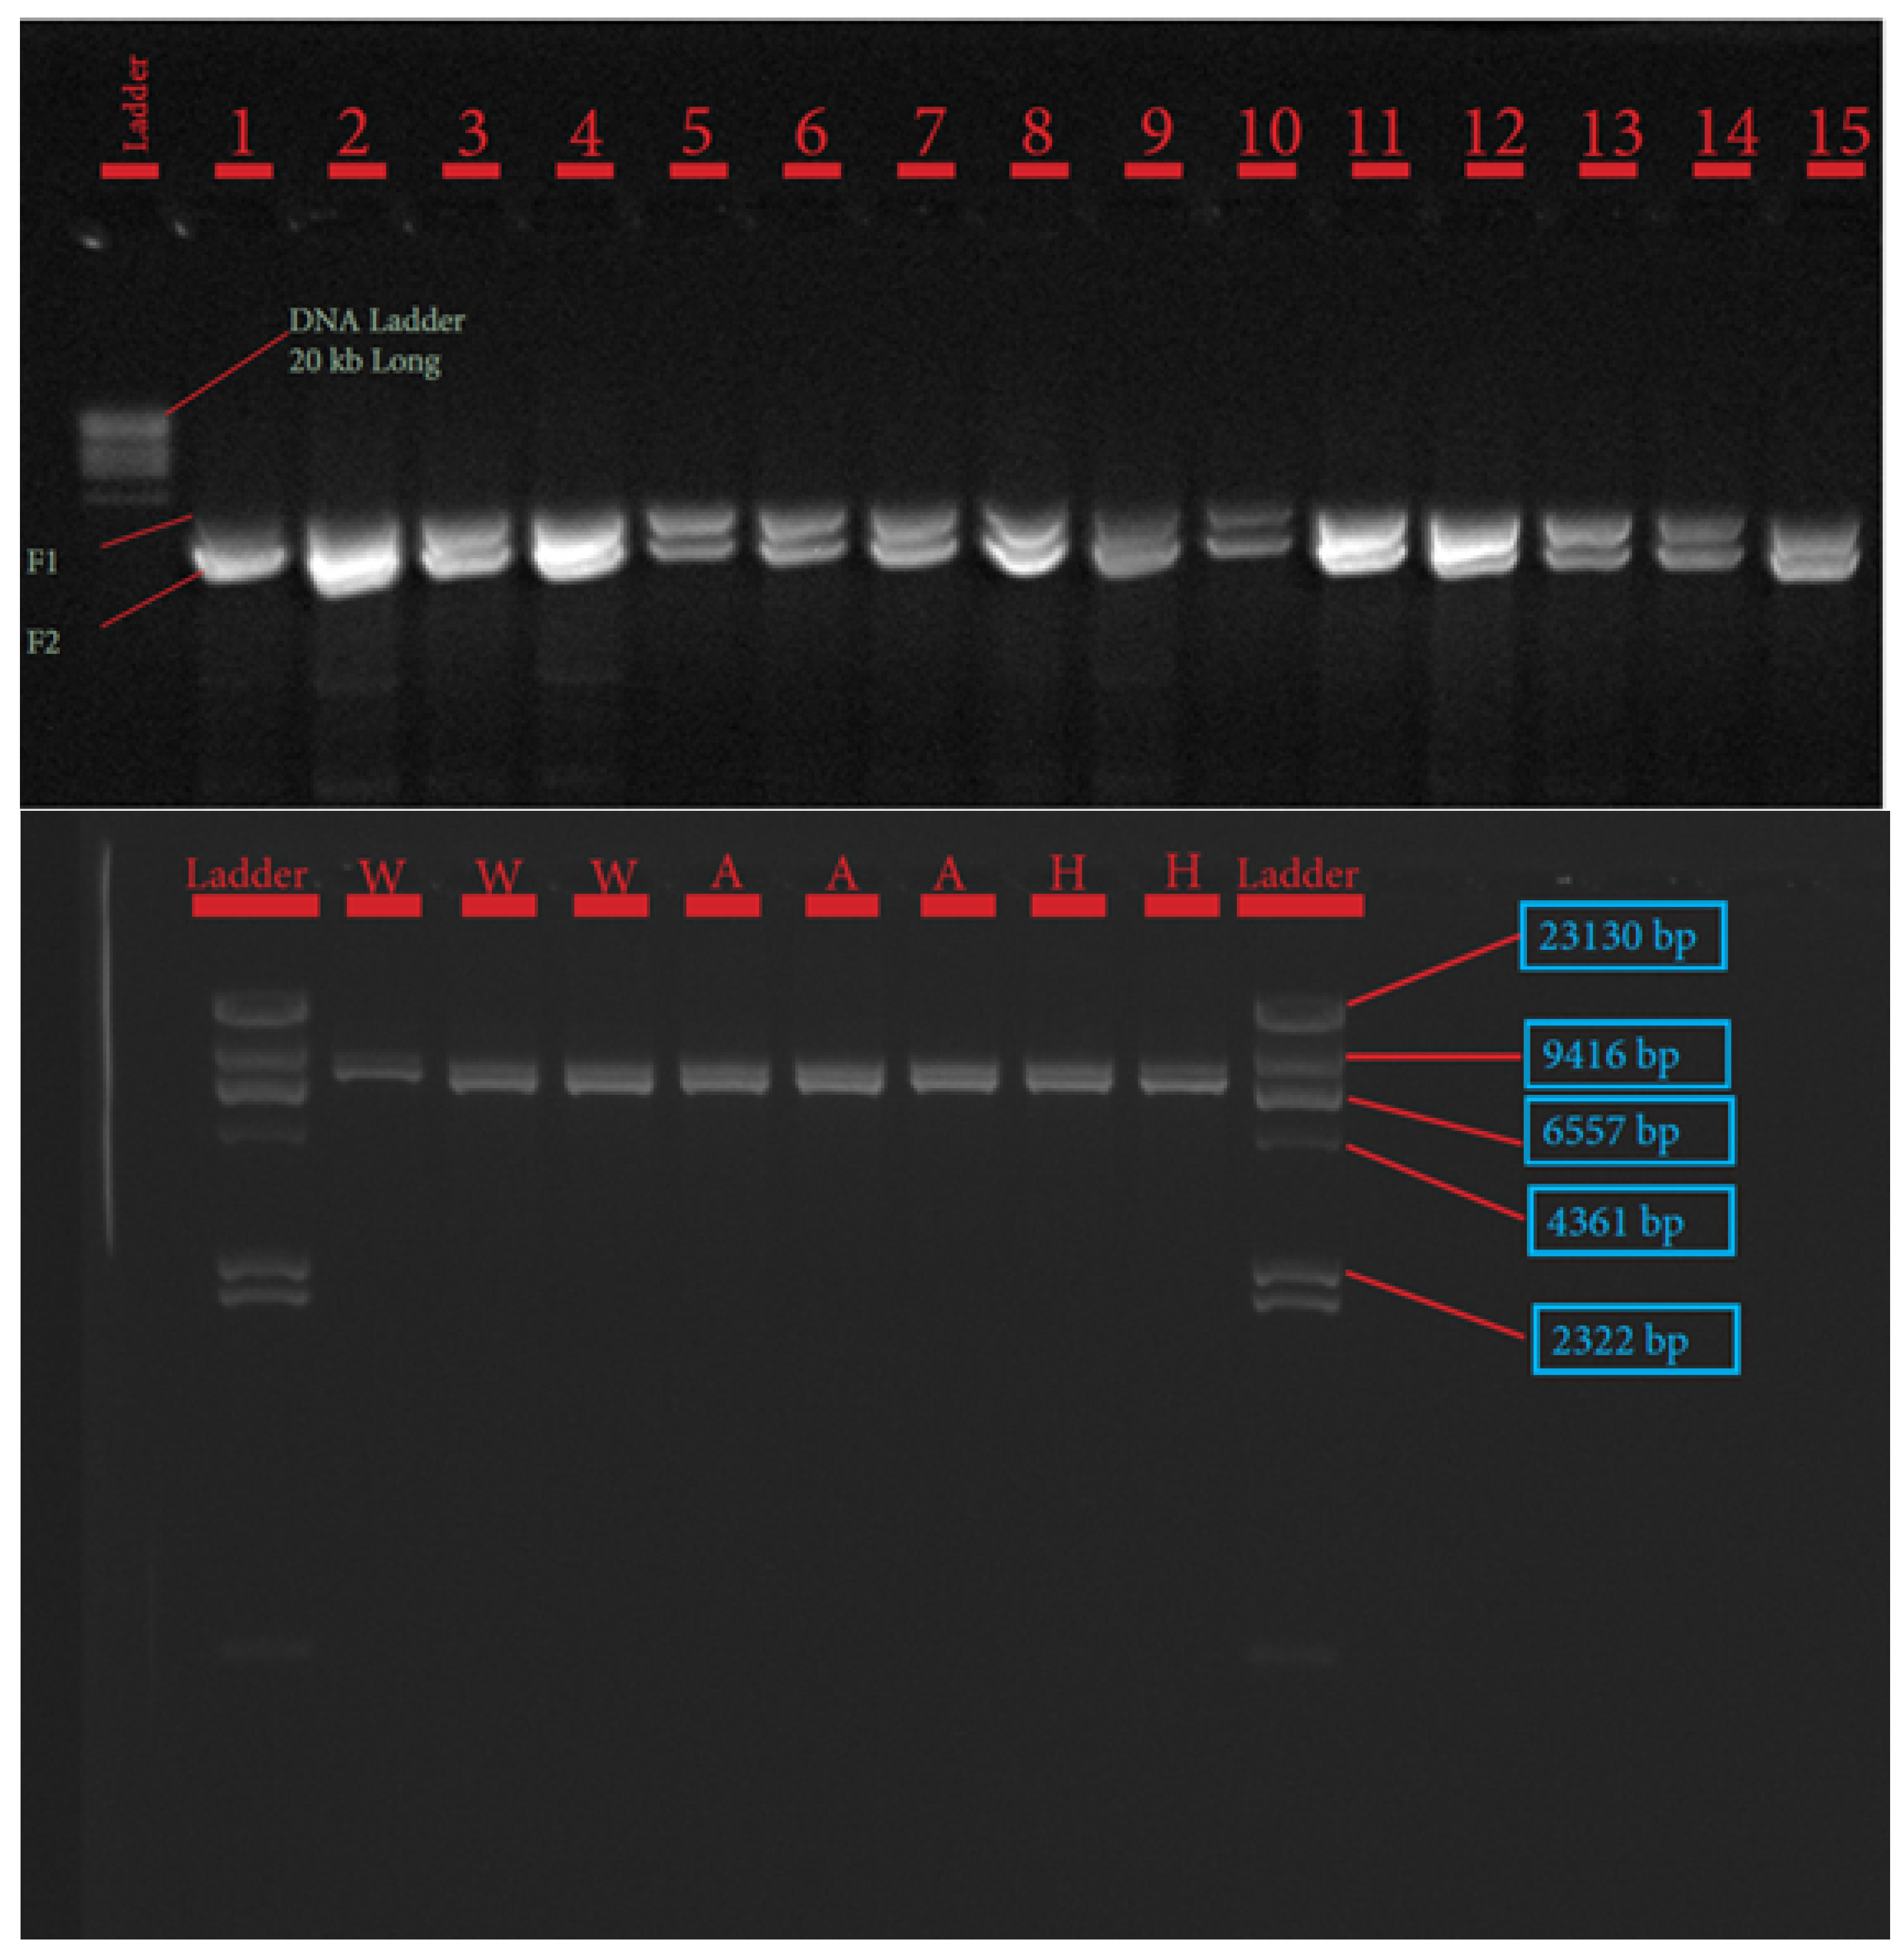
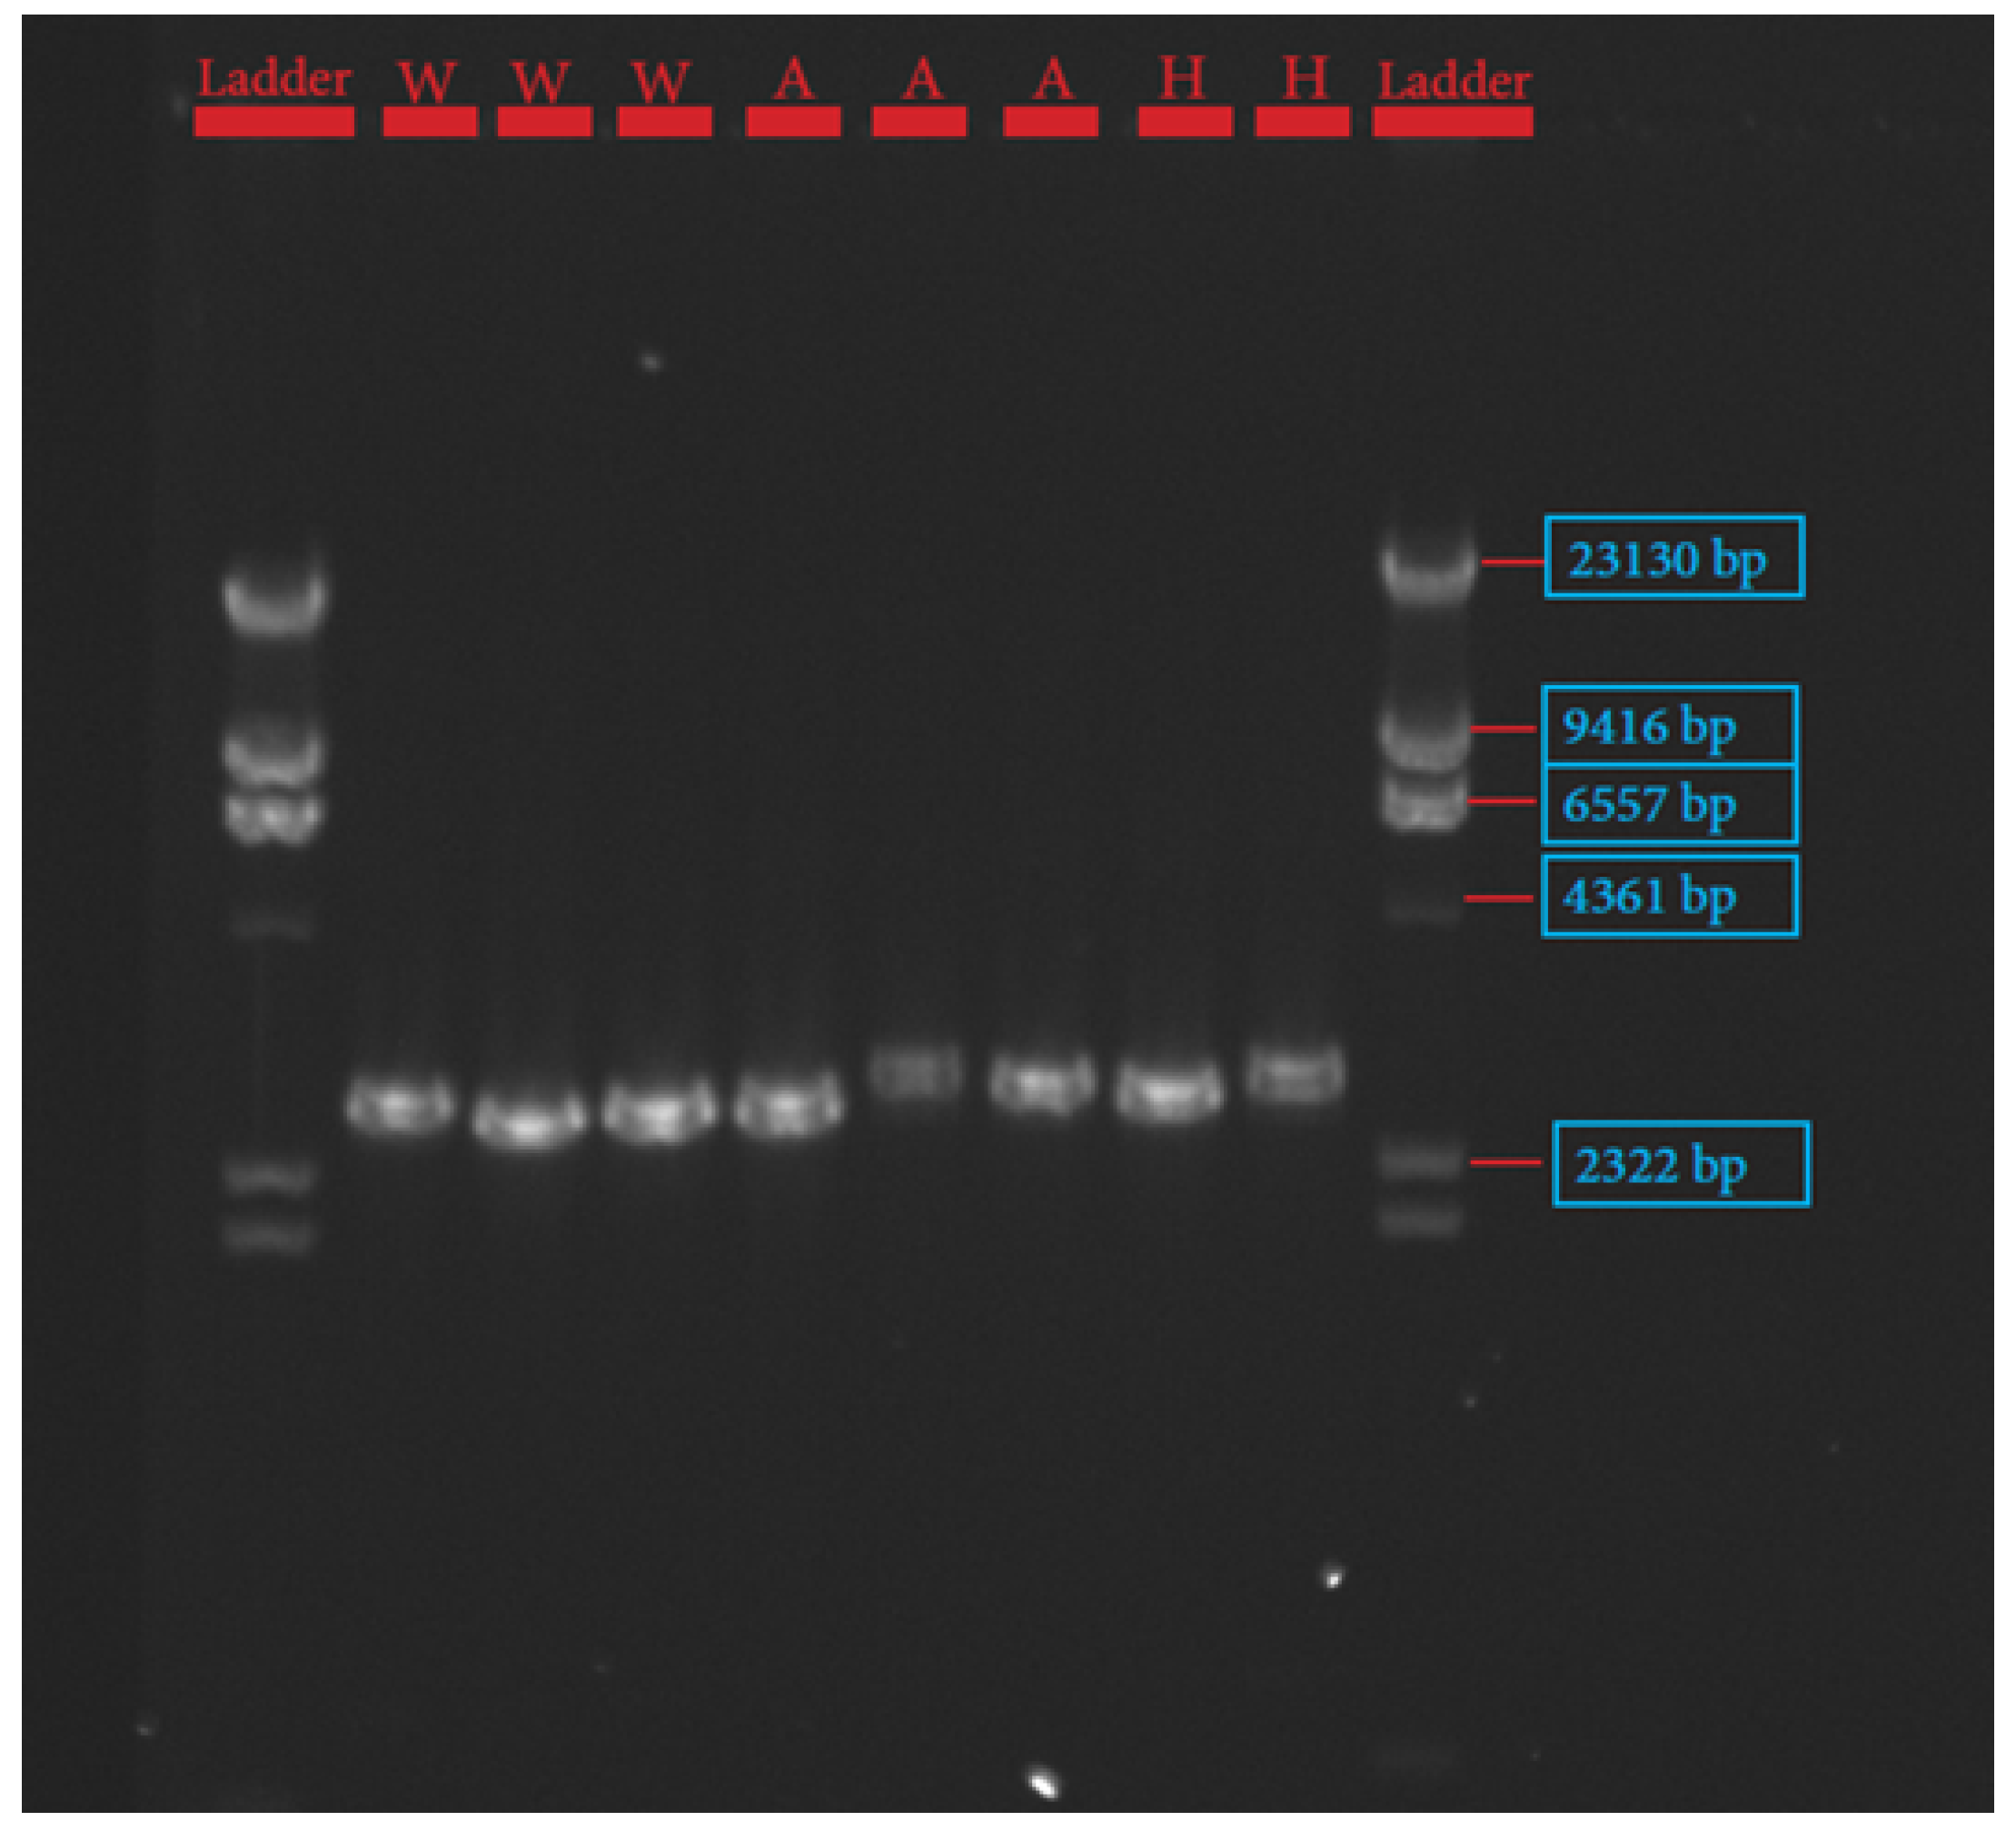
2.6.1. Long-Range PCR
2.6.2. FASN Gene
2.6.3. FABP4 and SCD Genes
2.6.4. PCR Clean-Up
2.6.5. Library Preparation, Quantification, Normalization, and Sequencing
2.6.6. Bioinformatics and Next Generation Sequencing Data Analysis
2.7. Statistical Analyses
3. Results
3.1. SCD, FASN, and FABP Variants and Genotypes
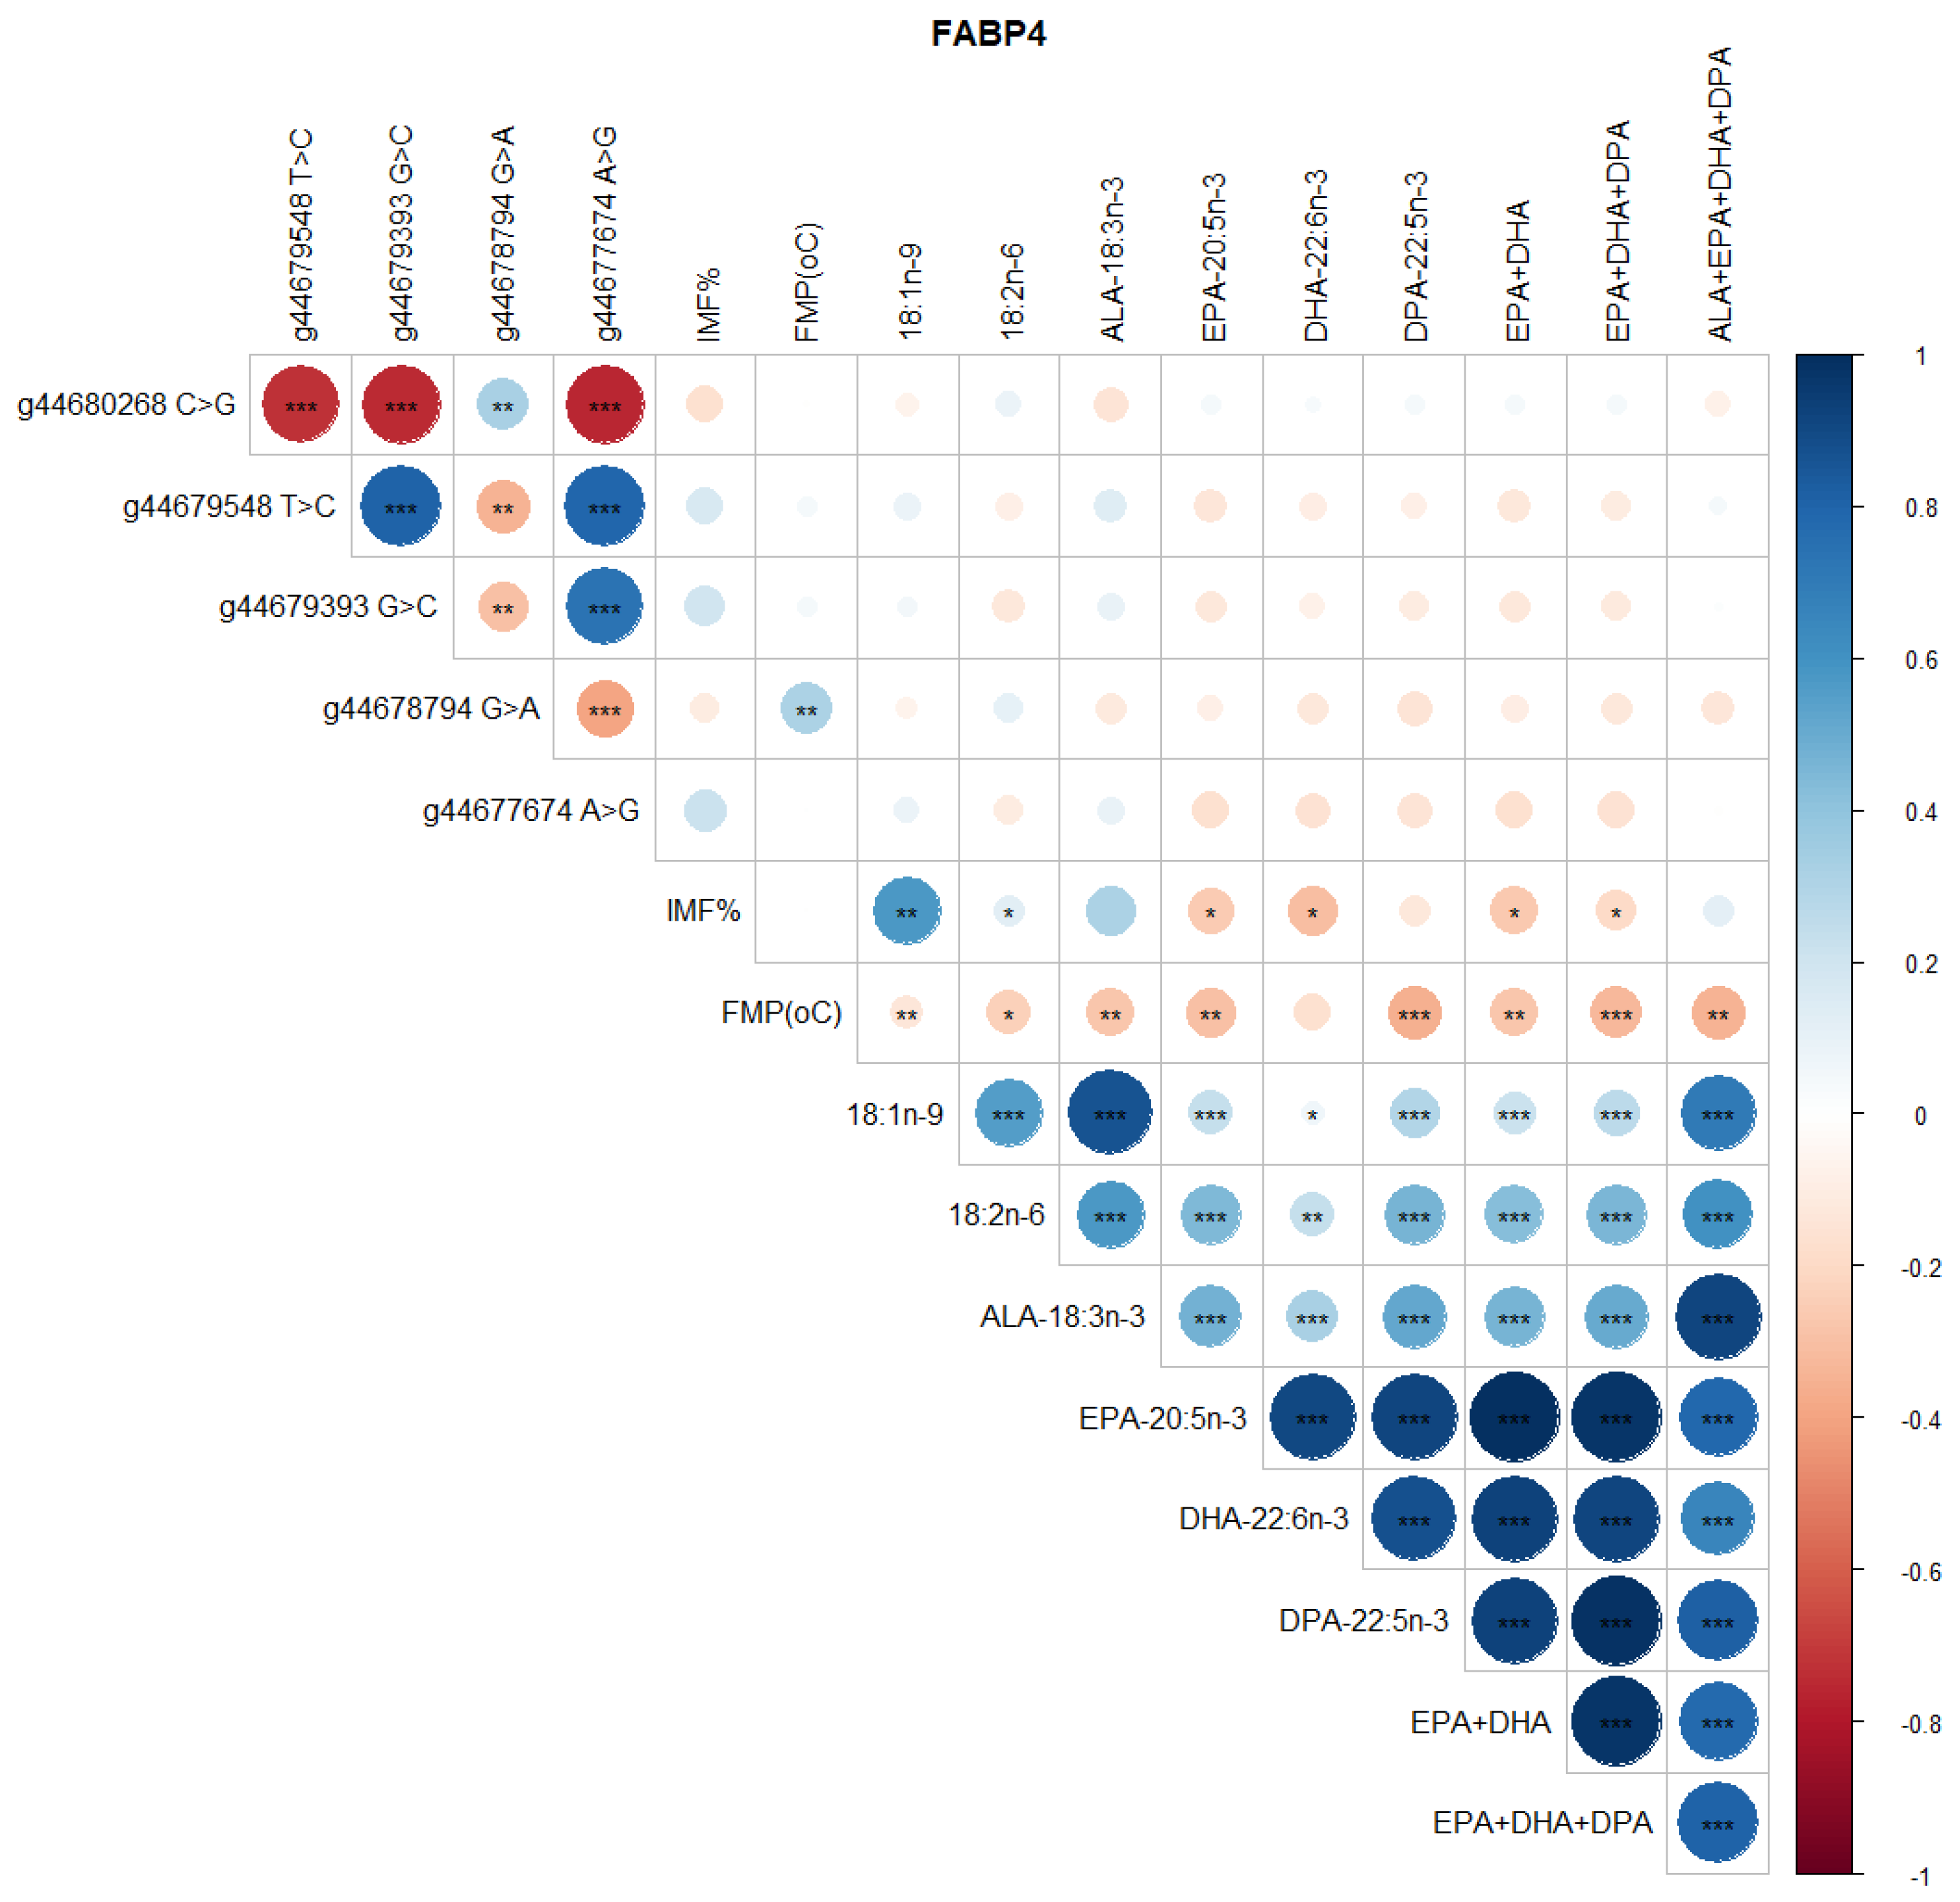
3.2. Correlations between SNP, FMP, IMF, and Health-Beneficial n-3 LC-PUFA
3.3. Associations between SNP and IMF, FMP, and Health-Beneficial n-3 LC-PUFA
3.4. Tukey-Adjusted Multiple Comparison Tests for Significant SNP, FMP, IMF, and Health-Beneficial n-3 LC-PUFA


4. Discussion
4.1. SCD Gene Polymorphism
4.2. FASN Gene Polymorphism
4.3. FABP4 Gene Polymorphism
5. Conclusions
Author Contributions
Funding
Institutional Review Board Statement
Informed Consent Statement
Data Availability Statement
Acknowledgments
Conflicts of Interest
References
- Pogorzelski, G.; Pogorzelska-Nowicka, E.; Pogorzelski, P.; Półtorak, A.; Hocquette, J.-F.; Wierzbicka, A. Towards an integration of pre- and post-slaughter factors affecting the eating quality of beef. Livest. Sci. 2022, 255, 104795. [Google Scholar] [CrossRef]
- Hoa, V.-B.; Song, D.-H.; Seol, K.-H.; Kang, S.-M.; Kim, H.-W.; Kim, J.-H.; Cho, S.-H. Coating with chitosan containing lauric acid (C12:0) significantly extends the shelf-life of aerobically—Packaged beef steaks during refrigerated storage. Meat Sci. 2022, 184, 108696. [Google Scholar] [CrossRef] [PubMed]
- Malau-Aduli, A.E.O.; Curran, J.; Gall, H.; Henriksen, E.; O’Connor, A.; Paine, L.; Richardson, B.; van Sliedregt, H.; Smith, L. Genetics and nutrition impacts on herd productivity in the Northern Australian beef cattle production cycle. Vet. Anim. Sci. 2022, 15, 100228. [Google Scholar] [CrossRef] [PubMed]
- Patel, A.; Desai, S.S.; Mane, V.K.; Enman, J.; Rova, U.; Christakopoulos, P.; Matsakas, L. Futuristic food fortification with a balanced ratio of dietary ω-3/ω-6 omega fatty acids for the prevention of lifestyle diseases. Trends Food Sci. Technol. 2022, 120, 140–153. [Google Scholar] [CrossRef]
- Kahn, L.; Cottle, D. Beef Production and Trade, 1st ed.; CSIRO Publishers: Collingwood, VIC, Australia, 2014; pp. 33–82. [Google Scholar]
- Motoyama, M.; Sasaki, K.; Watanabe, A. Wagyu and the factors contributing to its beef quality: A Japanese industry overview. Meat Sci. 2016, 120, 10–18. [Google Scholar] [CrossRef]
- Garmyn, A. Consumer preferences and acceptance of meat products. Foods 2020, 9, 708. [Google Scholar] [CrossRef]
- Calder, P.C. Very long chain omega-3 (n-3) fatty acids and human health. Eur. J. Lipid Sci. Technol. 2014, 116, 1280–1300. [Google Scholar] [CrossRef]
- Pewan, S.B.; Otto, J.R.; Huerlimann, R.; Budd, A.M.; Mwangi, F.W.; Edmunds, R.C.; Holman, B.W.B.; Henry, M.L.E.; Kinobe, R.T.; Adegboye, O.A.; et al. Next generation sequencing of single nucleotide polymorphic DNA-markers in selecting for intramuscular fat, fat felting point, omega-3 long-chain polyunsaturated fatty acids and meat eating quality in Tattykeel Australian White MARGRA lamb. Foods 2021, 10, 2288. [Google Scholar] [CrossRef]
- Wood, J.D.; Enser, M.; Fisher, A.V.; Nute, G.R.; Sheard, P.R.; Richardson, R.I.; Hughes, S.I.; Whittington, F.M. Fat deposition, fatty acid composition and meat quality: A review. Meat Sci. 2008, 78, 343–358. [Google Scholar] [CrossRef]
- Raza, S.H.A.; Gui, L.; Khan, R.; Schreurs, N.M.; Xiaoyu, W.; Wu, S.; Mei, C.; Wang, L.; Ma, X.; Wei, D.; et al. Association between FASN gene polymorphisms ultrasound carcass traits and intramuscular fat in Qinchuan cattle. Gene 2018, 645, 55–59. [Google Scholar] [CrossRef]
- Khatib, H. Molecular and Quantitative Animal Genetics, 1st ed.; John Wiley & Sons Inc.: New Jersey, NJ, USA, 2015; pp. 197–214. [Google Scholar]
- Byrne, C.J.; Fair, S.; Dick, J.R.; Lonergan, P.; Kenny, D.A. Dietary supplementation with fish oil and safflower oil, during the finishing period, alters brisket muscle fatty acid profile and n-6/n-3 ratio but not carcass traits of dairy beef bulls. Appl. Anim. Sci. 2021, 37, 436–444. [Google Scholar] [CrossRef]
- Torres, R.N.S.; Bertoco, J.P.A.; Arruda, M.C.G.; Coelho, L.M.; Paschoaloto, J.R.; Ezequiel, J.M.B.; Almeida, M.T.C. The effect of dietary inclusion of crude glycerin on performance, ruminal fermentation, meat quality and fatty acid profile of beef cattle: Meta-analysis. Res. Vet. Sci. 2021, 140, 171–184. [Google Scholar] [CrossRef]
- Correa, L.B.; Netto, A.S.; da Silva, J.S.; Consolo, N.R.B.; Pugine, S.M.P.; de Melo, M.P.; Santana, R.S.S.; Zanetti, M.A. Changes on meat fatty acid profile, cholesterol and hepatic metabolism associated with antioxidants and canola oil supplementation for Nellore cattle. Livest. Sci. 2022, 257, 104850. [Google Scholar] [CrossRef]
- Monteiro, P.A.M.; Maciel, I.C.F.; Alvarenga, R.C.; Oliveira, A.L.; Barbosa, F.A.; Guimarães, S.T.; Souza, F.A.; Lanna, D.P.D.; Rodrigues, B.M.; Lopes, L.S. Carcass traits, fatty acid profile of beef, and beef quality of Nellore and Angus x Nellore crossbred young bulls finished in a feedlot. Livest. Sci. 2022, 256, 104829. [Google Scholar] [CrossRef]
- Buccioni, A.; Decandia, M.; Minieri, S.; Molle, G.; Cabiddu, A. Lipid metabolism in the rumen: New insights on lipolysis and biohydrogenation with an emphasis on the role of endogenous plant factors. Anim. Feed Sci. Technol. 2012, 174, 1–25. [Google Scholar] [CrossRef]
- Menci, R.; Coppa, M.; Torrent, A.; Natalello, A.; Valenti, B.; Luciano, G.; Priolo, A.; Niderkorn, V. Effects of two tannin extracts at different doses in interaction with a green or dry forage substrate on in vitro rumen fermentation and biohydrogenation. Anim. Feed Sci. Technol. 2021, 278, 114977. [Google Scholar] [CrossRef]
- Zhang, S.; Knight, T.J.; Reecy, J.M.; Beitz, D.C. DNA polymorphisms in bovine fatty acid synthase are associated with beef fatty acid composition. Anim. Genet. 2008, 39, 62–70. [Google Scholar] [CrossRef]
- Ward, R.E.; Woodward, B.; Otter, N.; Doran, O. Relationship between the expression of key lipogenic enzymes, fatty acid composition, and intramuscular fat content of Limousin and Aberdeen Angus cattle. Livest. Sci. 2010, 127, 22–29. [Google Scholar] [CrossRef]
- Malau-Aduli, A.E.O.; Edriss, M.A.; Siebert, B.D.; Bottema, C.D.K.; Pitchford, W.S. Breed differences and genetic parameters for melting point, marbling score and fatty acid composition of lot-fed cattle. J. Anim. Physiol. Anim. Nutr. 2000, 83, 95–105. [Google Scholar] [CrossRef]
- Chiaia, H.L.J.; Peripoli, E.; Silva, R.M.O.; Aboujaoude, C.; Feitosa, F.L.B.; Lemos, M.V.A.; Berton, M.P.; Olivieri, B.F.; Espigolan, R.; Tonussi, R.L.; et al. Genomic prediction for beef fatty acid profile in Nellore cattle. Meat Sci. 2017, 128, 60–67. [Google Scholar] [CrossRef]
- Gardner, G.E.; Apps, R.; McColl, R.; Craigie, C.R. Objective measurement technologies for transforming the Australian and New Zealand livestock industries. Meat Sci. 2021, 179, 108556. [Google Scholar] [CrossRef] [PubMed]
- Onogi, A.; Ogino, A.; Komatsu, T.; Shoji, N.; Shimizu, K.; Kurogi, K.; Yasumori, T.; Togashi, K.; Iwata, H. Whole-genome prediction of fatty acid composition in meat of Japanese Black cattle. Anim. Genet. 2015, 46, 557–559. [Google Scholar] [CrossRef] [PubMed]
- Saatchi, M.; Garrick, D.J.; Tait, R.G.; Mayes, M.S.; Drewnoski, M.; Schoonmaker, J.; Diaz, C.; Beitz, D.C.; Reecy, J.M. Genome-wide association and prediction of direct genomic breeding values for composition of fatty acids in Angus beef cattle. BMC Genom. 2013, 14, 730. [Google Scholar] [CrossRef] [PubMed]
- Park, T.; Casella, G. The Bayesian lasso. J. Am. Stat. Assoc. 2008, 103, 681–686. [Google Scholar] [CrossRef]
- De Los Campos, G.; Naya, H.; Gianola, D.; Crossa, J.; Legarra, A.; Manfredi, E.; Weigel, K.; Cotes, J.M. Predicting quantitative traits with regression models for dense molecular markers and pedigree. Genet. 2009, 182, 375–385. [Google Scholar] [CrossRef]
- Meuwissen, T.H.; Hayes, B.J.; Goddard, M.E. Prediction of total genetic value using genome-wide dense marker map. Genetics 2001, 157, 1819–1829. [Google Scholar] [CrossRef]
- Feitosa, F.L.B.; Pereira, A.S.C.; Mueller, L.F.; de Souza Fonseca, P.A.; Braz, C.U.; Amorin, S.; Espigolan, R.; Lemos, M.A.; de Albuquerque, L.G.; Schenkel, F.S.; et al. Genome-wide association study for beef fatty acid profile using haplotypes in Nellore cattle. Livest. Sci. 2021, 245, 104396. [Google Scholar] [CrossRef]
- Donato, M.D.; Peters, S.O.; Mitchell, S.E.; Hussain, T.; Imumorin, I.G. Genotyping-by-sequencing (GBS): A novel, efficient, and cost-effective genotyping method for cattle using next-generation sequencing. PLoS ONE 2013, 8, e62137. [Google Scholar] [CrossRef]
- Li, X.; Ekerjung, M.; Lundstrom, K.; Lunden, A. Association of polymorphisms at DGAT1, leptin, SCD1, CAPN1 and CAST genes with color, marbling and water holding capacity in meat from beef cattle populations in Sweden. Meat Sci. 2013, 94, 153–158. [Google Scholar] [CrossRef]
- Hublina, J.S.Y.; Maloney, J.G.; George, N.S.; Molokin, A.; Lombard, J.E.; Urie, N.J.; Shivley, C.B.; Santin, M. Enhanced detection of Giardia duodenalis mixed assemblage infections in pre-weaned dairy calves using next generation sequencing. Vet. Parasitol. 2022, 304, 109702. [Google Scholar] [CrossRef]
- Wang, L.; Fang, H.; Shao, A.; Zhang, H.; Ye, J. Eyelid squamous cell carcinoma in the setting of epidermodysplasia verruciformis (EV) diagnosed by next-generation sequencing. Adv. Ophthalmol. Pract. Res. 2022, 100066. [Google Scholar] [CrossRef]
- Mwangi, F.W.; Pewan, S.B.; Otto, J.R.; Adegboye, O.A.; Charmley, E.; Gardiner, C.P.; Malau-Aduli, B.S.; Kinobe, R.T.; Malau-Aduli, A.E.O. Towards Sustainable Sources of Omega-3 Long-Chain Polyunsaturated Fatty Acids in Northern Australian Tropical Crossbred Beef Steers through Single Nucleotide Polymorphisms in Lipogenic Genes for Meat Eating Quality. Sustainability 2022, 14, 8409. [Google Scholar] [CrossRef]
- Yin, B.Z.; Fang, J.C.; Zhang, J.S.; Zhang, L.M.; Xu, C.; Xu, H.Y.; Shao, J.; Xia, G.J. Correlations between single nucleotide polymorphisms in FABP4 and meat quality and lipid metabolism gene expression in Yanbian yellow cattle. PLoS ONE 2020, 15, e0234328. [Google Scholar] [CrossRef]
- Hayakawa, K.; Sakamoto, T.; Ishii, A.; Yamaji, K.; Uemoto, Y.; Sasago, N.; Kobayashi, E.; Kobayashi, N.; Matsuhashi, T.; Maruyama, S.; et al. The g.841G>C SNP of FASN gene is associated with fatty acid composition in beef cattle. Anim. Sci. J. 2015, 86, 737–746. [Google Scholar] [CrossRef]
- Matsumoto, H.; Nogi, T.; Tabuchi, I.; Oyama, K.; Mannen, H.; Sasazaki, S. The SNPs in the promotor regions of the bovine FADS2 and FABP4 genes are associated with beef quality traits. Livest. Sci. 2014, 163, 34–40. [Google Scholar] [CrossRef]
- Ohsaki, H.; Sawa, T.; Sasazaki, S.; Kano, K.; Taniguchi, M.; Mukai, F.; Mannen, H. Stearoyl-CoA desaturase mRNA expression during bovine adipocyte differentiation in primary culture derived from Japanese Black and Holstein cattle. Comp. Biochem. Physiol. 2007, 148, 629–634. [Google Scholar] [CrossRef]
- Teixeira, P.D.; Oliveira, D.M.; Chizzotti, M.L.; Chalfun-Junior, A.; Coelho, T.C.; Gionbelli, M.P.; Paiva, L.V.; Carvalho, J.R.R.; Ladeira, M.M. Subspecies and diet affect the expression of genes involved in lipid metabolism and chemical composition of muscle in beef cattle. Meat Sci. 2017, 133, 110–118. [Google Scholar] [CrossRef]
- Ardicli, S.; Samli, H.; Alpay, F.; Dincel, D.; Soyudal, B.; Balci, F. Association of single nucleotide polymorphisms in the FABP4 gene with carcass characteristics and meat quality in Holstein bulls. Ann. Anim. Sci. 2017, 17, 117–130. [Google Scholar] [CrossRef]
- Lee, S.H.; van der Werf, J.H.J.; Lee, S.H.; Park, E.W.; Oh, S.J.; Gibson, J.P.; Thompson, J.M. Genetic polymorphisms of the bovine Fatty acid binding protein 4 gene are significantly associated with marbling and carcass weight in Hanwoo (Korean cattle). Anim. Genet. 2010, 41, 442–444. [Google Scholar] [CrossRef]
- Shin, S.C.; Heo, J.P.; Chung, E.R. Genetic variants of the FABP4 gene are associated with marbling scores and meat quality grades in Hanwoo (Korean cattle). Mol. Biol. Rep. 2012, 39, 5323–5330. [Google Scholar] [CrossRef]
- Rempel, L.A.; Casas, E.; Shackelford, S.D.; Wheeler, T.L. Relationship of polymorphisms within metabolic genes and carcass traits in crossbred beef cattle. J. Anim. Sci. 2012, 90, 1311–1316. [Google Scholar] [CrossRef]
- Matsuhashi, T.; Maruyama, S.; Uemoto, Y.; Kobayashi, N.; Mannen, H.; Abe, T.; Sakaguchi, S.; Kobayashi, E. Effect of bovine fatty acid synthase, stearoyl-coenzyme A desaturase, sterol regulatory element-binding protein 1, and growth hormone gene polymorphisms on fatty acid composition and carcass traits in Japanese Black cattle. J. Anim. Sci. 2011, 89, 12–22. [Google Scholar] [CrossRef]
- Wu, X.X.; Yang, Z.P.; Shi, X.K.; Li, J.Y.; Ji, D.J.; Mao, Y.J.; Chang, L.L.; Gao, H.J. Association of SCD1 and DGAT1 SNP with the intramuscular fat traits in Chinese Simmental cattle and their distribution in eight Chinese cattle breeds. Mol. Biol. Rep. 2012, 39, 1065–1071. [Google Scholar] [CrossRef]
- Avilés, C.; Polvillo, O.; Peña, F.; Juárez, M.; Martínez, A.L.; Molina, A. Associations between DGAT1, FABP4, LEP, RORC, and SCD1 gene polymorphisms and fat deposition in Spanish commercial beef. J. Anim. Sci. 2013, 91, 4571–4577. [Google Scholar] [CrossRef] [PubMed]
- Barendse, W.; Bunch, R.J.; Thomas, M.B.; Harrison, B.E. A splice site single nucleotide polymorphism of the fatty acid-binding protein 4 gene appears to be associated with intramuscular fat deposition in longissimus muscle in Australian cattle. Anim. Genet. 2009, 40, 770–773. [Google Scholar] [CrossRef] [PubMed]
- Malau-Aduli, A.E.O.; Siebert, B.D.; Bottema, C.D.K.; Pitchford, W.S. Breed comparison of the fatty acid composition of muscle phospholipids in Jersey and Limousin cattle. J. Anim. Sci. 1998, 76, 766–773. [Google Scholar] [CrossRef] [PubMed][Green Version]
- Malau-Aduli, A.E.O.; Holman, B.W.B.; Kashani, A.; Nichols, P.D. Sire breed and sex effects on the fatty acid composition and content of heart, kidney, liver, adipose and muscle tissues of purebred and first-cross prime lambs. Anim. Prod. Sci. 2016, 56, 2122–2132. [Google Scholar] [CrossRef]
- Pewan, S.B.; Otto, J.R.; Kinobe, R.T.; Adegboye, O.A.; Malau-Aduli, A.E.O. Nutritional enhancement of health beneficial omega-3 long-chain polyunsaturated fatty acids in the muscle, liver, kidney, and heart of Tattykeel Australian White MARGRA lambs fed pellets fortified with omega-3 oil in a feedlot system. Biology 2021, 10, 912. [Google Scholar] [CrossRef]
- Huerta-Leidenz, N.O.; Cross, H.R.; Savell, J.W.; Lunt, D.K.; Baker, J.F.; Smith, S.B. Fatty acid composition of subcutaneous adipose tissue from male calves at different stages of growth. J. Anim. Sci. 1996, 74, 1256–1264. [Google Scholar] [CrossRef]
- Gulliver, C.; Friend, M.; King, B.; Clayton, E. The role of omega-3 polyunsaturated fatty acids in reproduction of sheep and cattle. Anim. Reprod. Sci. 2012, 131, 9–22. [Google Scholar] [CrossRef]
- Schaeffer, L.R. Strategy for applying genome-wide selection in dairy cattle. J. Anim. Breed. Genet. 2006, 123, 218–223. [Google Scholar] [CrossRef]
- Taniguchi, M.; Utsugi, T.; Oyama, K.; Mannen, H.; Kobayashi, M.; Tanabe, Y.; Ogino, A.; Tsuji, S. Genotype of stearoyl-CoA desaturase is associated with fatty acid composition in Japanese black cattle. Mamm. Genome 2004, 14, 142–148. [Google Scholar] [CrossRef]
- Dujkova, R.; Ranganathan, Y.; Dufek, A.; Macak, J.; Bezdicek, J. Polymorphic effects of FABP4 and SCD genes on intramuscular fatty acid profiles in longissimus muscle from two cattle breeds. Acta Vet. Brno 2015, 84, 327–336. [Google Scholar] [CrossRef]
- Gotoh, T.; Nishimura, T.; Kuchida, K.; Mannen, H. The Japanese Wagyu beef industry: Current situation and future prospects-A review. Asian-Australas. J. Anim. Sci. 2018, 31, 933–950. [Google Scholar] [CrossRef]
- Kgwatalala, P.M.; Ibeagha-Awemu, E.M.; Mustafa, A.F.; Zhao, X. Influence of stearoyl-CoA desaturase (SCD) genotype and stage of lactation on desaturase indices and fatty acid composition of Canadian Jersey cows. J. Dairy Sci. 2009, 92, 1220–1228. [Google Scholar] [CrossRef]
- Macciotta, N.P.P.; Mele, M.; Conte, G.; Serra, A.; Cassandro, M.; Dal Zotto, R.; Cappio Borlino, A.; Pagnacco, G.; Secchiari, P. Association between a polymorphism at the stearoyl CoA desaturase locus and milk production traits in Italian Holsteins. J. Dairy Sci. 2008, 91, 3184–3189. [Google Scholar] [CrossRef]
- Ohsaki, H.; Tanaka, A.; Hoashi, S.; Sasazaki, S.; Oyama, K.; Taniguchi, M.; Mukai, F.; Mannen, H. Effect of SCD and SREBP genotypes on fatty acid composition in adipose tissue of Japanese Black cattle herds. Anim. Sci. J. 2009, 80, 225–232. [Google Scholar] [CrossRef]
- Jensen-Urstad, A.P.L.; Semenkovich, C.F. Fatty acid synthase and liver triglyceride metabolism: Housekeeper or messenger? Biochim. Biophys. Acta 2012, 1821, 747–753. [Google Scholar] [CrossRef]
- Abe, T.; Saburi, J.; Hasebe, H.; Nakagawa, T.; Misumi, S.; Nade, T.; Nakajima, H.; Shoji, N.; Kobayashi, M.; Kobayashi, E. Novel mutations of the FASN gene and their effect on fatty acid composition in Japanese Black beef. Biochem. Genet. 2009, 47, 397–411. [Google Scholar] [CrossRef]
- Barton, L.; Bures, D.; Kott, T.; Rehak, D. Associations of polymorphisms in bovine DGAT1, FABP4, FASN, and PPARGC1A genes with intramuscular fat content and the fatty acid composition of muscle and subcutaneous fat in Fleckvieh bulls. Meat Sci. 2016, 114, 18–23. [Google Scholar] [CrossRef]
- Mazzucco, J.P.; Goszczynski, D.E.; Ripoli, M.V.; Melucci, L.M.; Pardo, A.M.; Colatto, E.; Rogberg-Munoz, A.; Mezzadra, C.A.; Depetris, G.J.; Giovambattista, G.; et al. Growth, carcass and meat quality traits in beef from Angus, Hereford and cross-breed grazing steers, and their association with SNPs in genes related to fat deposition metabolism. Meat Sci. 2016, 114, 121–129. [Google Scholar] [CrossRef]
- Yokota, S.; Sugita, H.; Ardiyanti, A.; Shoji, N.; Nakajima, H.; Hosono, M.; Otomo, Y.; Suda, Y.; Katoh, K.; Suzuki, K. Contributions of FASN and SCD gene polymorphisms on fatty acid composition in muscle from Japanese Black cattle. Anim. Genet. 2012, 43, 790–792. [Google Scholar] [CrossRef]
- Li, C.; Aldai, N.; Vinsky, M.; Dugan, M.E.R.; McAllister, T.A. Association analyses of single nucleotide polymorphisms in bovine stearoyl-CoA desaturase and fatty acid synthase genes with fatty acid composition in commercial cross-bred beef steers. Anim. Genet. 2012, 43, 93–97. [Google Scholar] [CrossRef]
- Michal, J.J.; Zhang, Z.W.; Gaskins, C.T.; Jiang, Z. The bovine fatty acid binding protein 4 gene is significantly associated with marbling and subcutaneous fat depth in Wagyu limousine F2 crosses. Anim. Genet. 2006, 37, 400–402. [Google Scholar] [CrossRef]
- Cho, S.; Park, T.S.; Yoon, D.H.; Cheong, H.S.; Namgoong, S.; Park, B.L.; Lee, H.W.; Han, C.S.; Kim, E.M.; Cheong, I.C.; et al. Identification of genetic polymorphisms in FABP3 and FABP4 and putative association with back fat thickness in Korean native cattle. BMB Rep. 2008, 41, 29–34. [Google Scholar] [CrossRef]
- Kulig, H.; Kowalewska-Luczak, I.; Kmiec, M.; Wojdak-Maksymiec, K. ANXA9, SLC27A3, FABP3 and FABP4 single nucleotide polymorphisms in relation to milk production traits in Jersey cows. Czech J. Anim. Sci. 2010, 55, 463–467. [Google Scholar] [CrossRef]
- Hoashi, S.; Hinenoya, T.; Tanaka, A.; Ohsaki, H.; Sasazaki, S.; Taniguchi, M.; Oyama, K.; Mukai, F.; Mannen, H. Association between fatty acid composition and genotypes of FABP4 and LXR-alpha in Japanese Black cattle. BMC Genet. 2008, 9, 84. [Google Scholar] [CrossRef]
- Narukami, T.; Sasazaki, S.; Oyama, K.; Nogi, T.; Taniguchi, M.; Mannen, H. Effect of DNA polymorphisms related to fatty acid composition in adipose tissue of Holstein cattle. Anim. Sci. J. 2011, 82, 406–411. [Google Scholar] [CrossRef]


| Gene Symbol | Primer | Primer Sequence | Length | Ta (°C) | Amplification Loci |
|---|---|---|---|---|---|
| SCD1 | Forward | GGAAGAAGACATCCGCCCTGAAAT | 24 | 60 | Exons: 2–6 Introns: 2–4 |
| Reverse | TCCAGGCGCCAAATAGAGTCTCTA | 24 | 60 | ||
| SCD2 | Forward | AGAGTGGTGGTCATGCACAAACTT | 24 | 60 | |
| Reverse | CATACAGTGCCAATCTCGCTTCCT | 24 | 60 | ||
| SCD3 | Forward | AGAGTGGTGGTCATGCACAAACTT | 24 | 60 | |
| Reverse | ACCAAATAGATCCCCTCAGAGGCA | 24 | 60 | ||
| SCD4 | Forward | ATGAGCCACACTGTGAACAAACCT | 24 | 60 | |
| Reverse | AGGCTTGCCTGTCCAGAAAAAGAA | 24 | 60 | ||
| FASN1 | Forward | TTGAGCTTCTGAGTATGATGGGAG | 24 | 68 | Exons: 9–42 Introns: 8–41 |
| Reverse | GTTGAGGGAGGCATAATAGATGGT | 24 | 68 | ||
| FASN2 | Forward | CTATAAGATCGGTGAGTCCTTGCA | 24 | 68 | |
| Reverse | GCCAGGGAGCTGTGAATAATACTA | 24 | 68 | ||
| FABP41 | Forward | GCTAAGACTGCCTGTATGTTCCCC | 24 | 60 | Exons: 2 and 3 Introns: 1 and 2 |
| Reverse | GGGCGATTGTCTATTTCTCTAGGT | 24 | 60 |
| SNP Locus, Cattle Breeds, Reference Genotype, and Location (Major Allele Frequencies in Brackets) | |||||
|---|---|---|---|---|---|
| SNP Locus | Wagyu | Angus | Hereford | Genotype | Location |
| g.21267406 T>C | CT (0.55) | T (0.68) | T (0.61) | TT | Intron 2 |
| g.21267451 C>A | AC (0.57) | C (0.73) | CC (0.73) | CC | Intron 2 |
| g.21267897 C>T | TC (0.56) | C (0.68) | C (0.73) | CC | Intron 2 |
| g.21268157 G>A | G (0.86) | AG (0.55) | A (0.59) | GG | Intron 2 |
| g.21269020 A>G | G (0.74) | A (0.75) | A (0.68) | AA | Intron 3 |
| g.21269495 G>C | C (0.55) | G (0.75) | G (0.80) | GG | Intron 3 |
| g.21270740 A>G | G (0.69) | A (0.87) | A (0.89) | AA | Intron 4 |
| g.21271264 C>A | A (0.59) | C (0.95) | C (0.95) | CC | Intron 4 |
| g.21271726 C>G | G (0.54) | C (0.97) | C (0.95) | CC | Intron 4 |
| g.21272247 A>G | A (0.59) | A (0.95) | A (0.93) | AA | Exon 5 |
| g.21272423 C>T | C (0.58) | C (0.93) | C (0.93) | CC | Exon 5 |
| g.21275852 C>A | A (0.53) | C (0.93) | C (0.95) | CC | Exon 5 |
| SNP Locus, Cattle Breeds, Reference Genotype, and Location (Major Allele Frequencies in Brackets) | |||||
|---|---|---|---|---|---|
| SNP Locus | Wagyu | Angus | Hereford | Genotype | Location |
| g.50782356 G>C | C (0.70) | G (1.00) | G (0.95) | GG | Intron 8 |
| g.50782383 C>T | T (0.92) | C (1.00) | C (0.95) | CC | Intron 8 |
| g.50783156 C>T | T (0.92) | C (1.00) | C (0.93) | CC | Exon 10 |
| g.50783867 C>A | A (0.94) | AC (0.52) | C (0.73) | CC | Intron 11 |
| g.50786015 C>T | T (0.93) | C (1.00) | C (0.89) | CC | Intron 18 |
| g.50786726 G>A | A (0.93) | G (1.00) | G (0.91) | GG | Exon 21 |
| g.50786858 G>A | A (0.93) | G (1.00) | G (0.93) | GG | Exon 21 |
| g.50787010 A>G | G (1.00) | GA (0.59) | GA (0.66) | AA | Intron 21 |
| g.50787092 G>A | A (0.82) | G (1.00) | G (0.89) | GG | Intron 21 |
| g.50787138 A>G | G (0.94) | GA (0.62) | A (0.68) | AA | Intron 21 |
| g.50788320 C>T | C (0.76) | TC (0.53) | C (0.77) | CC | Exon 23 |
| g.50788576 T>C | T (0.72) | CT (0.60) | T (0.77) | TT | Exon 24 |
| g.50789409 T>C | C (1.00) | CT (0.52) | CT (0.67) | TT | Exon 27 |
| g.50789883 T>C | C (1.00) | CT (0.50) | CT (0.65) | TT | Intron 28 |
| g.50791465 G>A | A (0.77) | G (1.00) | G (0.95) | GG | Exon 34 |
| g.50792348 C>T | T (1.00) | TC (0.50) | TC (0.70) | CC | Exon 37 |
| g.50793358 A>G | G (1.00) | GA (0.50) | GA (0.70) | AA | Exon 39 |
| g.50794100 T>C | C (1.00) | CT (0.52) | CT (0.69) | TT | Exon 42 |
| SNP Locus, Cattle Breeds, Reference Genotype, and Location (Major Allele Frequencies in Brackets) | |||||
|---|---|---|---|---|---|
| SNP Locus | Wagyu | Angus | Hereford | Genotype | Location |
| g.44680268 C>G | G (0.56) | GC (0.50) | C (0.60) | CC | Exon 3 |
| g.44679548 T>C | C (0.55) | C (0.55) | T (0.55) | TT | Exon 2 |
| g.44679393 G>C | C (0.51) | C (0.54) | G (0.68) | GG | Intron 1 |
| g.44678794 G>A | A (0.98) | A (0.76) | A (0.69) | GG | Intron 1 |
| g.44677674 A>G | G (0.59) | A (0.54) | A (0.58) | AA | Intron 1 |
| Variable | SNP g.21267406 T>C | ||||
|---|---|---|---|---|---|
| Overall | TT | CT | CC | p-Value | |
| IMF (%) | 6.29 (4.98–12) | 11.46 (5.91–12.63) | 6 (4.76–8.16) | 6.14 (4.62–10.78) | 0.0744 |
| FMP (°C) | 35.38 (32.22–47.5) | 36 (34.5–48) | 34.75 (31.75–46.12) | 34.5 (30–38.25) | 0.2105 |
| Oleic acid-18:1n-9 | 384.17 (198.1–946.84) | 249.25 (166.24–560.71) | 453.9 (221.45–1102.78) | 436.75 (227.41–947.61) | 0.0614 |
| LA-18:2n-6 | 58.26 (43.06–75.75) | 52.61 (37.82–66.65) | 59.85 (48.61–77.17) | 68.07 (51.13–76.98) | 0.0334 |
| ALA-18:3n-3 | 15.08 (11.43–23.98) | 12.54 (7.92–15.76) | 19.44 (12.7–26.92) | 15.91 (11.43–23.66) | 0.0025 |
| EPA-20:5n-3 | 9.29 (5.53–11.97) | 8.65 (3.43–11.47) | 10.18 (7.95–12.06) | 9.21 (5.49–13.79) | 0.0466 |
| DHA-22:6n-3 | 1.32 (0.78–1.84) | 1.15 (0.53–1.45) | 1.56 (1.02–1.96) | 1.36 (0.75–1.98) | 0.0087 |
| DPA-22:5n-3 | 12.74 (7.62–16.23) | 11.68 (5.4–14.16) | 14.19 (11.62–17.38) | 12.11 (8.05–18.93) | 0.0119 |
| EPA+DHA | 10.65 (6.37–13.77) | 9.74 (3.9–12.83) | 11.89 (8.98–14.1) | 10.7 (6.35–16.06) | 0.0322 |
| EPA+DHA+DPA | 23.7 (14.8–30.34) | 21.8 (8.98–25.77) | 26.41 (20.36–32.53) | 23.03 (14.68–35.46) | 0.0121 |
| ALA+EPA+DHA+DPA | 38.17 (25.71–57.11) | 34.91 (17.16–42.58) | 49.05 (36.28–60.57) | 40.84 (25.6–63.3) | 0.0016 |
| Variable | SNP g.21271264 C>A | ||||
|---|---|---|---|---|---|
| Overall | AA | AC | CC | p-Value | |
| IMF (%) | 6.66 (4.98–12) | 7.66 (4.37–12.62) | 6.66 (4.61–8.16) | 6.66 (5.48–12.12) | 0.3425 |
| FMP (°C) | 35.66 (32.22–47.5) | 32.66 (29.69–35.12) | 32.66 (29.5–36.5) | 39.66 (35–49.62) | 0.0001 |
| Oleic acid-18:1n-9 | 384.66 (198.1–946.84) | 649.66 (264.47–1013.27) | 702.66 (342.28–1215.38) | 273.66 (162.07–694.26) | 0.0156 |
| LA-18:2n-6 | 58.66 (43.06–75.75) | 68.66 (53.96–76.2) | 58.66 (48.27–75.88) | 57.66 (39.19–75.69) | 0.1852 |
| ALA-18:3n-3 | 15.66 (11.43–23.98) | 21.66 (15.17–26.38) | 21.66 (12.23–27) | 13.66 (10.37–16.81) | 0.0028 |
| EPA-20:5n-3 | 9.66 (5.53–11.97) | 11.66 (6.84–13.9) | 11.66 (5.78–13.92) | 8.66 (6.29–10.59) | 0.0223 |
| DHA-22:6n-3 | 1.66 (0.78–1.84) | 1.66 (0.79–2.21) | 1.66 (0.89– 2.24) | 1.66 (0.7–1.54) | 0.0089 |
| DPA-22:5n-3 | 12.66 (7.62–16.23) | 15.66 (8.68–18.18) | 16.66 (8.85–21.25) | 12.66 (7.3–14.15) | 0.0032 |
| EPA + DHA | 10.66 (6.37–13.77) | 13.66 (8.23–16.15) | 13.66 (6.72–16.16) | 9.66 (7.27–12.21) | 0.0152 |
| EPA + DHA + DPA | 23.66 (14.8–30.34) | 29.66 (17.02–33.66) | 29.66 (16.21–36.8) | 21.66 (14.57–26.41) | 0.0032 |
| ALA + EPA + DHA + DPA | 38.66 (25.71–57.11) | 51.66 (33.07–63.46) | 53.66 (28.39–67.69) | 35.66 (25.45–42.79) | 0.0039 |
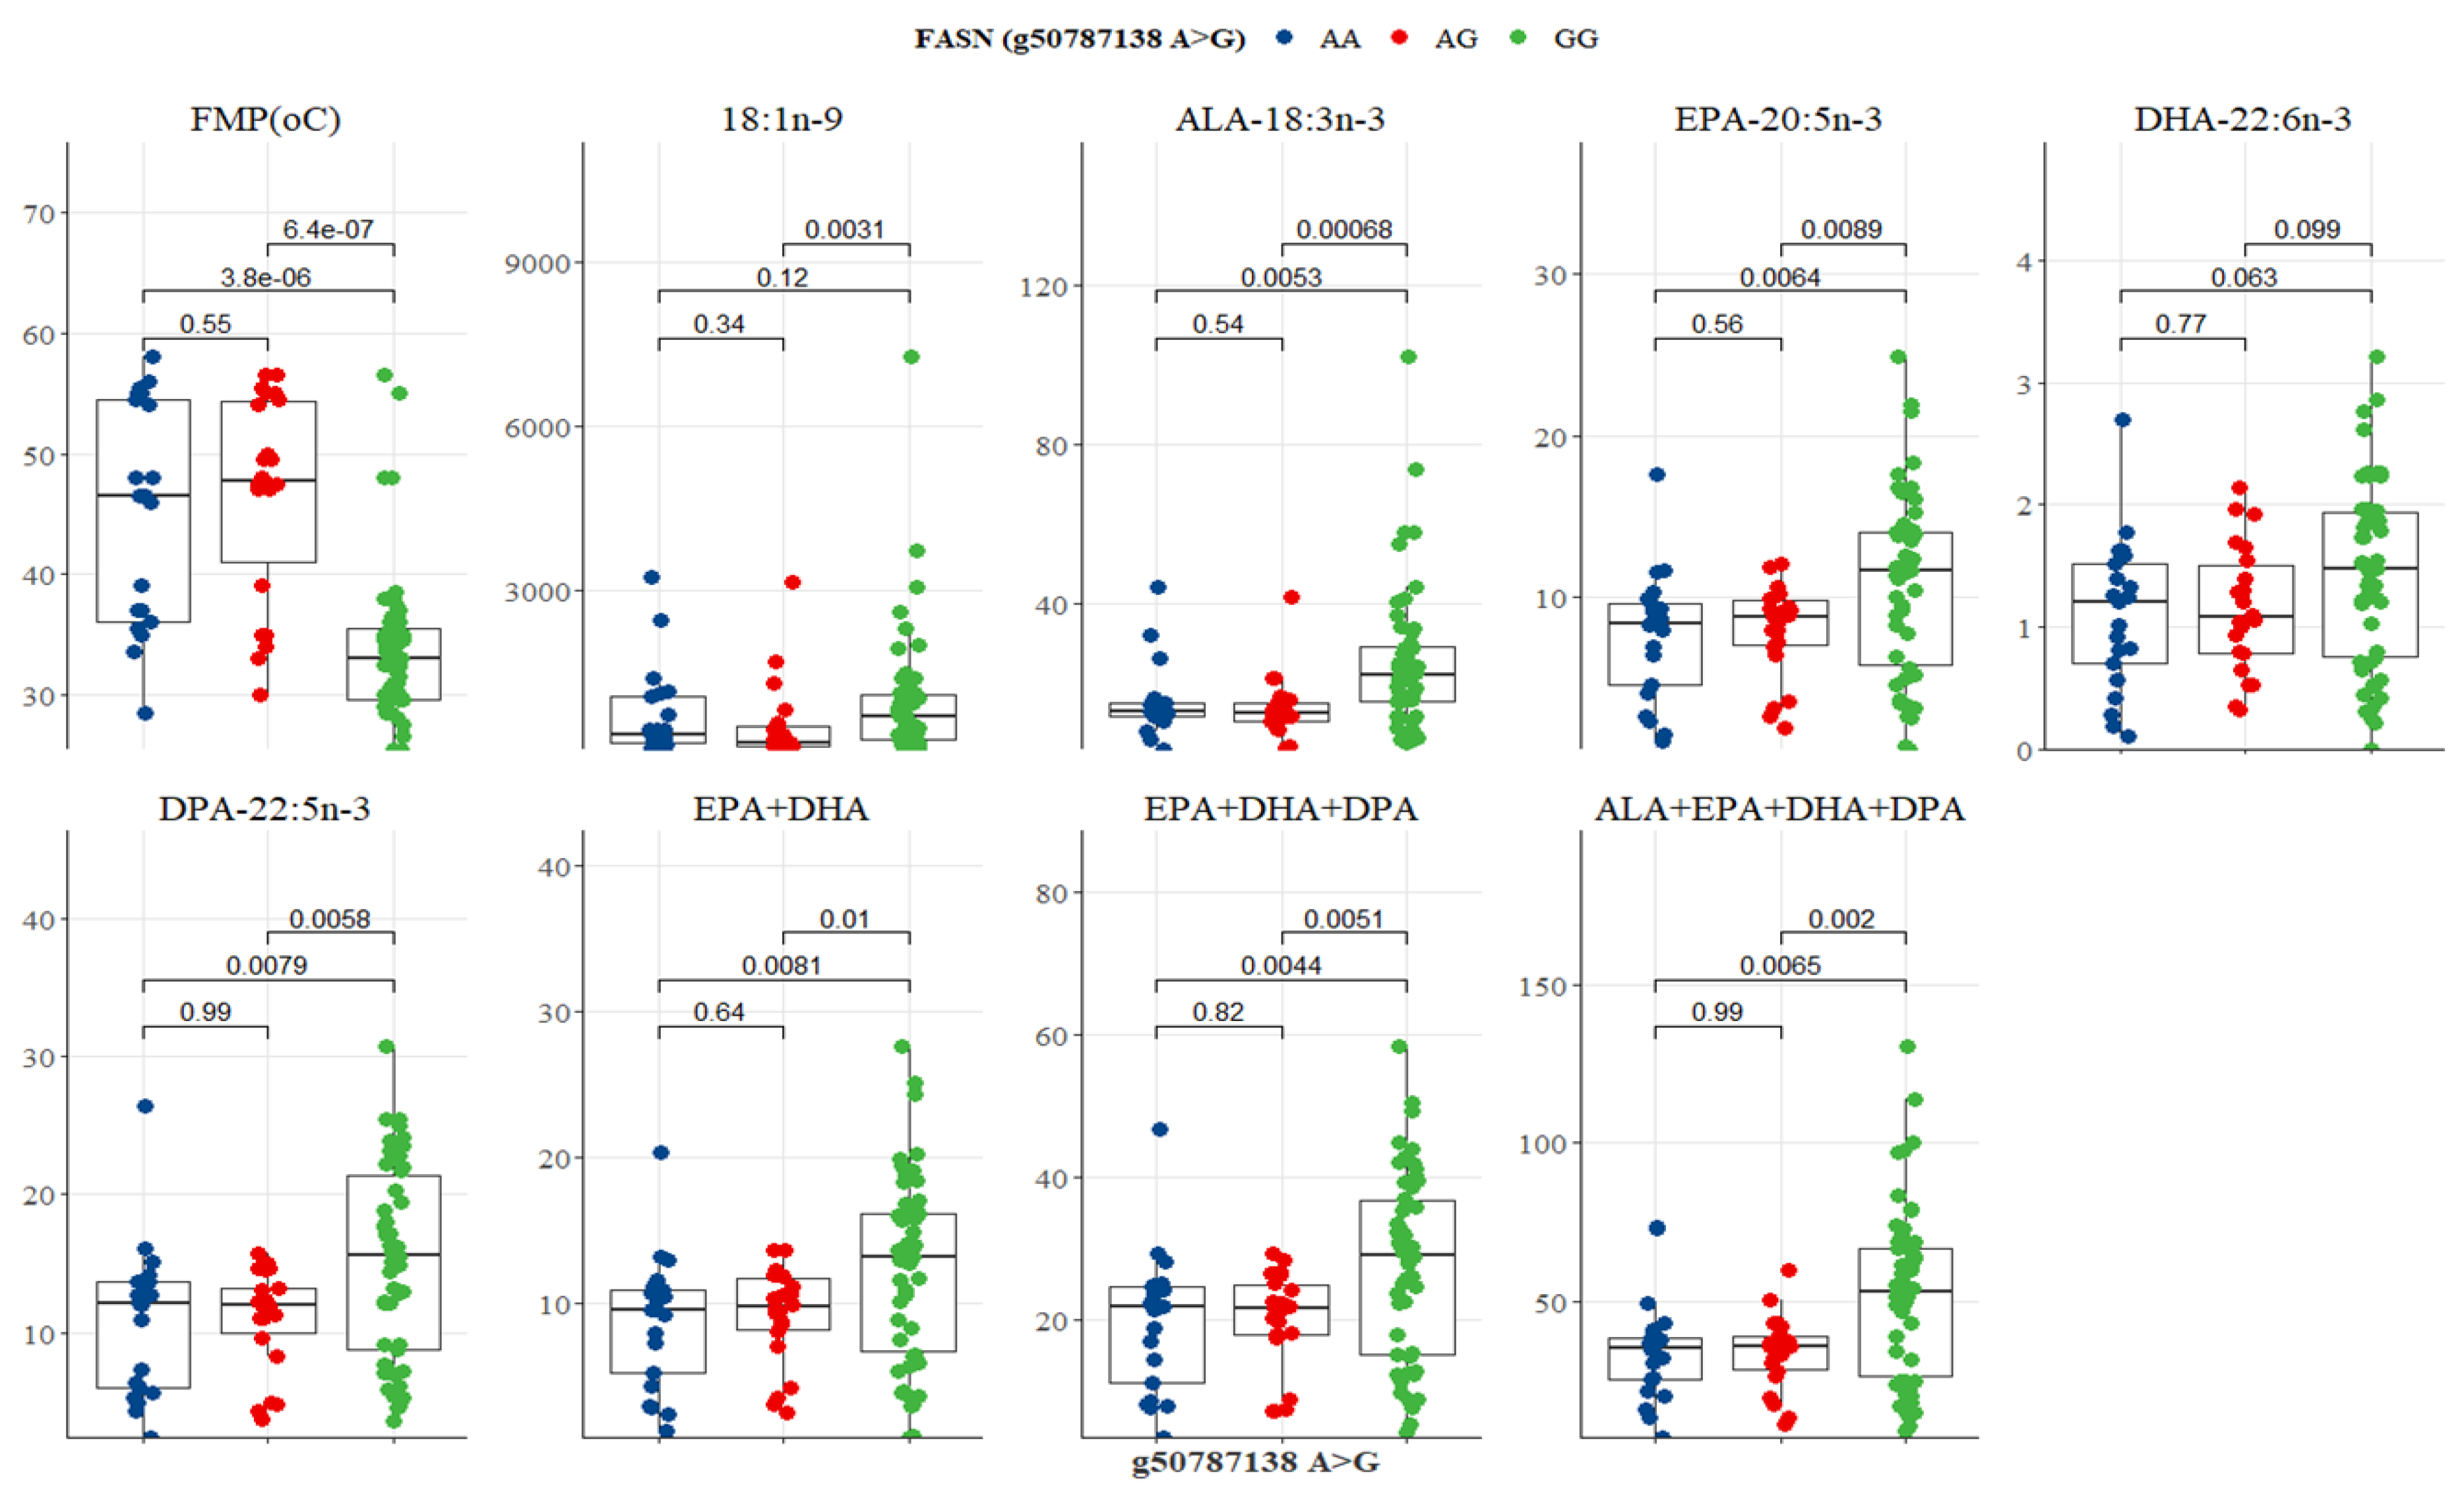
| Variable | SNP g. 50787138 A>G | ||||
|---|---|---|---|---|---|
| Overall | AA | AG | GG | p-Value | |
| IMF (%) | 6.29 (2.98–12) | 5.96 (2.02–11.62) | 5.96 (2.67–11.65) | 7.17 (2.03–12.27) | 0.9507 |
| FMP (°C) | 35.38 (2.22–47.5) | 46.5 (2.36–54.5) | 47.75 (2.41–54.38) | 33 (2.5–35.38) | 0.0001 |
| Oleic acid-18:1n-9c | 384.17 (2.1–946.84) | 301.52 (2.36–891.68) | 221.67 (2.5–485.2) | 514.21 (2.92–1058.96) | 0.02118 |
| LA-18:2n-6 | 58.26 (2.06–75.75) | 57.7 (2.86–75.84) | 50.91 (2.88–71.44) | 60.52 (2.73–75.81) | 0.2839 |
| ALA-18:3n-3 | 15.08 (2.43–23.98) | 13.43 (2.7–14.51) | 12.32 (2.36–14.65) | 21.45 (2.24–28.49) | 0.0004 |
| EPA-20:5n-3 | 9.29 (2.53–11.97) | 8.36 (2.52–9.77) | 8.78 (2.12–9.7) | 11.54 (2.46–13.83) | 0.0083 |
| DHA-22:6n-3 | 1.32 (2.78–1.84) | 1.24 (2.76–1.54) | 1.05 (2.79–1.46) | 1.48 (2.81–1.99) | 0.0396 |
| DPA-22:5n-3 | 12.74 (2.62–16.23) | 12.1 (2.22–13.54) | 11.84 (2.44–13.14) | 15.08 (2.96–18.81) | 0.0072 |
| EPA+DHA | 10.65 (2.37–13.77) | 9.54 (2.21–11.0) | 9.58 (2.18–11.45) | 13.1 (2.33–15.97) | 0.0071 |
| EPA+DHA+DPA | 23.7 (2.8–30.34) | 21.83 (2.88–24.86) | 21.62 (2.84–24.78) | 28.75 (2.02–35.46) | 0.0039 |
| ALA+EPA+DHA+DPA | 38.17 (2.71–57.11) | 35.4 (2.69–39.48) | 35.79 (2.57–38.36) | 51.98 (2.49–63.46) | 0.0016 |
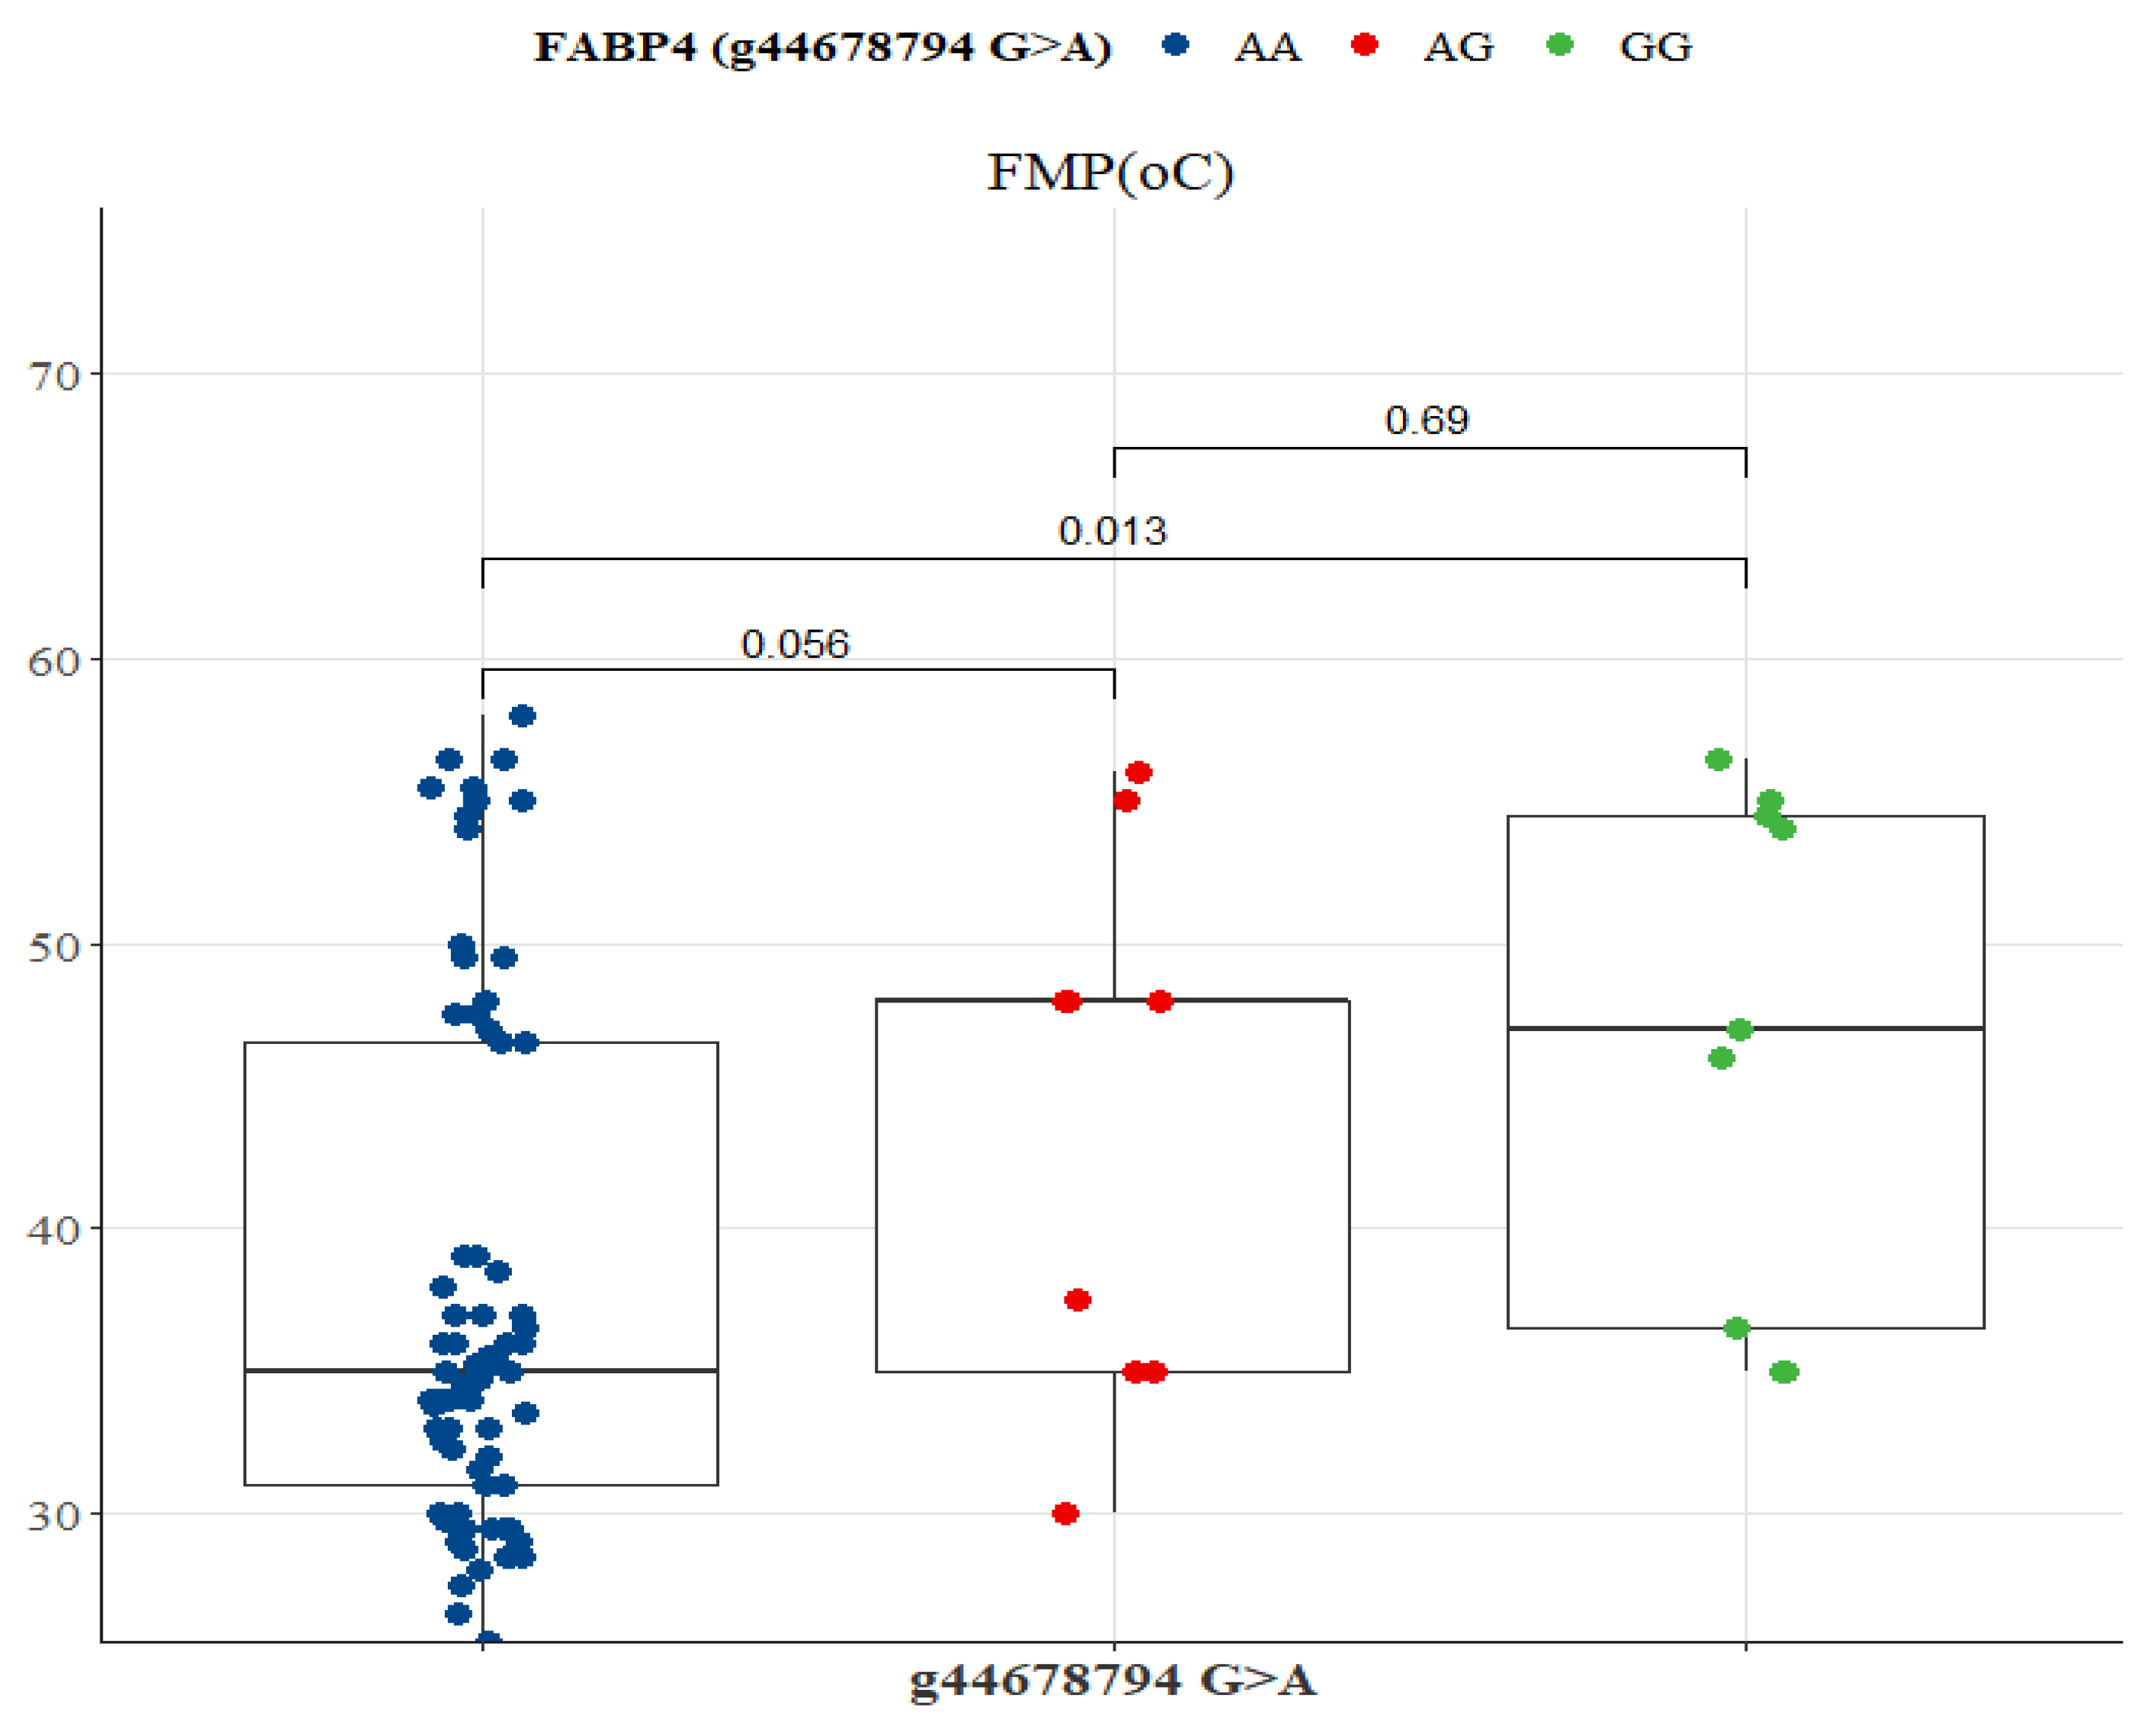
| Variable | SNP g.44678794 G>A | ||||
|---|---|---|---|---|---|
| Overall | AA | AG | GG | p-Value | |
| IMF (%) | 6.25 (4.98–12) | 6.75 (4.79–11.95) | 5.95 (5.52–10.05) | 5.95 (4.05–6.85) | 0.4059 |
| FMP (°C) | 35.5 (32.22–47.5) | 35 (31–46.5) | 45 (35–48) | 45 (36.5–54.5) | 0.0111 |
| Oleic acid-18:1n-9c | 384.5 (198.1–946.84) | 415.5 (212.81–939.11) | 235.5 (124.18–612.33) | 271.5 (198.92–415.96) | 0.2612 |
| LA-18:2n-6 | 58.5 (43.06–75.75) | 58.5 (39.12–76.3) | 56.5 (51.28–69.1) | 61.5 (57.09–75.34) | 0.7161 |
| ALA-18:3n-3 | 15.5 (11.43–23.98) | 15.5 (11.46–24.21) | 14.5 (11.81–14.94) | 15 (11.97–19.62) | 0.7559 |
| EPA-20:5n-3 | 9.25 (5.53–11.97) | 9.45 (5.42–12.34) | 8.55 (7.95–11.04) | 9.25 (8.11–11.24) | 0.9722 |
| DHA-22:6n-3 | 1.35 (0.78–1.84) | 1.45 (0.75–1.96) | 1.25 (1.08–1.32) | 1.15 (0.98–1.48) | 0.5943 |
| DPA-22:5n-3 | 12.5 (7.62–16.23) | 12.5 (7.27–17.02) | 12.5 (11.3–14.85) | 12.5 (11.02–13.16) | 0.7451 |
| EPA+DHA | 10.5 (6.37–13.77) | 11.5 (6.21–14.13) | 9.85 (8.87–12.43) | 10.5 (9.36–12.19) | 0.9100 |
| EPA+DHA+DPA | 23.5 (14.8–30.34) | 24.5 (13.49–30.98) | 22.5 (20.41–27.3) | 21.5 (19.55–25.42) | 0.7784 |
| ALA+EPA+DHA+DPA | 38.5 (25.71–57.11) | 41.5 (25.46–59.66) | 36.5 (32.36–41.51) | 37.5 (32.86–46.99) | 0.7167 |
Publisher’s Note: MDPI stays neutral with regard to jurisdictional claims in published maps and institutional affiliations. |
© 2022 by the authors. Licensee MDPI, Basel, Switzerland. This article is an open access article distributed under the terms and conditions of the Creative Commons Attribution (CC BY) license (https://creativecommons.org/licenses/by/4.0/).
Share and Cite
Otto, J.R.; Mwangi, F.W.; Pewan, S.B.; Adegboye, O.A.; Malau-Aduli, A.E.O. Lipogenic Gene Single Nucleotide Polymorphic DNA Markers Associated with Intramuscular Fat, Fat Melting Point, and Health-Beneficial Omega-3 Long-Chain Polyunsaturated Fatty Acids in Australian Pasture-Based Bowen Genetics Forest Pastoral Angus, Hereford, and Wagyu Beef Cattle. Genes 2022, 13, 1411. https://doi.org/10.3390/genes13081411
Otto JR, Mwangi FW, Pewan SB, Adegboye OA, Malau-Aduli AEO. Lipogenic Gene Single Nucleotide Polymorphic DNA Markers Associated with Intramuscular Fat, Fat Melting Point, and Health-Beneficial Omega-3 Long-Chain Polyunsaturated Fatty Acids in Australian Pasture-Based Bowen Genetics Forest Pastoral Angus, Hereford, and Wagyu Beef Cattle. Genes. 2022; 13(8):1411. https://doi.org/10.3390/genes13081411
Chicago/Turabian StyleOtto, John R., Felista W. Mwangi, Shedrach B. Pewan, Oyelola A. Adegboye, and Aduli E. O. Malau-Aduli. 2022. "Lipogenic Gene Single Nucleotide Polymorphic DNA Markers Associated with Intramuscular Fat, Fat Melting Point, and Health-Beneficial Omega-3 Long-Chain Polyunsaturated Fatty Acids in Australian Pasture-Based Bowen Genetics Forest Pastoral Angus, Hereford, and Wagyu Beef Cattle" Genes 13, no. 8: 1411. https://doi.org/10.3390/genes13081411
APA StyleOtto, J. R., Mwangi, F. W., Pewan, S. B., Adegboye, O. A., & Malau-Aduli, A. E. O. (2022). Lipogenic Gene Single Nucleotide Polymorphic DNA Markers Associated with Intramuscular Fat, Fat Melting Point, and Health-Beneficial Omega-3 Long-Chain Polyunsaturated Fatty Acids in Australian Pasture-Based Bowen Genetics Forest Pastoral Angus, Hereford, and Wagyu Beef Cattle. Genes, 13(8), 1411. https://doi.org/10.3390/genes13081411