
Determining Genetic Diversity and Population Structure of Common Bean (Phaseolus vulgaris L.) Landraces from Türkiye Using SSR Markers


 , , , and
Abstract
:1. Introduction
2. Materials and Methods
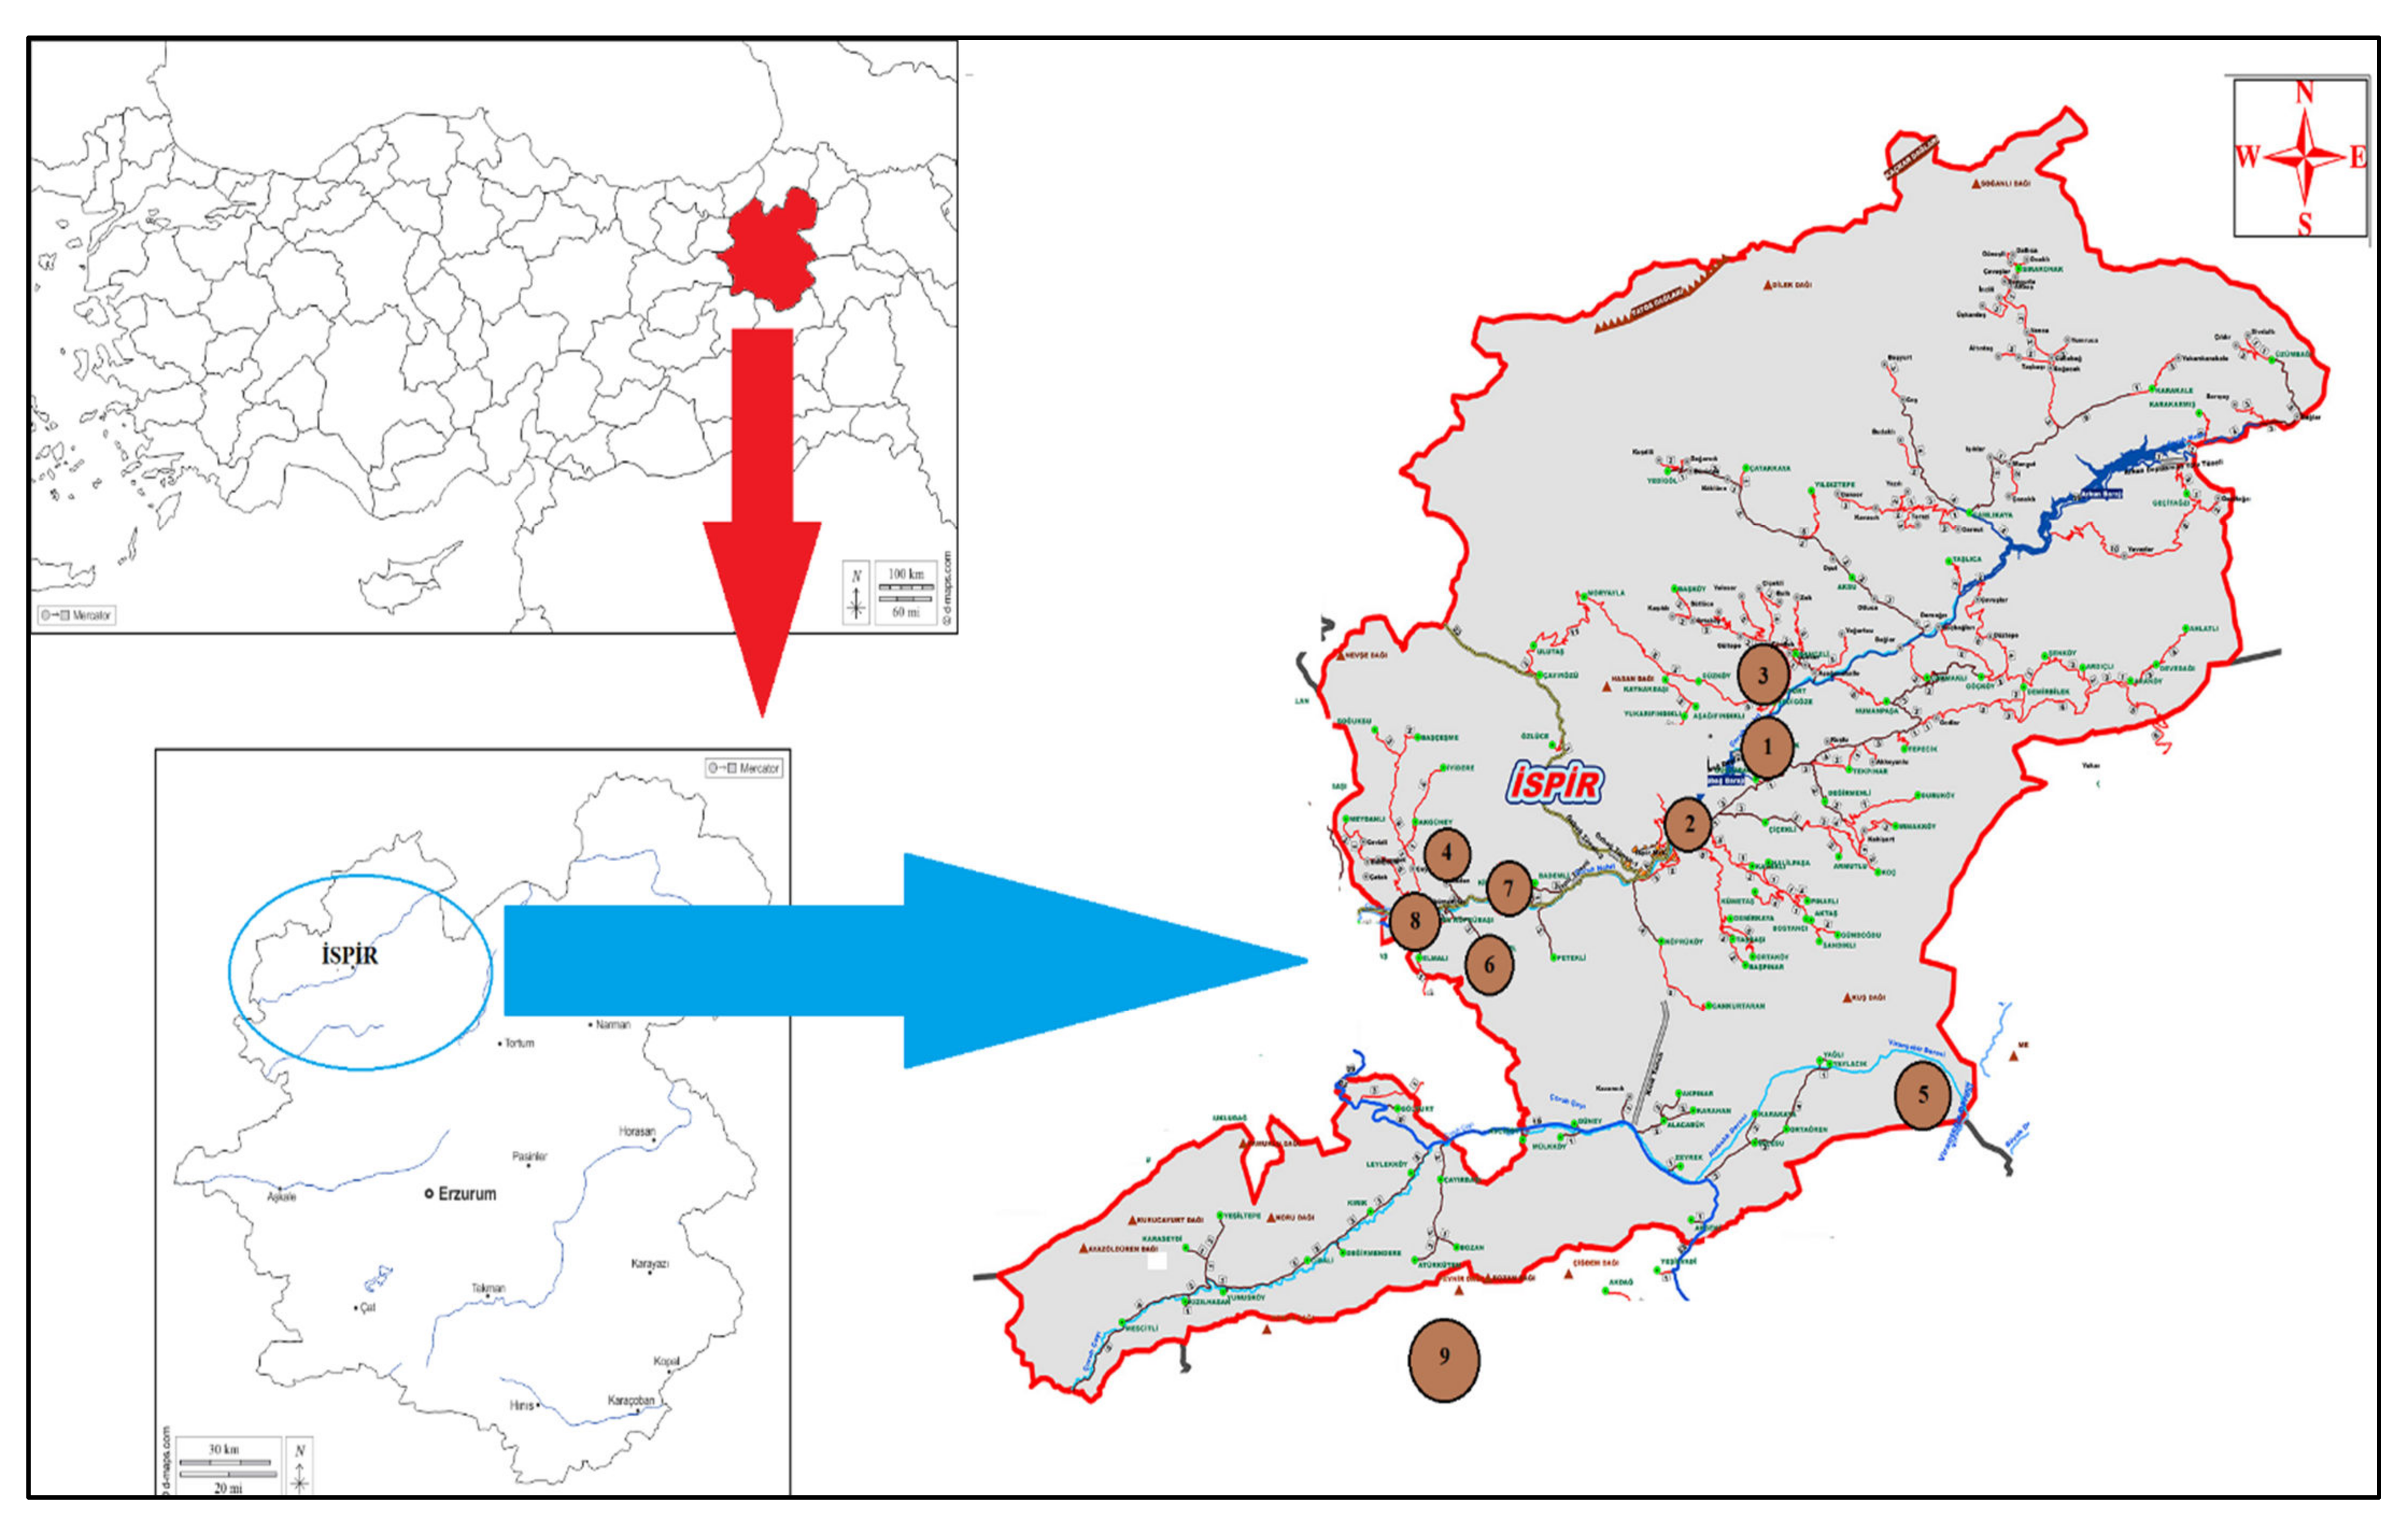
2.1. Plant Material
2.2. DNA Extraction
2.3. SSR Analysis
2.4. Molecular Data Analysis
3. Results and Discussion
3.1. SSR Marker Information
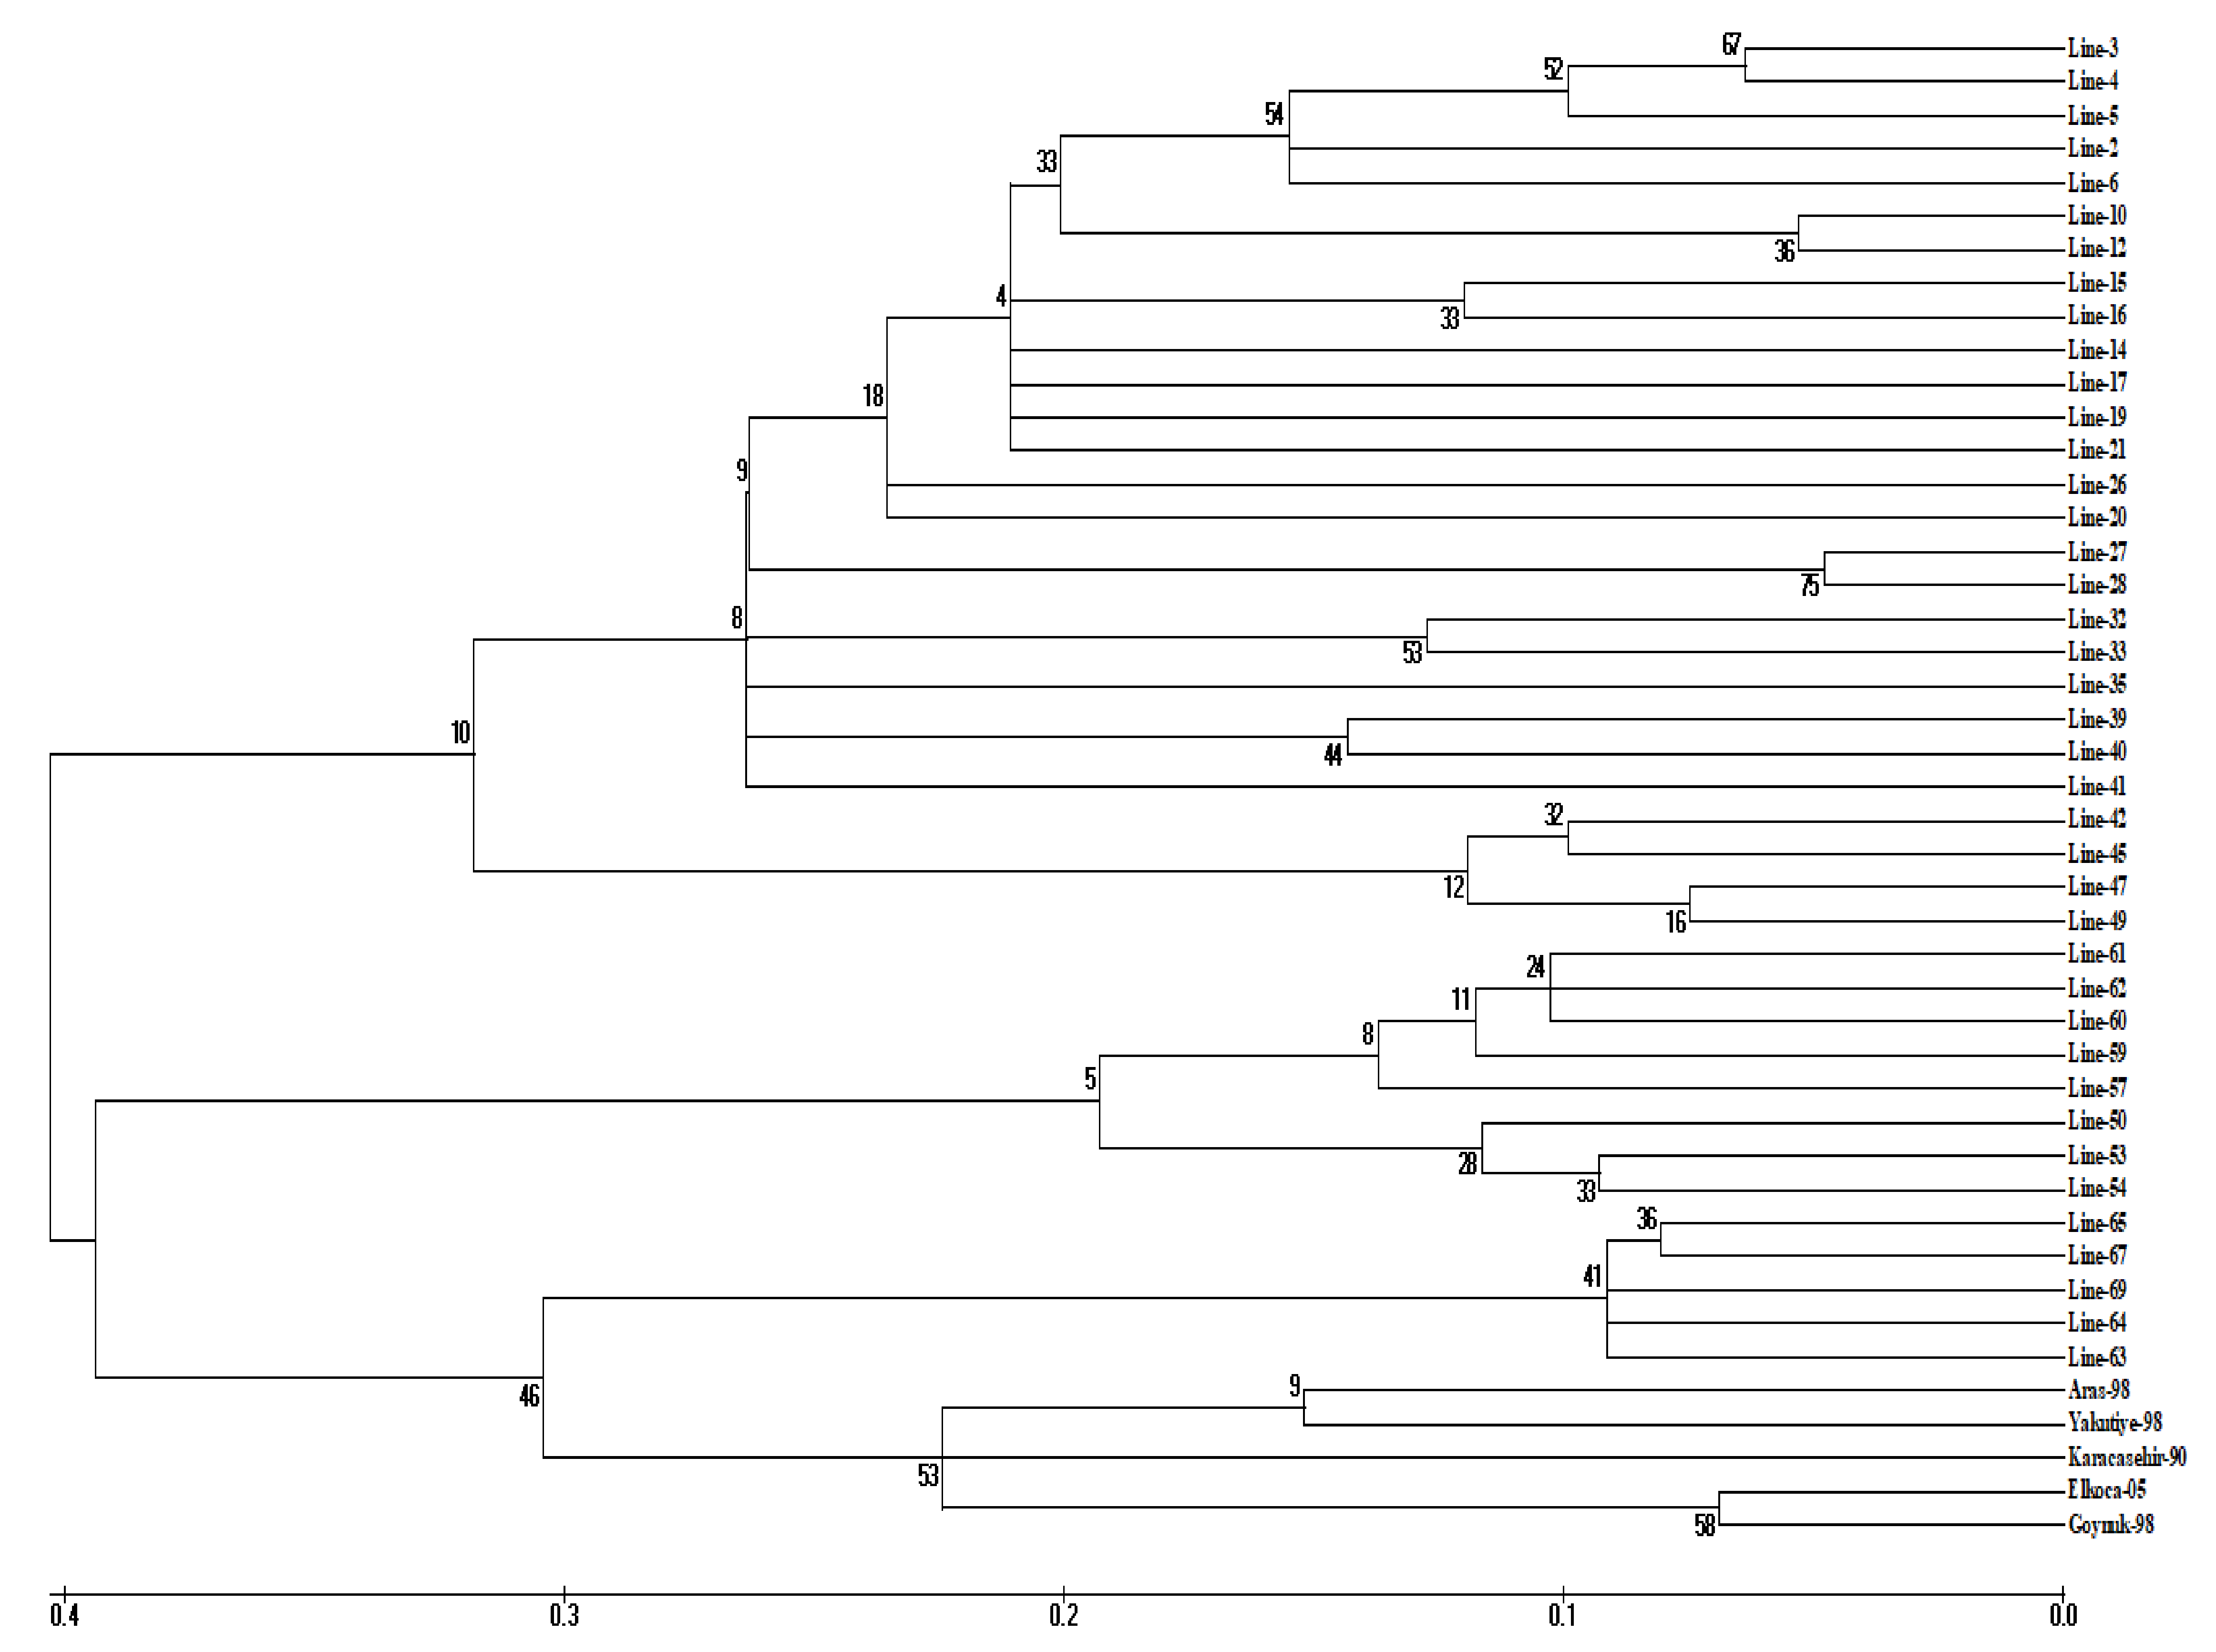
3.2. Cluster Analysis
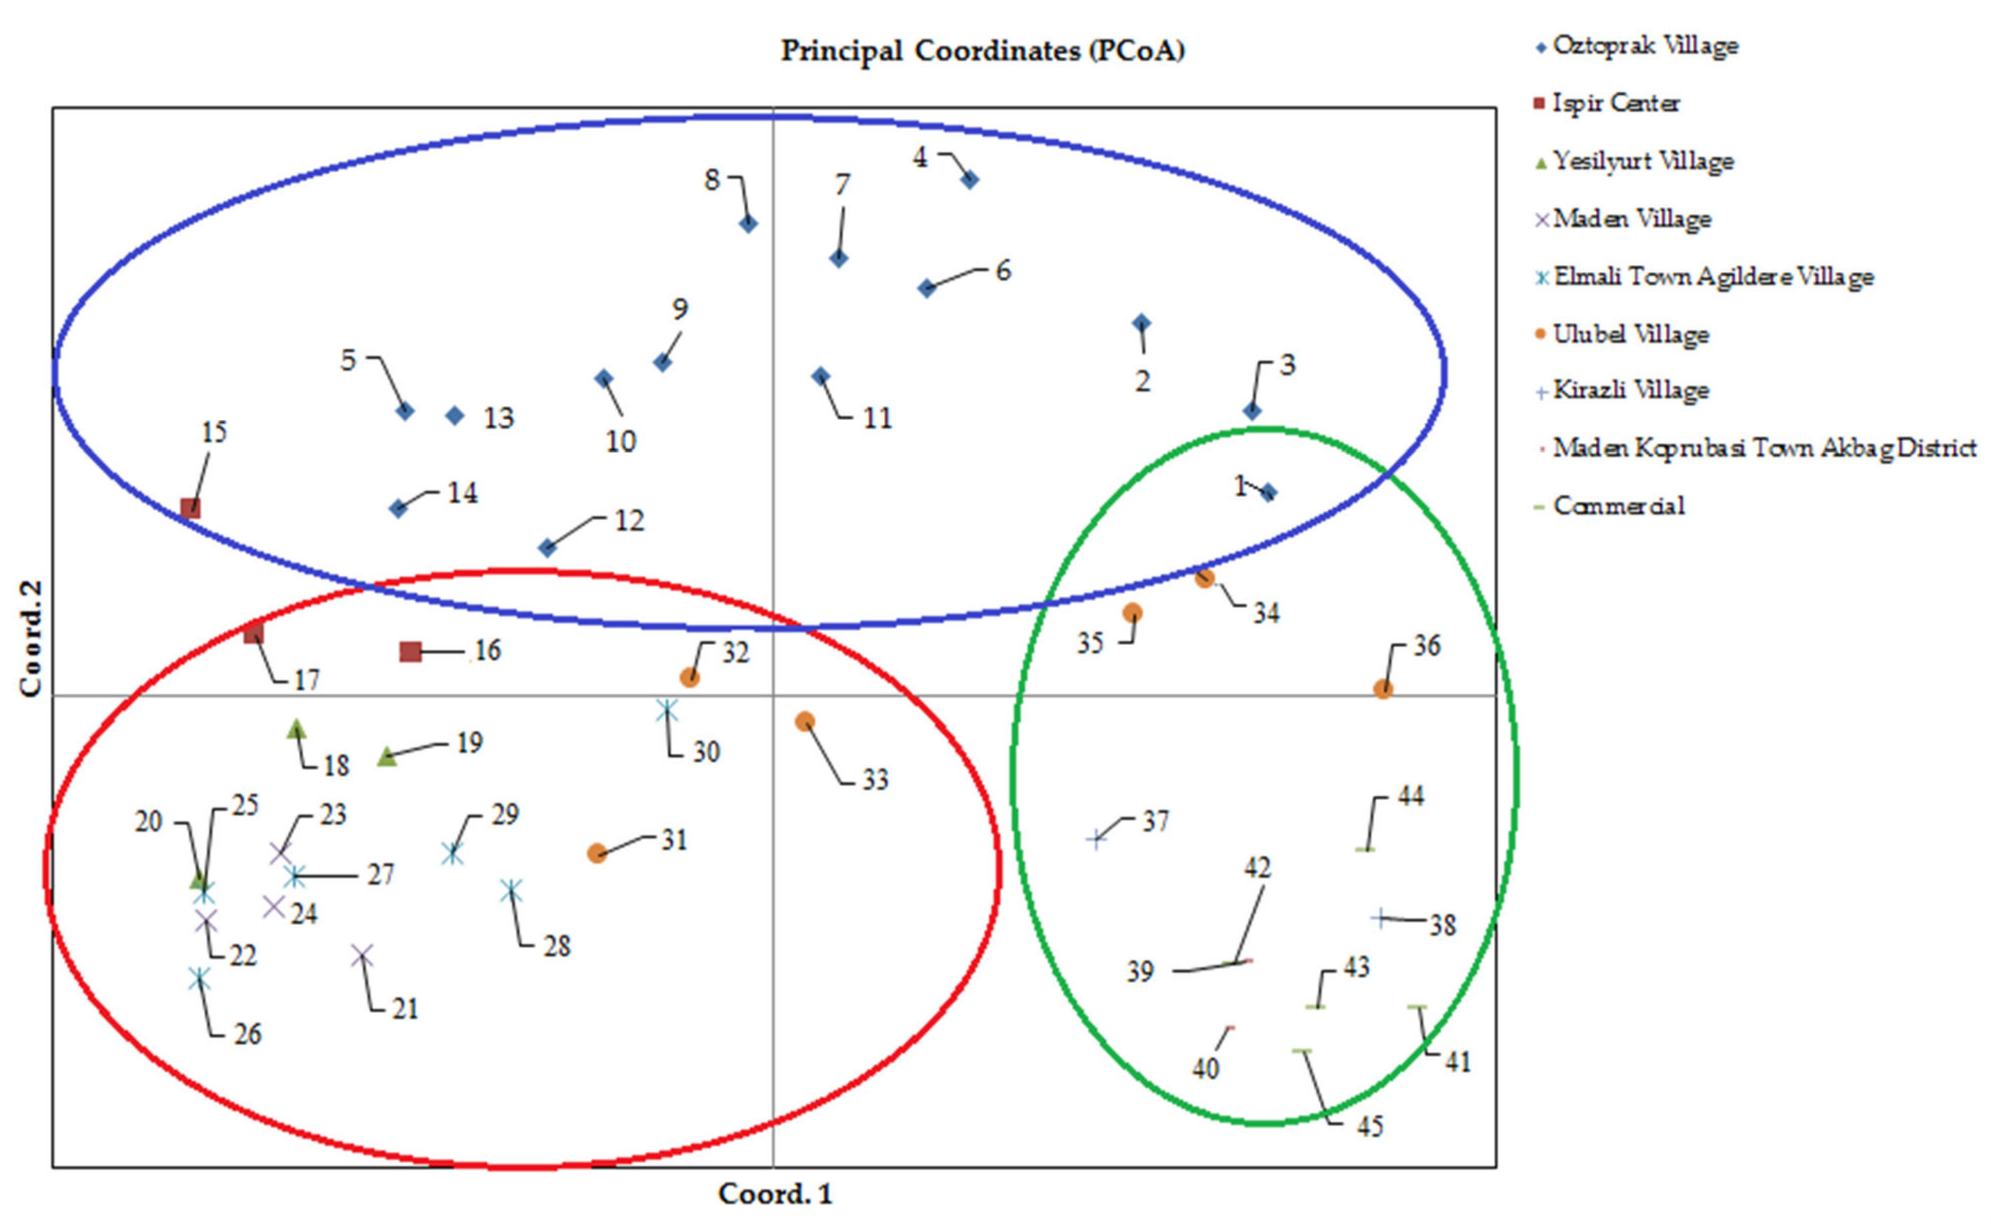
3.3. Determination of Genetic Diversity Based on Principal Coordinate Analysis
3.4. Molecular Variance Analysis
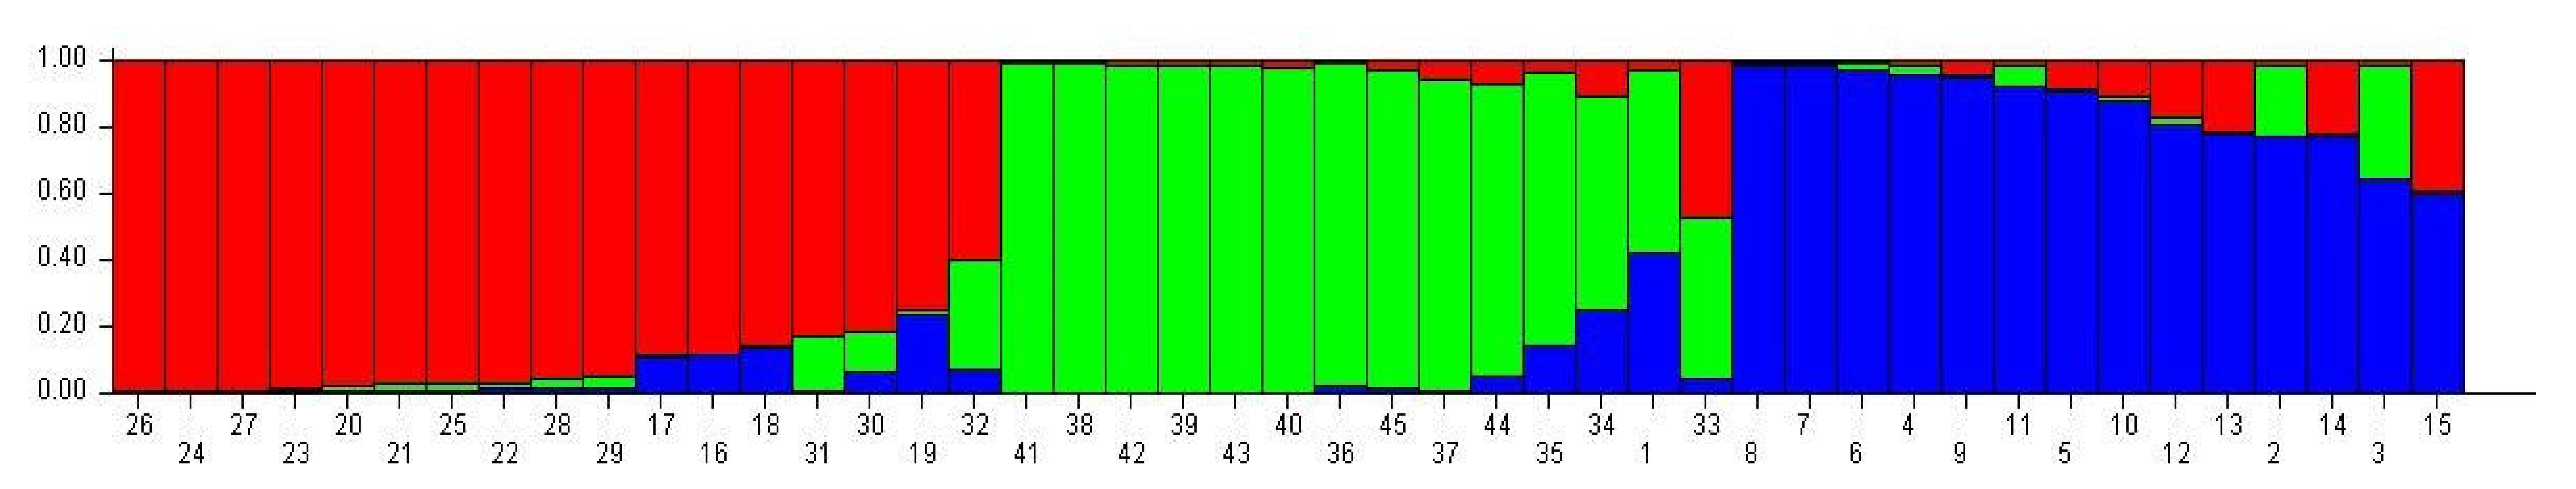
3.5. Genetic Structure Analysis
4. Conclusions
Supplementary Materials
Author Contributions
Funding
Institutional Review Board Statement
Informed Consent Statement
Data Availability Statement
Acknowledgments
Conflicts of Interest
References
- Gioia, T.; Logozzo, G.; Attene, G.; Bellucci, E.; Benedettelli, S.; Negri, V.; Papa, R.; Spagnoletti Zeuli, P. Evidence for introduction bottleneck and extensive intergene pool (Mesoamerican x Andean) hybridization in the European common bean (Phaseolus vulgaris L.) germplasm. PLoS ONE 2013, 8, e75974. [Google Scholar] [CrossRef] [PubMed]
- Öztürk, H.İ.; Dursun, A.; Hosseinpour, A.; Haliloğlu, K. Genetic diversity of pinto and fresh bean (Phaseolus vulgaris L.) germplasm collected from Erzincan province of Turkey by inter-primer binding site (iPBS) retrotransposon markers. Turk. J. Agric. For. 2020, 44, 417–427. [Google Scholar] [CrossRef]
- Rodríguez, L.; Mendez, D.; Montecino, H.; Carrasco, B.; Arevalo, B.; Palomo, I.; Fuentes, E. Role of Phaseolus vulgaris L. in the prevention of cardiovascular diseases—cardioprotective potential of bioactive compounds. Plants 2022, 11, 186. [Google Scholar] [CrossRef] [PubMed]
- Savić, A.; Pipan, B.; Vasić, M.; Meglič, V. Genetic diversity of common bean (Phaseolus vulgaris L.) germplasm from Serbia, as revealed by single sequence repeats (SSR). Sci. Hortic. 2021, 288, 110405. [Google Scholar] [CrossRef]
- Bitocchi, E.; Rau, D.; Bellucci, E.; Rodriguez, M.; Murgia, M.L.; Gioia, T.; Santo, D.; Nanni, L.; Attene, G.; Papa, R. Beans (Phaseolus ssp.) as a model for understanding crop evolution. Front. Plant. Sci. 2017, 8, 722. [Google Scholar] [CrossRef] [PubMed]
- Singh, S.P.; Gepts, P.; Debouck, D.G. Races of common bean (Phaseolus vulgaris, Fabaceae). Econ. Bot. 1991, 45, 379–396. [Google Scholar] [CrossRef]
- Mamidi, S.; Rossi, M.; Moghaddam, S.; Annam, D.; Lee, R.; Papa, R.; McClean, P. Demographic factors shaped diversity in the two gene pools of wild common bean Phaseolus vulgaris L. Heredity 2013, 110, 267–276. [Google Scholar] [CrossRef]
- Gepts, P.; Bliss, F. Phaseolin variability among wild and cultivated common beans (Phaseolus vulgaris) from Colombia. Eco. Bot. 1986, 40, 469–478. [Google Scholar] [CrossRef]
- Aydin, M.F.; Baloch, F.S. Exploring the genetic diversity and population structure of Turkish common bean germplasm by the iPBS-retrotransposons markers. Legum. Res. 2019, 42, 18–24. [Google Scholar] [CrossRef]
- Pereira, H.S.; Mota, A.P.S.; Rodrigues, L.A.; de Souza, T.L.P.O.; Melo, L.C. Genetic diversity among common bean cultivars based on agronomic traits and molecular markers and application to recommendation of parent lines. Euphytica 2019, 215, 1–16. [Google Scholar] [CrossRef]
- Ewing, P.M.; Runck, B.C.; Kono, T.Y.; Kantar, M.B. The home field advantage of modern plant breeding. PLoS ONE 2019, 14, e0227079. [Google Scholar] [CrossRef]
- Almeida, C.P.D.; Paulino, J.F.D.C.; Morais Carbonell, S.A.; Chiorato, A.F.; Song, Q.; Di Vittori, V.; Rodriguez, M.; Papa, R.; Benchimol-Reis, L.L. Genetic diversity, population structure, and andean introgression in Brazilian common bean cultivars after half a century of genetic breeding. Genes 2020, 11, 1298. [Google Scholar] [CrossRef]
- Gioia, T.; Logozzo, G.; Marzario, S.; Spagnoletti Zeuli, P.; Gepts, P. Evolution of SSR diversity from wild types to US advanced cultivars in the Andean and Mesoamerican domestications of common bean (Phaseolus vulgaris). PLoS ONE 2019, 14, e0211342. [Google Scholar] [CrossRef]
- Akbulut, B.; Karakurt, Y.; Tonguc, M. Molecular characterization of common bean (Phaseolus vulgaris L.) genotypes. Akdeniz Univ. J. Fac. Agric. 2013, 26, 105–108. [Google Scholar]
- Cheng, J.; Qin, C.; Tang, X.; Zhou, H.; Hu, Y.; Zhao, Z.; Cui, J.; Li, B.; Wu, Z.; Yu, J. Development of a SNP array and its application to genetic mapping and diversity assessment in pepper (Capsicum spp.). Sci. Rep. 2016, 6, 1–11. [Google Scholar] [CrossRef]
- Delfini, J.; Moda-Cirino, V.; dos Santos Neto, J.; Ruas, P.M.; Sant’Ana, G.C.; Gepts, P.; Gonçalves, L.S.A. Population structure, genetic diversity and genomic selection signatures among a Brazilian common bean germplasm. Sci. Rep. 2021, 11, 1–12. [Google Scholar] [CrossRef]
- Scarano, D.; Rubio, F.; Ruiz, J.J.; Rao, R.; Corrado, G. Morphological and genetic diversity among and within common bean (Phaseolus vulgaris L.) landraces from the Campania region (Southern Italy). Sci. Hortic. 2014, 180, 72–78. [Google Scholar] [CrossRef]
- Shi, C.; Navabi, A.; Yu, K. Association mapping of common bacterial blight resistance QTL in Ontario bean breeding populations. BMC Plant. Biol. 2011, 11, 1–11. [Google Scholar] [CrossRef]
- Ceylan, A.; Öcal, N.; Akbulut, M. Genetic diversity among the Turkish common bean cultivars (Phaseolus vulgaris L.) as assessed by SRAP, POGP and cpSSR markers. Biochem. Syst. Ecol. 2014, 54, 219–229. [Google Scholar] [CrossRef]
- Bukhari, A.; Bhat, M.; Ahmad, M.; Saleem, N. Examination of genetic diversity in common bean (Phaseolus vulgaris L.) using random amplified polymorphic DNA (RAPD) markers. Afr. J. Biotechnol. 2015, 14, 451–458. [Google Scholar]
- Cabral, P.D.S.; Souza, L.D.; Costa, G.D.; Silva, F.H.L.; Soare, T.C.B. Investigation of the genetic diversity of common bean (Phaseolus vulgaris.) cultivars using molecular markers. Genet. Mol. Res. 2018, 17, 1–11. [Google Scholar] [CrossRef]
- Beebe, S.; Skroch, P.W.; Tohme, J.; Duque, M.; Pedraza, F.; Nienhuis, J. Structure of genetic diversity among common bean landraces of Middle American origin based on correspondence analysis of RAPD. Crop. Sci. 2000, 40, 264–273. [Google Scholar] [CrossRef]
- Nemli, S.; Kianoosh, T.; Tanyolac, M.B. Genetic diversity and population structure of common bean (Phaseolus vulgaris L.) accessions through retrotransposon-based interprimer binding sites (iPBSs) markers. Turk. J. Agric. For. 2015, 39, 940–948. [Google Scholar] [CrossRef]
- Yeken, M.Z.; Emiralioğlu, O.; Çiftçi, V.; Bayraktar, H.; Palacioğlu, G.; Özer, G. Analysis of genetic diversity among common bean germplasm by start codon targeted (SCoT) markers. Mol. Biol. Rep. 2022, 49, 1–9. [Google Scholar] [CrossRef]
- Perseguini, J.M.K.C.; Chioratto, A.F.; Zucchi, M.I.; Colombo, C.A.; Carbonell, S.A.M.; Mondego, J.M.C.; Gazaffi, R.; Garcia, A.A.F.; Campos Td Souza, A.P.d. Genetic diversity in cultivated carioca common beans based on molecular marker analysis. Genet. Mol. Biol. 2011, 34, 88–102. [Google Scholar] [CrossRef]
- Chin, E.; Shu, H.; Smith, J.; Senior, M. Maize simple repetitive DNA sequences: Abundance and allele variation. Genome 1996, 39, 866–873. [Google Scholar] [CrossRef]
- Pipan, B.; Meglič, V. Diversification and genetic structure of the western-to-eastern progression of European Phaseolus vulgaris L. germplasm. BMC Plant. Biol. 2019, 19, 1–16. [Google Scholar] [CrossRef]
- Carvalho, M.S.; de Oliveira Moulin Carias, C.M.; Silva, M.A.; da Silva Ferreira, M.F.; de Souza, T.L.P.O.; Posse, S.C.P.; Ferreira, A. Genetic diversity and structure of landrace accessions, elite lineages and cultivars of common bean estimated with SSR and SNP markers. Mol. Biol. Rep. 2020, 47, 6705–6715. [Google Scholar] [CrossRef]
- Fisseha, Z.; Tesfaye, K.; Dagne, K.; Blair, M.W.; Harvey, J.; Kyallo, M.; Gepts, P. Genetic diversity and population structure of common bean (Phaseolus vulgaris L) germplasm of Ethiopia as revealed by microsatellite markers. Afr. J. Biotechnol. 2016, 15, 2824–2847. [Google Scholar]
- Müller, B.S.; Pappas, G.J.; Valdisser, P.A.; Coelho, G.R.; de Menezes, I.P.; Abreu, A.G.; Borba, T.C.; Sakamoto, T.; Brondani, C.; Barros, E.G. An operational SNP panel integrated to SSR marker for the assessment of genetic diversity and population structure of the common bean. Plant. Mol. Biol. Rep. 2015, 33, 1697–1711. [Google Scholar] [CrossRef]
- Zeinalzadehtabrizi, H.; Hosseinpour, A.; Aydin, M.; Haliloglu, K. A modified genomic DNA extraction method from leaves of sunflower for PCR based analyzes. J. Bio. Env. Sci 2015, 7, 222–225. [Google Scholar]
- Hosseinpour, A.; Karahan, F.; İlhan, E.; İlçim, A.; Haliloğlu, K. Genetic structure and diversity of Adonis L.(Ranunculaceae) populations collected from Turkey by inter-primer binding site (iPBS) retrotransposon markers. Turk. J. Bot. 2019, 43, 585–596. [Google Scholar] [CrossRef]
- Blair, M.W.; Buendía, H.F.; Giraldo, M.C.; Métais, I.; Peltier, D. Characterization of AT-rich microsatellites in common bean (Phaseolus vulgaris L.). Theor. Appl. Genet. 2008, 118, 91–103. [Google Scholar] [CrossRef] [PubMed]
- Gaitán-Solís, E.; Duque, M.; Edwards, K.; Tohme, J. Microsatellite Repeats in Common Bean (Phaseolus vulgaris) Isolation, Characterization, and Cross-Species Amplification in Phaseolus ssp. Crop. Sci. 2002, 42, 2128–2136. [Google Scholar] [CrossRef]
- Yu, K.; Park, S.; Poysa, V.; Gepts, P. Integration of simple sequence repeat (SSR) markers into a molecular linkage map of common bean (Phaseolus vulgaris L.). J. Hered. 2000, 91, 429–434. [Google Scholar] [CrossRef]
- Buso, G.; Amaral, Z.; Brondani, R.; Ferreira, M. Microsatellite markers for the common bean Phaseolus vulgaris. Mol. Ecol. Notes 2006, 6, 252–254. [Google Scholar] [CrossRef]
- Mall, N.; Chawla, H. Suitability of SSR marker for establishing distinctiveness in French bean varieties (Phaseolus vulgaris L.). Legume 2014, 37, 353–358. [Google Scholar]
- Rohlf, F.J. NTSYS-pc: Microcomputer programs for numerical taxonomy and multivariate analysis. Am. Stat. 1987, 41, 330. [Google Scholar] [CrossRef]
- Anderson, J.A.; Churchill, G.; Autrique, J.; Tanksley, S.; Sorrells, M. Optimizing parental selection for genetic linkage maps. Genome 1993, 36, 181–186. [Google Scholar] [CrossRef]
- Yeh, F.C.; Yang, R.; Boyle, T.B.; Ye, Z.; Mao, J.X. POPGENE, the user-friendly shareware for population genetic analysis. Mol. Biol. Biotechnol. Cent. Univ. Alta. Can. 1997, 10, 295–301. [Google Scholar]
- Nei, M.; Tajima, F.; Tateno, Y. Accuracy of estimated phylogenetic trees from molecular data. J. Mol. Evol. 1983, 19, 153–170. [Google Scholar] [CrossRef]
- Francis, C.; Yang, R. Popgene version 1.32. 2000. Available online: https://sites.ualberta.ca/~fyeh/popgene.html.
- Pritchard, J.K.; Stephens, M.; Rosenberg, N.A.; Donnelly, P. Association mapping in structured populations. Am. J. Hum. Genet. 2000, 67, 170–181. [Google Scholar] [CrossRef]
- Blair, M.W.; Galeano, C.H.; Tovar, E.; Muñoz Torres, M.C.; Castrillón, A.V.; Beebe, S.E.; Rao, I.M. Development of a Mesoamerican intra-genepool genetic map for quantitative trait loci detection in a drought tolerant× susceptible common bean (Phaseolus vulgaris L.) cross. Mol. Breed. 2012, 29, 71–88. [Google Scholar] [CrossRef]
- Hegay, S.; Geleta, M.; Bryngelsson, T.; Gustavsson, L.; Persson-Hovmalm, H.; Ortiz, R. Comparing genetic diversity and population structure of common beans grown in Kyrgyzstan using microsatellites. Sci. J. Crop. Sci. 2012, 1, 63–75. [Google Scholar]
- Zargar, S.M.; Farhat, S.; Mahajan, R.; Bhakhri, A.; Sharma, A. Unraveling the efficiency of RAPD and SSR markers in diversity analysis and population structure estimation in common bean. Saudi. J. Biol. Sci. 2016, 23, 139–149. [Google Scholar] [CrossRef]
- Peakall, R.; Smouse, P.E. GENALEX 6: Genetic analysis in Excel. Population genetic software for teaching and research. Mol. Ecol. Notes 2006, 6, 288–295. [Google Scholar] [CrossRef]
- Bird, K.A.; An, H.; Gazave, E.; Gore, M.A.; Pires, J.C.; Robertson, L.D.; Labate, J.A. Population structure and phylogenetic relationships in a diverse panel of Brassica rapa L. Front. Plant. Sci. 2017, 8, 321. [Google Scholar] [CrossRef]
- Toro, M.; Caballero, A. Characterization and conservation of genetic diversity in subdivided populations. Philos. Trans. R. Soc. Lond. B Biol. Sci. 2005, 360, 1367–1378. [Google Scholar] [CrossRef]
- Dutta, S.K.; Singh, S.; Chatterjee, D.; Boopathi, T.; Singh, A.; Saha, S. Morphological and genetic diversity of pole type common bean (Phaseolus vulgaris L.) landraces of Mizoram (India). Indian J. Biotechnol. 2016, 15, 550–559. [Google Scholar]
- Zhang, X.; Blair, M.W.; Wang, S. Genetic diversity of Chinese common bean (Phaseolus vulgaris L.) landraces assessed with simple sequence repeat markers. Theor. Appl. Genet. 2008, 117, 629–640. [Google Scholar] [CrossRef]
- Matondo, N.; Yao, K.; Kyalo, M.; Skilton, R.; Nkongolo, K.; Mumba, D.; Tshilenge, D.; Lubobo, A. Assessment of the genetic diversity and the relationship among common bean (Phaseolus vulgaris L.) accessions from DR-Congo germplasm using SSR molecular markers. Int. J. Curr. Res. 2017, 9, 47814–47821. [Google Scholar]
- Kwak, M.; Gepts, P. Structure of genetic diversity in the two major gene pools of common bean (Phaseolus vulgaris L., Fabaceae). Theor. Appl. Genet. 2009, 118, 979–992. [Google Scholar] [CrossRef]
- Sharma, P.; Diaz, L.; Blair, M. Genetic diversity of two Indian common bean germplasm collections based on morphological and microsatellite markers. Plant. Genet. Res. 2013, 11, 121–130. [Google Scholar] [CrossRef]
- Rebaa, F.; Abid, G.; Aouida, M.; Abdelkarim, S.; Aroua, I.; Muhovski, Y.; Baudoin, J.-P.; M’hamdi, M.; Sassi, K.; Jebara, M. Genetic variability in Tunisian populations of faba bean (Vicia faba L. var. major) assessed by morphological and SSR markers. Physiol. Mol. Biol. Plant. 2017, 23, 397–409. [Google Scholar] [CrossRef]
- Iangrai, B.; Pattanayak, A.; Khongwir, D.E.A.; Pale, G.; Gatphoh, E.M.; Das, A.; Chrungoo, N.K. Development and characterization of a new set of genomic microsatellite markers in rice bean (Vigna umbellata (Thunb.) Ohwi and Ohashi) and their utilization in genetic diversity analysis of collections from North East India. PLoS ONE 2017, 12, e0179801. [Google Scholar] [CrossRef]
- Khaidizar, M.I.; Haliloglu, K.; Elkoca, E.; Aydin, M.; Kantar, F. Genetic diversity of common bean (Phaseolus vulgaris L.) landraces grown in northeast Anatolia of Turkey assessed with simple sequence repeat markers. Turk. J. Field Crop. 2012, 17, 145–150. [Google Scholar]
- Haliloğlu, K.; Türkoğlu, A.; Öztürk, H.I.; Özkan, G.; Elkoca, E.; Poczai, P. iPBS-Retrotransposon Markers in the Analysis of Genetic Diversity among Common Bean (Phaseolus vulgaris L.) Germplasm from Türkiye. Genes 2022, 13, 1147. [Google Scholar] [CrossRef] [PubMed]
- Mohammadi, S.A.; Prasanna, B. Analysis of genetic diversity in crop plants—salient statistical tools and considerations. Crop. Sci. 2003, 43, 1235–1248. [Google Scholar] [CrossRef]
- Klaedtke, S.M.; Caproni, L.; Klauck, J.; De la Grandville, P.; Dutartre, M.; Stassart, P.M.; Chable, V.; Negri, V.; Raggi, L. Short-term local adaptation of historical common bean (Phaseolus vulgaris L.) varieties and implications for in situ management of bean diversity. Int. J. Mol. Sci. 2017, 18, 493. [Google Scholar] [CrossRef] [PubMed]
- Zhang, Q.; Li, J.; Zhao, Y.; Korban, S.S.; Han, Y. Evaluation of genetic diversity in Chinese wild apple species along with apple cultivars using SSR markers. Plant. Mol. Biol. Rep. 2012, 30, 539–546. [Google Scholar] [CrossRef]
- Rauscher, G.; Simko, I. Development of genomic SSR markers for fingerprinting lettuce (Lactuca sativa L.) cultivars and mapping genes. BMC Plant. Biol. 2013, 13, 1–11. [Google Scholar] [CrossRef] [PubMed]
- Zecca, G.; Abbott, J.R.; Sun, W.-B.; Spada, A.; Sala, F.; Grassi, F. The timing and the mode of evolution of wild grapes (Vitis). Mol. Phylogenet. Evol. 2012, 62, 736–747. [Google Scholar] [CrossRef] [PubMed]


| CN 1 | ACN | Site-Location | Latitude | Longitude | Altitude (m) | SW (g) | SC | SS | |
|---|---|---|---|---|---|---|---|---|---|
| 1 | Line-2 | 1-Öztoprak Village | 40.518 | 41.052 | 1431 | 57.3 | White | Circular | |
| 2 | Line-3 | 40.518 | 41.052 | 1431 | 57.3 | White | Oval | ||
| 3 | Line-4 | 40.518 | 41.052 | 1431 | 63.3 | White | Circular | ||
| 4 | Line-5 | 40.518 | 41.052 | 1431 | 60.0 | White | Oval | ||
| 5 | Line-6 | 40.518 | 41.052 | 1431 | 57.2 | White | Circular | ||
| 6 | Line-10 | 40.518 | 41.052 | 1431 | 58.2 | White | Circular | ||
| 7 | Line-12 | 40.518 | 41.052 | 1431 | 55.1 | White | Oval | ||
| 8 | Line-14 | 40.518 | 41.052 | 1431 | 59.1 | White | Circular | ||
| 9 | Line-15 | 40.518 | 41.052 | 1431 | 58.3 | White | Circular | ||
| 10 | Line-16 | 40.518 | 41.052 | 1431 | 62.0 | White | Circular | ||
| 11 | Line-17 | 40.518 | 41.052 | 1431 | 63.5 | White | Circular | ||
| 12 | Line-19 | 40.518 | 41.052 | 1431 | 62.1 | White | Circular | ||
| 13 | Line-20 | 40.518 | 41.052 | 1431 | 58.9 | White | Oval | ||
| 14 | Line-21 | 40.518 | 41.052 | 1431 | 61.9 | White | Circular | ||
| 15 | Line-26 | 2-Ispir Center Gaziler Neighborhood | 40.485 | 41.002 | 1264 | 60.2 | White | Circular | |
| 16 | Line-27 | 40.468 | 40.983 | 1168 | 56.2 | White | Circular | ||
| 17 | Line-28 | 40.468 | 40.983 | 1168 | 59.8 | White | Circular | ||
| 18 | Line-32 | 3-Yeşilyurt Village | 40.518 | 41.069 | 1549 | 57.0 | White | Circular | |
| 19 | Line-33 | 40.518 | 41.069 | 1549 | 57.7 | White | Circular | ||
| 20 | Line-35 | 40.518 | 41.069 | 1549 | 58.1 | White | Circular | ||
| 21 | Line-39 | 4-Maden Village | 40.435 | 40.851 | 1226 | 54.5 | White | Oval | |
| 22 | Line-40 | 40.435 | 40.851 | 1226 | 54.1 | White | Oval | ||
| 23 | Line-41 | 40.435 | 40.851 | 1226 | 55.9 | White | Oval | ||
| 24 | Line-42 | 40.435 | 40.851 | 1226 | 56.6 | White | Circular | ||
| 25 | Line-45 | 5-Elmalı District Ağıldere Village | 40.401 | 40.834 | 1470 | 59.2 | White | Circular | |
| 26 | Line-47 | 40.401 | 40.834 | 1470 | 59.2 | White | Circular | ||
| 27 | Line-49 | 40.401 | 40.834 | 1470 | 55.2 | White | Circular | ||
| 28 | Line-50 | 40.401 | 40.834 | 1470 | 58.4 | White | Circular | ||
| 29 | Line-53 | 40.401 | 40.834 | 1470 | 56.2 | White | Circular | ||
| 30 | Line-54 | 40.401 | 40.834 | 1470 | 61.4 | White | Circular | ||
| 31 | Line-57 | 6-Ulubel Village | 40.418 | 40.868 | 1424 | 54.5 | White | Circular | |
| 32 | Line-59 | 40.418 | 40.868 | 1424 | 56.5 | White | Circular | ||
| 33 | Line-60 | 40.418 | 40.868 | 1424 | 59.3 | White | Circular | ||
| 34 | Line-61 | 40.418 | 40.868 | 1424 | 57.9 | White | Circular | ||
| 35 | Line-62 | 40.418 | 40.868 | 1424 | 55.3 | White | Circular | ||
| 36 | Line-63 | 40.418 | 40.868 | 1424 | 57.4 | White | Circular | ||
| 37 | Line-64 | 7-Kirazlı Village | 40.436 | 40.887 | 1220 | 58.2 | White | Oval | |
| 38 | Line-65 | 40.436 | 40.887 | 1220 | 54.8 | White | Circular | ||
| 39 | Line-67 | 8-Maden Köprübaşı District Akbağ Neighborhood | 40.434 | 40.819 | 1286 | 59.7 | White | Circular | |
| 40 | Line-69 | 40.434 | 40.819 | 1286 | 55.6 | White | Circular | ||
| 41 | Aras-98 | 9- | Eastern Anatolia Agricultural Research Institute Directorate/Erzurum | 45.4 | White | Cylindrical | |||
| 42 | Elkoca-05 | Ataturk University Faculty of Agriculture/Erzurum | 49.6 | White | Cylindrical | ||||
| 43 | Göynük-98 | Gateway Agricultural Research Institute Directorate/Eskişehir | 53.5 | White | Cylindrical | ||||
| 44 | Karacaşehir-90 | Gateway Agricultural Research Institute Directorate/Eskişehir | 18.0 | White | Oval | ||||
| 45 | Yakutiye-98 | Eastern Anatolia Agricultural Research Institute Directorate/Erzurum | 43.9 | White | Cylindrical | ||||
| Marker Name | GenBank Code | Size (bp) | Linkage Group | Motifs | Forward (5′–3′) | Reverse (5′–3′) | References |
|---|---|---|---|---|---|---|---|
| BMd1 | X96999 | 165 | Pv03 | (AT)9 | CAAATCGCAACACCTCACAA | GTCGGAGCCATCATCTGTTT | [33] |
| BMd15 | K03288 | 166 | Pv04 | (ATGC)4 | TTGCCATCGTTGCTTAATTG | TTGGAGGAAGCCATGTATGC | [33] |
| BMd18 | X59469 | 216 | Pv02 | (GAAT)3 | AAAGTTGGACGCACTGTGATT | TCGTGAGGTAGGAGTTTGGTG | [33] |
| BM053 | AF324244 | 105 | Pv01 | (CT)21(CA)19(TA)9 | TGCTGACCAAGGAAATTCAG | GGAGGAGGCTTAAGCACAAA | [33] |
| BM114 | AF483854 | 234 | Pv09 | (TA)8(GT)10 | AGCCTGGTGAAATGCTCATAG | CATGCTTGTTGCCTAACTCTCT | [34] |
| BM137 | AF483855 | 155 | Pv06 | (CT)33 | CGCTTACTCACTGTACGCACG | CCGTATCCGAGCACCGTAAC | [34] |
| BM141 | AF483859 | 218 | Pv09 | (GA)29 | TGAGGAGGAACAATGGTGGC | CTCACAAACCACAACGCACC | [34] |
| BM143 | AF483861 | 143 | Pv02 | (GA)35 | GGGAAATGAACAGAGGAAA | ATGTTGGGAACTTTTAGTGTG | [34] |
| BM152 | AF483868 | 127 | Pv02 | (GA)31 | AAGAGGAGGTCGAAACCTTAAATCG | CCGGGACTTGCCAGAAGAAC | [34] |
| BM153 | AF483869 | 226 | Pv08 | (CA)5(TG)(CA)3CG(CA)10(TA)4 | CCGTTAGGGAGTTGTTGAGG | TGACAAACCATGAATATGCTAAGA | [34] |
| BM154 | AF483870 | 218 | Pv09 | (CT)17 | TCTTGCGACCGAGCTTCTCC | CTGAATCTGAGGAACGATGACCAG | [34] |
| BM156 | AF483872 | 267 | Pv02 | (CT)32 | CTTGTTCCACCTCCCATCATAGC | TGCTTGCATCTCAGCCAGAATC | [34] |
| BM160 | AF483876 | 211 | Pv09 | (GA)15(GAA)5 | CGTGCTTGGCGAATAGCTTTG | CGCGGTTCTGATCGTGACTTC | [34] |
| BM161 | AF483877 | 185 | Pv04 | (GA)7(GA)8 | TGCAAAGGGTTGAAAGTTGAGAG | TTCCAATGCACCAGACATTCC | [34] |
| BM167 | AF483881 | 165 | Pv08 | (GA)19 | TCCTCAATACTACATCGTGTGACC | CCTGGTGTAACCCTCGTAACAG | [34] |
| BM175 | AF483886 | 170 | Pv05 | (AT)5(GA)19 | CAACAGTTAAAGGTCGTCAAATT | CCACTCTTAGCATCAACTGGA | [34] |
| PVAT001 | U18791 | 239 | Pv04 | (AT)22 | GGGAGGGTAGGGAAGCAGTG | GCGAACCACGTTCATGAATGA | [35] |
| PVAG004 | X04660 | 201 | Pv04 | (AG)8 | TTGATGACGTGGATGCATTGC | AAAGGGCTAGGGAGAGTAAGTTGG | [35] |
| PVBR14 | DQ185881 | 196 | Pv06 | (AG)23 | TGAGAAAGTTGATGGGATTG | ACGCTGTTGAAGGCTCTAC | [36] |
| BM183 | AF483888 | 149 | Pv07 | (TC)14 | CTCAAATCTATTCACTGGTCAGC | TCTTACAGCCTTGCAGACATC | [34] |
| BM188 | AF483892 | 177 | Pv09 | (CA)18(TA)7 | TCGCCTTGAAACTTCTTGTATC | CCCTTCCAGTTAAATCAGTCG | [34] |
| BM199 | AF483896 | 304 | Pv04 | (GA)15 | AAGGAGAATCAGAGAAGCCAAAAG | TGAGGAATGGATGTAGCTCAGG | [34] |
| BM200 | AF483897 | 221 | Pv01 | (AG)10 | TGGTGGTTGTTATGGGAGAAG | ATTTGTCTCTGTCTATTCCTTCCAC | [34] |
| BM210 | AF483902 | 166 | Pv07 | (CT)15 | ACCACTGCAATCCTCATCTTTG | CCCTCATCCTCCATTCTTATCG | [34] |
| BM211 | AF483903 | 186 | Pv08 | (CT)16 | ATACCCACATGCACAAGTTTGG | CCACCATGTGCTCATGAAGAT | [34] |
| GATS91 | AF483842 | 229 | Pv02 | (GA)17 | GAGTGCGGAAGCGAGTGAG | TCCGTGTTCCTCTGTCTGTG | [37] |
| PVTTTC01 | X53603 | 163 | Pv07 | (GAAT)5 | TGGACTCATAGAGGCGCAGAAAG | AAGGATGGGTTCCGTGCTTG | [35] |
| Locus | Allele Number | Number of Polymorphic Bands | Polymorphism Percentage (%) | Allele Frequency | Gene Diversity | Observed Heterozygosity | PIC * |
|---|---|---|---|---|---|---|---|
| BM053 | 3 | 3 | 100 | 0.78 | 0.37 | 0.00 | 0.33 |
| BM114 | 6 | 6 | 100 | 0.36 | 0.74 | 0.93 | 0.69 |
| BM137 | 6 | 6 | 100 | 0.29 | 0.78 | 0.00 | 0.75 |
| BM141 | 7 | 7 | 100 | 0.22 | 0.83 | 0.98 | 0.81 |
| BM143 | 11 | 11 | 100 | 0.29 | 0.78 | 0.96 | 0.75 |
| BM152 | 6 | 6 | 100 | 0.33 | 0.75 | 1.00 | 0.71 |
| BM153 | 12 | 12 | 100 | 0.20 | 0.87 | 0.51 | 0.86 |
| BM154 | 4 | 4 | 100 | 0.67 | 0.48 | 0.00 | 0.42 |
| BM156 | 5 | 5 | 100 | 0.30 | 0.77 | 1.00 | 0.73 |
| BM160 | 7 | 7 | 100 | 0.32 | 0.77 | 0.96 | 0.73 |
| BM161 | 3 | 3 | 100 | 0.49 | 0.57 | 0.00 | 0.48 |
| BM167 | 6 | 6 | 100 | 0.28 | 0.80 | 0.00 | 0.77 |
| BM175 | 3 | 3 | 100 | 0.38 | 0.66 | 0.00 | 0.59 |
| BM183 | 3 | 3 | 100 | 0.59 | 0.50 | 0.00 | 0.40 |
| BM188 | 5 | 5 | 100 | 0.44 | 0.67 | 0.00 | 0.61 |
| BM199 | 3 | 3 | 100 | 0.42 | 0.64 | 0.00 | 0.56 |
| BM200 | 4 | 4 | 100 | 0.42 | 0.68 | 0.87 | 0.62 |
| BM210 | 6 | 6 | 100 | 0.47 | 0.71 | 0.00 | 0.67 |
| BM211 | 6 | 6 | 100 | 0.31 | 0.79 | 0.00 | 0.76 |
| BMd1 | 7 | 7 | 100 | 0.22 | 0.83 | 1.00 | 0.81 |
| BMd15 | 4 | 4 | 100 | 0.36 | 0.73 | 0.00 | 0.68 |
| BMd18 | 3 | 3 | 100 | 0.58 | 0.56 | 0.00 | 0.49 |
| GATS91 | 2 | 2 | 100 | 0.62 | 0.47 | 0.00 | 0.36 |
| PVAG004 | 6 | 6 | 100 | 0.49 | 0.69 | 0.00 | 0.65 |
| PVAT001 | 8 | 8 | 100 | 0.24 | 0.83 | 0.00 | 0.81 |
| PVBR14 | 4 | 4 | 100 | 0.31 | 0.74 | 0.00 | 0.69 |
| PVTT001 | 2 | 2 | 100 | 0.60 | 0.48 | 0.00 | 0.36 |
| Mean | 5.26 | 5.26 | 100 | 0.41 | 0.69 | 0.30 | 0.63 |
| Marker | Ne * | He ** | I *** | Marker | Ne * | He ** | I *** |
|---|---|---|---|---|---|---|---|
| BM053 | 1.578 | 0.370 | 0.665 | BM188 | 3.017 | 0.676 | 1.223 |
| BM114 | 3.824 | 0.746 | 1.472 | BM199 | 2.770 | 0.646 | 1.054 |
| BM137 | 4.633 | 0.793 | 1.614 | BM200 | 3.129 | 0.688 | 1.243 |
| BM141 | 5.921 | 0.84 | 1.832 | BM210 | 3.403 | 0.714 | 1.450 |
| BM143 | 4.581 | 0.790 | 1.752 | BM211 | 4.856 | 0.803 | 1.668 |
| BM152 | 4.074 | 0.763 | 1.515 | BMd1 | 6.026 | 0.843 | 1.841 |
| BM153 | 7.864 | 0.882 | 2.202 | BMd15 | 3.708 | 0.738 | 1.349 |
| BM154 | 1.930 | 0.487 | 0.846 | BMd18 | 2.298 | 0.571 | 0.944 |
| BM156 | 4.336 | 0.778 | 1.529 | GATS91 | 1.887 | 0.475 | 0.663 |
| BM160 | 4.281 | 0.775 | 1.619 | PVAG004 | 3.199 | 0.695 | 1.420 |
| BM161 | 2.351 | 0.581 | 0.9291 | PVAT001 | 5.973 | 0.841 | 1.895 |
| BM167 | 4.930 | 0.806 | 1.6542 | PVBR14 | 3.785 | 0.744 | 1.356 |
| BM175 | 2.939 | 0.667 | 1.088 | PVTT001 | 1.916 | 0.483 | 0.671 |
| BM183 | 2.004 | 0.506 | 0.764 | Mean | 3.749 | 0.693 | 1.343 |
| Group | Subgroup | Genotype | Total Genotype Number |
|---|---|---|---|
| I | 1 | 2, 3, 4, 5, 6, 10, 12, 14, 15, 16, 17, 19, 20, 21, 26, 27, 28, 32, 33, 35, 39, 40, 41 | 23 |
| 2 | 42, 45, 47, 49 | 4 | |
| II | - | 50, 53, 54, 57, 59, 60, 61, 62 | 8 |
| III | 1 | 63, 64, 65, 67, 69 | 5 |
| 2 | Aras-98, Elkoca-05, Göynük-98, Yakutiye-98, Karacaşehir-90 | 5 |
| Source | Degree of Freedom (DF) | Sum of Squares (SS) | Variance Component | % of Total Variance | p-Value |
|---|---|---|---|---|---|
| Among Population | 8 | 410.408 | 7.876 | 34% | 0.339 |
| Within Population | 36 | 537.774 | 15.365 | 66% | 0.001 |
| Total | 44 | 948.182 | 23.241 | 100% |
| Population | N | Na | Ne | I | He | uHe | PPL (%) |
|---|---|---|---|---|---|---|---|
| Ov | 14 | 1.289 | 1.311 | 0.290 | 0.189 | 0.196 | 64.08% |
| Ic | 3 | 0.387 | 1.065 | 0.055 | 0.038 | 0.051 | 9.15% |
| Yv | 3 | 0.697 | 1.197 | 0.168 | 0.114 | 0.137 | 29.58% |
| Mv | 4 | 0.831 | 1.212 | 0.193 | 0.127 | 0.145 | 37.32% |
| Eav | 6 | 0.880 | 1.242 | 0.215 | 0.143 | 0.156 | 40.85% |
| Uv | 6 | 0.845 | 1.228 | 0.202 | 0.134 | 0.147 | 38.73% |
| Kv | 2 | 0.500 | 1.120 | 0.102 | 0.070 | 0.093 | 16.90% |
| Mka | 2 | 0.472 | 1.110 | 0.094 | 0.064 | 0.086 | 15.49% |
| Com | 5 | 1.014 | 1.259 | 0.238 | 0.156 | 0.173 | 48.59% |
| Mean | 0.768 | 1.194 | 0.173 | 0.115 | 0.131 | 33.41% |
| Ov | Ic | Yv | Mv | Ev | Uv | Kv | Mka | Com | |
|---|---|---|---|---|---|---|---|---|---|
| Ov | 0.000 | ||||||||
| Ic | 0.170 | 0.000 | |||||||
| Yv | 0.124 | 0.134 | 0.000 | ||||||
| Mv | 0.129 | 0.153 | 0.089 | 0.000 | |||||
| Ev | 0.118 | 0.196 | 0.155 | 0.087 | 0.000 | ||||
| Uv | 0.098 | 0.245 | 0.201 | 0.177 | 0.111 | 0.000 | |||
| Kv | 0.195 | 0.309 | 0.278 | 0.234 | 0.213 | 0.113 | 0.000 | ||
| Mka | 0.195 | 0.341 | 0.258 | 0.225 | 0.237 | 0.172 | 0.111 | 0.000 | |
| Com | 0.125 | 0.283 | 0.190 | 0.166 | 0.181 | 0.154 | 0.178 | 0.128 | 0.000 |
| No. | Genotype | Subpopulation | No. | Genotype | Subpopulation | ||||
|---|---|---|---|---|---|---|---|---|---|
| I | II | III | I | II | III | ||||
| 1 | Line-2 | 0.026 | 0.551 * | 0.422 | 24 | Line-42 | 0.987 * | 0.007 | 0.006 |
| 2 | Line-3 | 0.009 | 0.216 | 0.775 * | 25 | Line-45 | 0.970 * | 0.016 | 0.015 |
| 3 | Line-4 | 0.008 | 0.349 | 0.643 * | 26 | Line-47 | 0.991 * | 0.005 | 0.004 |
| 4 | Line-5 | 0.01 | 0.027 | 0.963 * | 27 | Line-49 | 0.987 * | 0.006 | 0.007 |
| 5 | Line-6 | 0.085 | 0.005 | 0.910 * | 28 | Line-50 | 0.951 * | 0.029 | 0.02 |
| 6 | Line-10 | 0.007 | 0.017 | 0.975 * | 29 | Line-53 | 0.947 * | 0.034 | 0.019 |
| 7 | Line-12 | 0.006 | 0.006 | 0.988 * | 30 | Line-54 | 0.808 * | 0.124 | 0.068 |
| 8 | Line-14 | 0.005 | 0.004 | 0.99 * | 31 | Line-57 | 0.826 * | 0.161 | 0.013 |
| 9 | Line-15 | 0.04 | 0.01 | 0.95 * | 32 | Line-59 | 0.599 * | 0.323 | 0.078 |
| 10 | Line-16 | 0.102 | 0.018 | 0.88 * | 33 | Line-60 | 0.466 | 0.488 * | 0.046 |
| 11 | Line-17 | 0.014 | 0.064 | 0.922 * | 34 | Line-61 | 0.102 | 0.644 * | 0.254 |
| 12 | Line-19 | 0.167 | 0.025 | 0.808 * | 35 | Line-62 | 0.035 | 0.820 * | 0.145 |
| 13 | Line-20 | 0.208 | 0.007 | 0.785 * | 36 | Line-63 | 0.006 | 0.970 * | 0.024 |
| 14 | Line-21 | 0.218 | 0.009 | 0.773 * | 37 | Line-64 | 0.057 | 0.931 * | 0.013 |
| 15 | Line-26 | 0.387 | 0.006 | 0.607 * | 38 | Line-65 | 0.006 | 0.989 * | 0.005 |
| 16 | Line-27 | 0.880 * | 0.005 | 0.115 | 39 | Line-67 | 0.01 | 0.983 * | 0.007 |
| 17 | Line-28 | 0.885 * | 0.006 | 0.108 | 40 | Line-69 | 0.02 | 0.974 * | 0.006 |
| 18 | Line-32 | 0.853 * | 0.01 | 0.137 | 41 | Aras-98 | 0.005 | 0.990 * | 0.004 |
| 19 | Line-33 | 0.746 * | 0.016 | 0.238 | 42 | Elkoca-05 | 0.01 | 0.984 * | 0.006 |
| 20 | Line-35 | 0.977 * | 0.01 | 0.013 | 43 | Göynük-98 | 0.012 | 0.982 * | 0.007 |
| 21 | Line-39 | 0.971 * | 0.018 | 0.012 | 44 | Karacaşehir-90 | 0.069 | 0.879 * | 0.053 |
| 22 | Line-40 | 0.969 * | 0.015 | 0.016 | 45 | Yakutiye-98 | 0.028 | 0.957 * | 0.015 |
| 23 | Line-41 | 0.980 * | 0.007 | 0.014 | |||||
| Subpopulation (K) | Expected Heterozygosity | FST |
|---|---|---|
| 1 | 0.243 | 0.34 |
| 2 | 0.269 | 0.26 |
| 3 | 0.228 | 0.41 |
| Mean | 0.247 | 0.34 |
Publisher’s Note: MDPI stays neutral with regard to jurisdictional claims in published maps and institutional affiliations. |
© 2022 by the authors. Licensee MDPI, Basel, Switzerland. This article is an open access article distributed under the terms and conditions of the Creative Commons Attribution (CC BY) license (https://creativecommons.org/licenses/by/4.0/).
Share and Cite
Özkan, G.; Haliloğlu, K.; Türkoğlu, A.; Özturk, H.I.; Elkoca, E.; Poczai, P. Determining Genetic Diversity and Population Structure of Common Bean (Phaseolus vulgaris L.) Landraces from Türkiye Using SSR Markers. Genes 2022, 13, 1410. https://doi.org/10.3390/genes13081410
Özkan G, Haliloğlu K, Türkoğlu A, Özturk HI, Elkoca E, Poczai P. Determining Genetic Diversity and Population Structure of Common Bean (Phaseolus vulgaris L.) Landraces from Türkiye Using SSR Markers. Genes. 2022; 13(8):1410. https://doi.org/10.3390/genes13081410
Chicago/Turabian StyleÖzkan, Güller, Kamil Haliloğlu, Aras Türkoğlu, Halil Ibrahim Özturk, Erdal Elkoca, and Peter Poczai. 2022. "Determining Genetic Diversity and Population Structure of Common Bean (Phaseolus vulgaris L.) Landraces from Türkiye Using SSR Markers" Genes 13, no. 8: 1410. https://doi.org/10.3390/genes13081410
APA StyleÖzkan, G., Haliloğlu, K., Türkoğlu, A., Özturk, H. I., Elkoca, E., & Poczai, P. (2022). Determining Genetic Diversity and Population Structure of Common Bean (Phaseolus vulgaris L.) Landraces from Türkiye Using SSR Markers. Genes, 13(8), 1410. https://doi.org/10.3390/genes13081410