Article

Identification of Antitumor miR-30e-5p Controlled Genes; Diagnostic and Prognostic Biomarkers for Head and Neck Squamous Cell Carcinoma

1
Department of Oral Science, Graduate School of Medicine, Chiba University, Chiba 260-8670, Japan
2
Department of Functional Genomics, Chiba University Graduate School of Medicine, Chiba 260-8670, Japan
3
Department of Otorhinolaryngology/Head and Neck Surgery, Chiba University Graduate School of Medicine, Chiba 260-8670, Japan
*
Author to whom correspondence should be addressed.
These two authors contributed equally to this study.
Genes 2022, 13(7), 1225; https://doi.org/10.3390/genes13071225
Submission received: 12 June 2022 / Revised: 5 July 2022 / Accepted: 7 July 2022 / Published: 9 July 2022
(This article belongs to the Special Issue The Ins and Outs of miRNAs as Biomarkers)

Abstract

:
Analysis of microRNA (miRNA) expression signatures in head and neck squamous cell carcinoma (HNSCC) has revealed that the miR-30 family is frequently downregulated in cancer tissues. The Cancer Genome Atlas (TCGA) database confirms that all members of the miR-30 family (except miR-30c-5p) are downregulated in HNSCC tissues. Moreover, low expression of miR-30e-5p and miR-30c-1-3p significantly predicts shorter survival of HNSCC patients (p = 0.0081 and p = 0.0224, respectively). In this study, we focused on miR-30e-5p to investigate its tumor-suppressive roles and its control of oncogenic genes in HNSCC cells. Transient expression of miR-30e-5p significantly attenuated cancer cell migration and invasive abilities in HNSCC cells. Nine genes (DDIT4, FOXD1, FXR1, FZD2, HMGB3, MINPP1, PAWR, PFN2, and RTN4R) were identified as putative targets of miR-30e-5p control. Their expression levels significantly predicted shorter survival of HNSCC patients (p < 0.05). Among those targets, FOXD1 expression appeared to be an independent factor predicting patient survival according to multivariate Cox regression analysis (p = 0.049). Knockdown assays using siRNAs corresponding to FOXD1 showed that malignant phenotypes (e.g., cell proliferation, migration, and invasive abilities) of HNSCC cells were significantly suppressed. Overexpression of FOXD1 was confirmed by immunostaining of HNSCC clinical specimens. Our miRNA-based approach is an effective strategy for the identification of prognostic markers and therapeutic target molecules in HNSCC. Moreover, these findings led to insights into the molecular pathogenesis of HNSCC.

1. Introduction

A head and neck squamous cell carcinoma (HNSCC) may arise in the oral cavity, hypopharynx, nasopharynx, and larynx. Based on Global Cancer Statistics 2018, HNSCC is the eighth most common cancer in the world [1]. Approximately 890,000 people are diagnosed with HNSCC annually, and 450,000 die from the disease [2]. A notable characteristic of HNSCC is that many patients are already in the advanced stage of disease at the time of diagnosis. Treatment strategies are limited for patients at such an advanced stage [3]. Cisplatin-based treatment is selected for patients for whom surgery is not indicated. However, cancer cells develop drug-resistance in the course of treatment [4]. No effective treatments have been reported for patients with HNSCC who have acquired drug resistance [5]. Thus, there is a pressing need for improved understanding of the molecular pathogenesis of HNSCC using the latest genomic science.
The human genome project showed that a vast number of non-coding RNA molecules (ncRNAs) are transcribed and function in normal and diseased cells [6,7]. MicroRNAs (miRNAs), which constitute a class of ncRNA, are single strands of RNA, 19 to 23 bases in length. The unique nature of miRNA is that a single miRNA negatively controls a large number of RNA transcripts (both protein coding RNAs and ncRNAs) in a sequence-dependent manner [8,9]. Therefore, dysregulated miRNA expression can disrupt tightly controlled RNA networks in normal cells. The involvement of aberrantly expressed miRNAs has been reported in a variety of human diseases, including cancer [10].
Over the past decade, a large number of studies have shown that aberrantly expressed miRNAs are closely connected to human oncogenesis [11]. Identifying miRNAs with altered expression in cancer cells is a first step in the characterization of their role. The latest RNA-sequence technology is accelerating the creation of miRNA expression signatures in a variety of cancer types [12]. We have established miRNA expression signatures in several types of cancers, including HNSCC [13,14].
The analysis of miRNA signatures has revealed that members of the miR-30 family are frequently downregulated in several types of cancers, including HNSCC [15,16]. In the human genome, the miR-30 family is composed of five species, i.e., miR-30a to miR-30e. miR-30c is further subdivided into miR-30c-1 and miR-30c-2. The miR-30 family is encoded by six genes located on human chromosomes 1, 6, and 8 [17]. The guide strands of the miR-30 family share the same seed sequence (GUAAACA). The passenger strands of the miR-30 family are divided into two groups according to their seed sequences. The first group (UUUCAGU) includes miR-30a-3p, miR-30d-3p, and miR-30e-3p. The second group (UGGGAG) encompasses miR-30b-3p, miR-30c-1-3p, and miR-30c-2-3p. We theorized that clarifying the targets/pathways controlled by miRNAs for each cancer type could greatly enhance our understanding of the molecular pathogenesis of cancer cells.
The Cancer Genome Atlas (TCGA, https://www.cancer.gov/tcga), a landmark cancer genomics program, molecularly characterizes over 20,000 primary cancers (and matched normal samples) spanning 33 cancer types. Based on a TCGA analysis, all members of the miR-30 family (except miR-30c-5p) are downregulated in HNSCC tissues. Moreover, the low expression of two miRNAs, miR-30e-5p and miR-30c-1-3p, significantly predicts shorter survival of patients with HNSCC (p = 0.0081 and p = 0.0224, respectively).
In this study, we focused on miR-30e-5p and investigated its control of genes involved in the molecular pathogenesis of HNSCC. A total of nine genes (DDIT4, FOXD1, FXR1, FZD2, HMGB3, MINPP1, PAWR, PFN2, and RTN4R) were identified as putative targets of miR-30e-5p. Their expression level predicted shorter survival of the patients (p < 0.05).
Among these genes, we focused on FOXD1 (Forkhead Box D1), which belongs to the forkhead family of transcription factors. Here, we investigated its functional significance in HNSCC cells.
RNA immunoprecipitation (RIP) assays revealed that FOXD1 mRNA was incorporated into the RNA-induced silencing complex (RISC). Additionally, dual luciferase reporter assays showed that miR-30e-5p was directly bound to the 3′-UTR of FOXD1. Functional assays using siRNAs targeting FOXD1 showed that the knockdown of FOXD1 expression attenuated HNSCC cell malignant behaviors (migration and invasion). Our approach will reveal the new insights into the involvement of miRNA and the molecular pathogenesis of HNSCC.

2. Materials and Methods

2.1. Analysis of miRNAs and miRNA Target Genes in HNSCC Patients

The sequences of the miR-30 family were confirmed using miRbase ver. 22.1 (https://www.mirbase.org, accessed on 10 July 2020) [18]. TCGA-HNSC (TCGA, Firehose Legacy) was used to investigate the clinical significance of miRNAs and their target genes. Clinical parameters and gene expression data were obtained from cBioPortal (http://www.cbioportal.org/, data downloaded on 20 August 2020) and OncoLnc (http://www.oncolnc.org/, data downloaded on 20 August 2020) [19,20,21].
The putative target genes with the miR-30-5p binding sites were selected by using TargetScanHuman ver. 7.2 (http://www.targetscan.org/vert_72/, accessed on 22 November 2020) [22].
To identify differentially expressed genes in HNSCC tissues, a newly created microarray data (accession number: GSE180077) was used in this study. Three hypopharyngeal squamous cell carcinoma (HSCC) tissues, three normal hypopharyngeal tissues, and two cervical lymph nodes harvested from one HSCC patient who underwent surgical resection at Chiba University Hospital were subjected to Agilent whole genome microarrays. In this study, we compared gene expressions in cancer tissues with those in normal tissues. The clinical information of this patient was summarized in Table S1.

2.2. HNSCC Cell Lines

Two human HNSCC cell lines were obtained from the RIKEN BioResource Center (Tsukuba, Ibaraki, Japan). Sa3 was harvested from upper gingiva cancer of 63y male. SAS was harvested from oral tongue cancer of 69y female.

2.3. RNA Extraction and Quantitative Real-Time Reverse-Transcription PCR (qRT-PCR)

Total RNA was isolated using TRIzol reagent (Invitrogen, Waltham, MA, USA) according to the manufacturer’s protocol. qRT-PCR was performed using the High-Capacity cDNA Reverse Transcription Kit (Applied Biosystems, Waltham, MA, USA) and the StepOnePlus™ Real-Time PCR System (Applied Biosystems). Gene expressions were quantified relatively by the delta-delta Ct method (used GAPDH as internal control). Taqman assays used in this study are summarized in Table S2.

2.4. Transfection of miRNAs and siRNAs into HNSCC Cells

The protocols used for transient transfection of miRNAs and siRNAs were described in our previous studies [23,24,25,26]. The miRNA precursors and siRNAs used in this report were detailed in Table S2. The miRNAs and siRNAs were transfected into HNSCC cell lines using Opti-MEM (Gibco, Carlsbad, CA, USA) and LipofectamineTM RNAiMax Transfection Reagent (Invitrogen, Waltham, MA, USA). All miRNA precursors were transfected into HNSCC cell lines at 10 nM, and siRNAs were transfected at 5 nM. Mock transfection consisted of cells without precursors or siRNAs. Control groups were transfected with the negative control precursor.

2.5. RIP Assay

The procedures for the RIP assay have been described previously [23]. Briefly, SAS cells were cultured in 10-cm plates at 80% confluency. Negative control miRNA precursors and miR-30e-5p precursors were transfected. After 6 h, immunoprecipitation was performed using the MagCaptureTM microRNA Isolation Kit, Human Ago2, obtained from FUJIFILM Wako Pure Chemical Corporation (Wako, Osaka, Japan) according to the manufacturer’s protocol. Expression levels of FOXD1 bound to Ago2 were measured by qRT-PCR. Taqman primers used in the assay are summarized in Table S2.

2.6. Functional Assays of HNSCC Cells (Cell Proliferation, Migration, and Invasion Assays)

The procedures for conducting functional assays (cell proliferation, migration, and invasion assays) with HNSCC cells were described in earlier publications [23,24,25,26]. In brief, for proliferation assays, Sa3 or SAS cells were transferred to 96-well plates at 3.0 × 10³ cells per well. Cell proliferation was evaluated using the XTT assay kit II (Sigma–Aldrich, St. Louis, MO, USA) 72 h after the transfection procedure. For migration and invasion assays, Sa3 and SAS cells were transfected in 6-well plates at 2.0 × 10⁵ cells per well. After 48 h, transfected Sa3 and SAS cells were added into each chamber at 1.0 × 10⁵ per well. Corning BioCoatTM cell culture chambers (Corning, Corning, NY, USA) were used for migration assays whereas Corning BioCoat Matrigel Invasion Chambers were used for invasion assays. After 48 h, the cells on the lower surface of chamber membranes were stained and counted for analysis. All experiments were performed in triplicate.

2.7. Plasmid Construction and Dual-Luciferase Reporter Assays

The procedures for plasmid construction and the dual-luciferase reporter assays were outlined previously [23,24,25,26]. Briefly, a partial wild-type sequence, including the seed sequence of FOXD1 within the 3′-untranslated region (3′-UTR), was inserted into the psiCHECK-2 vector (C8021; Promega, Madison, WI, USA). Alternatively, a deletion type that was missing the miR-30e-5p target site was synthesized. These synthesized vectors (50 ng) were transfected into 1.0 × 10⁵ cells in each well using Lipofectamine 2000 (Invitrogen, Waltham, MA, USA) and Opti-MEM. After 48 h of transfection, dual luciferase reporter assays using the Dual Luciferase Reporter Assay System (Promega, Madison, WI, USA) were conducted. Luminescence data were presented as the Renilla/Firefly luciferase activity ratio.

2.8. Immunohistochemistry

The procedures for immunohistochemistry were described in our previous studies [23,24,25,26]. The clinical samples were obtained from HNSCC cases who received surgical treatment at Chiba University Hospital. The slides were incubated with primary antibody FOXD1 (1: 50, PA5-27142, Thermo Fisher Scientific, Waltham, MA, USA). The clinical features are shown in Table S3. The reagents used in the analysis are listed in Table S2.

2.9. Gene Set Enrichment Analysis (GSEA)

To analyze the molecular pathways related to FOXD1 (regulated by miR-30e-5p), GSEA was performed. Using TCGA-HNSC data, HNSCC patients were divided into high and low expression groups according to the Z-score of the FOXD1 expression level. A ranked list of genes was generated by the log2 ratio comparing the expression levels of each gene between the two groups. The ranked gene list was uploaded into GSEA software [27,28] and we applied the Hallmark gene set in The Molecular Signatures Database [27,29].

2.10. Statistical Analysis

Statistical analyses were determined using JMP Pro 15 (SAS Institute Inc., Cary, NC, USA). Welch’s t-tests were performed to determine the significance of differences between two groups. Dunnett’s tests were applied for comparisons among multiple groups. For correlation analyses, Spearman’s test was applied. Survival analyses were analyzed by log-rank test. Each expression levels of target genes, age, disease stage, and pathological grade in TCGA-HNSC were used as variables for Cox’s proportional hazards model. A p-value less than 0.05 was considered statistically significant.

3. Results

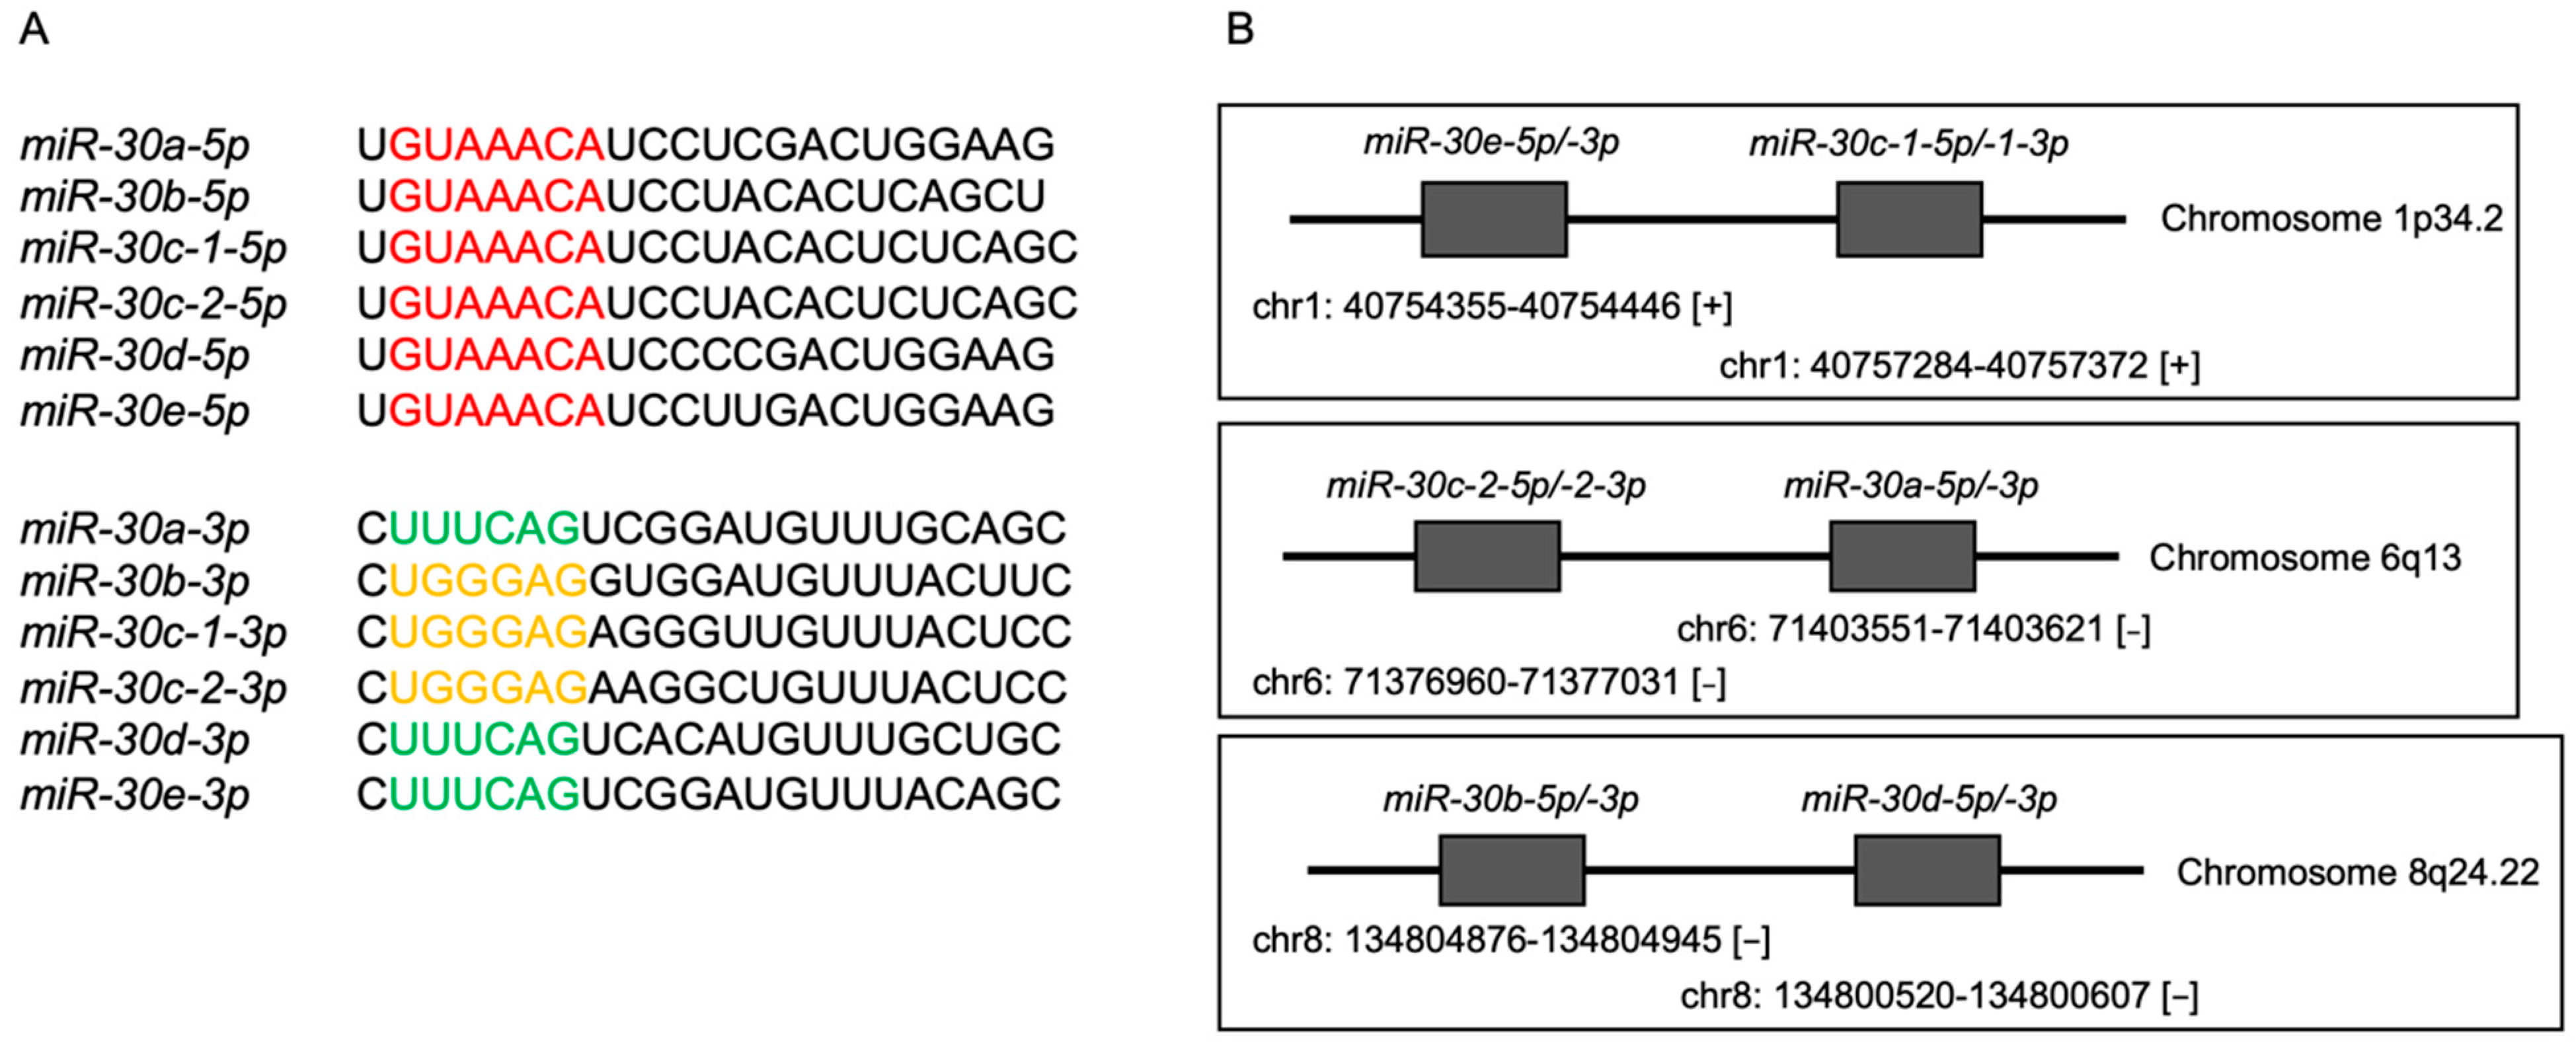
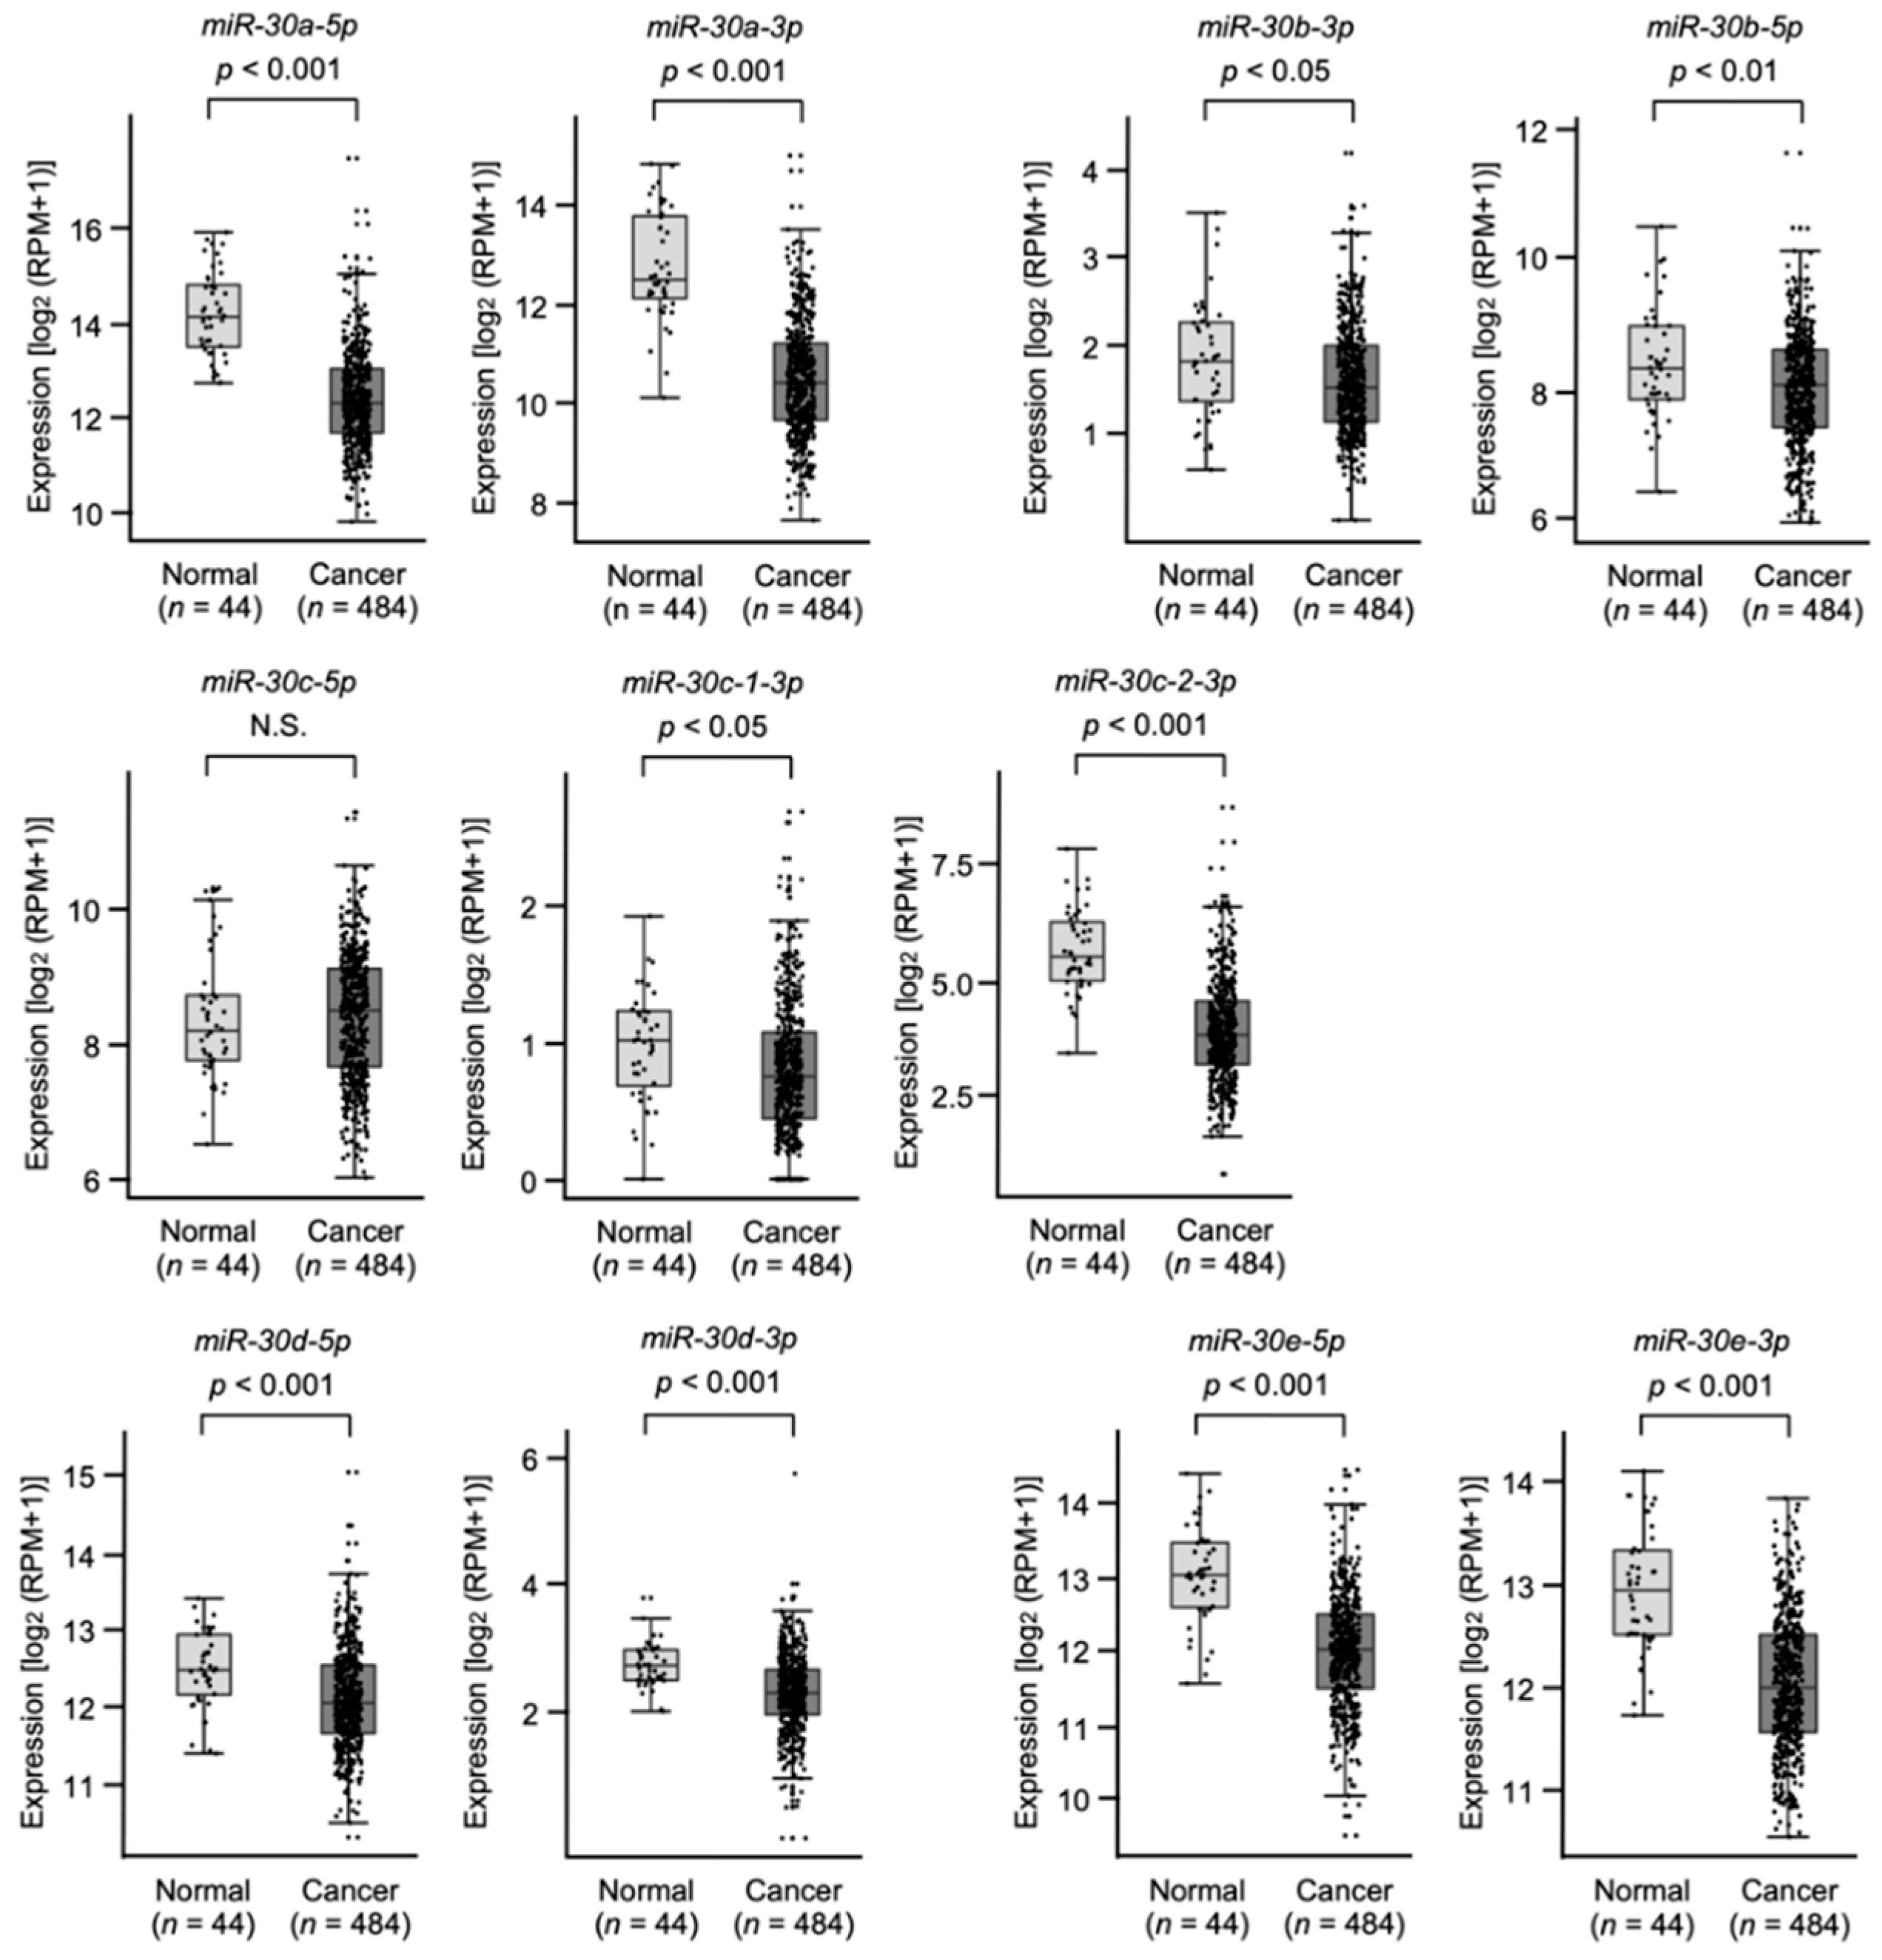
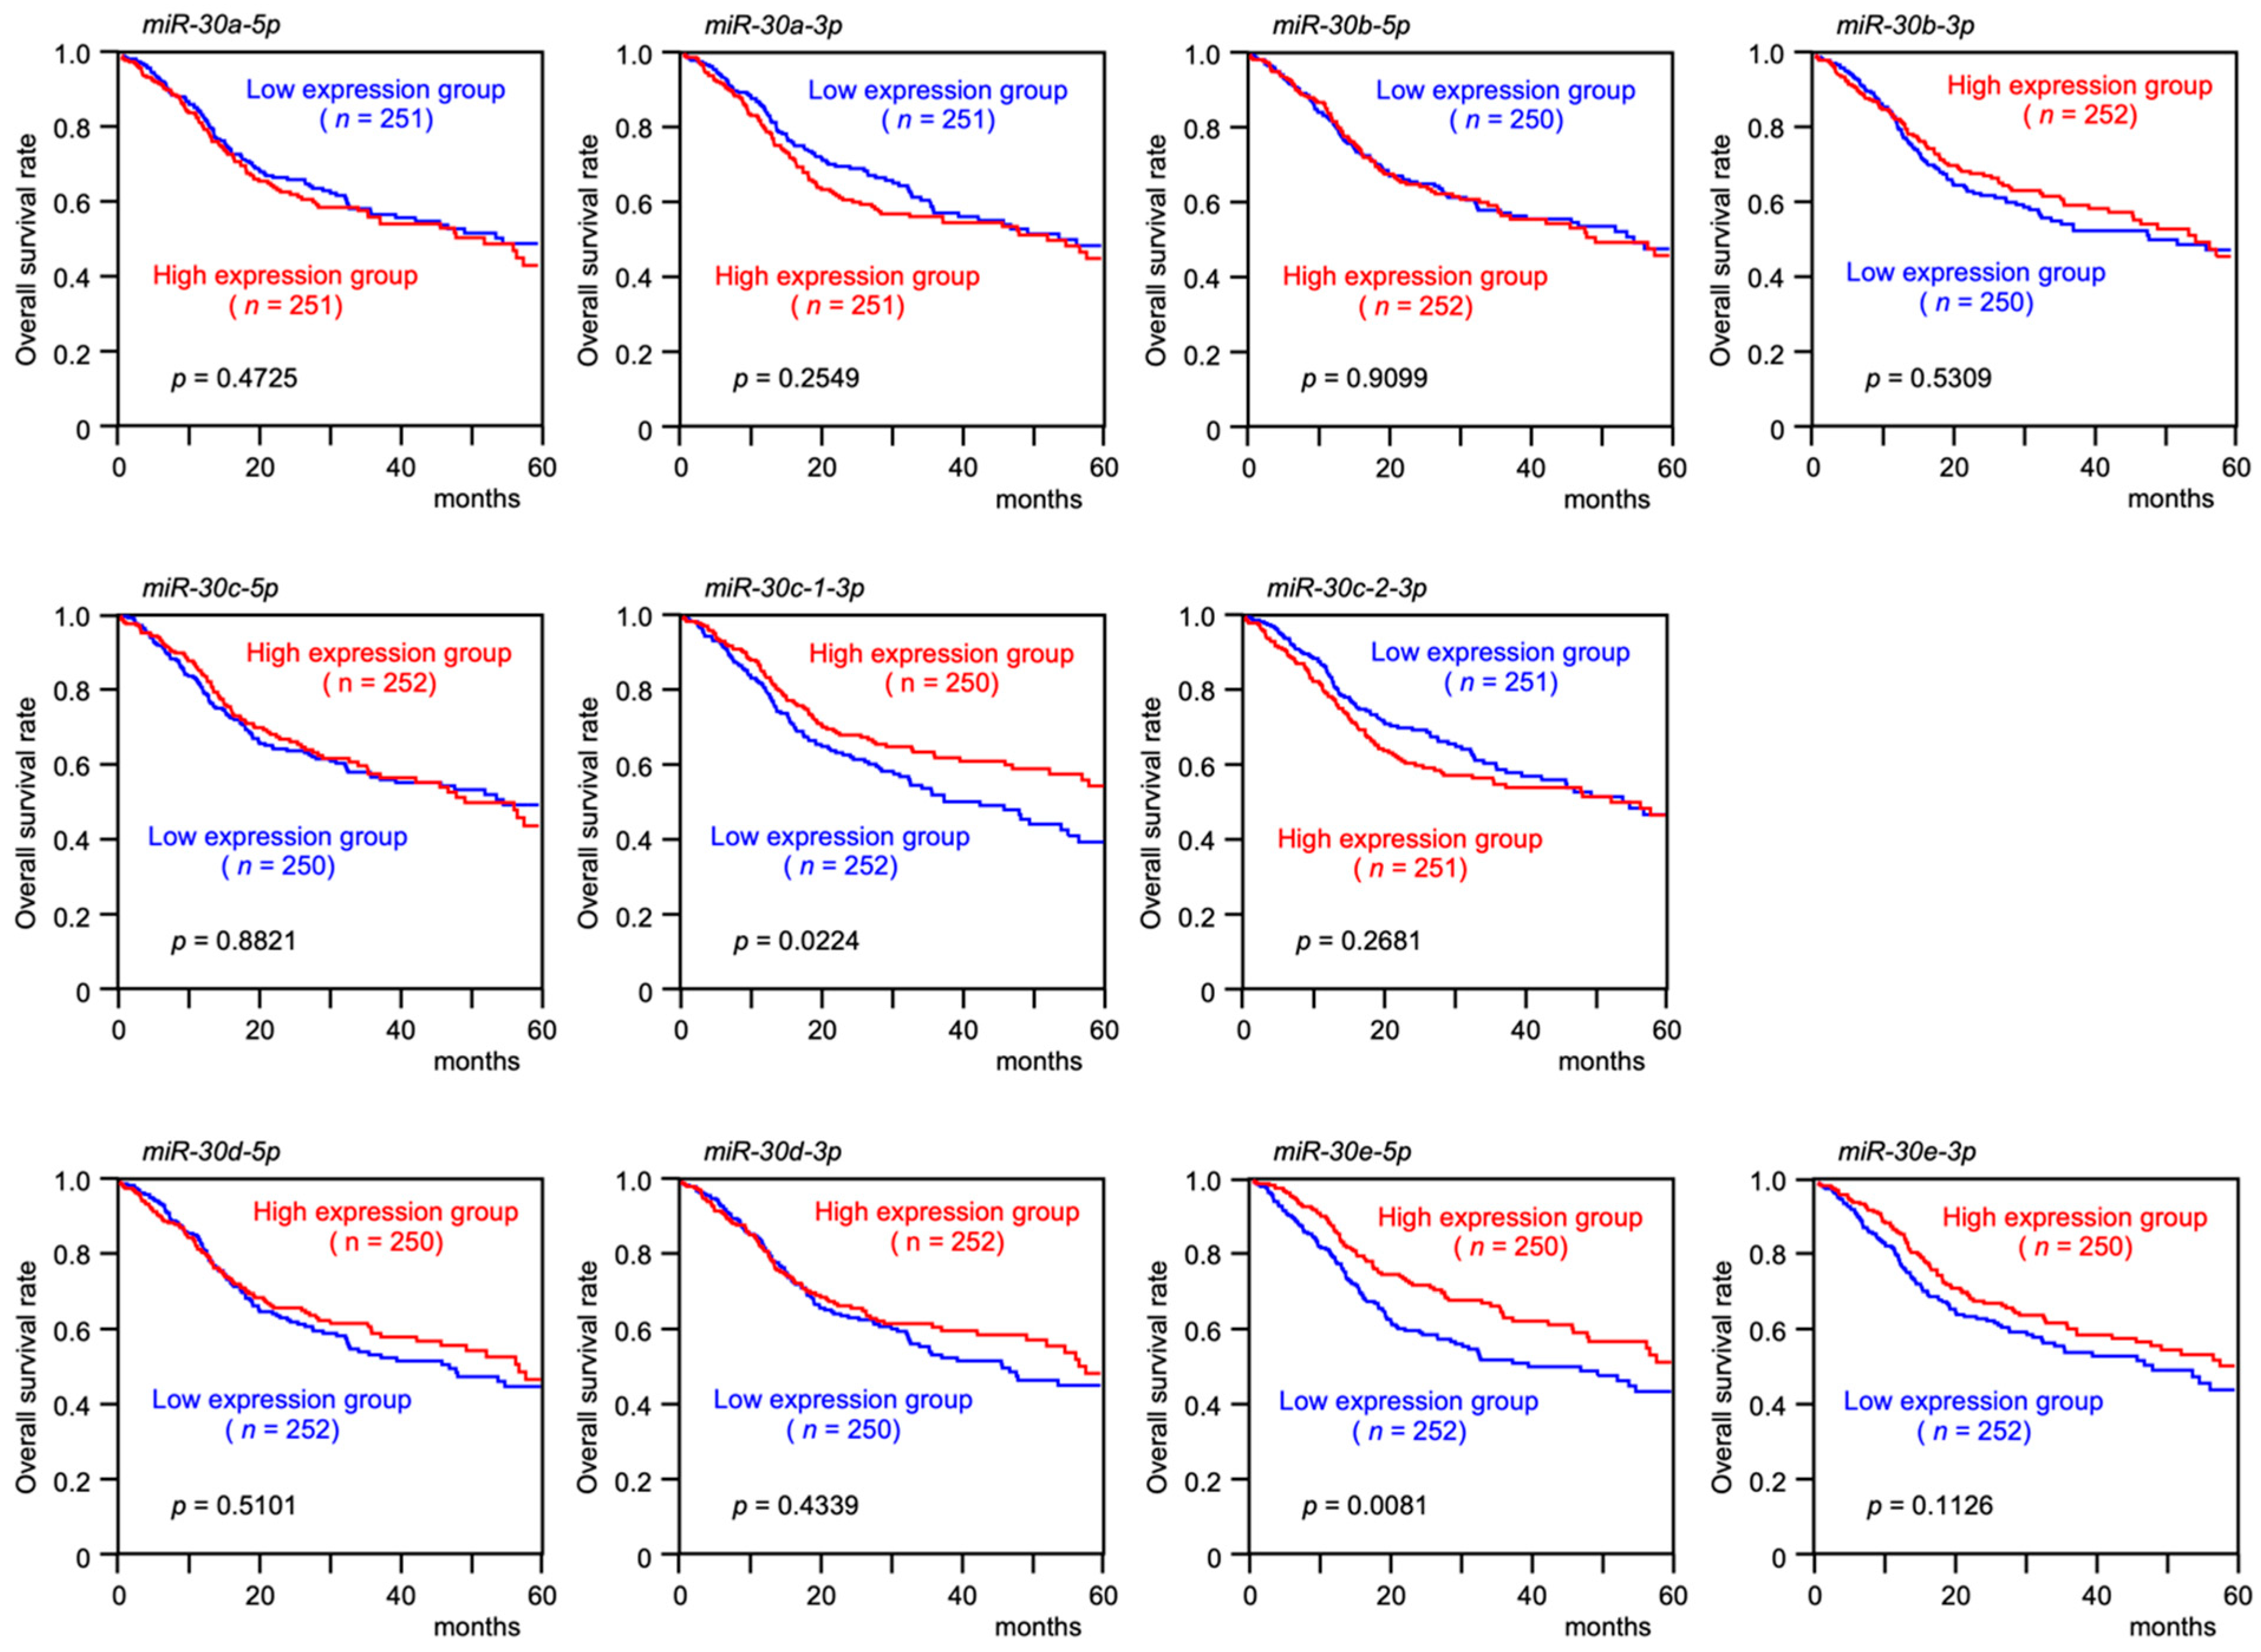
3.1. Expression Levels and the Clinical Significance of the miR-30 Family in HNSCC Clinical Specimens Assessed by TCGA Analysis

The human miR-30 family consists of 12 members. They include miR-30a-5p, miR-30a-3p, miR-30b-5p, miR-30b-3p, miR-30c-1-5p, miR-30c-1-3p, miR-30c-2-5p, miR-30c-2-3p, miR-30d-5p, miR-30d-3p, miR-30e-5p, and miR-30e-3p. Seed sequences of miR-30-5p are identical. In contrast, two types of seed sequences are present in miR-30-3p (Figure 1A). Human miR-30e and miR-30c-1 are located on chromosome 1p34.2, whereas miR-30c-2 and miR-30a are on chromosome 6q13, and miR-30b and miR-30d are found on chromosome 8q24.22 (Figure 1B).
Expression levels of all members of the miR-30 family were validated by TCGA database analyses. All members of the miR-30 family (except for miR-30c-5p) were significantly downregulated in HNSCC tissues (n = 484) compared to normal tissues (n = 44) (Figure 2).
Moreover, low expression of miR-30e-5p and miR-30c-1-3p significantly predicted poor prognosis of patients with HNSCC (Figure 3). Expression levels of other members of the miR-30 family were not related to patient prognosis (Figure 3).

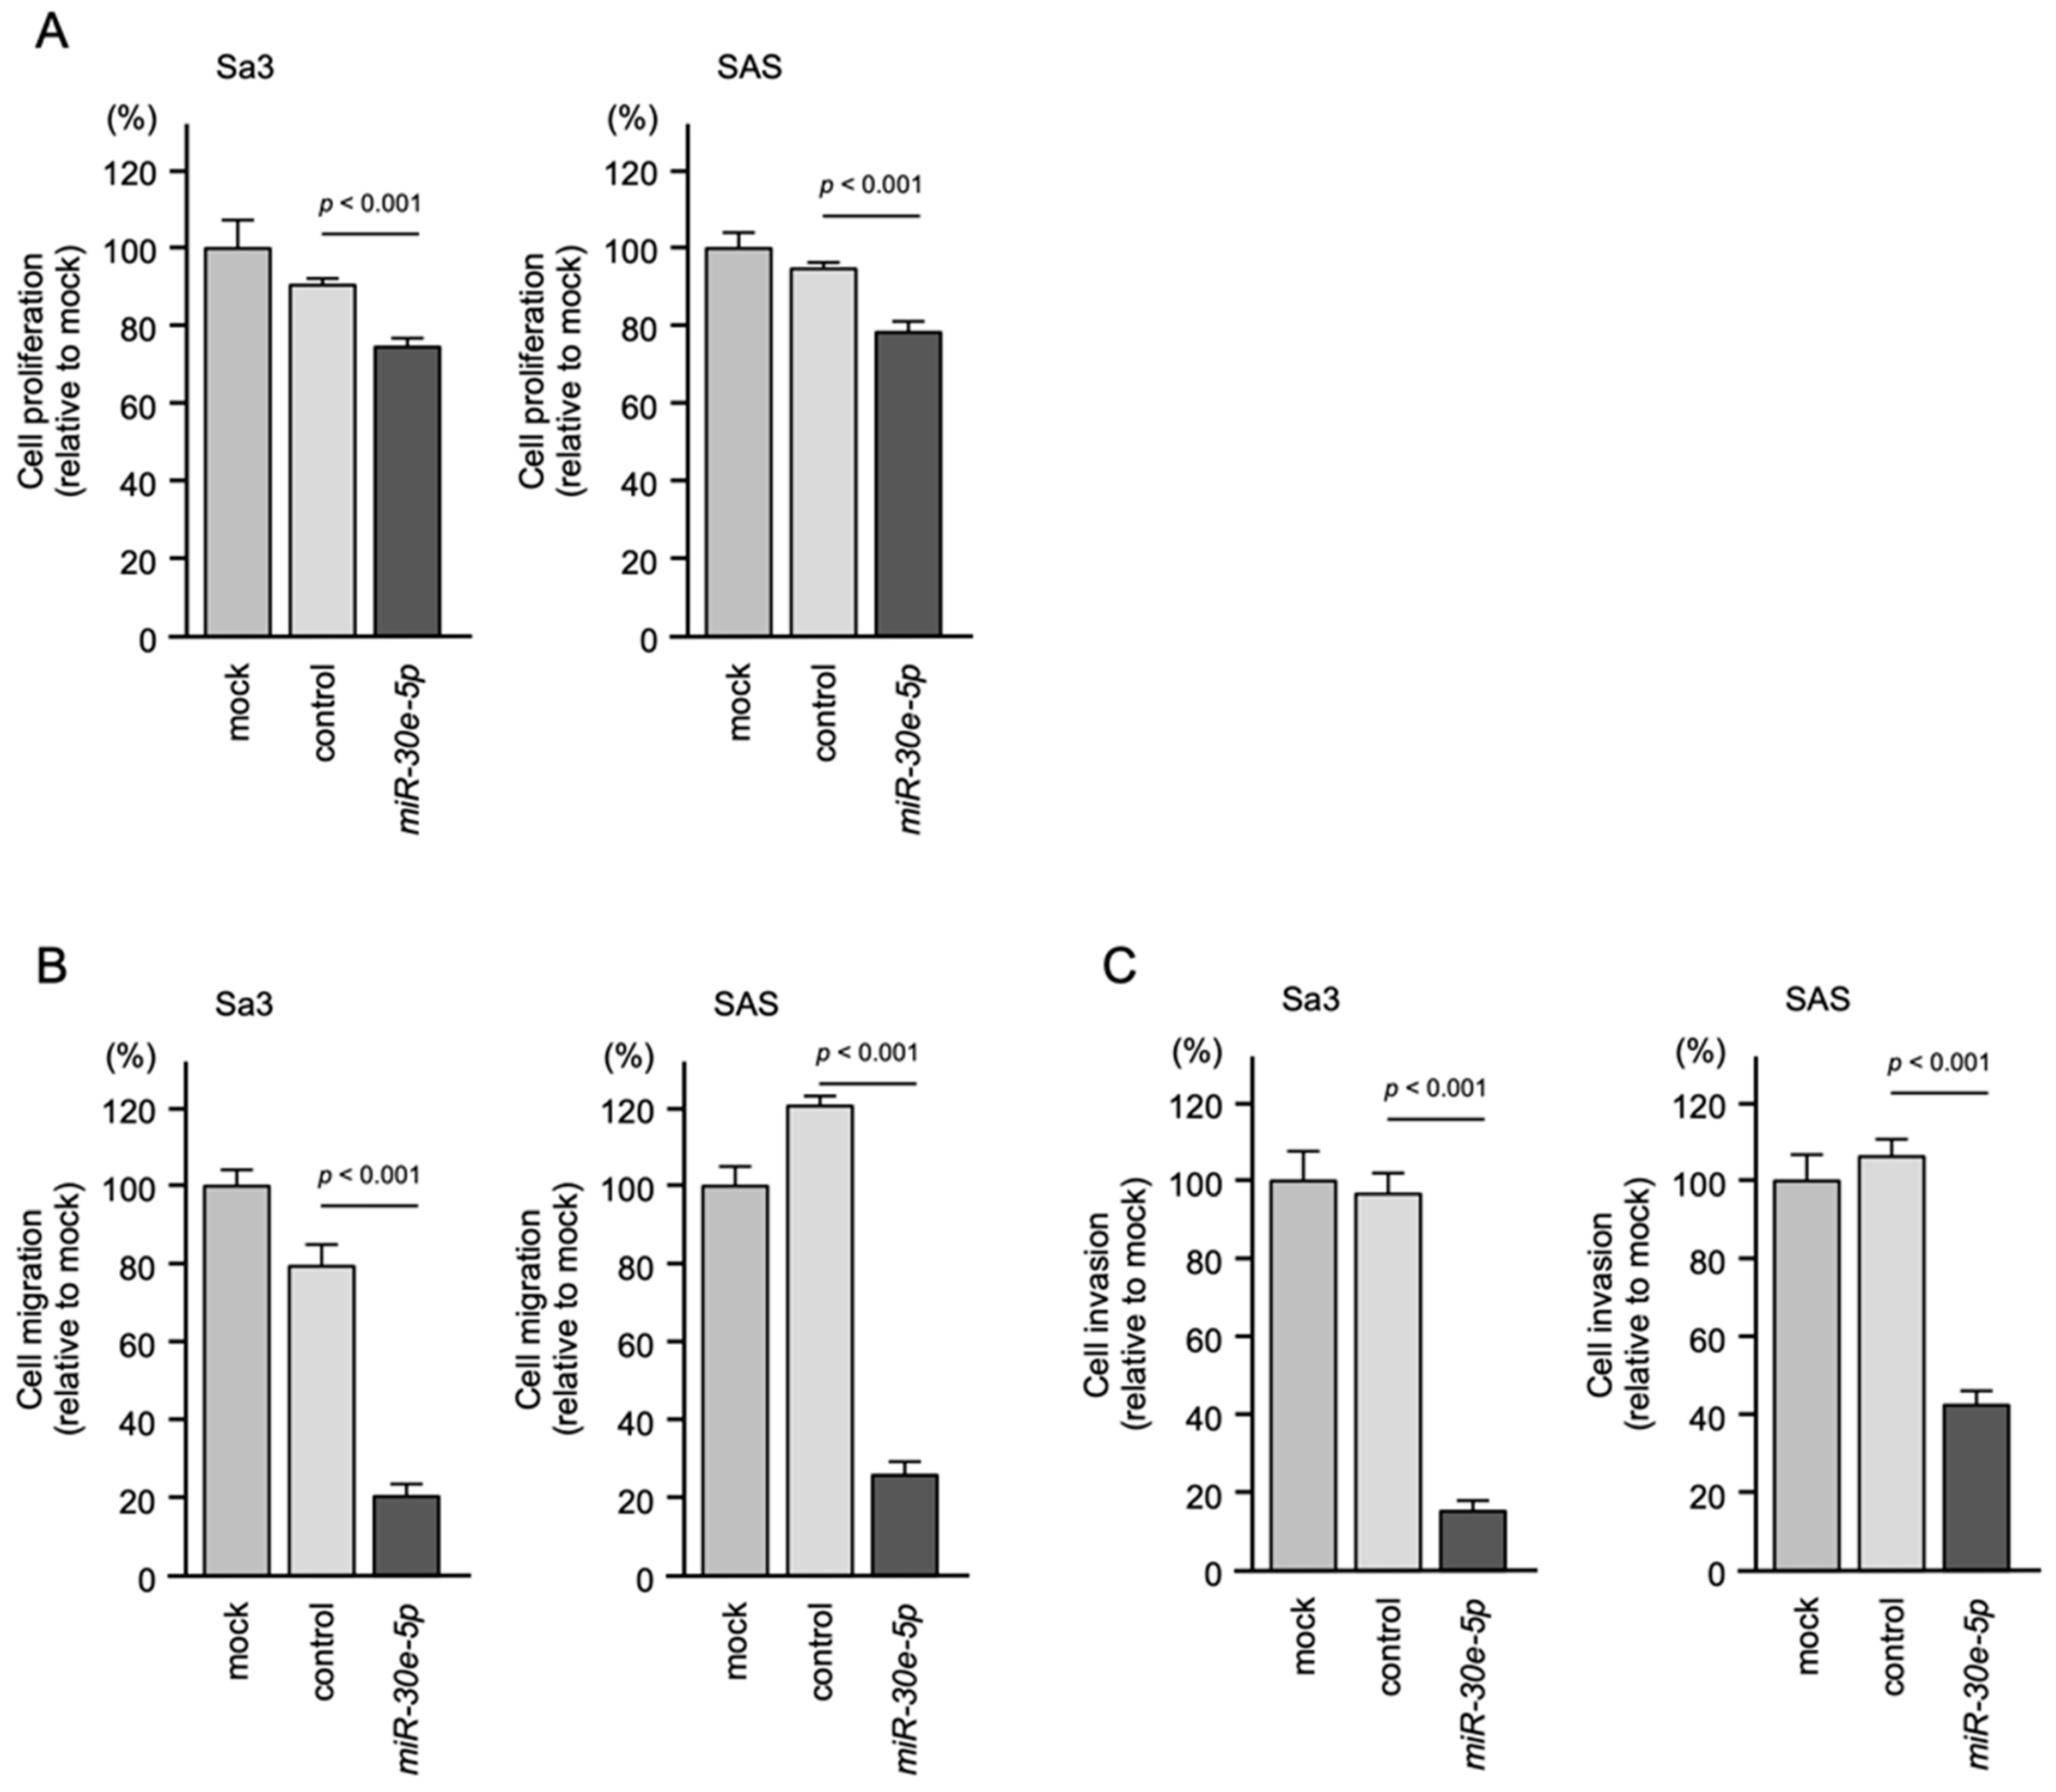
3.2. Effect of Transient Transfection of miR-30e-5p on HNSCC Cell Proliferation, Migration and Invasion

In this study, we focused on miR-30e-5p because its expression was significantly downregulated in HNSCC tissues, and it was closely associated with poor prognosis of the patients, suggesting that miR-30e-5p acts as a tumor-suppressive miRNA in HNSCC cells.
The tumor-suppressive roles of miR-30e-5p were assessed by transient transfection of miR-30e-5p in two cell lines, Sa3 and SAS. Transient transfection of miR-30e-5p inhibited HNSCC cell proliferation (Figure 4A). Cancer cell migration and invasive abilities were markedly blocked by miR-30e-5p expression in Sa3 and SAS cells (Figure 4B,C). Photographs of typical results from the migration and invasion assays are shown in Figure S1.

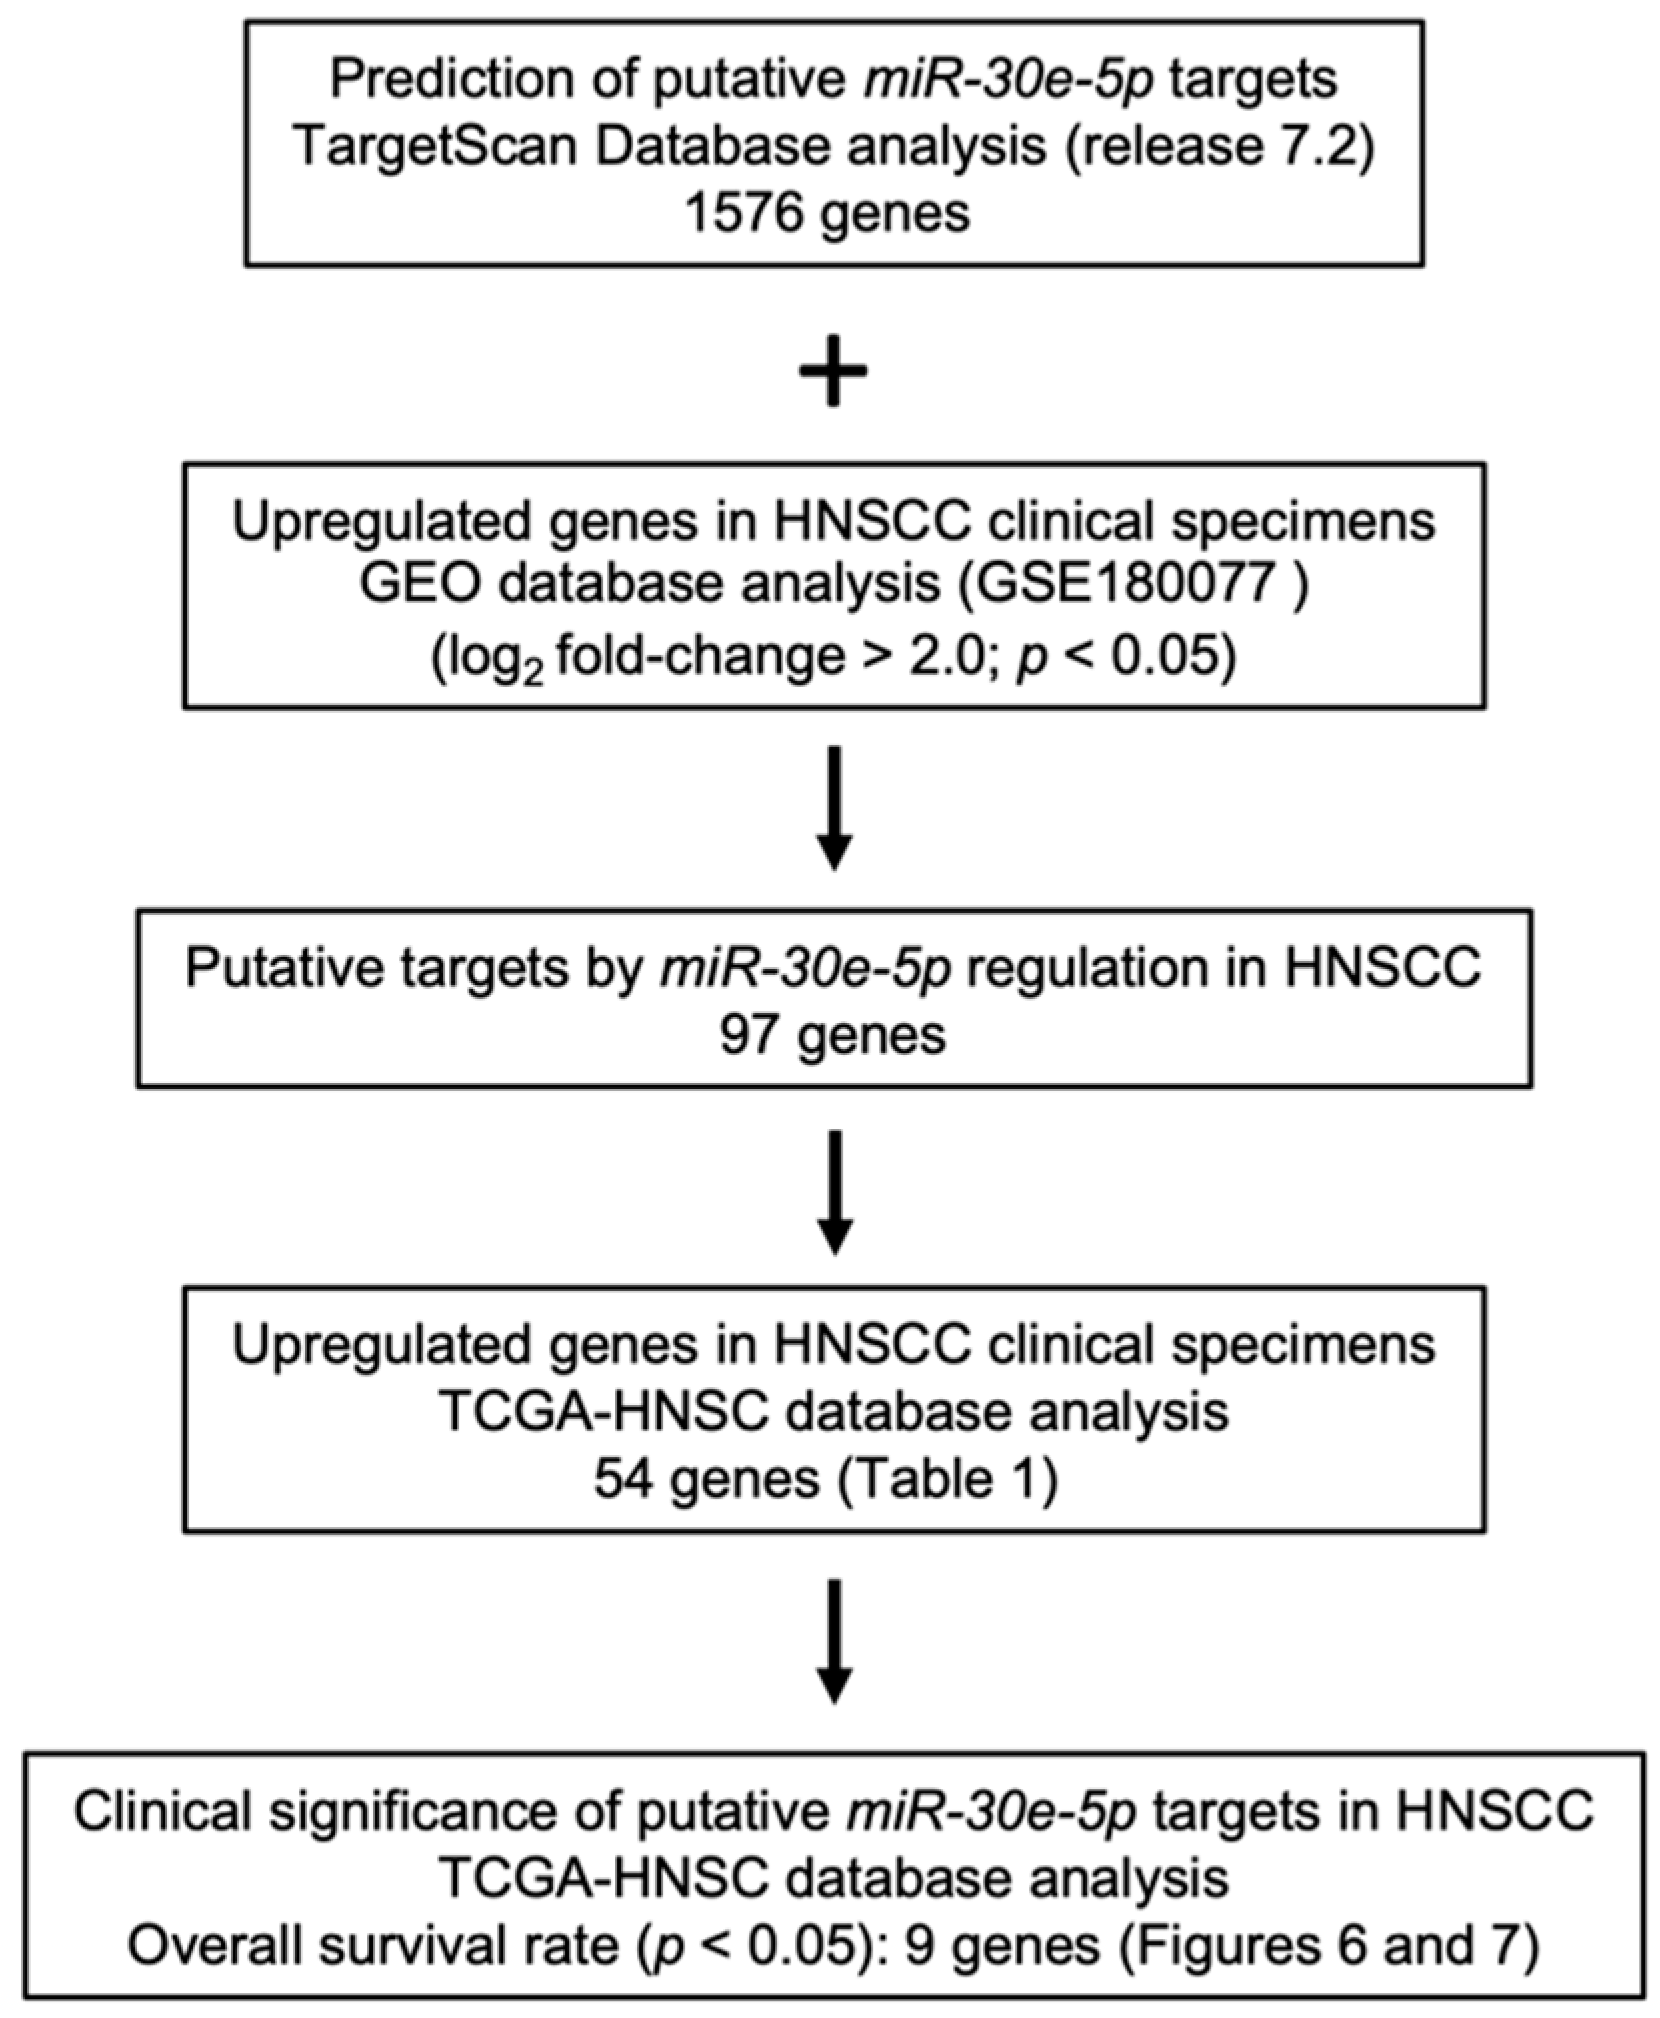
3.3. Screening for Oncogenic Targets of miR-30e-5p in HNSCC

To identify genes modulated by miR-30e-5p that were closely involved in HNSCC molecular pathogenesis, we performed in silico database analyses combined with our gene expression data. We created new gene expression data using clinical specimens of hypopharyngeal squamous cell carcinoma (HSCC). Three HSCC tissues, three normal hypopharyngeal tissues, and two cervical lymph nodes harvested from one HSCC patient who underwent surgical resection at Chiba University Hospital were subjected to Agilent whole genome microarrays. In this study, we compared gene expressions in cancer tissues with those in normal tissues. The clinical information of this patient was summarized in Table S1. Expression data were deposited in the GEO database (accession number: GSE180077). Our selection strategy is shown in Figure 5.
TargetScan Human database (release 7.2) provides data on the putative targets of miR-30e-5p. A total of 1576 genes are listed. Among these targets, 97 genes were upregulated in HSCC patients. Furthermore, the increased expression of 54 genes was confirmed in TCGA database analyses (Table 1).

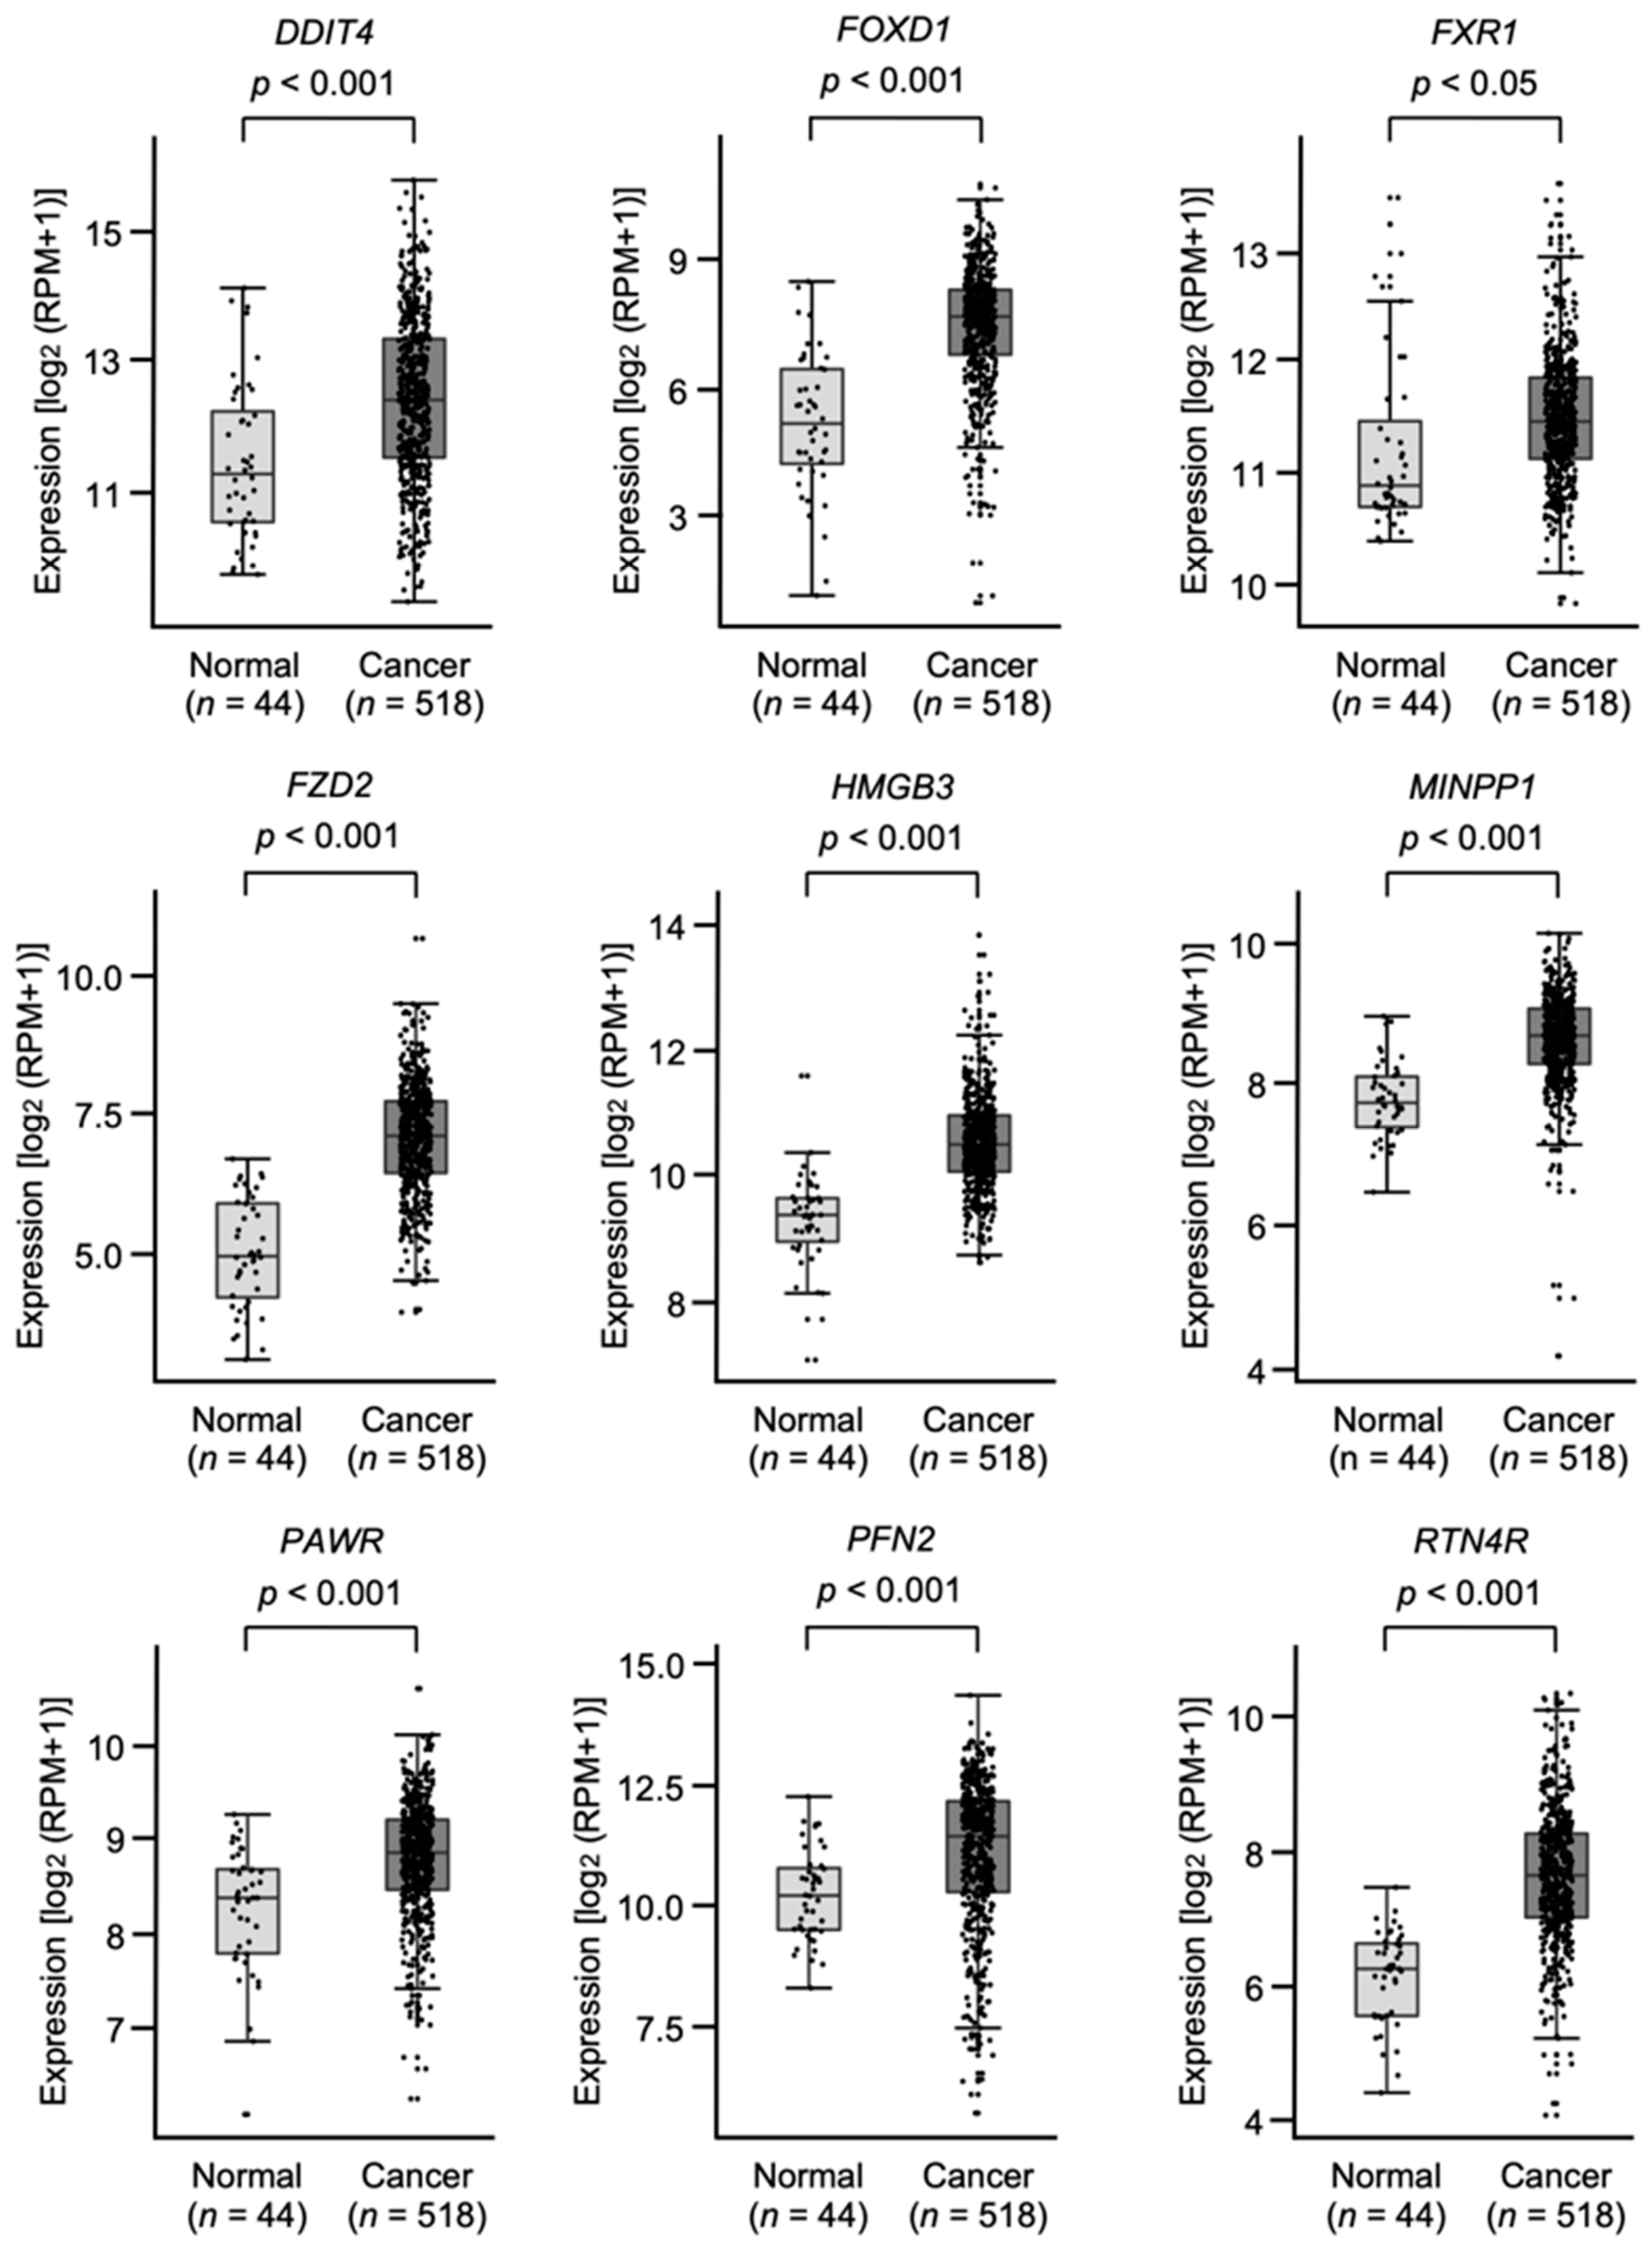
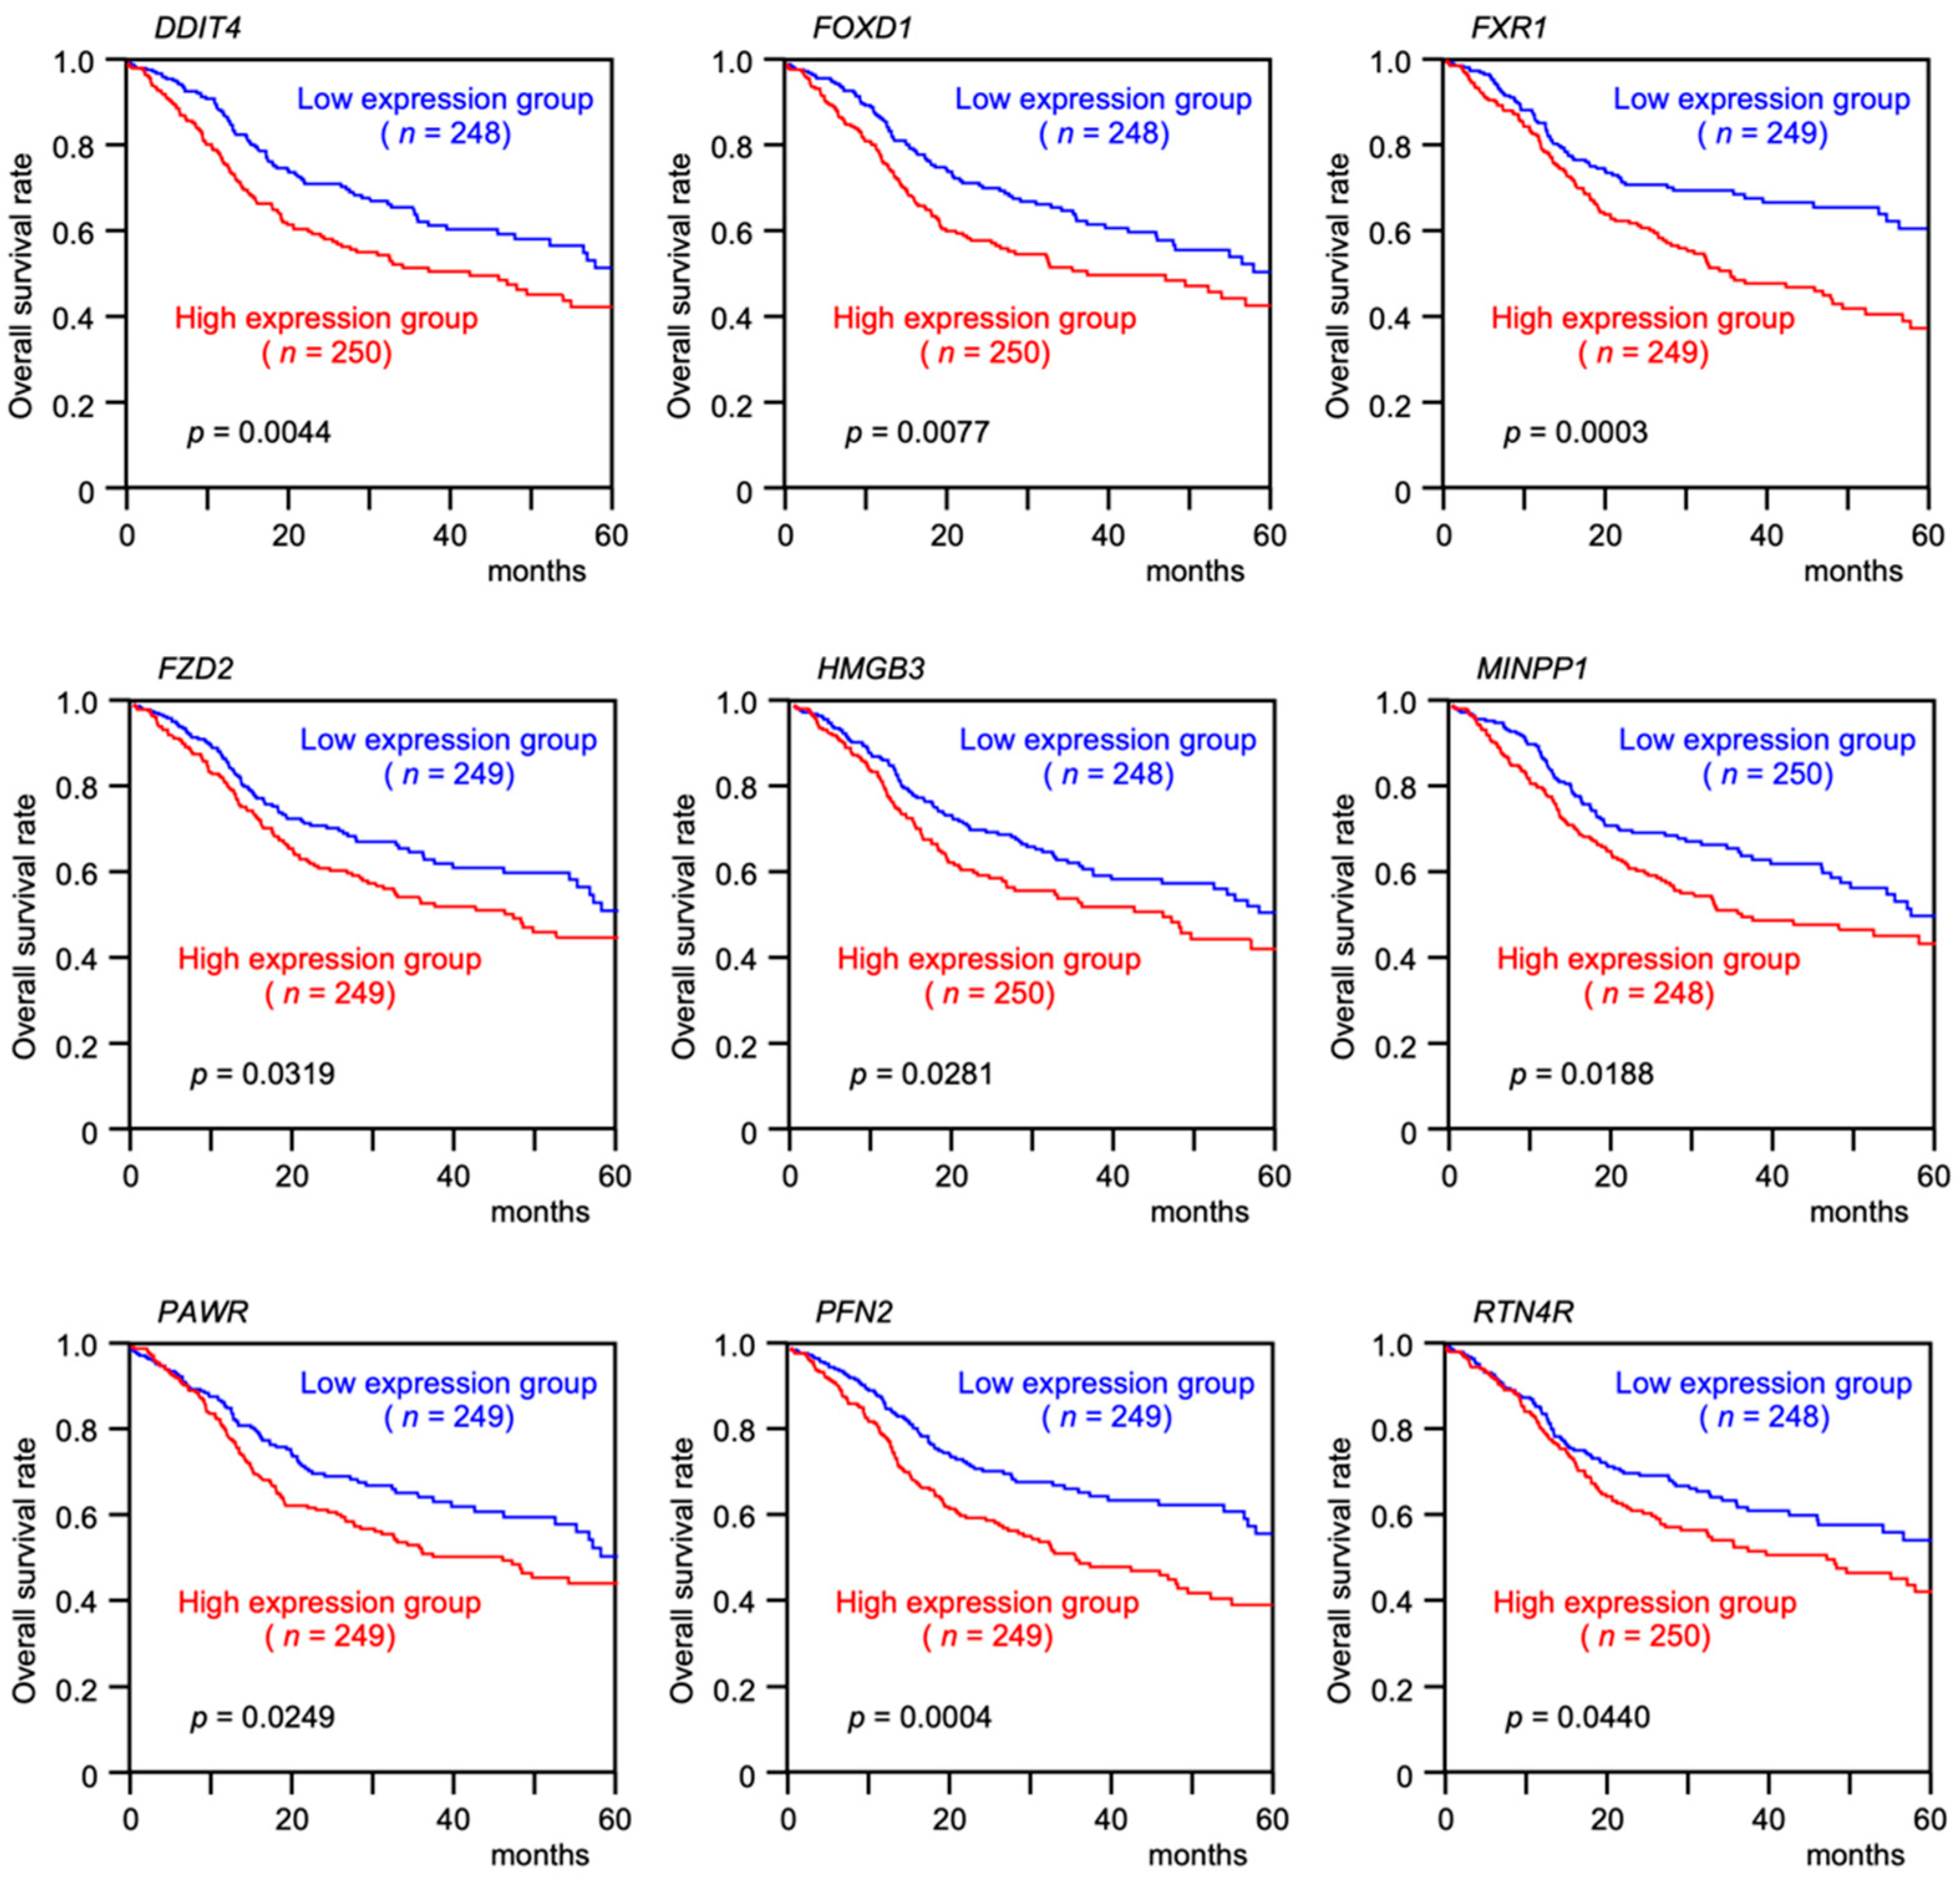
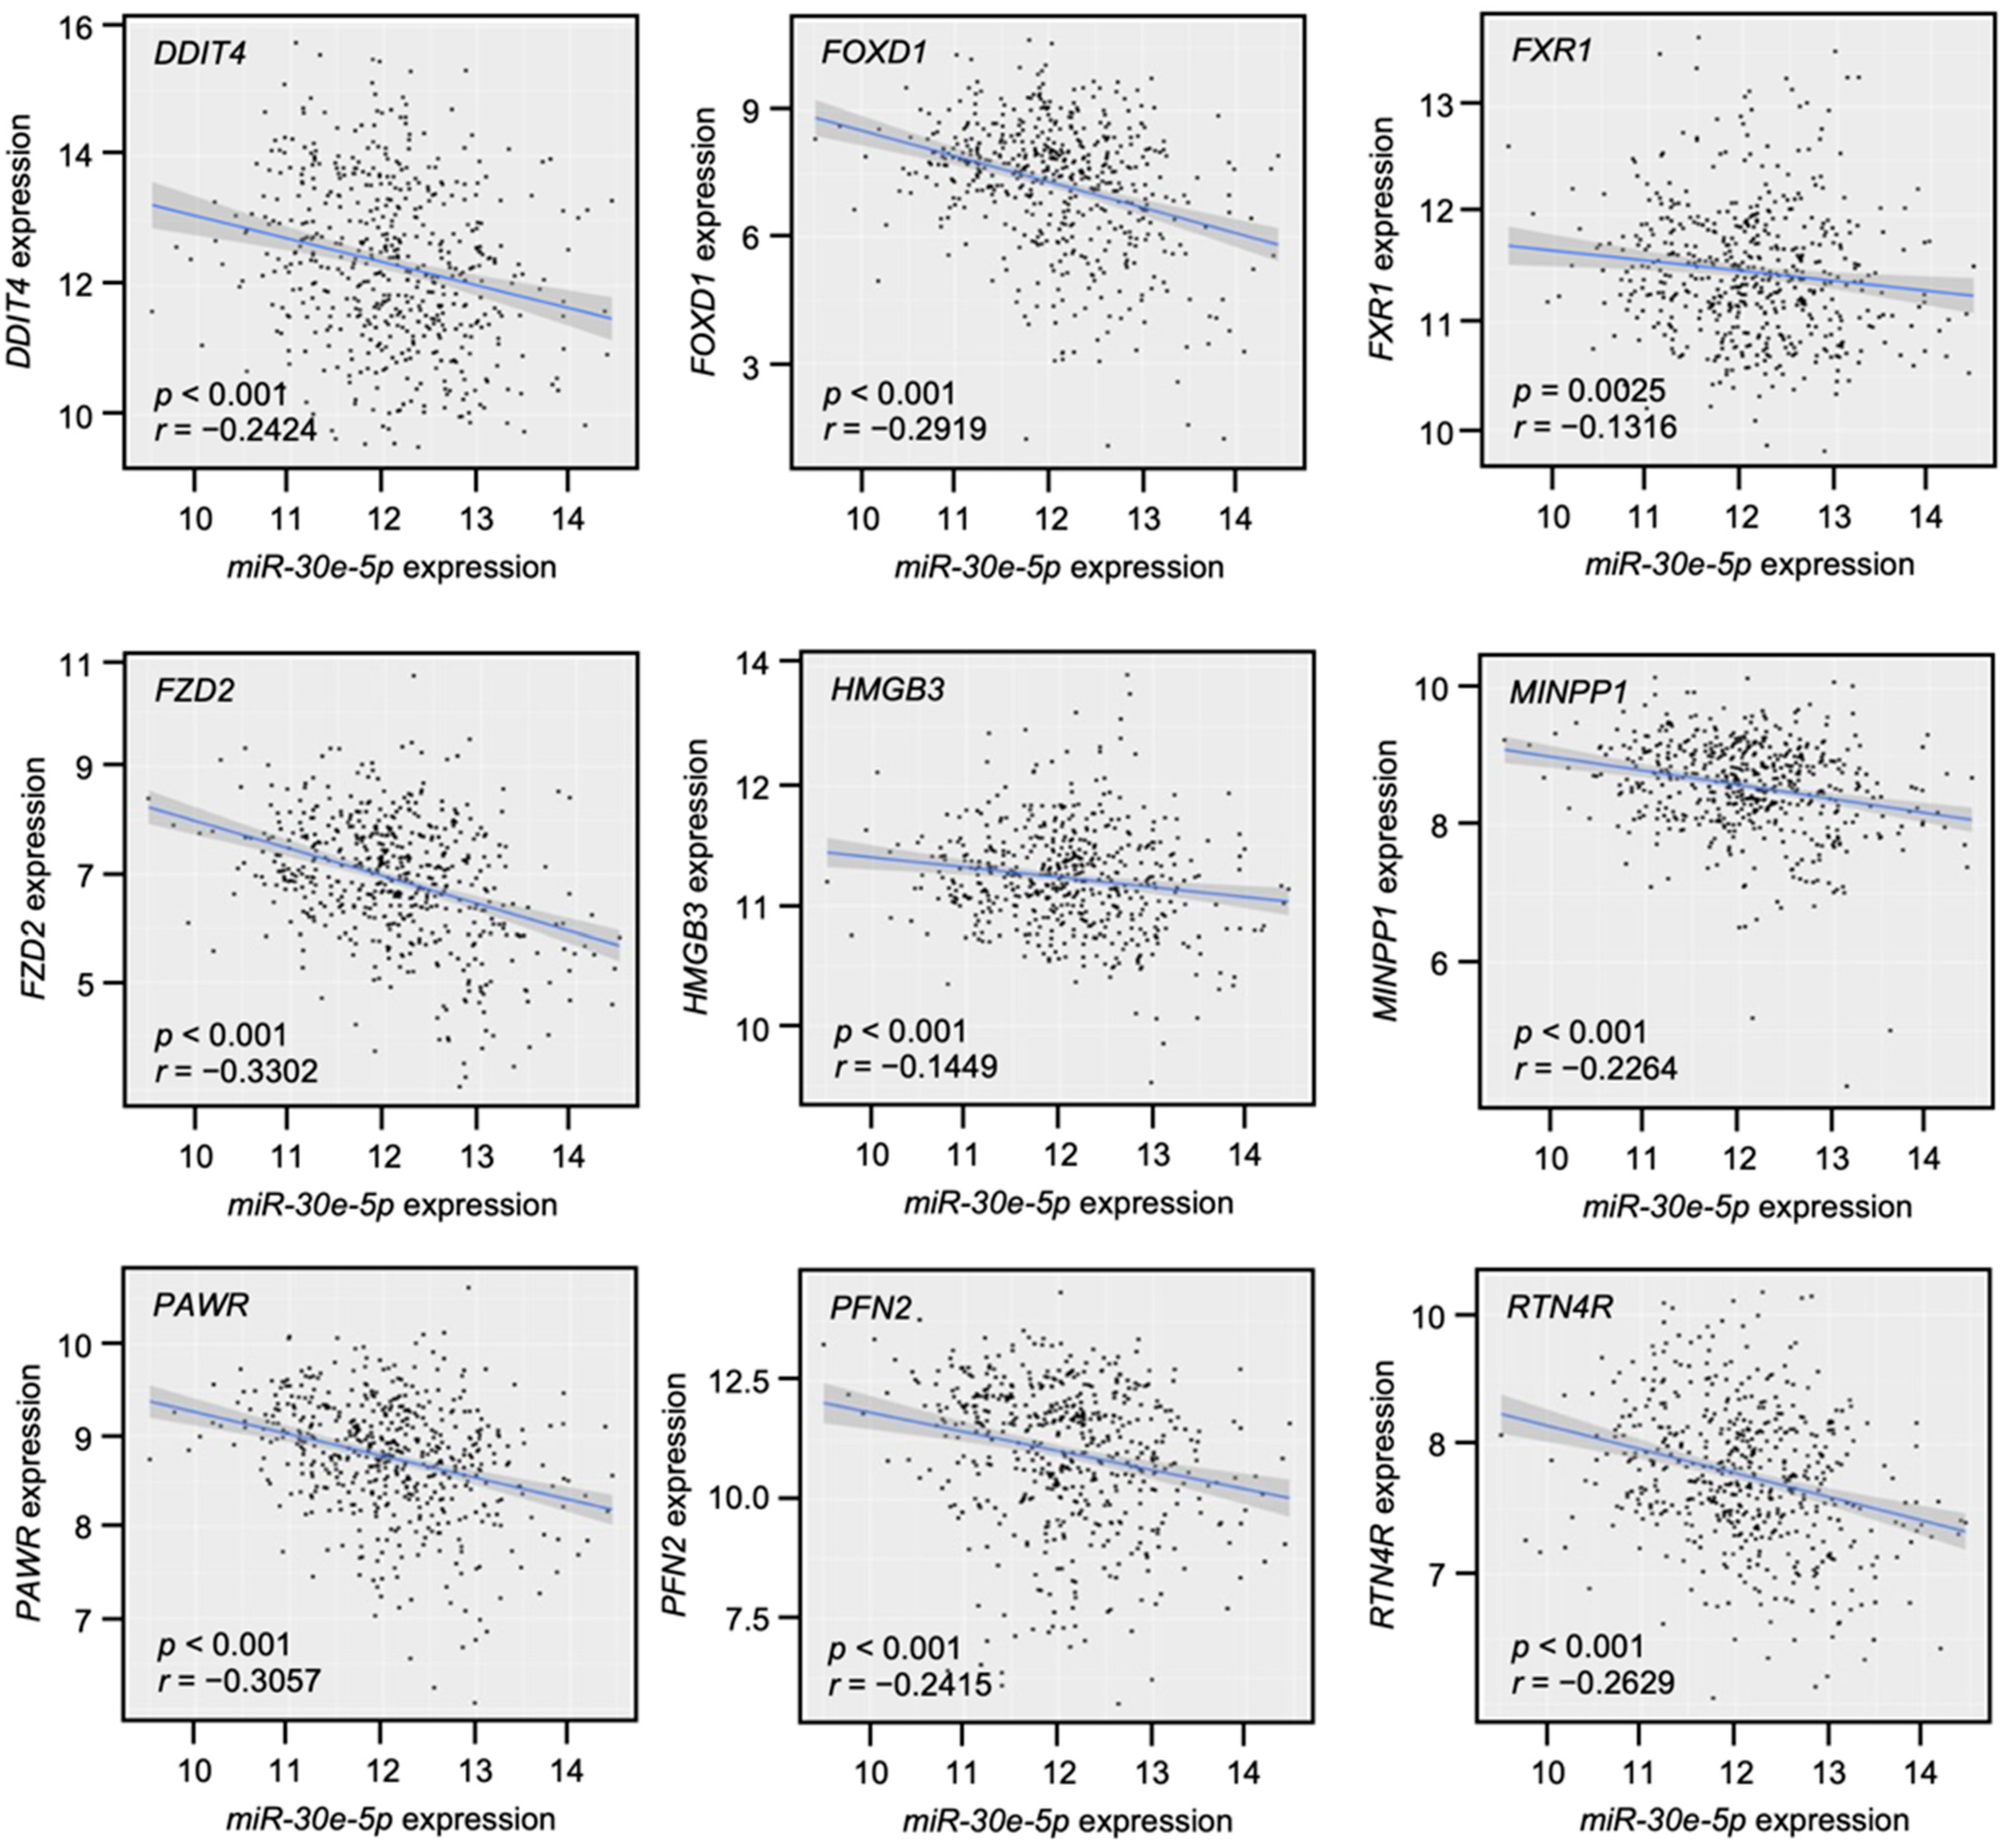
3.4. Clinical Significance of miR-30e-5p Targets in Patients with HNSCC Determined by TCGA Analysis

Among the 54 putative target genes, high expression of nine genes (DDIT4, FOXD1, FXR1, FZD2, HMGB3, MINPP1, PAWR, PFN2, and RTN4R) showed statistically significant correlations with the 5-year overall survival frequencies of patients with HNSCC (p < 0.05; Figure 6 and Figure 7).
Therefore, univariate analysis for 5-year overall survival was conducted first, and then multivariate analysis was performed for the statistically significant variables (p < 0.05). Each expression levels of target genes, age, disease stage, and pathological grade in TCGA-HNSC were used as variables for Cox’s proportional hazards model. As a result, the high expression level of FOXD1 (HR: 1.374, 95% CI: 1.002–1.890, p = 0.049), age (≥70) (HR: 1.922, 95% CI: 1.369–2.698, p < 0.001) and disease stage (III and IV) (HR: 1.774, 95% CI: 1.159–2.716, p = 0.008) were independent prognostic factors (Table 2).
The correlations of the expression levels between these nine genes and miR-30e-5p were evaluated by TCGA-HNSC. A Spearman’s rank test confirmed weak negative correlations in seven genes (DDIT4, FOXD1, FZD2, MINPP1, PAWR, PFN2, and RTN4R) (p < 0.001, r < −0.2, Figure 8), whereas the correlations were not confirmed in FXR1 and HMGB3.

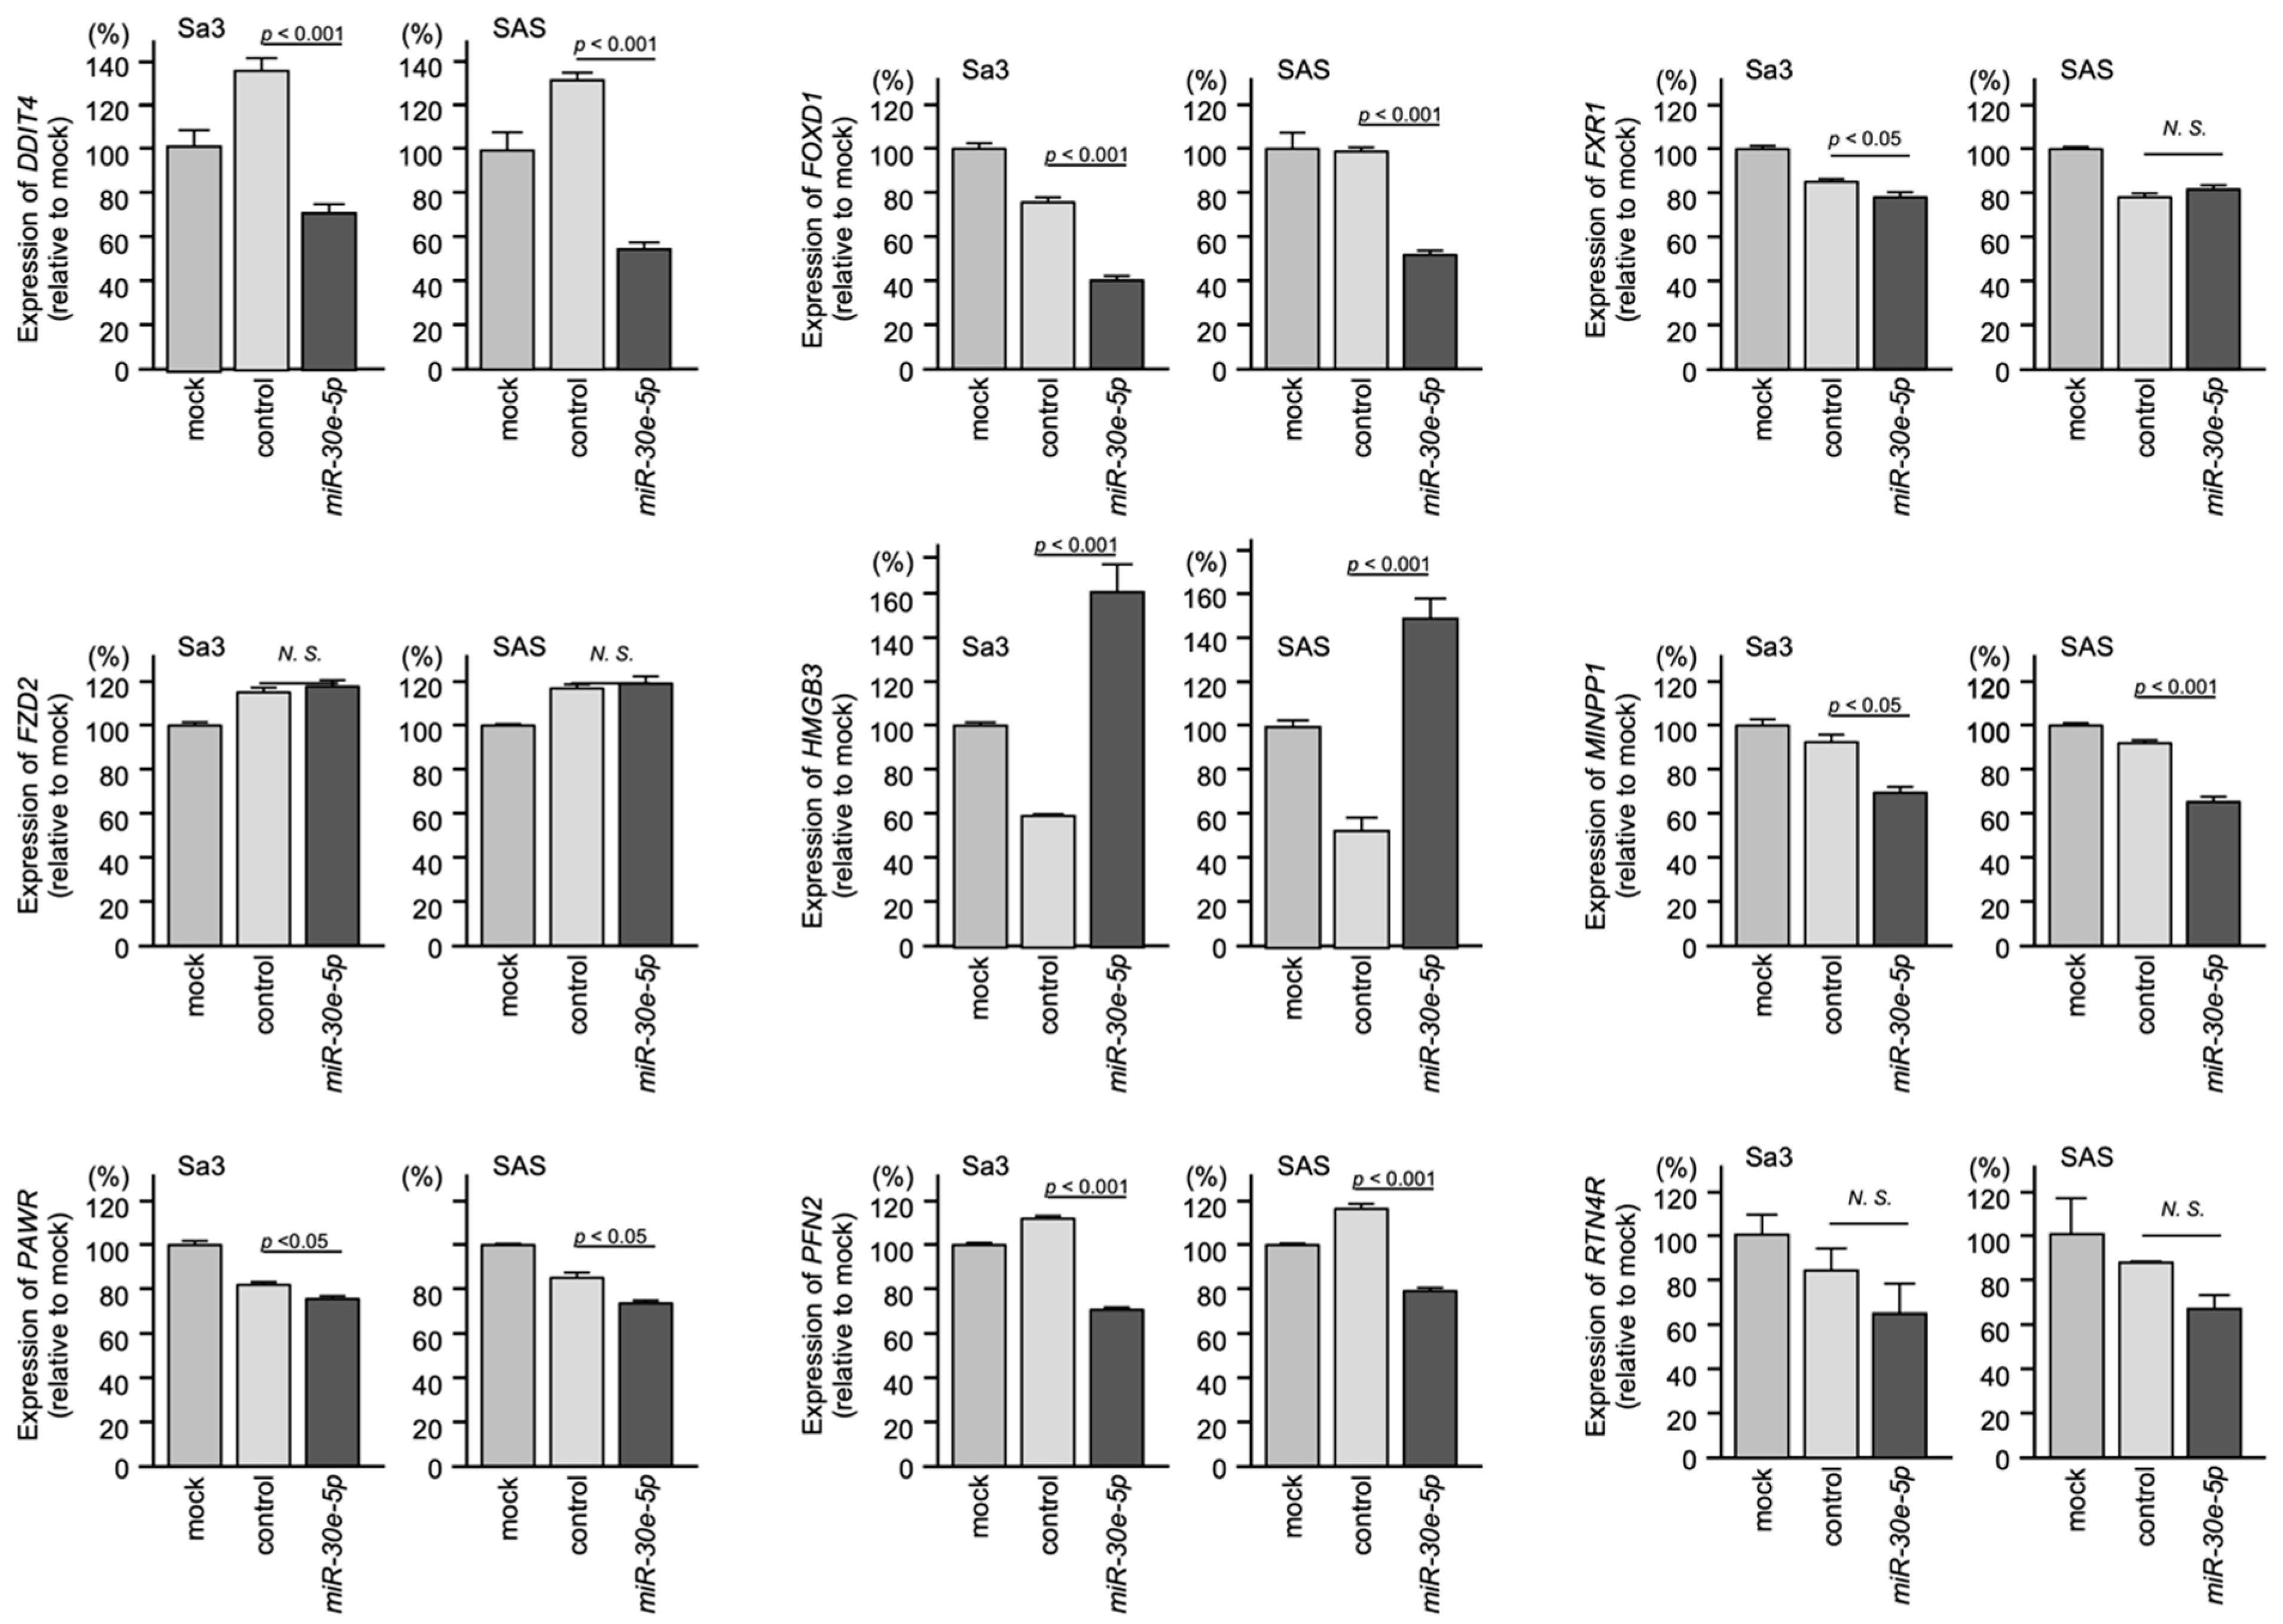
3.5. Regulated Expression of the Nine Identified Genes by miR-30e-5p in HNSCC Cells

qRT-PCR revealed that the mRNA expression levels of DDIT4, FOXD1, MINPP1, PAWR, and PFN2 were significantly suppressed in miR-30e-5p-transfected HNSCC cells. The other genes were not significantly suppressed by miR-30e-5p (Figure 9).
Considering the multivariate analysis, the correlation analysis, and the results of qRT-PCR, FOXD1 was of the greatest interest among the nine targets. Thus, we focused on FOXD1 as the target gene of miR-30e-5p in this study.

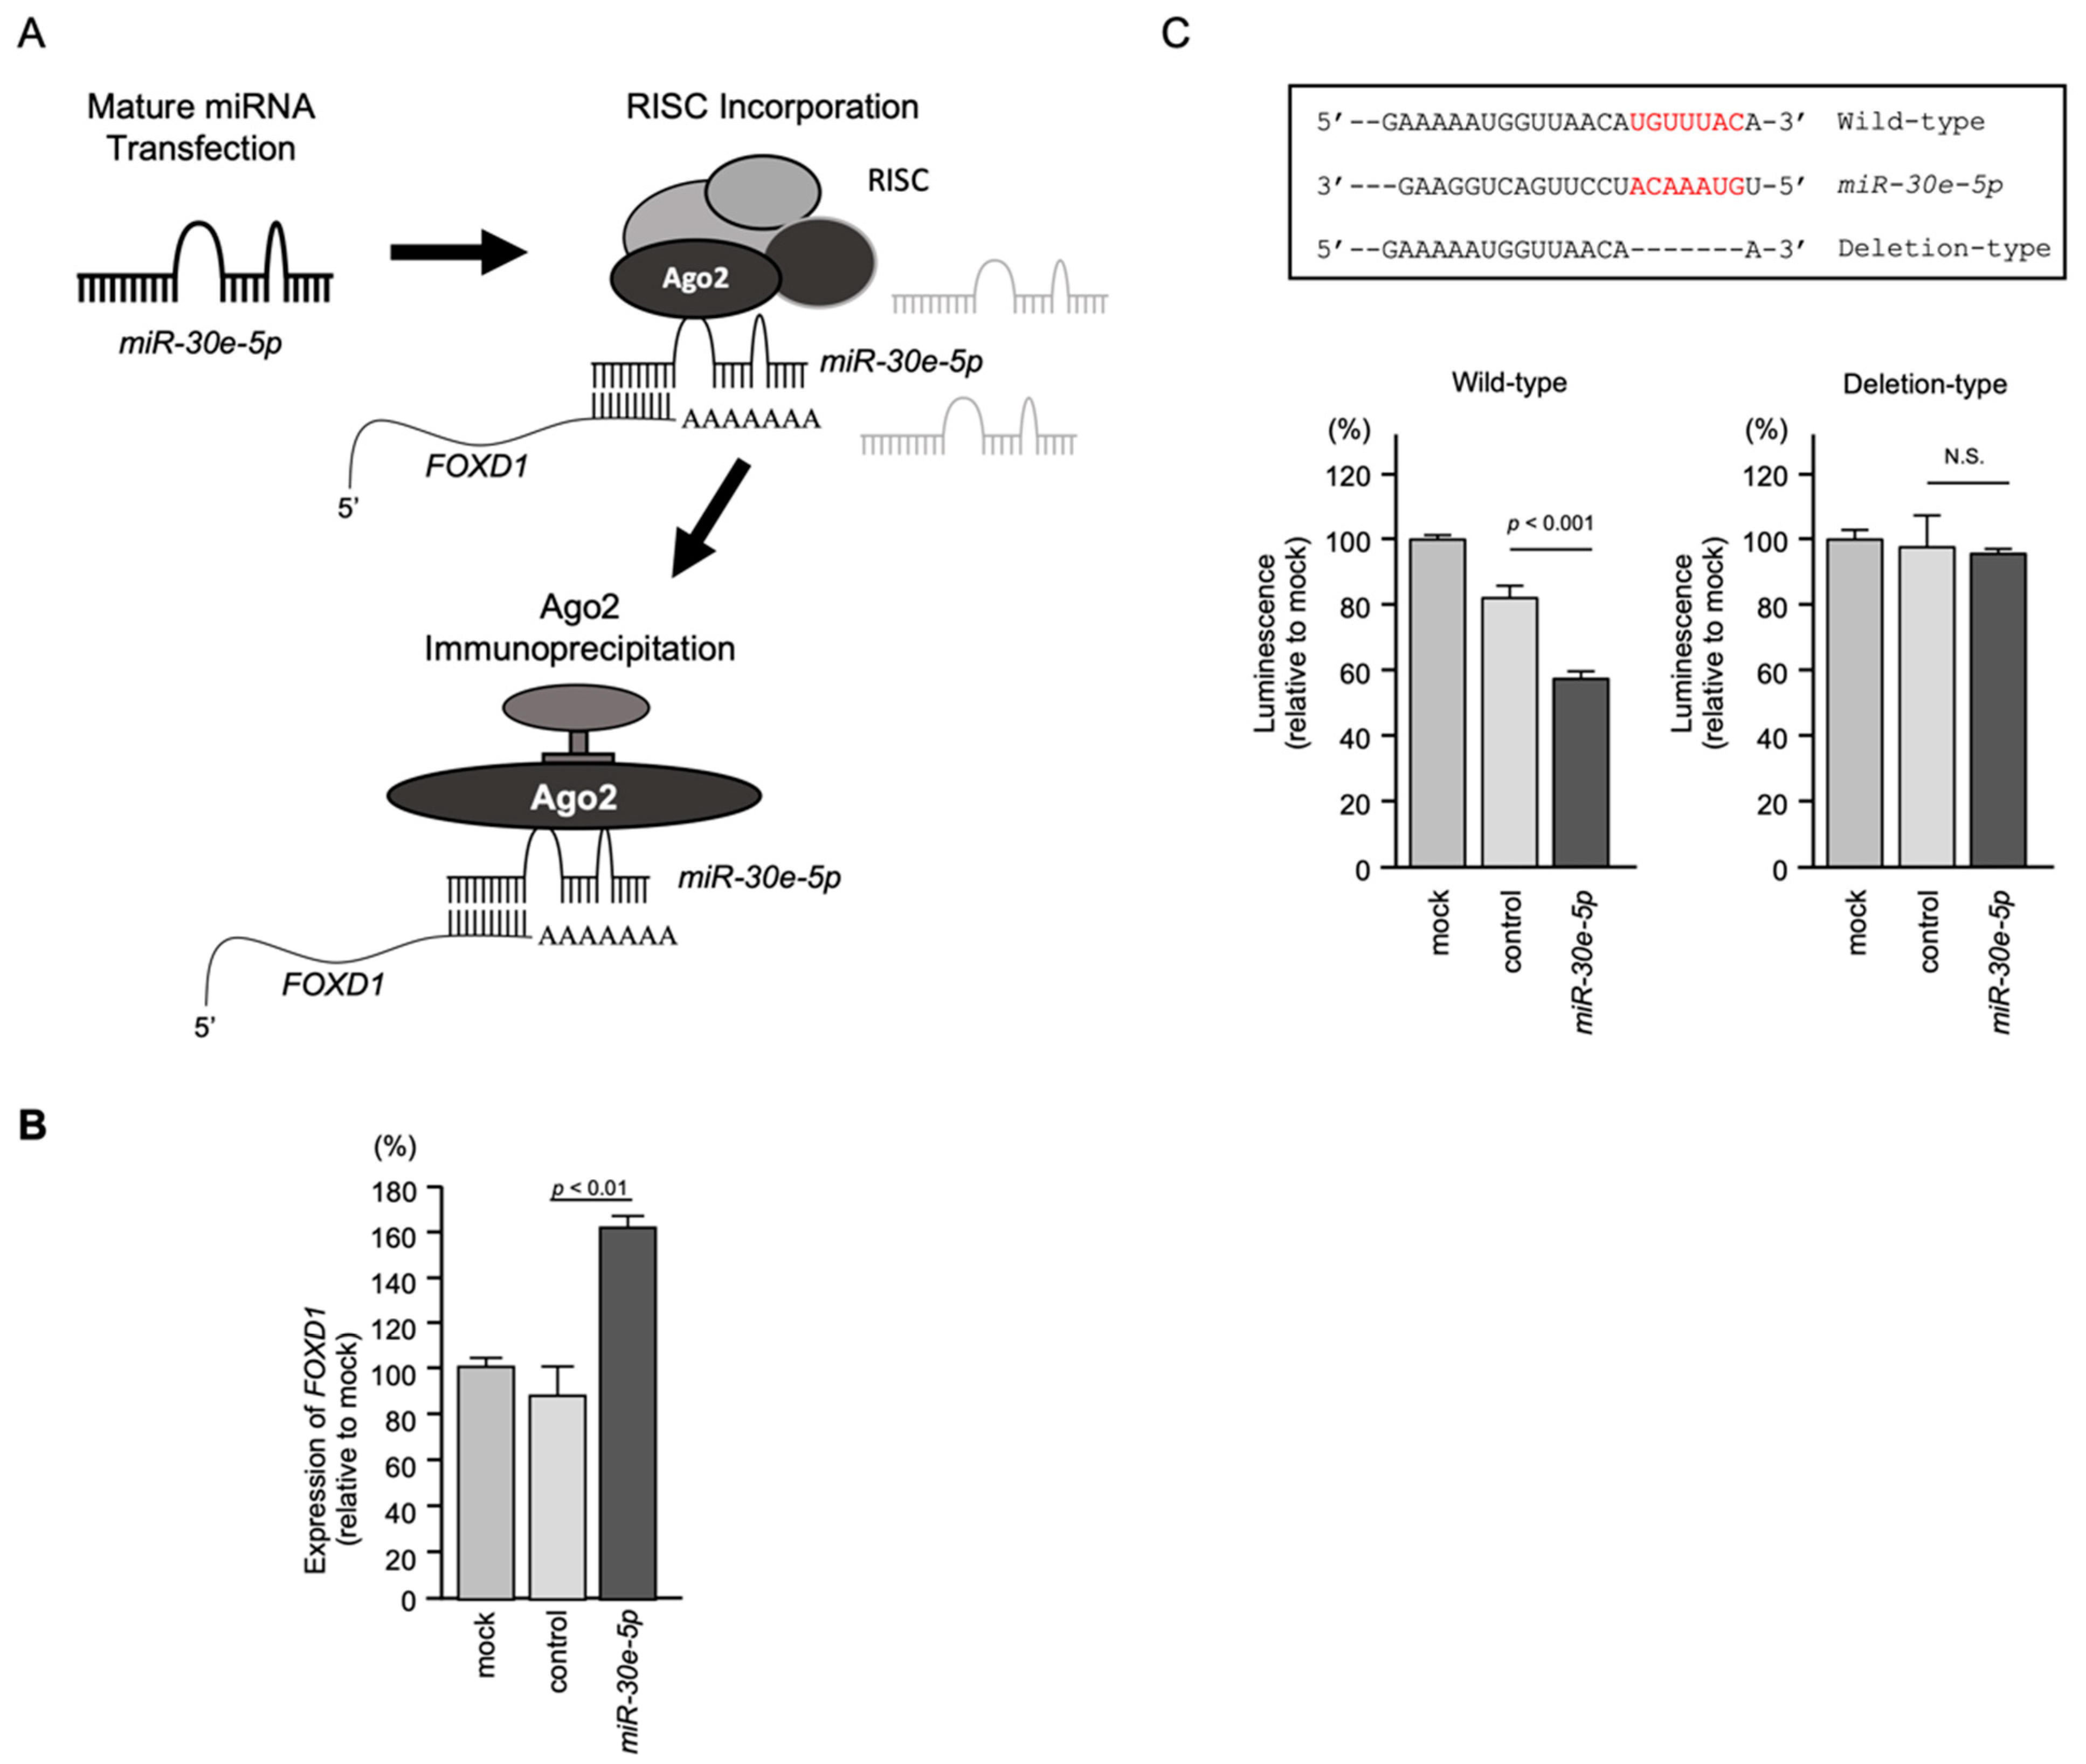
3.6. Incorporation of FOXD1 mRNA into the RNA-Induced Silencing Complex (RISC) and Direct Control of FOXD1 Expression by miR-30e-5p in HNSCC Cells

To confirm incorporation of FOXD1 mRNA into RISC, RIP assays were performed (Figure 10A,B). The schematic illustration displays the concept of RIP assays. Ago2-bound miRNA and mRNA were isolated by the immunoprecipitation of Ago2, the protein that plays a central role in RISC (Figure 10A). Using samples isolated by immunoprecipitation, qRT-PCR showed that the FOXD1 mRNA level was significantly higher than those of mock or miR control transfected cells (p < 0.01; Figure 10B), suggesting a significant incorporation into RISC.
To confirm that miR-30e-5p bound directly to the 3′-UTR of FOXD1, a dual-luciferase reporter assay was performed. Luciferase activity was significantly reduced following co-transfection with miR-30e-5p and a vector containing the miR-30e-5p-binding site in the 3′-UTR of FOXD1 (Figure 10C). In contrast, co-transfection with a vector containing the FOXD1 3′-UTR, in which the miR-30e-5p-binding site was deleted, resulted in no change in luciferase activity (Figure 10C).

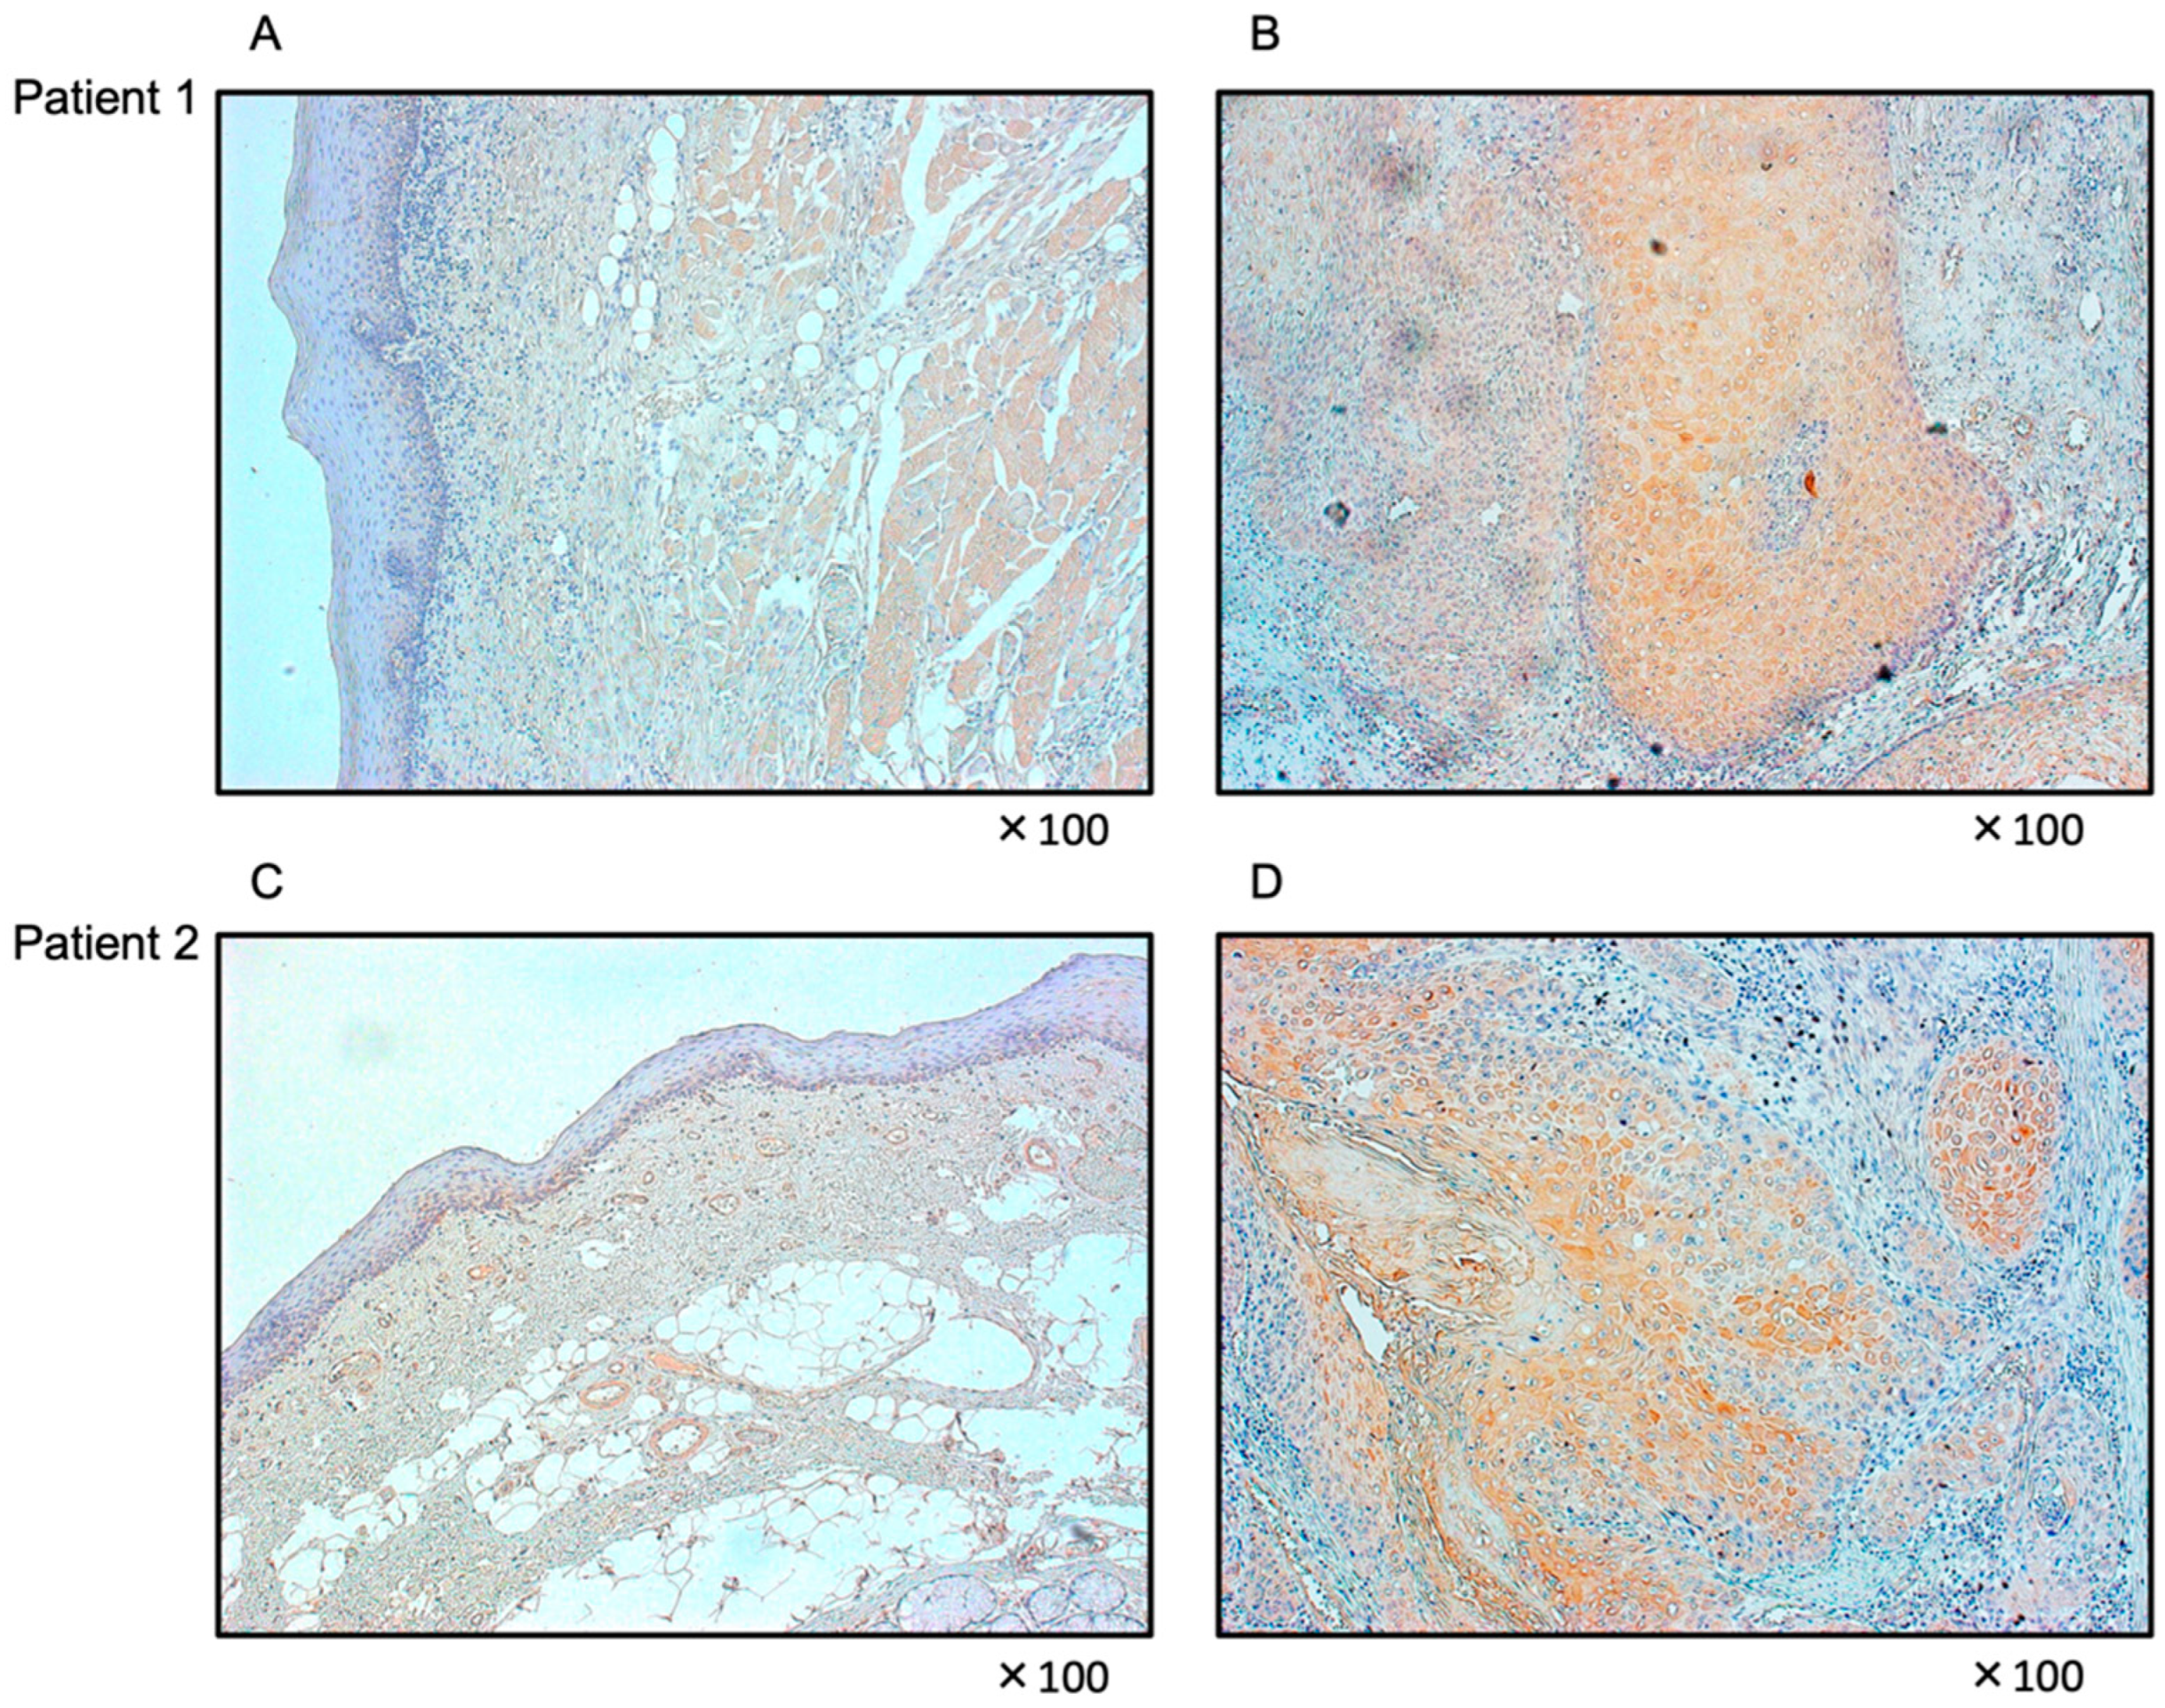
3.7. Expression of FOXD1 in HNSCC Clinical Specimens

HNSCC clinical specimens displayed moderate immunoreactivity in the cytoplasm (Figure 11B,D), whereas normal epithelium showed no expression of FOXD1 (Figure 11A,C). The clinical features of HNSCC specimens are summarized in Table S3.

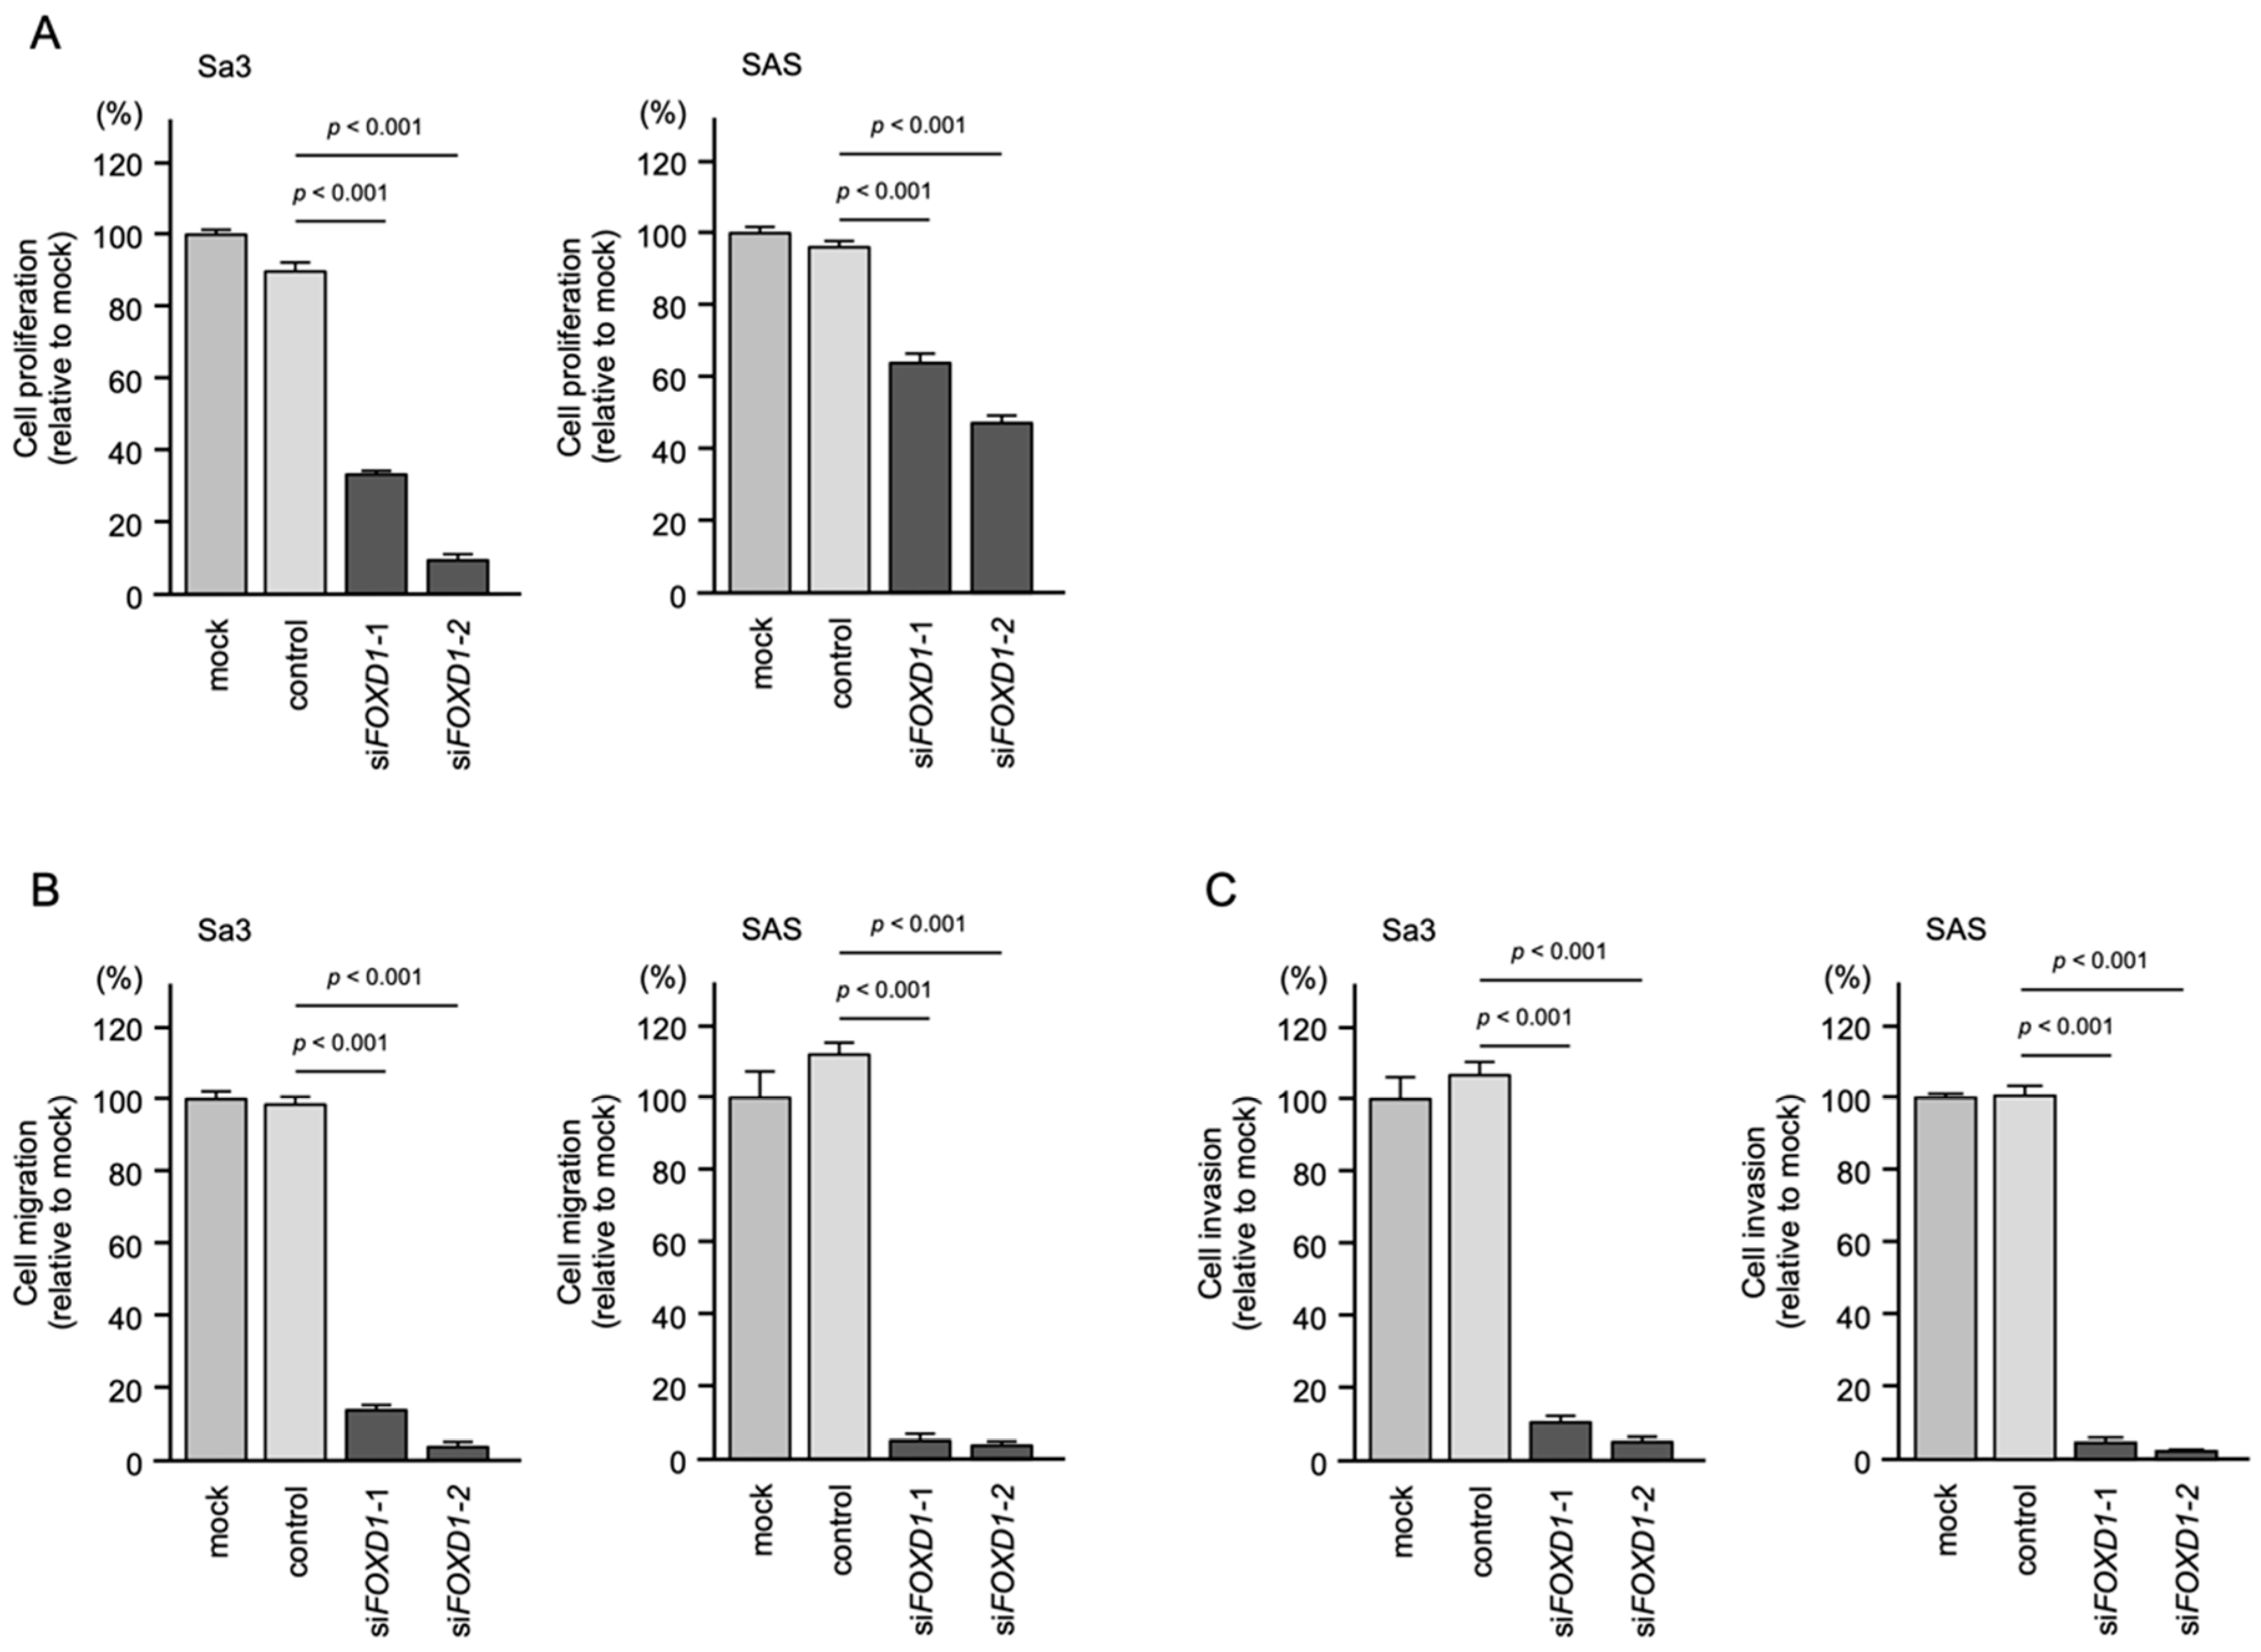
3.8. Effects of FOXD1 Knockdown on the Proliferation, Migration, and Invasion of HNSCC Cells

To assess the tumor-promoting effect of FOXD1 in HNSCC cells, we performed knockdown assays using siRNAs.
First, the inhibitory effects of two different siRNAs targeting FOXD1 (siFOXD1-1 and siFOXD1-2) expression were examined. The FOXD1 mRNA levels were effectively inhibited by each siRNA (Figure S2).
The knockdown of FOXD1 slightly inhibited Sa3 and SAS cell proliferation (Figure 12A). In contrast, cell migration and invasion were significantly inhibited after siFOXD1-1 and siFOXD1-2 transfection into Sa3 and SAS cells (Figure 12B,C). Photographs of typical results from the migration and invasion assays are shown in Figure S3.

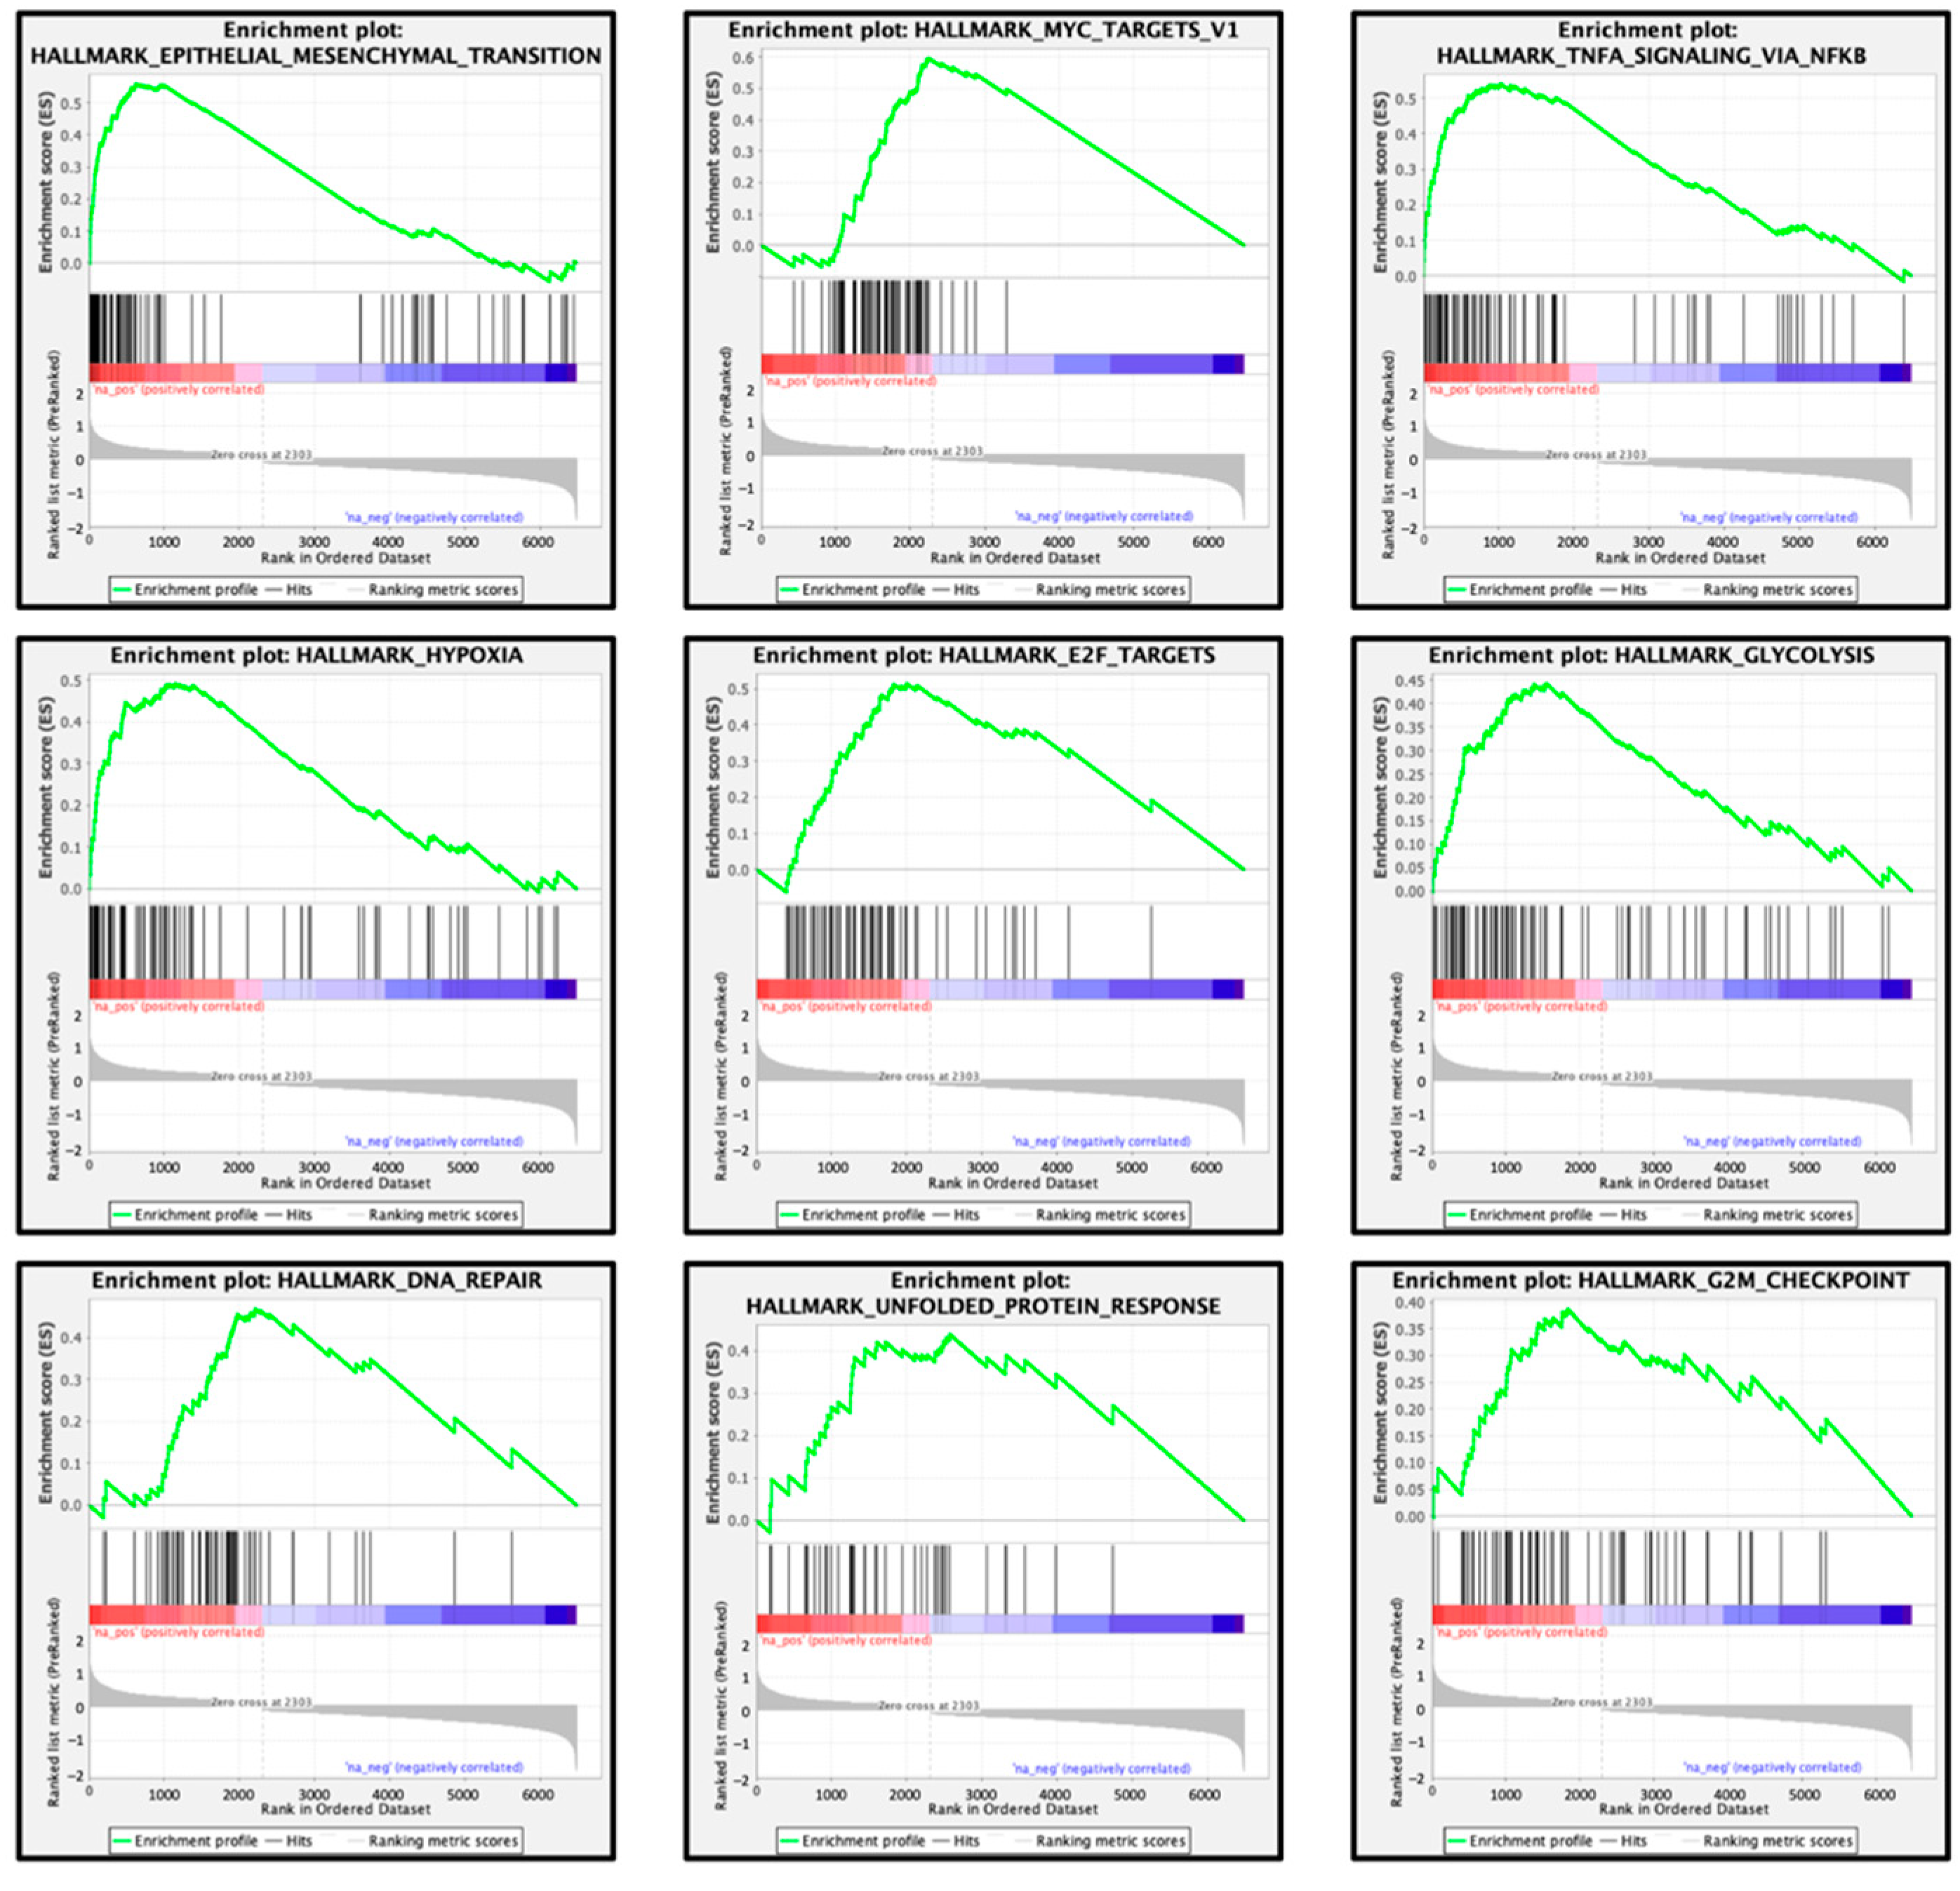
3.9. FOXD1-Mediated Molecular Pathways in HNSCC Cells

We performed gene set enrichment analysis (GSEA) to identify genes that were differentially expressed in the high and low expression groups using TCGA-HNSCC data. A GSEA analysis of FOXD1 showed that the most enriched molecular pathway in the high expression groups of FOXD1 was “epithelial-mesenchymal transition” (Table 3, Figure 13). Additional pathways (MYC targets, TNFα signaling, Hypoxia, E2F targets, Glycolysis, and DNA repair) were also associated with groups expressing high levels of FOXD1 (Table 3). The aberrant expression and activation of these pathways were closely associated with the downregulation of miR-30e-5p in HNSCC cells and contributed to HNSCC oncogenesis.

4. Discussion

In the human genome, numerous miRNAs have very similar sequences and therefore constitute a “family”. Because the seed sequences of the miRNA family are the same, each miRNA family controls the expression of the same set of genes. Therefore, aberrant expression of the miRNA family members will cause the disruption of intracellular molecular networks, and these events can initiate the transformation of normal cells to cancer cells. Based on our miRNA signatures, we previously focused on several miRNA families and identified the molecular pathways that were controlled by the miR-29 family, the miR-199 family and the miR-216 family [14,23,30].
Our RNA sequence-based miRNA signatures, including those in HNSCC, showed that some miR-30 family members were frequently downregulated in cancer tissues. Those observations suggest that these miRNAs control targets with pivotal roles in cancer progression, metastasis, and drug-resistance [31]. Here, we first investigated the expression levels and clinical significance of all members of the miR-30 family using TCGA database. The family consists of 12 miRNAs: guide and passenger strands of miR-30a, miR-30b, miR-30c-1, miR-30c-2, miR-30d, and miR-30e). Among them, the expression levels of miR-30e-5p and miR-30c-1-3p were closely associated with HNSCC molecular pathogenesis. Identifying molecular networks controlled by these miRNAs is important for understanding HNSCC oncogenesis.
In this study, we focused on miR-30e-5p to investigate the targets that it controls in HNSCC. The seed sequences of the guide strands of the miR-30a family are identical, suggesting that these miRNAs may control common targets in a sequence-dependent manner. Previous studies reported that miR-30e-5p had tumor-suppressive functions in several types of cancers [32,33,34]. A previous study showed that miR-30e-5p suppressed astrocyte elevated gene-1 (AEG-1), an oncogene that contributes to angiogenesis, metastasis, and EMT processes [35]. Another study showed that miR-30e-5p was a direct transcriptional target of P53 in colorectal cancer. Expression of miR-30e-5p blocked tumor cell migration, invasion, and in vivo metastasis by directly controlling integrin molecules [36].
A single miRNA controls a large number of genes, and targeted genes can differ depending on the type of cancer. Defining miRNA-targeted genes is an important focus in miRNA research. Our target identification strategy successfully identified nine genes that significantly predicted 5-year survival frequencies of HNSCC patients. Unfortunately, none of those genes were independent prognostic factors contributing to 5-year overall survival rates. According to multivariate analysis, a high expression level of FOXD1 was an independent prognostic factor (HR: 1.374, 95% CI: 1.002–1.890, p = 0.049). Furthermore, the negative correlation between the expression of FOXD1 and miR-30e-5p was confirmed. For those reasons, we focused on FOXD1 as the target gene in this study. Future studies may examine the other genes in the belief that resultant data will improve our understandings of the molecular pathogenesis of HNSCC.
For example, FXR1 is an RNA-binding protein that regulates co-transcriptional and post-transcriptional gene expression. It is a member of the Fragile X-mental retardation (FXR) family of proteins, which includes FMR1 and FXR2 [37]. Recent studies showed that the overexpression of FRX1 was observed in several types of cancers, including HNSCC, and its expression correlates with poor prognosis of the patients [38]. In oral cancer cells, FXR1 stabilized miR-301a-3p and miR-301a-3p, both of which target p21 [39]. Another study showed that the overexpression of FXR1 facilitates the bypass of senescence and tumor progression [40]. Aberrant expression of FXR1-enhanced HNSCC progression and its expression is closely associated with the molecular pathogenesis of HNSCC.
PFN2 was identified as a miR-30e-5p target in this study. PFN2 is a member of the profilin family, namely, profilin 1, 2, 3, and 4 [41]. Profilins are actin-binding proteins involved in the regulation of cytoskeletal dynamics. Overexpression of PFN2 was reported in several types of cancers, including HNSCC [42]. Recently, we revealed that PFN2 was directly regulated by tumor-suppressive miR-1/miR-133 clustered miRNAs in HNSCC cells, and its overexpression promoted cancer cell malignant transformation [25]. Another study showed that overexpression of PFN2 enhanced the aggressiveness of small cell lung cancer (SCLC), including cell proliferation, migration, and invasion. Knockdown of PFN2 decreased the cells’ aggressive nature. Moreover, a mouse xenograft model demonstrated that the overexpression of PFN2 dramatically elevated SCLC growth and vasculature formation as well as lung metastasis [43]. Notably, a previous study showed that miR-30a-5p suppressed the expression of PFN2 in lung cancer cell lines [44].
In this study, we confirmed that the overexpression of FOXD1 facilitated cancer cell malignant transformation, e.g., enhanced migratory and invasive abilities in HNSCC cells. FOXD1 is a member of the forkhead family of transcription factors [45]. FOXD1 expression is upregulated in several types of cancers [46]. Moreover, the knockdown of FOXD1 impairs the colony-forming abilities of oral cancer cells after radiation treatment [47]. Another study showed that upregulated FOXD1 contributed to melanoma cells’ resistance to vemurafenib via the recruited expression of connective tissue growth factor [48]. In gastric cancer (GC) cells, FOXD1-AS1 expression induced FOXD1 translation, and these events enhanced GC cell progression and cisplatin resistance [49]. Importantly, miR-30a-5p directly binds to the 3′-UTR of FOXD1 and suppresses its expression in several types of cancer cells, e.g., lung squamous cell carcinoma, pancreatic ductal adenocarcinoma, osteosarcoma, and ovarian cancer [50,51,52,53]. Our present data and previous studies indicate that the overexpression of FOXD1 is closely involved in aggressive cancer cell transformation in a wide range of cancers, including HNSCC.
These studies show that searching for target genes of tumor-suppressive miRNAs is an attractive strategy for exploring the molecular mechanisms of HNSCC.

5. Conclusions

We showed that the FOXD1 gene is directly controlled by tumor-suppressive miR-30e-5p in HNSCC cells. The aberrant expression of FOXD1 facilitated cancer cell migration and invasion, and its expression was closely associated with the prognosis of HNSCC patients. Our strategy (analysis of tumor-suppressive miRNAs and their controlled genes) can identify genes that are deeply involved in the molecular pathogenesis of HNSCC.

Supplementary Materials

The following are available online at https://www.mdpi.com/article/10.3390/genes13071225/s1, Figure S1: Photomicrographs of cells subjected to migration and invasion assays. Figure S2: Efficiency of siRNA mediated FOXD1 knockdown in HNSCC cell lines (Sa3 and SAS cells). Figure S3: Photomicrographs of cells subjected to migration and invasion assays. Table S1: Clinical features of the patient in GSE180077. Table S2: Used reagents in this study. Table S3: Clinical features of HNSCC patients for IHC.

Author Contributions

Conceptualization, N.S., C.M and S.A.; methodology, N.S., C.M. and S.A.; software, S.A.; validation, C.M. and S.A.; formal analysis, C.M. and S.A.; investigation, C.M., S.A. and A.K. (Ayaka Koma); resources, M.K. and N.K.; data curation, C.M. and S.A.; writing—original draft preparation, N.S., C.M. and S.A.; writing—review and editing, A.K. (Atsushi Kasamatsu); visualization, C.M. and S.A.; supervision, T.H. and K.U.; project administration, N.S.; funding acquisition, N.S., A.K. (Atsushi Kasamatsu), M.K., N.K. and K.U. All authors have read and agreed to the published version of the manuscript.

Funding

This study was supported by JSPS KAKENHI (grant numbers: 21K09577, 22K09679, 21K09367, 22H03286, 20H03883, 21KK0159).

Institutional Review Board Statement

The study was conducted according to the Declaration of Helsinki and approved by the Bioethics Committee of Chiba University (approval number: 915, 11 July 2021).

Informed Consent Statement

Informed consent was obtained from all subjects involved in the study.

Data Availability Statement

Our expression data were deposited in the GEO database (accession number: GSE180077).

Acknowledgments

The results shown here are in part based upon data generated by TCGA Research Network: https://www.cancer.gov/tcga (accessed on 20 August 2020).

Conflicts of Interest

The authors declare no conflict of interest.

References

  1. Bray, F.; Ferlay, J.; Soerjomataram, I.; Siegel, R.L.; Torre, L.A.; Jemal, A. Global cancer statistics 2018: GLOBOCAN estimates of incidence and mortality worldwide for 36 cancers in 185 countries. CA Cancer J. Clin. 2018, 68, 394–424. [Google Scholar] [CrossRef] [PubMed] [Green Version]
  2. Johnson, D.E.; Burtness, B.; Leemans, C.R.; Lui, V.W.Y.; Bauman, J.E.; Grandis, J.R. Head and neck squamous cell carcinoma. Nat. Rev. Dis. Primers 2020, 6, 92. [Google Scholar] [CrossRef] [PubMed]
  3. Cohen, E.E.W.; Bell, R.B.; Bifulco, C.B.; Burtness, B.; Gillison, M.L.; Harrington, K.J.; Le, Q.T.; Lee, N.Y.; Leidner, R.; Lewis, R.L.; et al. The Society for Immunotherapy of Cancer consensus statement on immunotherapy for the treatment of squamous cell carcinoma of the head and neck (HNSCC). J. Immunother. Cancer 2019, 7, 184. [Google Scholar] [CrossRef] [PubMed] [Green Version]
  4. Chow, L.Q.M. Head and Neck Cancer. N. Engl. J. Med. 2020, 382, 60–72. [Google Scholar] [CrossRef]
  5. Bonner, J.A.; Harari, P.M.; Giralt, J.; Cohen, R.B.; Jones, C.U.; Sur, R.K.; Raben, D.; Baselga, J.; Spencer, S.A.; Zhu, J.; et al. Radiotherapy plus cetuximab for locoregionally advanced head and neck cancer: 5-year survival data from a phase 3 randomised trial, and relation between cetuximab-induced rash and survival. Lancet Oncol. 2010, 11, 21–28. [Google Scholar] [CrossRef]
  6. Betel, D.; Wilson, M.; Gabow, A.; Marks, D.S.; Sander, C. The microRNA.org resource: Targets and expression. Nucleic Acids Res. 2008, 36, D149–D153. [Google Scholar] [CrossRef] [Green Version]
  7. Anfossi, S.; Babayan, A.; Pantel, K.; Calin, G.A. Clinical utility of circulating non-coding RNAs—An update. Nat. Rev. Clin. Oncol. 2018, 15, 541–563. [Google Scholar] [CrossRef]
  8. Krek, A.; Grun, D.; Poy, M.N.; Wolf, R.; Rosenberg, L.; Epstein, E.J.; MacMenamin, P.; da Piedade, I.; Gunsalus, K.C.; Stoffel, M.; et al. Combinatorial microRNA target predictions. Nat. Genet. 2005, 37, 495–500. [Google Scholar] [CrossRef]
  9. Gebert, L.F.R.; MacRae, I.J. Regulation of microRNA function in animals. Nat. Rev. Mol. Cell Biol. 2019, 20, 21–37. [Google Scholar] [CrossRef]
  10. Rupaimoole, R.; Slack, F.J. MicroRNA therapeutics: Towards a new era for the management of cancer and other diseases. Nat. Rev. Drug Discov. 2017, 16, 203–222. [Google Scholar] [CrossRef]
  11. Goodall, G.J.; Wickramasinghe, V.O. RNA in cancer. Nat. Rev. Cancer 2021, 21, 22–36. [Google Scholar] [CrossRef]
  12. Mitra, R.; Adams, C.M.; Jiang, W.; Greenawalt, E.; Eischen, C.M. Pan-cancer analysis reveals cooperativity of both strands of microRNA that regulate tumorigenesis and patient survival. Nat. Commun. 2020, 11, 968. [Google Scholar] [CrossRef] [Green Version]
  13. Koshizuka, K.; Nohata, N.; Hanazawa, T.; Kikkawa, N.; Arai, T.; Okato, A.; Fukumoto, I.; Katada, K.; Okamoto, Y.; Seki, N. Deep sequencing-based microRNA expression signatures in head and neck squamous cell carcinoma: Dual strands of pre-miR-150 as antitumor miRNAs. Oncotarget 2017, 8, 30288–30304. [Google Scholar] [CrossRef] [Green Version]
  14. Yonemori, K.; Seki, N.; Idichi, T.; Kurahara, H.; Osako, Y.; Koshizuka, K.; Arai, T.; Okato, A.; Kita, Y.; Arigami, T.; et al. The microRNA expression signature of pancreatic ductal adenocarcinoma by RNA sequencing: Anti-tumour functions of the microRNA-216 cluster. Oncotarget 2017, 8, 70097–70115. [Google Scholar] [CrossRef] [Green Version]
  15. Yang, S.J.; Yang, S.Y.; Wang, D.D.; Chen, X.; Shen, H.Y.; Zhang, X.H.; Zhong, S.L.; Tang, J.H.; Zhao, J.H. The miR-30 family: Versatile players in breast cancer. Tumor Biol. 2017, 39, 1010428317692204. [Google Scholar] [CrossRef] [Green Version]
  16. Saleh, A.D.; Cheng, H.; Martin, S.E.; Si, H.; Ormanoglu, P.; Carlson, S.; Clavijo, P.E.; Yang, X.; Das, R.; Cornelius, S.; et al. Integrated Genomic and Functional microRNA Analysis Identifies miR-30-5p as a Tumor Suppressor and Potential Therapeutic Nanomedicine in Head and Neck Cancer. Clin. Cancer Res. 2019, 25, 2860–2873. [Google Scholar] [CrossRef] [Green Version]
  17. Mao, L.; Liu, S.; Hu, L.; Jia, L.; Wang, H.; Guo, M.; Chen, C.; Liu, Y.; Xu, L. miR-30 Family: A Promising Regulator in Development and Disease. BioMed Res. Int. 2018, 2018, 9623412. [Google Scholar] [CrossRef] [Green Version]
  18. Kozomara, A.; Birgaoanu, M.; Griffiths-Jones, S. miRBase: From microRNA sequences to function. Nucleic Acids Res. 2019, 47, D155–D162. [Google Scholar] [CrossRef]
  19. Gao, J.; Aksoy, B.A.; Dogrusoz, U.; Dresdner, G.; Gross, B.; Sumer, S.O.; Sun, Y.; Jacobsen, A.; Sinha, R.; Larsson, E.; et al. Integrative analysis of complex cancer genomics and clinical profiles using the cBioPortal. Sci. Signal. 2013, 6, pl1. [Google Scholar] [CrossRef] [Green Version]
  20. Cerami, E.; Gao, J.; Dogrusoz, U.; Gross, B.E.; Sumer, S.O.; Aksoy, B.A.; Jacobsen, A.; Byrne, C.J.; Heuer, M.L.; Larsson, E.; et al. The cBio cancer genomics portal: An open platform for exploring multidimensional cancer genomics data. Cancer Discov. 2012, 2, 401–404. [Google Scholar] [CrossRef] [Green Version]
  21. Anaya, J. Linking TCGA survival data to mRNAs, miRNAs, and lncRNAs. PeerJ Comput. Sci. 2016, 2, e67. [Google Scholar] [CrossRef] [Green Version]
  22. Agarwal, V.; Bell, G.W.; Nam, J.W.; Bartel, D.P. Predicting effective microRNA target sites in mammalian mRNAs. eLife 2015, 4, e05005. [Google Scholar] [CrossRef]
  23. Koshizuka, K.; Hanazawa, T.; Kikkawa, N.; Arai, T.; Okato, A.; Kurozumi, A.; Kato, M.; Katada, K.; Okamoto, Y.; Seki, N. Regulation of ITGA3 by the anti-tumor miR-199 family inhibits cancer cell migration and invasion in head and neck cancer. Cancer Sci. 2017, 108, 1681–1692. [Google Scholar] [CrossRef] [Green Version]
  24. Koma, A.; Asai, S.; Minemura, C.; Oshima, S.; Kinoshita, T.; Kikkawa, N.; Koshizuka, K.; Moriya, S.; Kasamatsu, A.; Hanazawa, T.; et al. Impact of Oncogenic Targets by Tumor-Suppressive miR-139-5p and miR-139-3p Regulation in Head and Neck Squamous Cell Carcinoma. Int. J. Mol. Sci. 2021, 22, 9947. [Google Scholar] [CrossRef]
  25. Asai, S.; Koma, A.; Nohata, N.; Kinoshita, T.; Kikkawa, N.; Kato, M.; Minemura, C.; Uzawa, K.; Hanazawa, T.; Seki, N. Impact of miR-1/miR-133 Clustered miRNAs: PFN2 Facilitates Malignant Phenotypes in Head and Neck Squamous Cell Carcinoma. Biomedicines 2022, 10, 663. [Google Scholar] [CrossRef]
  26. Minemura, C.; Asai, S.; Koma, A.; Kase-Kato, I.; Tanaka, N.; Kikkawa, N.; Kasamatsu, A.; Yokoe, H.; Hanazawa, T.; Uzawa, K.; et al. Identification of Tumor-Suppressive miR-30e-3p Targets: Involvement of SERPINE1 in the Molecular Pathogenesis of Head and Neck Squamous Cell Carcinoma. Int. J. Mol. Sci. 2022, 23, 3808. [Google Scholar] [CrossRef]
  27. Mootha, V.K.; Lindgren, C.M.; Eriksson, K.F.; Subramanian, A.; Sihag, S.; Lehar, J.; Puigserver, P.; Carlsson, E.; Ridderstråle, M.; Laurila, E.; et al. PGC-1alpha-responsive genes involved in oxidative phosphorylation are coordinately downregulated in human diabetes. Nat. Genet. 2003, 34, 267–273. [Google Scholar] [CrossRef]
  28. Subramanian, A.; Tamayo, P.; Mootha, V.K.; Mukherjee, S.; Ebert, B.L.; Gillette, M.A.; Paulovich, A.; Pomeroy, S.L.; Golub, T.R.; Lander, E.S.; et al. Gene set enrichment analysis: A knowledge-based approach for interpreting genome-wide expression profiles. Proc. Natl. Acad. Sci. USA 2005, 102, 15545–15550. [Google Scholar] [CrossRef] [Green Version]
  29. Liberzon, A.; Subramanian, A.; Pinchback, R.; Thorvaldsdóttir, H.; Tamayo, P.; Mesirov, J.P. Molecular signatures database (MSigDB) 3.0. Bioinformatics 2011, 27, 1739–1740. [Google Scholar] [CrossRef]
  30. Yamada, Y.; Sugawara, S.; Arai, T.; Kojima, S.; Kato, M.; Okato, A.; Yamazaki, K.; Naya, Y.; Ichikawa, T.; Seki, N. Molecular pathogenesis of renal cell carcinoma: Impact of the anti-tumor miR-29 family on gene regulation. Int. J. Urol. 2018, 25, 953–965. [Google Scholar] [CrossRef] [Green Version]
  31. Kanthaje, S.; Baikunje, N.; Kandal, I.; Ratnacaram, C.K. Repertoires of MicroRNA-30 family as gate-keepers in lung cancer. Front. Biosci. 2021, 13, 141–156. [Google Scholar] [CrossRef]
  32. Xu, G.; Cai, J.; Wang, L.; Jiang, L.; Huang, J.; Hu, R.; Ding, F. MicroRNA-30e-5p suppresses non-small cell lung cancer tumorigenesis by regulating USP22-mediated Sirt1/JAK/STAT3 signaling. Exp. Cell Res. 2018, 362, 268–278. [Google Scholar] [CrossRef] [PubMed]
  33. Ma, Y.X.; Zhang, H.; Li, X.H.; Liu, Y.H. MiR-30e-5p inhibits proliferation and metastasis of nasopharyngeal carcinoma cells by target-ing USP22. Eur. Rev. Med. Pharmacol. Sci. 2018, 22, 6342–6349. [Google Scholar] [CrossRef] [PubMed]
  34. Zhang, Z.; Qin, H.; Jiang, B.; Chen, W.; Cao, W.; Zhao, X.; Yuan, H.; Qi, W.; Zhuo, D.; Guo, H. miR-30e-5p suppresses cell proliferation and migration in bladder cancer through regulating metadherin. J. Cell. Biochem. 2019, 120, 15924–15932. [Google Scholar] [CrossRef]
  35. Zhang, S.; Li, G.; Liu, C.; Lu, S.; Jing, Q.; Chen, X.; Zheng, H.; Ma, H.; Zhang, D.; Ren, S.; et al. miR-30e-5p represses angiogenesis and metastasis by directly targeting AEG-1 in squamous cell carcinoma of the head and neck. Cancer Sci. 2020, 111, 356–368. [Google Scholar] [CrossRef] [Green Version]
  36. Laudato, S.; Patil, N.; Abba, M.L.; Leupold, J.H.; Benner, A.; Gaiser, T.; Marx, A.; Allgayer, H. P53-induced miR-30e-5p inhibits colorectal cancer invasion and metastasis by targeting ITGA6 and ITGB1. Int. J. Cancer 2017, 141, 1879–1890. [Google Scholar] [CrossRef] [Green Version]
  37. Majumder, M.; Johnson, R.H.; Palanisamy, V. Fragile X-related protein family: A double-edged sword in neurodevelopmental disorders and cancer. Crit. Rev. Biochem. Mol. Biol. 2020, 55, 409–424. [Google Scholar] [CrossRef]
  38. Qian, J.; Hassanein, M.; Hoeksema, M.D.; Harris, B.K.; Zou, Y.; Chen, H.; Lu, P.; Eisenberg, R.; Wang, J.; Espinosa, A.; et al. The RNA binding protein FXR1 is a new driver in the 3q26-29 amplicon and predicts poor prognosis in human cancers. Proc. Natl. Acad. Sci. USA 2015, 112, 3469–3474. [Google Scholar] [CrossRef] [Green Version]
  39. Majumder, M.; Palanisamy, V. RNA binding protein FXR1-miR301a-3p axis contributes to p21WAF1 degradation in oral cancer. PLoS Genet. 2020, 16, e1008580. [Google Scholar] [CrossRef] [Green Version]
  40. Qie, S.; Majumder, M.; Mackiewicz, K.; Howley, B.V.; Peterson, Y.K.; Howe, P.H.; Palanisamy, V.; Diehl, J.A. Fbxo4-mediated degradation of Fxr1 suppresses tumorigenesis in head and neck squamous cell carcinoma. Nat. Commun. 2017, 8, 1534. [Google Scholar] [CrossRef] [Green Version]
  41. Pinto-Costa, R.; Sousa, M.M. Profilin as a dual regulator of actin and microtubule dynamics. Cytoskeleton 2020, 77, 76–83. [Google Scholar] [CrossRef]
  42. Zhou, K.; Chen, J.; Wu, J.; Xu, Y.; Wu, Q.; Yue, J.; Song, Y.; Li, S.; Zhou, P.; Tu, W.; et al. Profilin 2 Promotes Proliferation and Metastasis of Head and Neck Cancer Cells by Regulating PI3K/AKT/β-Catenin Signaling Pathway. Oncol. Res. 2019, 27, 1079–1088. [Google Scholar] [CrossRef]
  43. Cao, Q.; Liu, Y.; Wu, Y.; Hu, C.; Sun, L.; Wang, J.; Li, C.; Guo, M.; Liu, X.; Lv, J.; et al. Profilin 2 promotes growth, metastasis, and angiogenesis of small cell lung cancer through cancer-derived exosomes. Aging 2020, 12, 25981–25999. [Google Scholar] [CrossRef]
  44. Yan, J.; Ma, C.; Gao, Y. MicroRNA-30a-5p suppresses epithelial-mesenchymal transition by targeting profilin-2 in high invasive non-small cell lung cancer cell lines. Oncol. Rep. 2017, 37, 3146–3154. [Google Scholar] [CrossRef] [Green Version]
  45. Katoh, M.; Katoh, M. Human FOX gene family (Review). Int. J. Oncol. 2004, 25, 1495–1500. [Google Scholar] [CrossRef]
  46. Quintero-Ronderos, P.; Laissue, P. The multisystemic functions of FOXD1 in development and disease. J. Mol. Med. 2018, 96, 725–739. [Google Scholar] [CrossRef]
  47. Lin, C.H.; Lee, H.H.; Chang, W.M.; Lee, F.P.; Chen, L.C.; Lu, L.S.; Lin, Y.F. FOXD1 Repression Potentiates Radiation Effectiveness by Downregulating G3BP2 Expression and Promoting the Activation of TXNIP-Related Pathways in Oral Cancer. Cancers 2020, 12, 2690. [Google Scholar] [CrossRef]
  48. Sun, Q.; Novak, D.; Hüser, L.; Poelchen, J.; Wu, H.; Granados, K.; Federico, A.; Liu, K.; Steinfass, T.; Vierthaler, M.; et al. FOXD1 promotes dedifferentiation and targeted therapy resistance in melanoma by regulating the expression of connective tissue growth factor. Int. J. Cancer 2021, 149, 657–674. [Google Scholar] [CrossRef]
  49. Wu, Q.; Ma, J.; Wei, J.; Meng, W.; Wang, Y.; Shi, M. FOXD1-AS1 regulates FOXD1 translation and promotes gastric cancer progression and chemoresistance by activating the PI3K/AKT/mTOR pathway. Mol. Oncol. 2021, 15, 299–316. [Google Scholar] [CrossRef]
  50. Chen, C.; Tang, J.; Xu, S.; Zhang, W.; Jiang, H. miR-30a-5p Inhibits Proliferation and Migration of Lung Squamous Cell Carcinoma Cells by Targeting FOXD1. BioMed Res. Int. 2020, 2020, 2547902. [Google Scholar] [CrossRef] [Green Version]
  51. Zhou, L.; Jia, S.; Ding, G.; Zhang, M.; Yu, W.; Wu, Z.; Cao, L. Down-regulation of miR-30a-5p is Associated with Poor Prognosis and Promotes Chemoresistance of Gemcitabine in Pancreatic Ductal Adenocarcinoma. J. Cancer 2019, 10, 5031–5040. [Google Scholar] [CrossRef] [PubMed]
  52. Tao, J.; Cong, H.; Wang, H.; Zhang, D.; Liu, C.; Chu, H.; Qing, Q.; Wang, K. MiR-30a-5p inhibits osteosarcoma cell proliferation and migration by targeting FOXD1. Biochem. Biophys. Res. Commun. 2018, 503, 1092–1097. [Google Scholar] [CrossRef] [PubMed]
  53. Wang, Y.; Qiu, C.; Lu, N.; Liu, Z.; Jin, C.; Sun, C.; Bu, H.; Yu, H.; Dongol, S.; Kong, B. FOXD1 is targeted by miR-30a-5p and miR-200a-5p and suppresses the proliferation of human ovarian carcinoma cells by promoting p21 expression in a p53-independent manner. Int. J. Oncol. 2018, 52, 2130–2142. [Google Scholar] [CrossRef] [PubMed] [Green Version]
Figure 1. Twelve miRNAs are present in the human genome as members of the miR-30 family. (A) Seed sequences of miR-30-5p are identical. In contrast, two types of seed sequences are present in miR-30-3p. (B) The locations of each microRNA family on chromosome.
Genes 13 01225 g001
Figure 2. The expression level of the miR-30 family was analyzed using TCGA-HNSC database. A total of 484 HNSCC tissues and 44 normal epithelial tissues were evaluated (N.S.: not significant).
Genes 13 01225 g002
Figure 3. Kaplan–Meier survival analyses of HNSCC patients using data from TCGA-HNSC. Patients were divided into two groups according to the median miRNA expression level: high and low expression groups. The red and blue lines represent the high and low expression groups, respectively.
Genes 13 01225 g003
Figure 4. Functional assays of miR-30e-5p in HNSCC cell lines (Sa3 and SAS). (A) Cell proliferation was assessed using XTT assays 72 h after miRNA transfection. (B) Cell migration was assessed using a membrane culture system 48 h after seeding miRNA-transfected cells into the chambers. (C) Cell invasion was determined using Matrigel invasion assays 48 h after seeding miRNA-transfected cells into the chambers.
Genes 13 01225 g004
Figure 5. Flow chart of the strategy used to identify putative tumor suppressor genes regulated by miR-30e-5p.
Genes 13 01225 g005
Figure 6. Expression levels of nine target genes (DDIT4, FOXD1, FXR1, FZD2, HMGB3, MINPP1, PAWR, PFN2, and RTN4R) in HNSCC clinical specimens from TCGA-HNSC. All genes were found to be upregulated in HNSCC tissues (n = 518) compared with normal tissues (n = 44).
Genes 13 01225 g006
Figure 7. Clinical significance of nine target genes (DDIT4, FOXD1, FXR1, FZD2, HMGB3, MINPP1, PAWR, PFN2, and RTN4R) according to TCGA-HNSC data analysis. Kaplan–Meier curves of the 5-year overall survival rates according to the expression of each gene are presented. High expression levels of all nine genes were significantly predictive of a poorer prognosis in patients with HNSCC. Patients were divided into two groups according to the median gene expression level: high and low expression groups. The red and blue lines represent the high and low expression groups, respectively.
Genes 13 01225 g007
Figure 8. Correlation analysis by TCGA-HNSC for nine genes. Negative correlation of expression levels between miR-30e-5p and nine genes in HNSCC clinical specimens.
Genes 13 01225 g008
Figure 9. Regulation of the expression of nine genes by miR-30e-5p in HNSCC cells. qRT-PCR showing significantly reduced expression of FOXD1 mRNA (top, middle) 72 h after miR-30e-5p transfection in Sa3 and SAS cells (N.S.: not significant compared to control group).
Genes 13 01225 g009
Figure 10. Isolation of RISC-incorporated FOXD1 mRNA by Ago2 immunoprecipitation. Direct regulation of FOXD1 expression by miR-30e-5p in HNSCC cells. (A) Schematic illustration of RIP assay. (B) qRT-PCR suggested FOXD1 mRNA was significantly incorporated into RISC. (C) TargetScan database analysis predicting putative miR-30e-5p-binding sites in the 3′-UTR of FOXD1 (upper panel). Dual-luciferase reporter assays showed reduced luminescence activity after co-transfection of the wild-type vector and miR-30e-5p in Sa3 cells (lower panel). Normalized data were calculated as the Renilla/Firefly luciferase activity ratio (N.S.: not significant compared to control group).
Genes 13 01225 g010
Figure 11. Immunohistochemical staining of FOXD1 in HNSCC clinical specimens. Weak to moderate immunoreactivity of FOXD1 was observed in the cancer lesions (B,D) whereas negative immunoreactivity was shown in normal mucosa (A,C).
Genes 13 01225 g011
Figure 12. Functional assays of cell proliferation, migration, and invasion following transient transfection of siRNAs targeting FOXD1 in HNSCC cell lines (Sa3 and SAS cells). (A) Cell proliferation assessed by XTT assay 72 h after siRNA transfection. (B) Cell migration assessed using a membrane culture system 48 h after seeding miRNA-transfected cells into the chambers. (C) Cell invasion assessed by Matrigel invasion assays 48 h after seeding miRNA-transfected cells into chambers.
Genes 13 01225 g012
Figure 13. Pathways enriched among the differentially expressed genes in the high FOXD1 expression group according to gene set enrichment analysis. The nine significantly enriched pathways (top 9) are shown. Most enriched pathway was “Epithelial Mesenchymal Transition”.
Genes 13 01225 g013
Table 1. Candidate target genes regulated by miR-30-5p.
Entrez Gene IDGene SymbolGene NameTotal Binding SitesGEO 1  p ValueGEO log2(FC 2)5y OS 3  p Value
8087FXR1Fragile X mental retardation, autosomal homolog 110.0143.06<0.001
5217PFN2Profilin 210.0042.67<0.001
54541DDIT4DNA-damage-inducible transcript 410.0172.700.004
2297FOXD1Forkhead box D110.0083.790.008
9562MINPP1Multiple inositol-polyphosphate phosphatase 110.0132.020.019
5074PAWRPRKC, apoptosis, WT1, regulator20.0032.040.025
3149HMGB3High mobility group box 310.0042.170.028
2535FZD2Frizzled class receptor 210.0062.360.032
65078RTN4RReticulon 4 receptor10.0082.200.044
115908CTHRC1Collagen triple helix repeat containing 110.0102.960.059
3218HOXB8Homeobox B810.0463.290.077
9143SYNGR3Synaptogyrin 310.0422.120.077
1012CDH13Cadherin 1310.0132.130.091
6683SPASTSpastin20.0122.100.092
79718TBL1XR1Transducin (β)-like 1 X-linked receptor 120.0022.630.104
114088TRIM9Tripartite motif containing 910.0054.270.113
84733CBX2Chromobox homolog 210.0053.000.133
27ABL2ABL proto-oncogene 2, non-receptor tyrosine kinase10.0082.190.155
23657SLC7A11solute carrier family 7
(Anionic amino acid transporter light chain, xc- system), member 11
10.0074.000.160
154214RNF217Ring finger protein 21710.0162.360.186
79712GTDC1Glycosyltransferase-like domain containing 110.0044.310.193
26059ERC2ELKS/RAB6-interacting/CAST family member 210.0273.540.210
3237HOXD11Homeobox D1110.0334.240.214
89796NAV1Neuron navigator 110.0072.880.234
6659SOX4SRY (sex determining region Y)-box 410.0052.300.258
54434SSH1Slingshot protein phosphatase 110.0162.050.280
2048EPHB2EPH receptor B210.0132.530.303
9258MFHAS1Malignant fibrous histiocytoma amplified sequence 110.0052.270.311
54566EPB41L4BErythrocyte membrane protein band 4.1 like 4B10.0043.060.413
8448DOC2ADouble C2-like domains, α20.0213.000.485
28982FLVCR1Feline leukemia virus subgroup C cellular receptor 110.0052.430.492
55785FGD6FYVE, RhoGEF and PH domain containing 610.0142.210.530
490ATP2B1ATPase, Ca++ transporting, plasma membrane 110.0072.930.556
4644MYO5AMyosin VA (heavy chain 12, myoxin)10.0032.060.605
4015LOXLysyl oxidase10.0064.460.613
50805IRX4Iroquois homeobox 410.0392.670.652
23432GPR161G protein-coupled receptor 16110.0082.500.662
2729GCLCGlutamate-cysteine ligase, catalytic subunit10.0043.140.710
8038ADAM12ADAM metallopeptidase domain 1220.0034.290.721
3631INPP4AInositol polyphosphate-4-phosphatase, type I, 107kDa10.0032.120.747
9832JAKMIP2Janus kinase and microtubule interacting protein 210.0104.190.769
121268RHEBL1Ras homolog enriched in brain like 110.0042.920.775
144455E2F7E2F transcription factor 730.0212.470.786
94032CAMK2N2Calcium/calmodulin-dependent protein kinase II inhibitor 210.0032.950.823
84206MEX3BMex-3 RNA binding family member B20.0162.750.880
2887GRB10Growth factor receptor-bound protein 1010.0082.070.890
23333DPY19L1Dpy-19-like 1 (C. elegans)10.0133.070.893
9435CHST2Carbohydrate (N-acetylglucosamine-6-O) sulfotransferase 210.0063.300.917
54165DCUN1D1DCN1, defective in cullin neddylation 1, domain containing 120.0092.500.938
54714CNGB3Cyclic nucleotide gated channel β 310.0082.980.968
221002RASGEF1ARasGEF domain family, member 1A10.0052.810.968
55144LRRC8DLeucine rich repeat containing 8 family, member D10.0022.600.978
8534CHST1Carbohydrate (keratan sulfate Gal-6) sulfotransferase 110.0054.410.980
8632DNAH17Dynein, axonemal, heavy chain 1710.0065.260.999
1 Gene Expression Omnibus, 2 Fold Change, 3 5-year Overall Survival.
Table 2. Results of Cox regression analysis of overall survivals in five years in TCGA-HNSC.
MonovariateMultivariate
VariablesHR95% CIp-ValueHR95% CIp-Value
DDIT4 (High vs. Low expression)1.5061.138–1.9940.0041.2920.939–1.7760.115
FOXD1 (High vs. Low expression)1.5261.153–2.0190.0031.3741.002–1.8900.049
FXR1 (High vs. Low expression)1.6511.242–2.1930.0011.3030.930–1.8250.124
FZD2 (High vs. Low expression)1.3371.011–1.7680.0421.0690.776–1.4730.684
HMGB3 (High vs. Low expression)1.4131.069–1.8670.0151.1860.861–1.6330.297
MINPP1 (High vs. Low expression)1.4511.096–1.9210.0091.3080.940–1.8180.111
PAWR (High vs. Low expression)1.4381.084–1.9080.0121.2550.913–1.7270.162
PFN2 (High vs. Low expression)1.6421.238–2.1780.0011.2380.885–1.7310.213
RTN4R (High vs. Low expression)1.3261.003–1.7520.0480.9620.699–1.3230.810
Age (≥70 vs. <70)1.6281.197–2.2130.0021.9221.369–2.698<0.001
Disease Stage (III, IV vs. I, II)1.7461.158–2.6330.0081.7741.159–2.7160.008
Pathological Grade (3, 4 vs. 1, 2)0.9010.653–1.2450.529---
HR: hazard ratio, CI: confidence interval.
Table 3. Results of gene set enrichment analysis.
Enriched Gene Sets in High FOXD1 Expression Group
NameNormalized Enrichment ScoreFDR q-Value
Epithelial mesenchymal transition3.674q < 0.001
MYC targets V13.412q < 0.001
TNFα signaling via NFκB3.262q < 0.001
Hypoxia3.044q < 0.001
E2F targets2.988q < 0.001
Glycolysis2.797q < 0.001
DNA repair2.602q < 0.001
Unfolded protein response2.2750.001
G2M checkpoint2.2480.001
TGFβ signaling2.0250.001
KRAS signaling up1.9460.005
Coagulation1.8480.010
Inflammatory response1.7530.014
Apical junction1.7390.015
Oxidative phosphorylation1.7130.015
P53 pathway1.7020.016
IL6/JAK/STAT3 signaling1.6170.027
Apoptosis1.6010.029
Publisher’s Note: MDPI stays neutral with regard to jurisdictional claims in published maps and institutional affiliations.

