
QTL Mapping for Age-Related Eye Pigmentation in the Pink-Eyed Dilution Castaneus Mutant Mouse


Abstract
1. Introduction
2. Materials and Methods
2.1. Animals
2.2. Whole Genome Sequencing
2.3. Stereomicroscopic and Light Microscopic Analyses of Eyes
2.4. Light Microscopic Analyses of Coat Hair
2.5. Real-Time qPCR Analysis
2.6. Marker Development
2.7. Genotyping and Linkage Map Construction
2.8. QTL Analysis
2.9. Statistical Analysis
3. Results
3.1. Sequencing and Phenotyping of Parental Strains
3.1.1. Sequencing
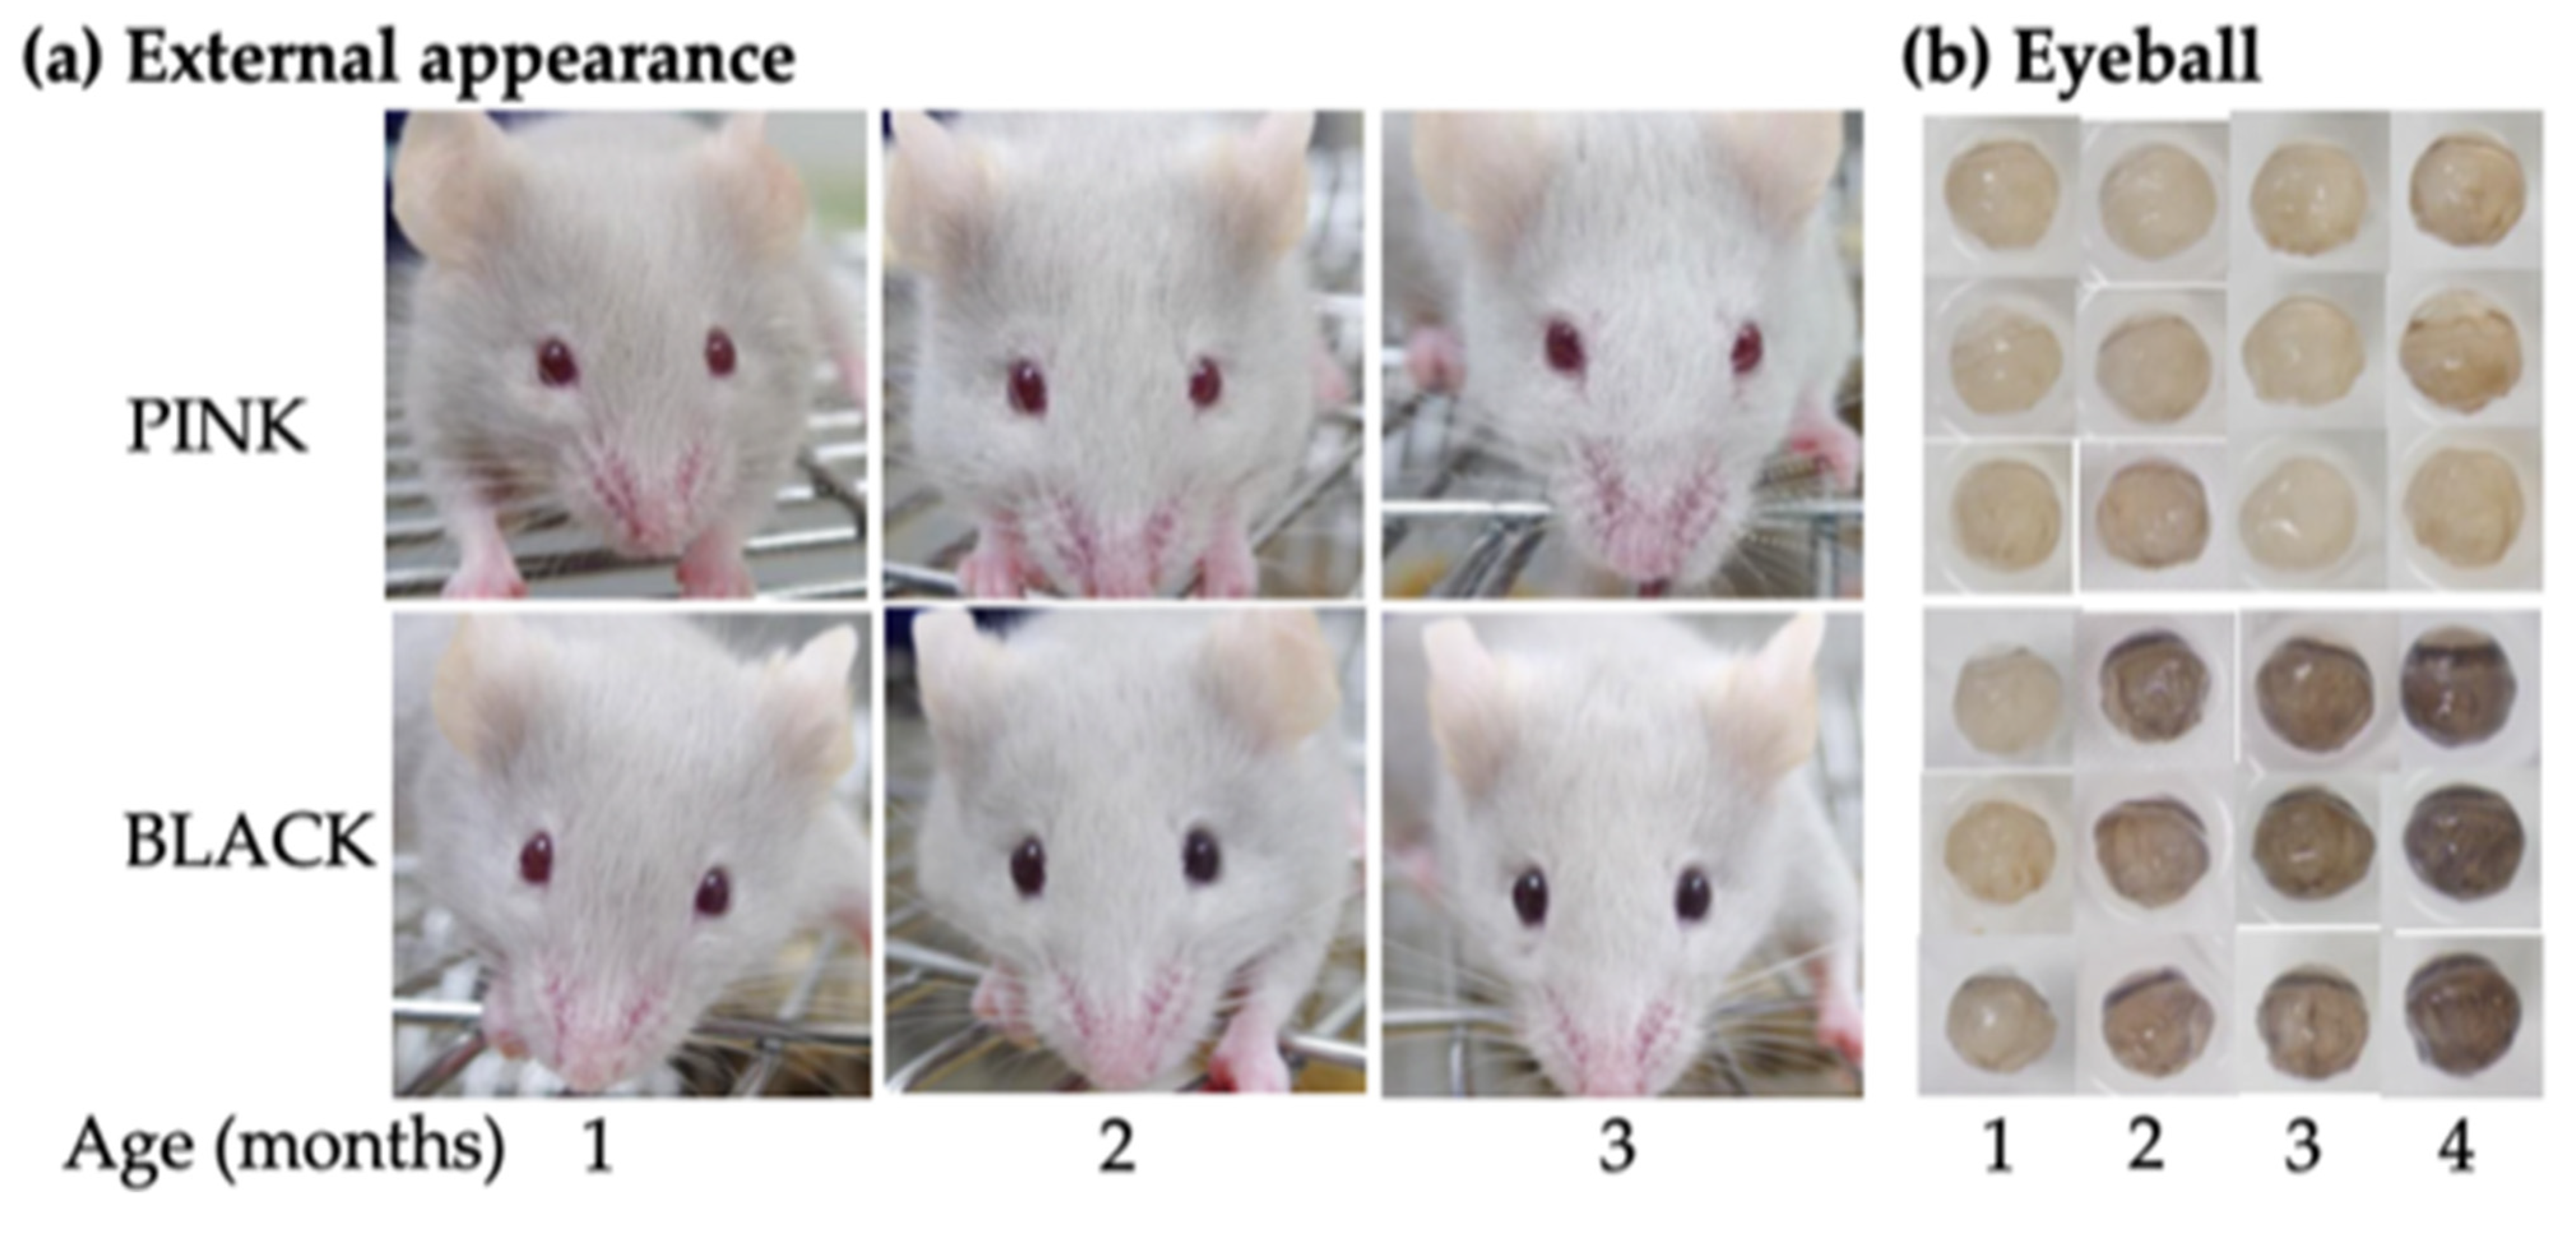
3.1.2. Phenotyping
3.2. Phenotyping of F2 Mice
3.2.1. Eye Morphology
3.2.2. Traits
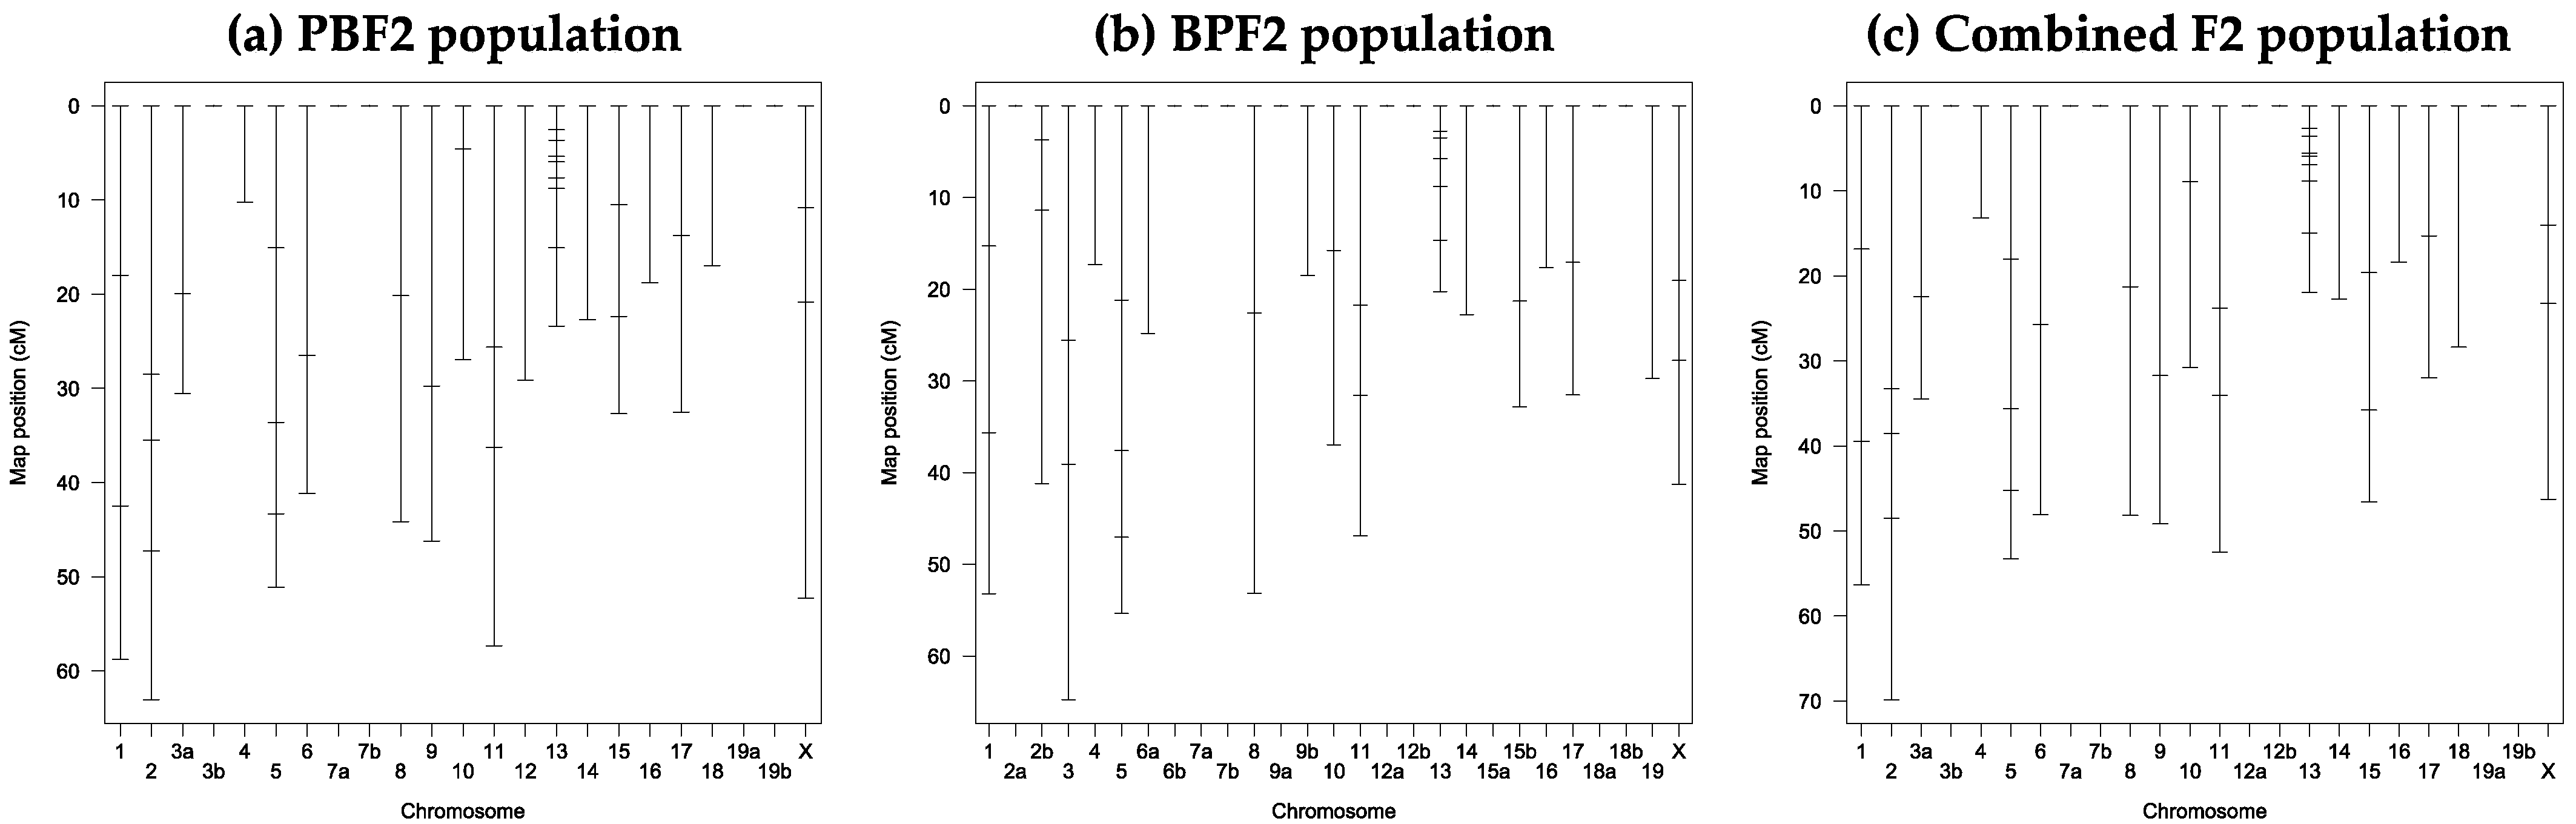
3.3. Marker Development and Linkake Map Construction
3.4. QTL Analysis
3.4.1. Main-Effect QTL
3.4.2. Context-Specific QTL
4. Discussion
Supplementary Materials
Author Contributions
Funding
Institutional Review Board Statement
Informed Consent Statement
Data Availability Statement
Acknowledgments
Conflicts of Interest
References
- Bult, C.J.; Blake, J.A.; Smith, C.L.; Kadin, J.A.; Richardson, J.E.; the Mouse Genome Database Group. Mouse Genome Database (MGD). Nucleic Acids Res. 2019, 47, D801–D806. [Google Scholar] [CrossRef] [PubMed]
- Baxter, L.L.; Watkins-Chow, D.E.; Pavan, W.J.; Loftus, S.K. A curated gene list for expanding the horizons of pigmentation biology. Pigment Cell Melanoma Res. 2019, 32, 348–358. [Google Scholar] [CrossRef] [PubMed]
- Kirby, G.C. Greying with age: A coat-color variant in wild Australian populations of mice. J. Hered. 1974, 65, 126–128. [Google Scholar] [CrossRef] [PubMed]
- Oh, Y.S.; Tomita, T.; Kondo, K. Faded, a mutation in the KSB strain of mouse which shows age-related pigment changes. Exp. Anim. 1986, 35, 131–138. [Google Scholar] [CrossRef] [PubMed]
- Pielberg, R.G.; Golovko, A.; Sundström, E.; Curik, I.; Lennartsson, J.; Seltenhammer, M.H.; Druml, T.; Binns, M.; Fitzsimmons, C.; Lindgren, G.; et al. A cis-acting regulatory mutation causes premature hair graying and susceptibility to melanoma in the horse. Nat. Genet. 2008, 40, 1004–1009. [Google Scholar] [CrossRef]
- Kaelin, C.B.; Barsh, G.S. Genetics of pigmentation in dogs and cats. Annu. Rev. Anim. Biosci. 2013, 1, 125–156. [Google Scholar] [CrossRef] [PubMed]
- Kumar, A.B.; Shamim, H.; Nagaraju, U. Premature graying of hair: Review with updates. Int. J. Trichol. 2018, 10, 198–203. [Google Scholar] [CrossRef]
- Tsuji, A.; Wakayama, T.; Ishikawa, A. A new spontaneous allele at the pink-eyed dilution (p) locus discovered in Mus musculus castaneus. Exp. Anim. 1995, 44, 347–531. [Google Scholar] [CrossRef] [PubMed][Green Version]
- Ishikawa, A.; Sugiyama, M.; Hondo, E.; Kinoshita, K.; Yamagishi, Y. Development of a novel pink-eyed dilution mouse model showing progressive darkening of the eyes and coat hair with aging. Exp. Anim. 2015, 64, 207–220. [Google Scholar] [CrossRef] [PubMed]
- Hirobe, T.; Ishikawa, A. L-tyrosine induces melanocyte differentiation in novel pink-eyed dilution castaneus mouse mutant showing age-related pigmentation. J. Darmatol. Sci. 2015, 80, 203–211. [Google Scholar] [CrossRef] [PubMed]
- Kondo, T.; Hearing, V.J. Update on the regulation of mammalian melanocyte function and skin pigmentation. Expert Rev. Dermatol. 2011, 6, 97–108. [Google Scholar] [CrossRef] [PubMed]
- Schindelin, J.; Arganda-Carreras, I.; Frise, E.; Kaynig, V.; Longair, M.; Pietzsch, T.; Preibisch, S.; Rueden, C.; Saalfeld, S.; Schmid, B.; et al. Fiji: An open-source platform for biological-image analysis. Nat. Methods 2012, 9, 676–682. [Google Scholar] [CrossRef] [PubMed]
- Robinson, J.T.; Thorvaldsdóttir, H.; Wenger, A.M.; Zehir, A.; Mesirov, J.P. Variant review with the Integrative Genomics Viewer. Cancer Res. 2017, 77, e31–e34. [Google Scholar] [CrossRef] [PubMed]
- Untergasser, A.; Nijveen, H.; Rao, X.; Bisseling, T.; Geurts, R.; Leunissen, J.A.M. Primer3Plus, an enhanced web interface to Primer3. Nucleic Acids Res. 2007, 35, W71–W74. [Google Scholar] [CrossRef]
- Ye, J.; Coulouris, G.; Zaretskaya, I.; Cutcutache, I.; Rozen, S.; Madden, T.L. Primer-BLAST: A tool to design target-specific primers for polymerase chain reaction. BMC Bioinfom. 2012, 13, 134. [Google Scholar] [CrossRef]
- Liu, J.; Huang, S.; Sun, M.; Liu, S.; Liu, Y.; Wang, W.; Zhang, X.; Wang, H.; Hua, W. An improved allele-specific PCR primer design method for SNP marker analysis and its application. Plant Methods 2012, 8, 34. [Google Scholar] [CrossRef]
- Ishikawa, A.; Kim, E.H.; Bolor, H.; Mollah, M.B.R.; Namikawa, T. A growth QTL (Pbwg1) region of mouse chromosome 2 contains closely linked loci affecting growth and body composition. Mamm. Genome 2007, 18, 229–239. [Google Scholar] [CrossRef]
- Manly, K.F.; Cudmore, R.H.; Meer, J.M. Map Manager QTX, cross-platform software for genetic mapping. Mamm. Genome 2001, 12, 930–932. [Google Scholar] [CrossRef]
- Darvasi, A.; Soller, M. Selective genotyping for determination of linkage between a marker locus and a quantitative trait locus. Theoret. Appl. Genetics 1992, 85, 353–359. [Google Scholar] [CrossRef]
- Broman, K.W.; Wu, H.; Sen, S.; Churchill, G.A. R/qtl: QTL mapping in experimental crosses. Bioinformatics 2003, 19, 889–890. [Google Scholar] [CrossRef]
- Kenney-Hunt, J.P.; Vaughn, T.T.; Pletscher, L.S.; Peripato, A.; Routman, E.; Cothran, K.; Durand, D.; Norgard, E.; Perel, C.; Cheverud, J.M. Quantitative trait loci for body size components in mice. Mamm. Genome 2006, 17, 526–537. [Google Scholar] [CrossRef]
- Visser, M.; Kayser, M.; Palstra, R.J. HERC2 rs12913832 modulates human pigmentation by attenuating chromatin-loop formation between a long-range enhancer and the OCA2 promoter. Genome Res. 2012, 22, 446–455. [Google Scholar] [CrossRef]
- Darvasi, A.; Soller, M. Optimum spacing of genetic markers for determining linkage between marker loci and quantitative trait loci. Theor. Appl. Genet. 1994, 89, 351–357. [Google Scholar] [CrossRef] [PubMed]
- Ishikawa, A. A strategy for identifying quantitative trait genes using gene expression analysis and causal analysis. Genes 2017, 8, 347. [Google Scholar] [CrossRef] [PubMed]
- Darvasi, A. The effect of selective genotyping on QTL mapping accuracy. Mamm. Genome 1997, 8, 67–68. [Google Scholar] [CrossRef] [PubMed]
- Xu, S. Theoretical basis of the Beavis effect. Genetics 2003, 165, 2259–2268. [Google Scholar] [CrossRef] [PubMed]
- Makino, K.; Ishikawa, A. Genetic identification of Ly75 as a novel quantitative trait gene for resistance to obesity in mice. Sci. Rep. 2018, 8, 17658. [Google Scholar] [CrossRef] [PubMed]
- Swank, R.T.; Reddington, M.; Howlett, O.; Novak, E.K. Platelet storage pool deficiency associated with inherited abnormalities of the inner ear in the mouse pigment mutants muted and mocha. Blood 1991, 78, 2036–2044. [Google Scholar] [CrossRef] [PubMed]
- Zhang, Q.; Li, W.; Novak, E.K.; Karim, A.; Mishra, V.S.; Kingsmore, S.F.; Roe, B.A.; Suzuki, T.; Swank, R.T. The gene for the muted (mu) mouse, a model for Hermansky-Pudlak syndrome, defines a novel protein which regulates vesicle trafficking. Hum. Mol. Genet. 2002, 11, 697–706. [Google Scholar] [CrossRef] [PubMed]
- Swank, R.T.; Sweet, H.O.; Davisson, M.T.; Reddington, M.; Novak, E.K. Sandy: A new mouse model for platelet storage pool deficiency. Genet. Res. 1991, 58, 51–62. [Google Scholar] [CrossRef]
- Li, W.; Zhang, Q.; Oiso, N.; Novak, E.K.; Gautam, R.; O’Brien, E.P.; Tinsley, C.L.; Blake, D.J.; Spritz, R.A.; Copeland, N.G.; et al. Hermansky-Pudlak syndrome type 7 (HPS-7) results from mutant dysbindin, a member of the biogenesis of lysosome-related organelles complex 1 (BLOC-1). Nat. Genet. 2003, 35, 84–89. [Google Scholar] [CrossRef] [PubMed]
- Fernández, A.; Hayashi, M.; Garrido, G.; Montero, A.; Guardia, A.; Suzuki, T.; Montoliu, L. Genetics of non-syndromic and syndromic oculocutaneous albinism in human and mouse. Pigment Cell Melanoma Res. 2021, 34, 786–799. [Google Scholar] [CrossRef]
- Praetorius, C.; Grill, C.; Stacey, S.N.; Metcalf, A.M.; Gorkin, D.U.; Robinson, K.C.; Otterloo, E.V.; Kim, R.S.Q.; Bergsteinsdottir, K.; Ogmundsdottir, M.H.; et al. A polymorphism in IRF4 affects human pigmentation through a tyrosinase-dependent MITF/TFAP2A Pathway. Cell 2013, 155, 1022–1033. [Google Scholar] [CrossRef] [PubMed]
- Zhao, J.; Kawai, K.; Wang, H.; Wu, D.; Wang, M.; Yue, Z.; Zhang, J.; Liu, Y.H. Loss of Msx2 function down-regulates the FoxE3 expression and results in anterior segment dysgenesis resembling Peters anomaly. Am. J. Pathol. 2012, 180, 230–239. [Google Scholar] [CrossRef] [PubMed]
- Lee, C.S.; May, N.R.; Fan, C.M. Transdifferentiation of the ventral retinal pigmented epithelium to neural retina in the growth arrest specific gene 1 mutant. Dev. Biol. 2001, 236, 17–29. [Google Scholar] [CrossRef] [PubMed][Green Version]
- Furuya, R.; Akiu, S.; Ideta, R.; Naganuma, M.; Fukuda, M.; Hirobe, T. Changes in the proliferative activity of epidermal melanocytes in serum-free primary culture during the development of ultraviolet radiation B-induced pigmented spots in hairless mice. Pigment Cell Res. 2002, 15, 348–356. [Google Scholar] [CrossRef]
- Hirobe, T. Role of keratinocyte-derived factors involved in regulating the proliferation and differentiation of mammalian epidermal melanocytes. Pigment Cell Res. 2005, 18, 2–12. [Google Scholar] [CrossRef] [PubMed]
- Kono, M.; Akiyama, M. Dyschromatosis symmetrica hereditaria and reticulate acropigmentation of Kitamura: An update. J. Dermatol. Sci. 2019, 93, 75–81. [Google Scholar] [CrossRef] [PubMed]
- Chena, T.; Zhaoa, B.; Liuc, Y.; Wanga, R.; Yanga, Y.; Yangd, L.; Donga, C. MITF-M regulates melanogenesis in mouse melanocytes. J. Dermatol. Sci. 2018, 90, 253–262. [Google Scholar] [CrossRef] [PubMed]
- Qi, S.; Liu, B.; Zhang, J.; Liu, X.; Dong, C.; Fa, R. Knockdown of microRNA-143-5p by STTM technology affects eumelanin and pheomelanin production in melanocytes. Mol. Med. Reports 2019, 20, 2649–2656. [Google Scholar] [CrossRef]
- Üstüna, Y.; Reibetanz, M.; Brachvogel, B.; Nischt, R.; Eckesa, B.; Zigrinob, P.; Krieg, T. Dual role of laminin-511 in regulating melanocyte migration and differentiation. Matrix Biol. 2019, 80, 59–71. [Google Scholar] [CrossRef] [PubMed]


| Abnormality | Male | Female | Total No. of Cases | ||||
|---|---|---|---|---|---|---|---|
| Left Eye | Right Eye | Both Eyes | Left Eye | Right Eye | Both Eyes | ||
| Cataract | 1 | 0 | 0 | 5 | 3 | 0 | 9 |
| Microphthalmia | 0 | 1 | 0 | 2 | 0 | 1 | 4 |
| Anophthalmia | 0 | 0 | 0 | 0 | 4 | 1 | 5 |
| Eyelid coloboma | 0 | 0 | 0 | 3 | 1 | 0 | 4 |
| Total no. of cases | 1 | 1 | 0 | 10 | 8 | 2 | 22 |
| PBF2 | BPF2 | p-Value | |||||
|---|---|---|---|---|---|---|---|
| Trait | Male | Female | Male | Female | Population | Sex | Population × Sex |
| Binary value | 0.47 ± 0.08 | 0.48 ± 0.08 | 0.50 ± 0.08 | 0.48 ± 0.09 | 0.86 | 0.97 | 0.82 |
| Gray value | 180.8 ± 5.2 | 179.4 ± 5.3 | NA | NA | NA | 0.85 | NA |
| Mitf expression | 1.17 ± 0.05 | 1.23 ± 0.06 | 1.15 ± 0.06 | 1.10 ± 0.06 | 0.19 | 0.92 | 0.41 |
| Tyr expression | 1.30 ± 0.06 a,b | 1.48 ± 0.06 a | 1.12 ± 0.06 b | 1.21 ± 0.07 b | 0.00044 | 0.039 | 0.50 |
| Dct expression | 1.53 ± 0.07 | 1.62 ± 0.08 | 1.69 ± 0.08 | 1.62 ± 0.09 | 0.32 | 0.91 | 0.32 |
| Tyrp1 expression | 1.49 ± 0.06 a,b | 1.56 ± 0.07 a | 1.20 ± 0.07 c | 1.26 ± 0.08 b,c | 0.000038 | 0.33 | 0.97 |
| Population | Trait | Position 1 | LOD | % Var | Nearest Marker | CI 2 | Additive Effect 3 | Dominant Effect 3 | d/a | Inheritance |
|---|---|---|---|---|---|---|---|---|---|---|
| PBF2 | Binary value | 8.8 (54.6) | 4.5 ** | 20.8 | 13_54 | 0–20.0 (34–64) | 0.27 ± 0.05 | 0.19 ± 0.10 | 0.70 | Dominant |
| PBF2 | Gray value | 8.8 (54.6) | 4.6 ** | 21.8 | 13_54 | 0–23.0 (34–64) | 19.90 ± 4.31 | 11.10 ± 6.71 | 0.56 | Dominant |
| Combined F2 | Binary value | 9.0 (54.8) | 5.2 *** | 14.3 | 13_54 | 0–19.0 (34–64) | 0.25 ± 0.05 | 0.06 ± 0.08 | 0.24 | Additive |
Publisher’s Note: MDPI stays neutral with regard to jurisdictional claims in published maps and institutional affiliations. |
© 2022 by the authors. Licensee MDPI, Basel, Switzerland. This article is an open access article distributed under the terms and conditions of the Creative Commons Attribution (CC BY) license (https://creativecommons.org/licenses/by/4.0/).
Share and Cite
Nakano, T.; Takenaka, M.; Sugiyama, M.; Ishikawa, A. QTL Mapping for Age-Related Eye Pigmentation in the Pink-Eyed Dilution Castaneus Mutant Mouse. Genes 2022, 13, 1138. https://doi.org/10.3390/genes13071138
Nakano T, Takenaka M, Sugiyama M, Ishikawa A. QTL Mapping for Age-Related Eye Pigmentation in the Pink-Eyed Dilution Castaneus Mutant Mouse. Genes. 2022; 13(7):1138. https://doi.org/10.3390/genes13071138
Chicago/Turabian StyleNakano, Takaya, Momoko Takenaka, Makoto Sugiyama, and Akira Ishikawa. 2022. "QTL Mapping for Age-Related Eye Pigmentation in the Pink-Eyed Dilution Castaneus Mutant Mouse" Genes 13, no. 7: 1138. https://doi.org/10.3390/genes13071138
APA StyleNakano, T., Takenaka, M., Sugiyama, M., & Ishikawa, A. (2022). QTL Mapping for Age-Related Eye Pigmentation in the Pink-Eyed Dilution Castaneus Mutant Mouse. Genes, 13(7), 1138. https://doi.org/10.3390/genes13071138