Article

High Expression of EZH2 Mediated by ncRNAs Correlates with Poor Prognosis and Tumor Immune Infiltration of Hepatocellular Carcinoma

1
Shulan (Hangzhou) Hospital Affiliated to Zhejiang Shuren University Shulan International Medical College, Hangzhou 310004, China
2
School of Medicine, Zhejiang University, Hangzhou 310003, China
3
School of Medicine, Zhejiang Chinese Medical University Zhejiang Shuren College, Hangzhou 310003, China
*
Authors to whom correspondence should be addressed.
Genes 2022, 13(5), 876; https://doi.org/10.3390/genes13050876
Submission received: 6 April 2022 / Revised: 24 April 2022 / Accepted: 10 May 2022 / Published: 13 May 2022
(This article belongs to the Section Human Genomics and Genetic Diseases)

Abstract

:
Background: Hepatocellular carcinoma (HCC) is the predominant form of liver cancer and is accompanied by a complex regulatory network. Increasing evidence suggests that an abnormal gene expression of EZH2 is associated with HCC progression. However, the molecular mechanism by which non-coding RNAs (ncRNAs) regulate EZH2 remains elusive. Methods: The Cancer Genome Atlas (TCGA) and Genotype-Tissue Expression (GTEx) data were used to perform differential expression analysis and prognostic analysis. We used the Encyclopedia of RNA Interactomes (ENCORI) database to predict candidate miRNAs and lncRNAs that may bind to EZH2. Subsequently, the comprehensive analysis (including expression analysis, correlation analysis, and survival analysis) identified ncRNAs that contribute to EZH2 overexpression. Results: EZH2 was found to be upregulated in the majority of tumor types and associated with a poor prognosis. Hsa-miR-101-3p was identified as a target miRNA of EZH2. Additionally, SNHG6 and MALAT1 were identified as upstream lncRNAs of hsa-miR-101-3p. Meanwhile, correlation analysis revealed that EZH2 expression was significantly associated with the infiltration of several immune cell types in HCC. Conclusion: SNHG6 or MALAT1/hsa-miR-101-3p/EZH2 axis were identified as potential regulatory pathways in the progression of HCC.

1. Introduction

Hepatocellular carcinoma (HCC) is the most common type of primary liver cancer, accounting for 90% of primary liver cancer cases, and is the leading cause of cancer-associated death worldwide [1,2]. Infection by hepatitis B virus (HBV) and hepatitis C virus (HCV), as well as alcohol consumption, is the predominant causative agent of HCC development, although non-alcoholic steatohepatitis associated with metabolic syndrome or diabetes mellitus is becoming a more frequent risk factor in the West [3,4]. Currently, the main methods for treating HCC are surgery, chemotherapy, radiotherapy, and liver transplantation [5]. In recent years, despite remarkable progress in immunotherapy, such as PD1-targeted therapy, there have still been a considerable number of HCC patients who cannot benefit from immunotherapy, which may be related to the immunosuppressive environment of tumors, resulting in the primary cause of mortality [6,7]. Therefore, elucidating the molecular mechanisms, especially the immune-related cellular mechanism, underlying the pathogenesis of HCC is essential for the development of effective anti-cancer therapies.
Enhancer of Zeste Homolog 2 (EZH2) is a member of the Polycomb group (PcG) family that forms multimeric protein complexes; the PcG family is involved in maintaining the transcriptional repressive state of genes over successive cell generations and in controlling the progression of the cell cycle, and it participates in the maintenance of cell differentiation [8,9]. As EZH2 regulates cell cycle progression, its dysregulation accelerates cell proliferation and prolongs cell survival, which may lead to carcinogenesis and cancer development [10]. An increasing number of studies have revealed that EZH2 is abnormally expressed in numerous tumors, including liver cancer, gastric cancer, and breast cancer, and correlates with tumor progression, metastasis, and drug resistance in prostate cancer cells [11,12,13]. In recent years, an increasing number of studies have suggested that EZH2 may be a novel molecule involved in HCC progression, as well as a potential prognostic biomarker and therapeutic target [14,15]. Liu et al. [16] suggested EZH2/miR-622/CXCR4 as a potential adverse prognostic factor and therapeutic target for HCC patients. Similarly, Bae et al. shared the same view that overexpression of EZH2 was an independent biomarker for poor outcomes of HCC, and that EZH2 may be used as a therapeutic target in patients with HCC [17]. However, comprehensive studies on the expression, prognosis, mutation, and biological mechanisms of EZH2 are still lacking in HCC. In addition, the relevance of EZH2 to tumor immune infiltration is uncertain in HCC.
In the present study, we first analyzed EZH2 expression and its prognostic value in a series of TCGA clinical samples of human cancers. Next, the molecular mechanisms underlying EZH2-mediated oncogenesis effects were explored in HCC. Subsequently, the relationships between EZH2 expression and tumor-related immune cell infiltration, immune checkpoint blockade, and the immunotherapy response were explored in HCC.

2. Materials and Methods

2.1. Omics Analysis of EZH2

In this study, we aimed to explore the oncogenic role and potential biological mechanism of human EZH2 in HCC. Firstly, we obtained the chromosome location, number of exons, and other biological information from the “gene” and “protein” modules of the National Center for Biotechnology Information (NCBI, https://www.ncbi.nlm.nih.gov/, accessed on 22 October 2021), U.S. National Library of Medicine. Secondly, the protein structure and conserved domains were explored via the Uniprot database (https://www.uniprot.org/, accessed on 22 October 2021). Thirdly, conserved amino acid sequences encoded by EZH2 and the phylogenetic tree of the EZH2 family were explored via the Constraint-based Multiple Alignment Tool (https://www.ncbi.nlm.nih.gov/tools/cobalt/, accessed on 22 October 2021) in NCBI. Finally, the distribution of the EZH2 protein was obtained from the Human Protein Atlas (HPA, https://www.proteinatlas.org/, accessed on 25 October 2021) database.

2.2. Expression Analysis of EZH2

To evaluate the expression of EZH2, TIMER [18] (https://cistrome.shinyapps.io/timer/, accessed on 26 October 2021) was utilized to compare the differential expression levels of EZH2 between tumor and normal tissues in various tumor types, including bladder urothelial carcinoma (BLCA), breast invasive carcinoma (BRCA), cervical squamous cell carcinoma and endocervical adenocarcinoma (CESC), cholangiocarcinoma (CHOL), colon adenocarcinoma (COAD), esophageal carcinoma (ESCA), glioblastoma multiforme (GBM), head and neck squamous cell carcinoma (HNSC), kidney chromophobe (KICH), kidney renal clear cell carcinoma (KIRC), kidney renal papillary cell carcinoma (KIRP), liver hepatocellular carcinoma (LIHC), lung adenocarcinoma (LUAD), lung squamous cell carcinoma (LUSC), pancreatic adenocarcinoma (PAAD), pheochromocytoma and paraganglioma (PCPG), prostate adenocarcinoma (PRAD), rectum adenocarcinoma (READ), stomach adenocarcinoma (STAD), thyroid carcinoma (THCA), and uterine corpus endometrial carcinoma (UCEC). Subsequently, we used the GEPIA2 database [19] (http://gepia2.cancer-pku.cn/#index, accessed on 2 November 2021) to validate the mRNA expression of the EZH2 gene with data from The Cancer Genome Atlas (TCGA) and the Genotype-Tissue Expression (GTEx) project. Two-tailed Student’s t-tests were used to analyze the data, and a difference was considered to be statistically significant when p < 0.01 and |log2 FC (fold change)| ≥ 1.

2.3. Prognostic Analysis of EZH2

We used the “Survival Map” module of GEPIA2 to obtain the overall survival (OS) and disease-free survival (DFS) significance map of EZH2 across all TCGA tumors. HCC patients from TCGA datasets were classified into high-risk and low-risk subgroups according to high (50%) and low (50%) cutoff values. The log-rank test was used as the hypothesis test, and the Kaplan-Meier (K-M) curves were also obtained through the “Survival Analysis” module of GEPIA2. The Sangerbox (http://sangerbox.com/, accessed on 4 November 2021) database was used to investigate how EZH2 expression influenced tumor prognosis, including disease-specific survival (DSS) and progression-free interval (PFI).

2.4. Prediction of Upstream miRNAs and lncRNAs of EZH2

The Encyclopedia of RNA Interactomes (ENCORI, https://starbase.sysu.edu.cn/index.php, accessed on 8 November 2021) database [20] is an open-source platform for exploring miRNA-target interactions. We used ENCORI to predict candidate miRNAs and lncRNAs that may bind to EZH2 and corresponding miRNAs. The upstream-binding miRNAs of EZH2 were selected based on the following criterion: present in at least five of the following databases, consisting of PITA, RNA22, miRmap, microT, miRanda, PicTar, and TargetScan. The “pan cancer” module of ENCORI was used to perform the miRNA differential expression and survival analysis, miRNA-target co-expression, and RNA-RNA co-expression analysis.

2.5. Immune Cell Infiltration, Chemotactic Activities, Immune Cell Biomarkers, and Immune Checkpoint Analysis of EZH2

The “SCNA” module of TIMER (https://cistrome.shinyapps.io/timer/, accessed on 12 November 2021) was used to provide the comparison of tumor infiltration levels among tumors with different somatic copy number alterations for the EZH2 gene. In addition, the “Gene” module of TIMER was also used to visualize the correlation of EZH2 expression with the immune infiltration level in HCC tissues. We assessed the relationships among EZH2 expression and immune cell chemotaxis, immune cell biomarkers, and immune checkpoints based on the “Correlation” module of TIMER. GEPIA2 was used to verify the correlation between EZH2 expression and immune cell biomarkers.

2.6. Functional Analysis of EZH2

To explore the potential biological function and pathway relationships of EZH2, gene set enrichment analysis (GSEA) was performed using the Sangerbox (http://sangerbox.com/, accessed on 22 November 2021) online service. The top terms of the Kyoto Encyclopedia of Genes and Genomes (KEGG) and HALLMARK analyses were exhibited.

3. Results

3.1. Omics Analysis of EZH2

The goal of this study was to investigate the oncogenic role of EZH2 in HCC. EZH2 (Gene ID: 2146) is encoded on chromosome 7q36.1 and contains twenty-five exons (Figure 1A). The secondary structure of the EZH2 protein sequence is shown (Figure 1A). The EZH2 oncogenic gene encodes five main protein isoforms consisting of histone-lysine N-methyltransferase EZH2 isoforms a–e, which are mainly distributed in the nucleoplasm (Figure 1B). To better understand the oncogenic role of EZH2, structure–function analysis was conducted, and the protein domains are displayed (Figure 1C). EZH2 contains an EZH2_WD binding (pfam11616) domain and a SET (cl02566) domain and is highly conserved in multiple species (Figure 1E). The phylogenetic tree of the EZH2 protein was produced using fast minimum evolution, and it presents the evolutionary relationships among different species (Figure 1D).

3.2. Pan-Cancer Analysis of EZH2 Expression

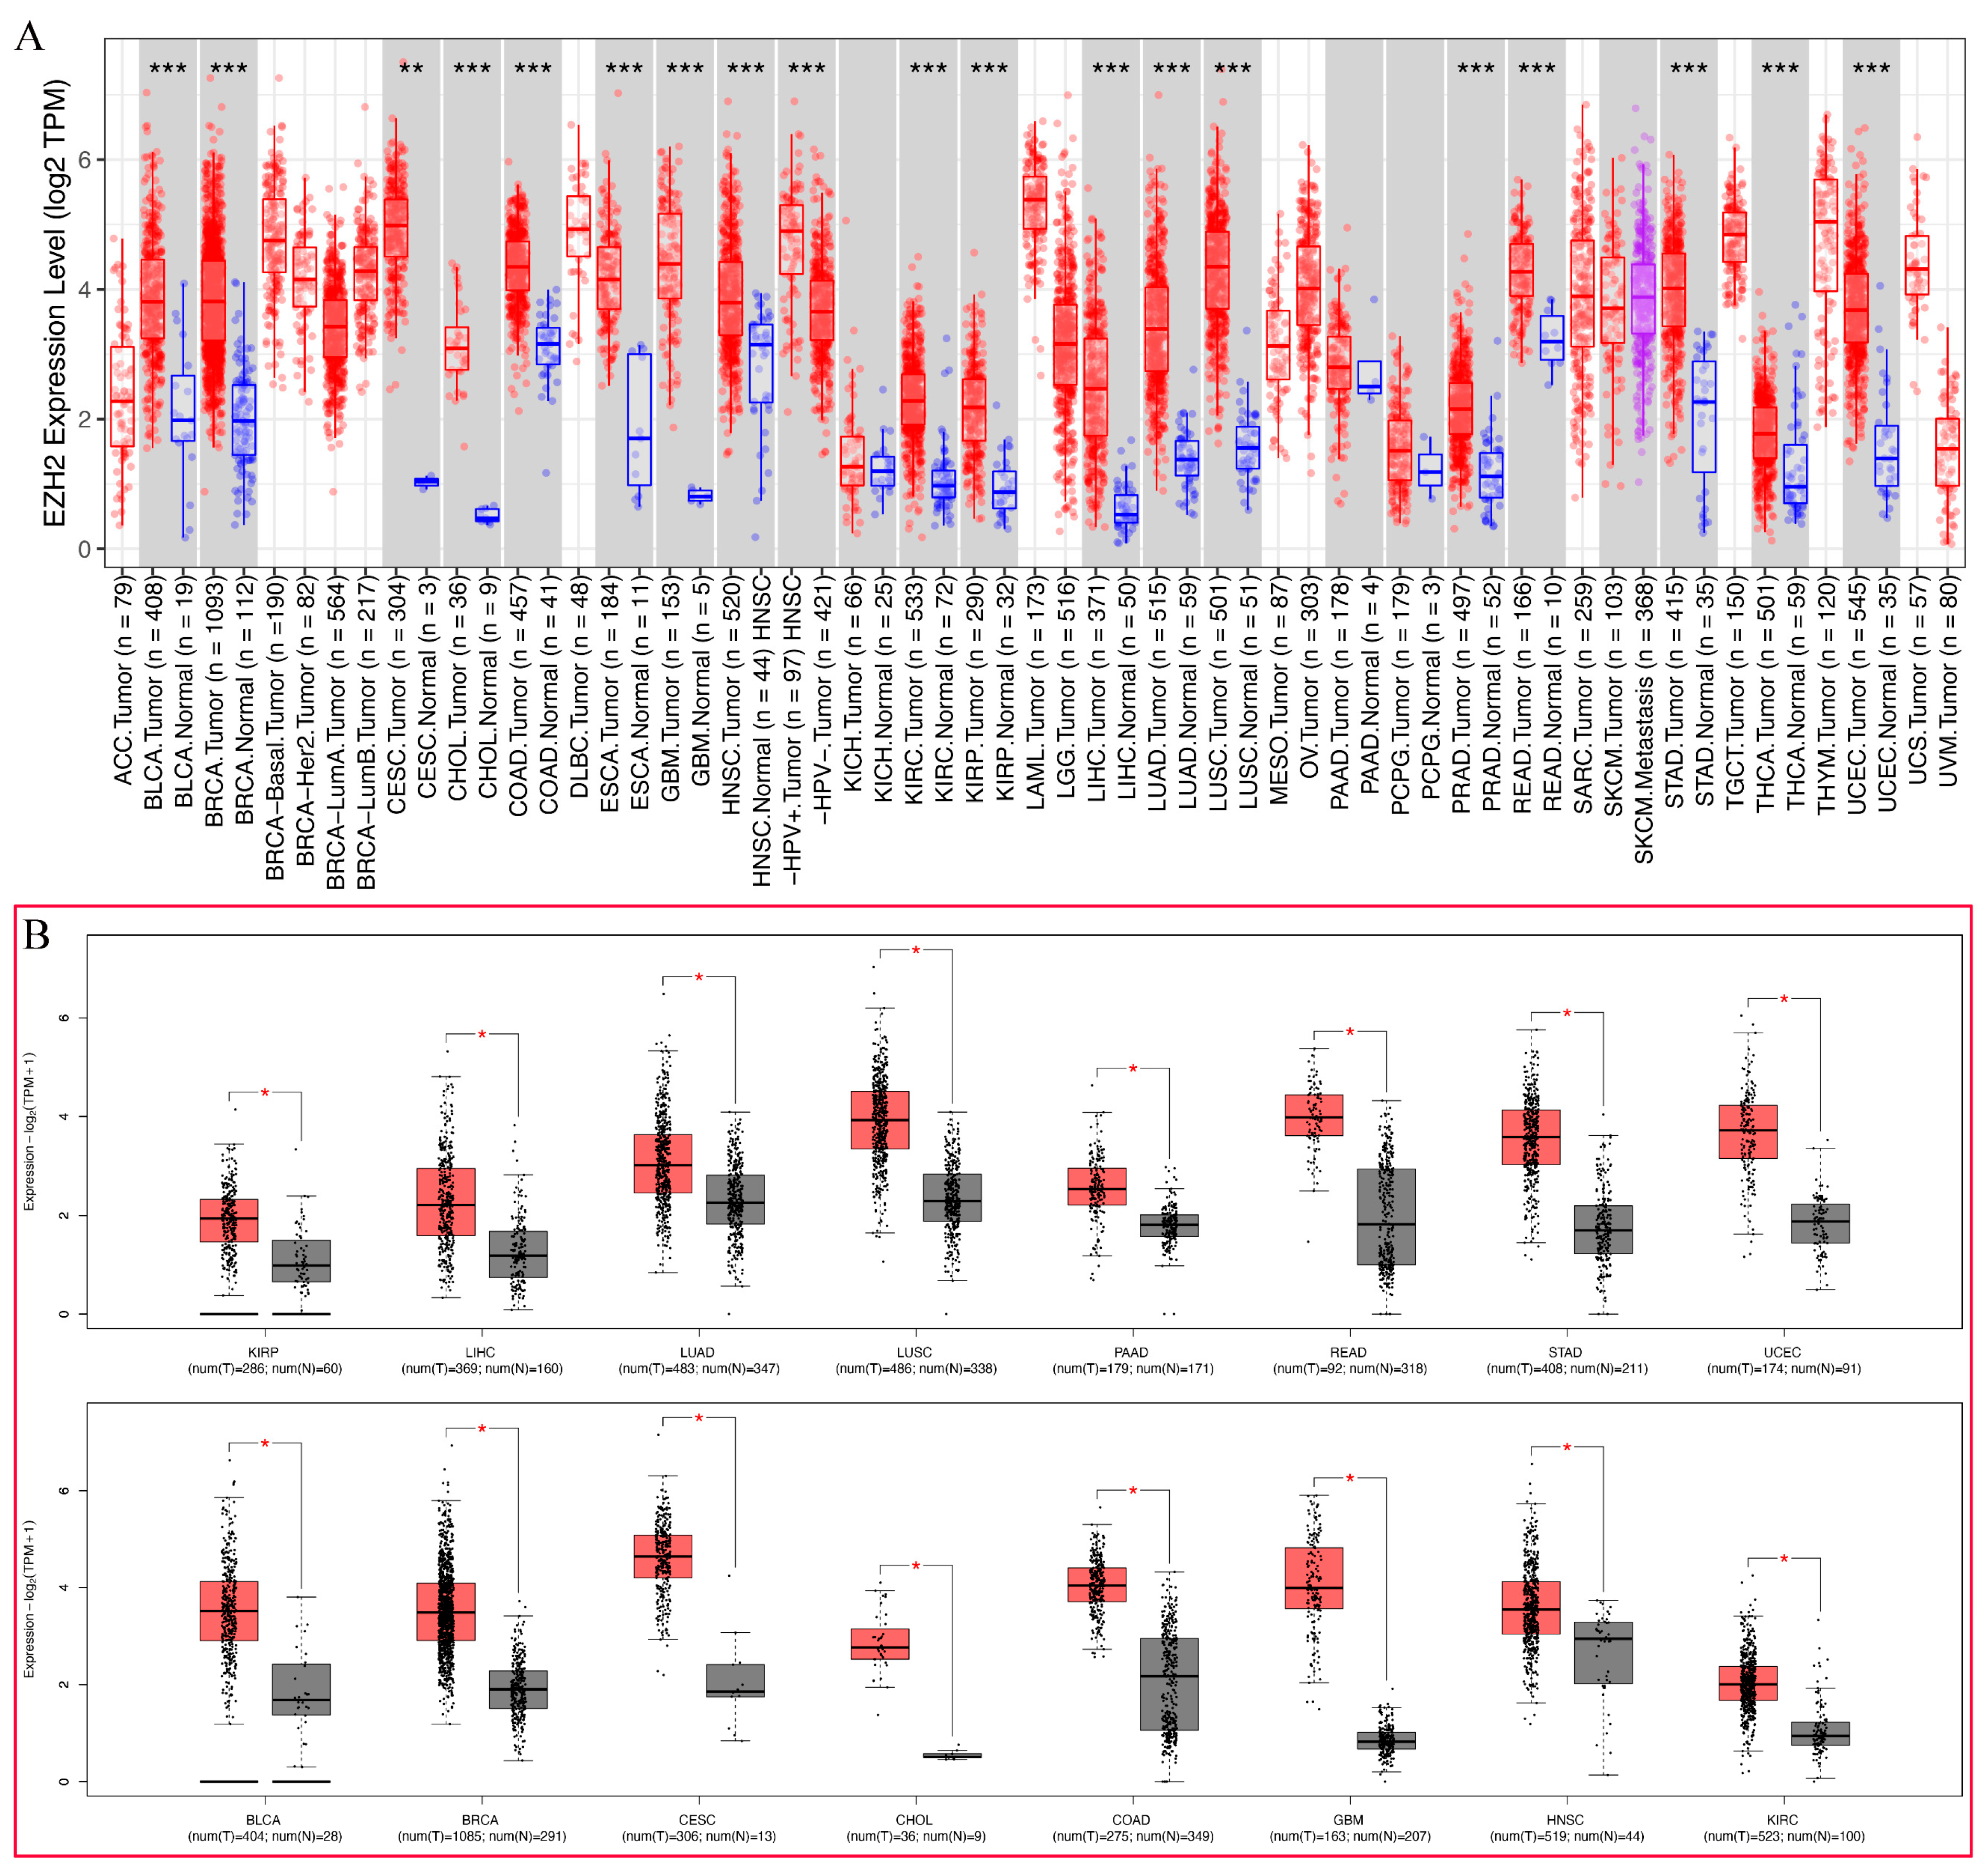
To explore the possible carcinogenic roles of EZH2, differential expression analyses were conducted in 21 types of human cancer. As shown in Figure 2A, the expression level of EZH2 in tumor tissues was significantly higher than in the corresponding normal tissues, including BLCA, BRCA, CESC, CHOL, COAD, ESCA, GBM, HNSC, KIRC, KIRP, LIHC, LUAD, LUSC, PRAD, READ, STAD, THCA, and UCEC. However, no significant difference in EZH2 in KICH, PAAD, and PCPG was observed. To further validate the expression levels of EZH2 in 21 types of human cancer, the GEPIA2 database, including the TCGA and GTEx datasets, was employed. Compared with normal tissues, EZH2 was significantly upregulated in 16 cancer types, including BLCA, BRCA, CESC, CHOL, COAD, GBM, HNSC, KIRC, KIRP, LIHC, LUAD, LUSC, PAAD, READ, STAD, and UCEC, but not in others (Figure 2B). These results demonstrate that upregulated EZH2 can support tumor growth and further imply that it is a crucial regulator in carcinogenesis for 15 types of cancer, including BLCA, BRCA, CESC, CHOL, COAD, GBM, HNSC, KIRC, KIRP, LIHC, LUAD, LUSC, READ, STAD, and UCEC.

3.3. Prognostic Analysis of EZH2 in Human Cancers

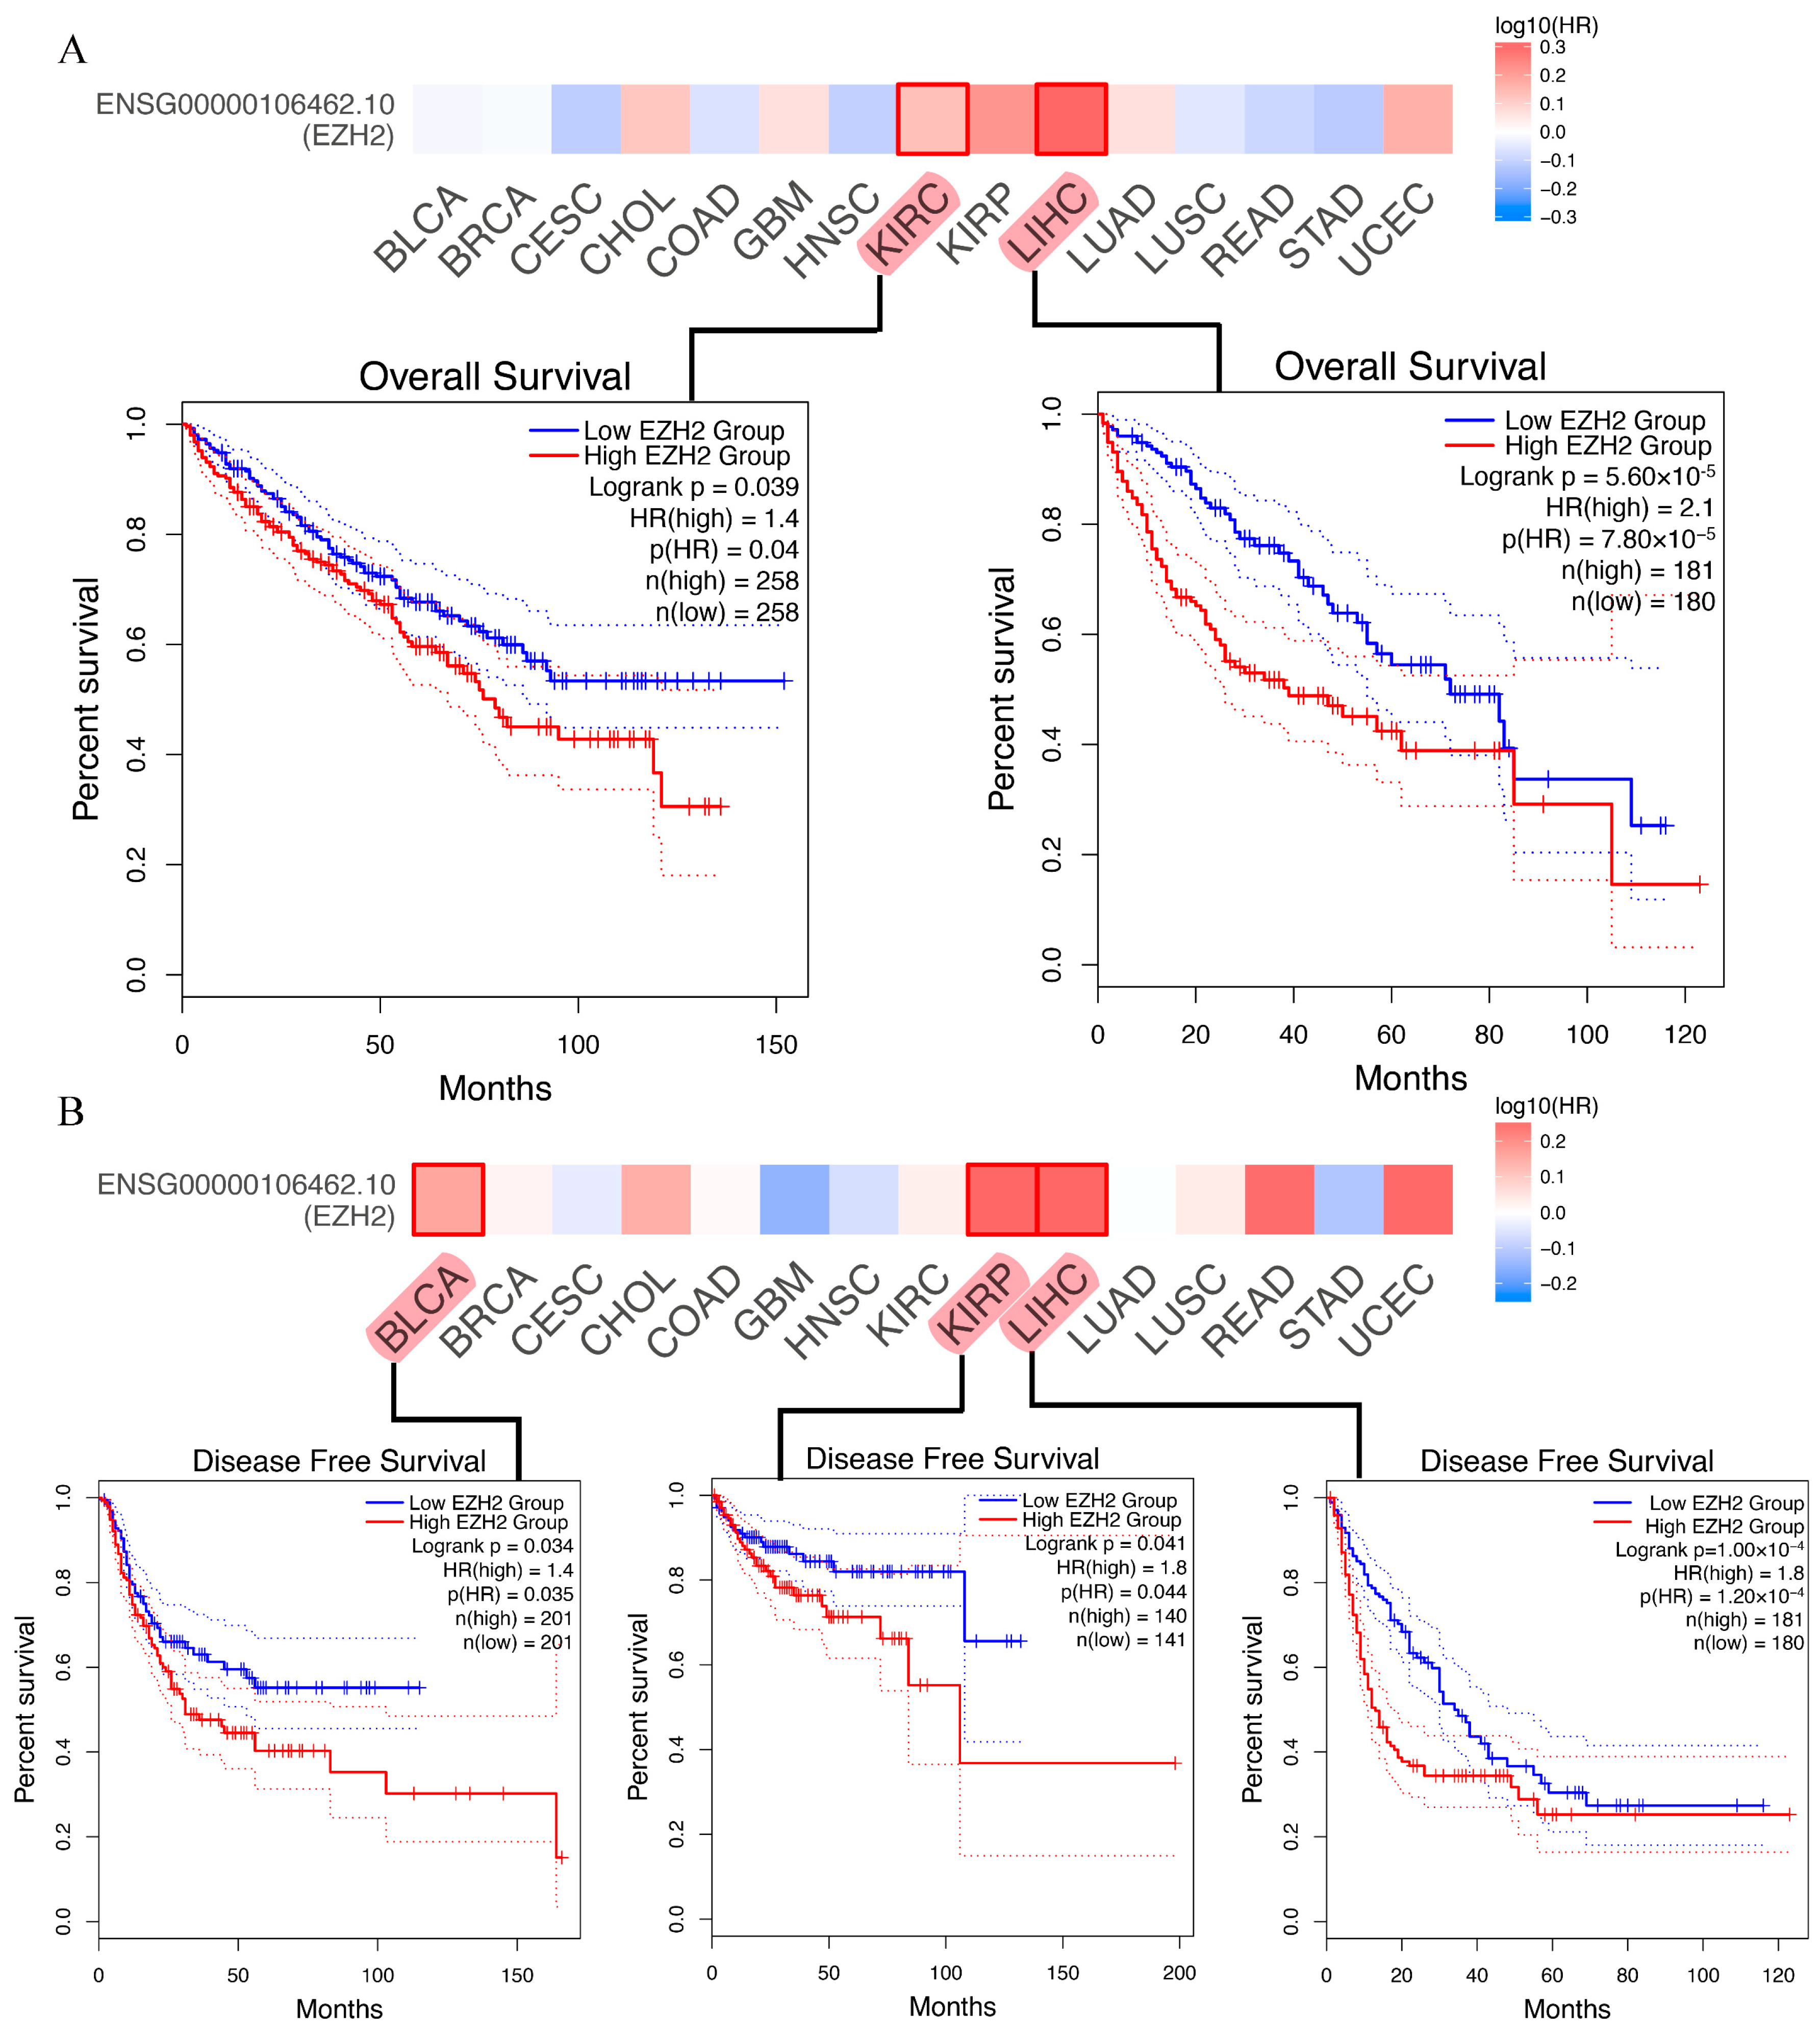
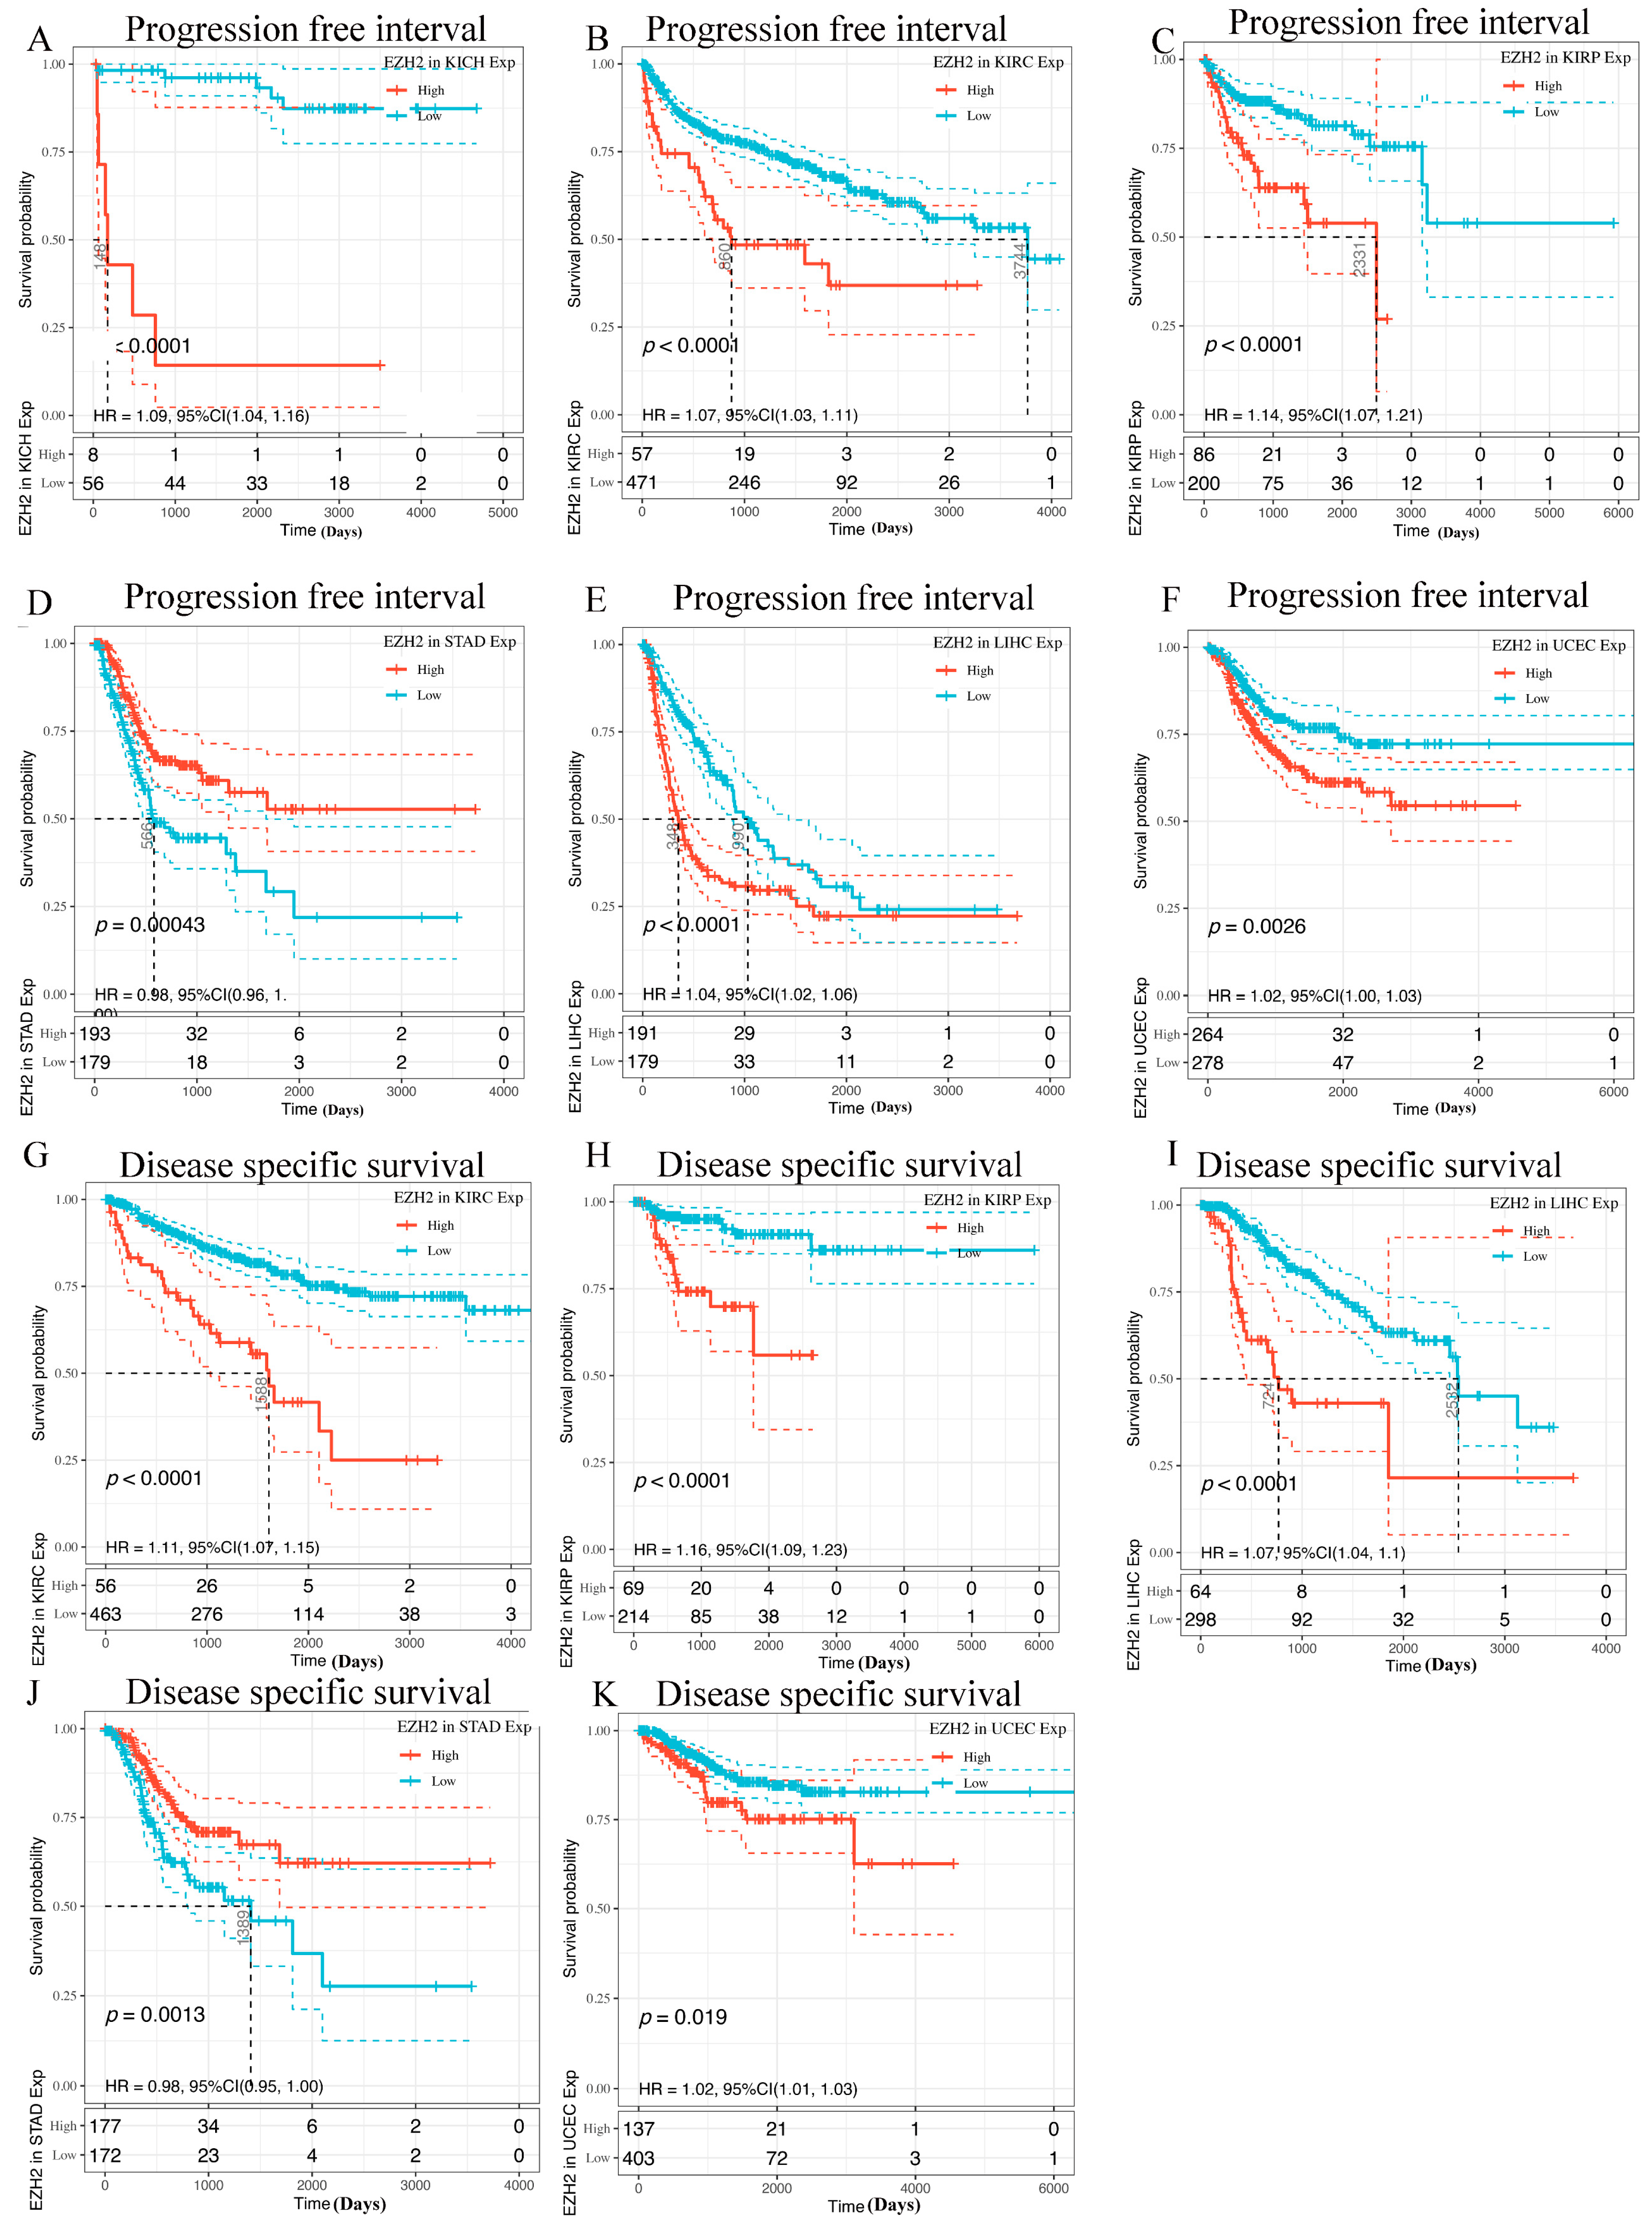
To determine whether EZH2 expression levels are correlated with the prognosis of cancer patients, we evaluated the prognostic value of EZH2 in cancer using the GEPIA2 database. For these 15 cancers, four prognosis-related indicators, including OS, DFS, PFI, and DSS, were used to evaluate the prognostic value of EZH2. In OS analysis, high expression of EZH2 predicted worse survival in patients with LIHC or KIRC (Figure 3A). DFS analysis showed that high EZH2 expression is correlated with poor prognosis for the TCGA cases of BLCA, KIRP, and LIHC (Figure 3B). In PFI analysis, high expression of EZH2 was found to serve as an indicator of worse prognosis in KICH, KIRC, KIRP, LIHC, STAD, and UCEC (Figure 4A–F). In addition, high expression of EZH2 was also associated with a shorter DFI in patients with KIRC, KIRP, LIHC, STAD, STAD, and UCEC (Figure 4G–K). Through the combination of the four prognosis-related indicators, upregulated EZH2 may be utilized as an unfavorable prognostic biomarker in patients with HCC.

3.4. Prediction of Upstream miRNAs of EZH2

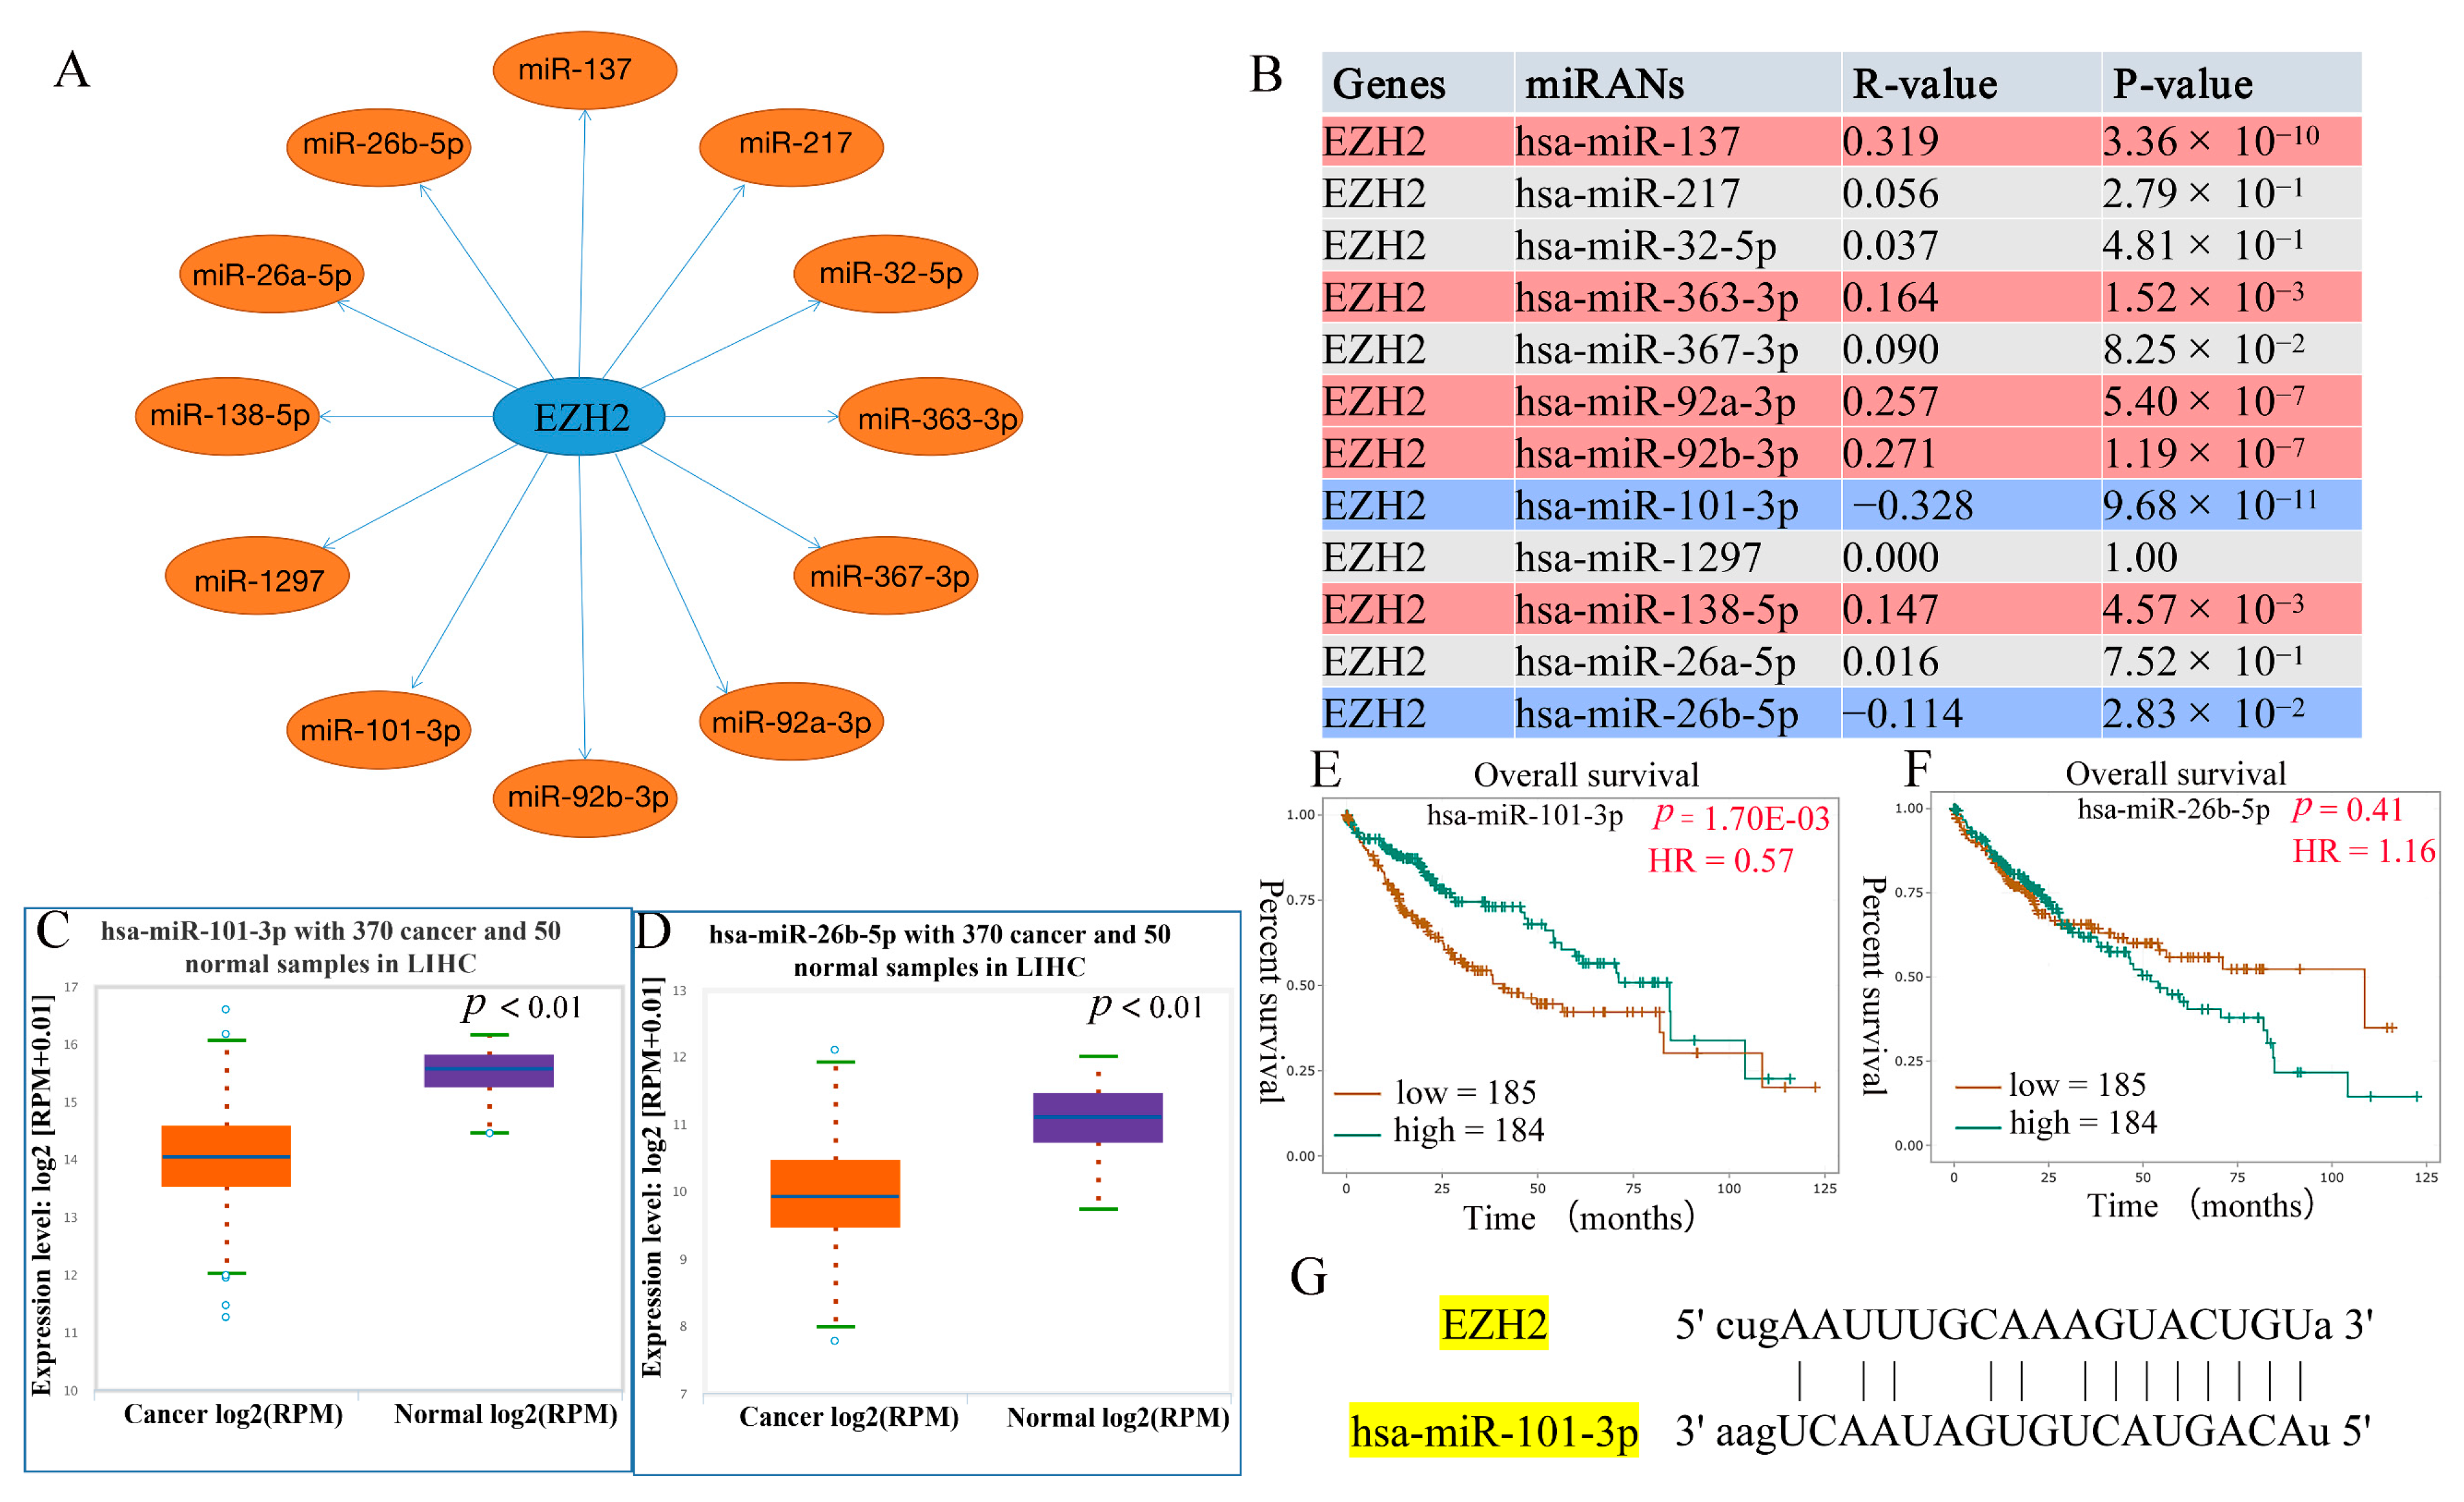
Non-coding RNA (ncRNA) comprises RNA molecules that do not encode a protein but regulate gene expression at multiple levels, including RNA splicing, editing, chromatin structure, and transcription [21]. To determine whether EZH2 was regulated by some ncRNAs, the ENCORI database was used to predict upstream miRNAs that could potentially bind to EZH2. As shown in Figure 5A, 12 miRNAs were identified, namely, hsa-miR-137, hsa-miR-217, hsa-miR-32-5p, hsa-miR-363-3p, hsa-miR-367-3p, hsa-miR-92a-3p, hsa-miR-92b-3p, hsa-miR-101-3p, hsa-miR-1297, hsa-miR-138-5p, hsa-miR-26a-5p, and hsa-miR-26b-5p, which might be involved in regulating the expression of the regulators by targeting EZH2. The results also show that hsa-miR-137 (R = 0.319, p = 3.36 × 10¹⁰), hsa-miR-363-3p (R = 0.164, p = 1.52 × 10⁻³), hsa-miR-92b-3p (R = 0.271, p = 1.19 × 10⁻⁷), and hsa-miR-138-5p (R = 0.147, p = 4.57 × 10⁻³) positively regulated EZH2 expression (Figure 5B). However, hsa-miR-101-3p (R = −0.328, p = 9.68 × 10⁻¹¹) and hsa-miR-26b-5p (R = −0.114, p = 2.83 × 10⁻²) negatively regulated EZH2 expression (Figure 5B). The general idea of the combined analysis of miRNA and mRNA is to find the target gene and target miRNA according to the negative correlation between miRNA expression and target gene expression given the targeted relationship between miRNA and mRNA [22]. Ultimately, hsa-miR-101-3p and hsa-miR-26b-5p were identified as the upstream miRNAs that could potentially bind to EZH2. We further examined whether hsa-miR-101-3p and hsa-miR-26b-5p were involved in the regulation of the expression of EZH2 in HCC based on expression and survival analysis. The results demonstrate that hsa-miR-101-3p (p = 6.80 × 10⁻³¹) was markedly downregulated in HCC and its upregulation was positively linked to patients’ prognosis (HR = 0.57, p = 1.70 × 10⁻³) (Figure 5C,E). Furthermore, hsa-miR-26b-5p (p = 2.90 × 10⁻²²) was markedly downregulated in HCC (Figure 5D). However, the result indicates that hsa-miR-26b-5p overexpression was not associated with LIHC prognosis (HR = 1.16, p = 0.41) (Figure 5F). Meanwhile, the pairing information of hsa-miR-101-3p and EZH2 is displayed (Figure 5G). Taken together, these results indicate that hsa-miR-101-3p regulation of EZH2 expression might be involved in LIHC progression.

3.5. Prediction of Upstream lncRNAs of hsa-miR-101-3p

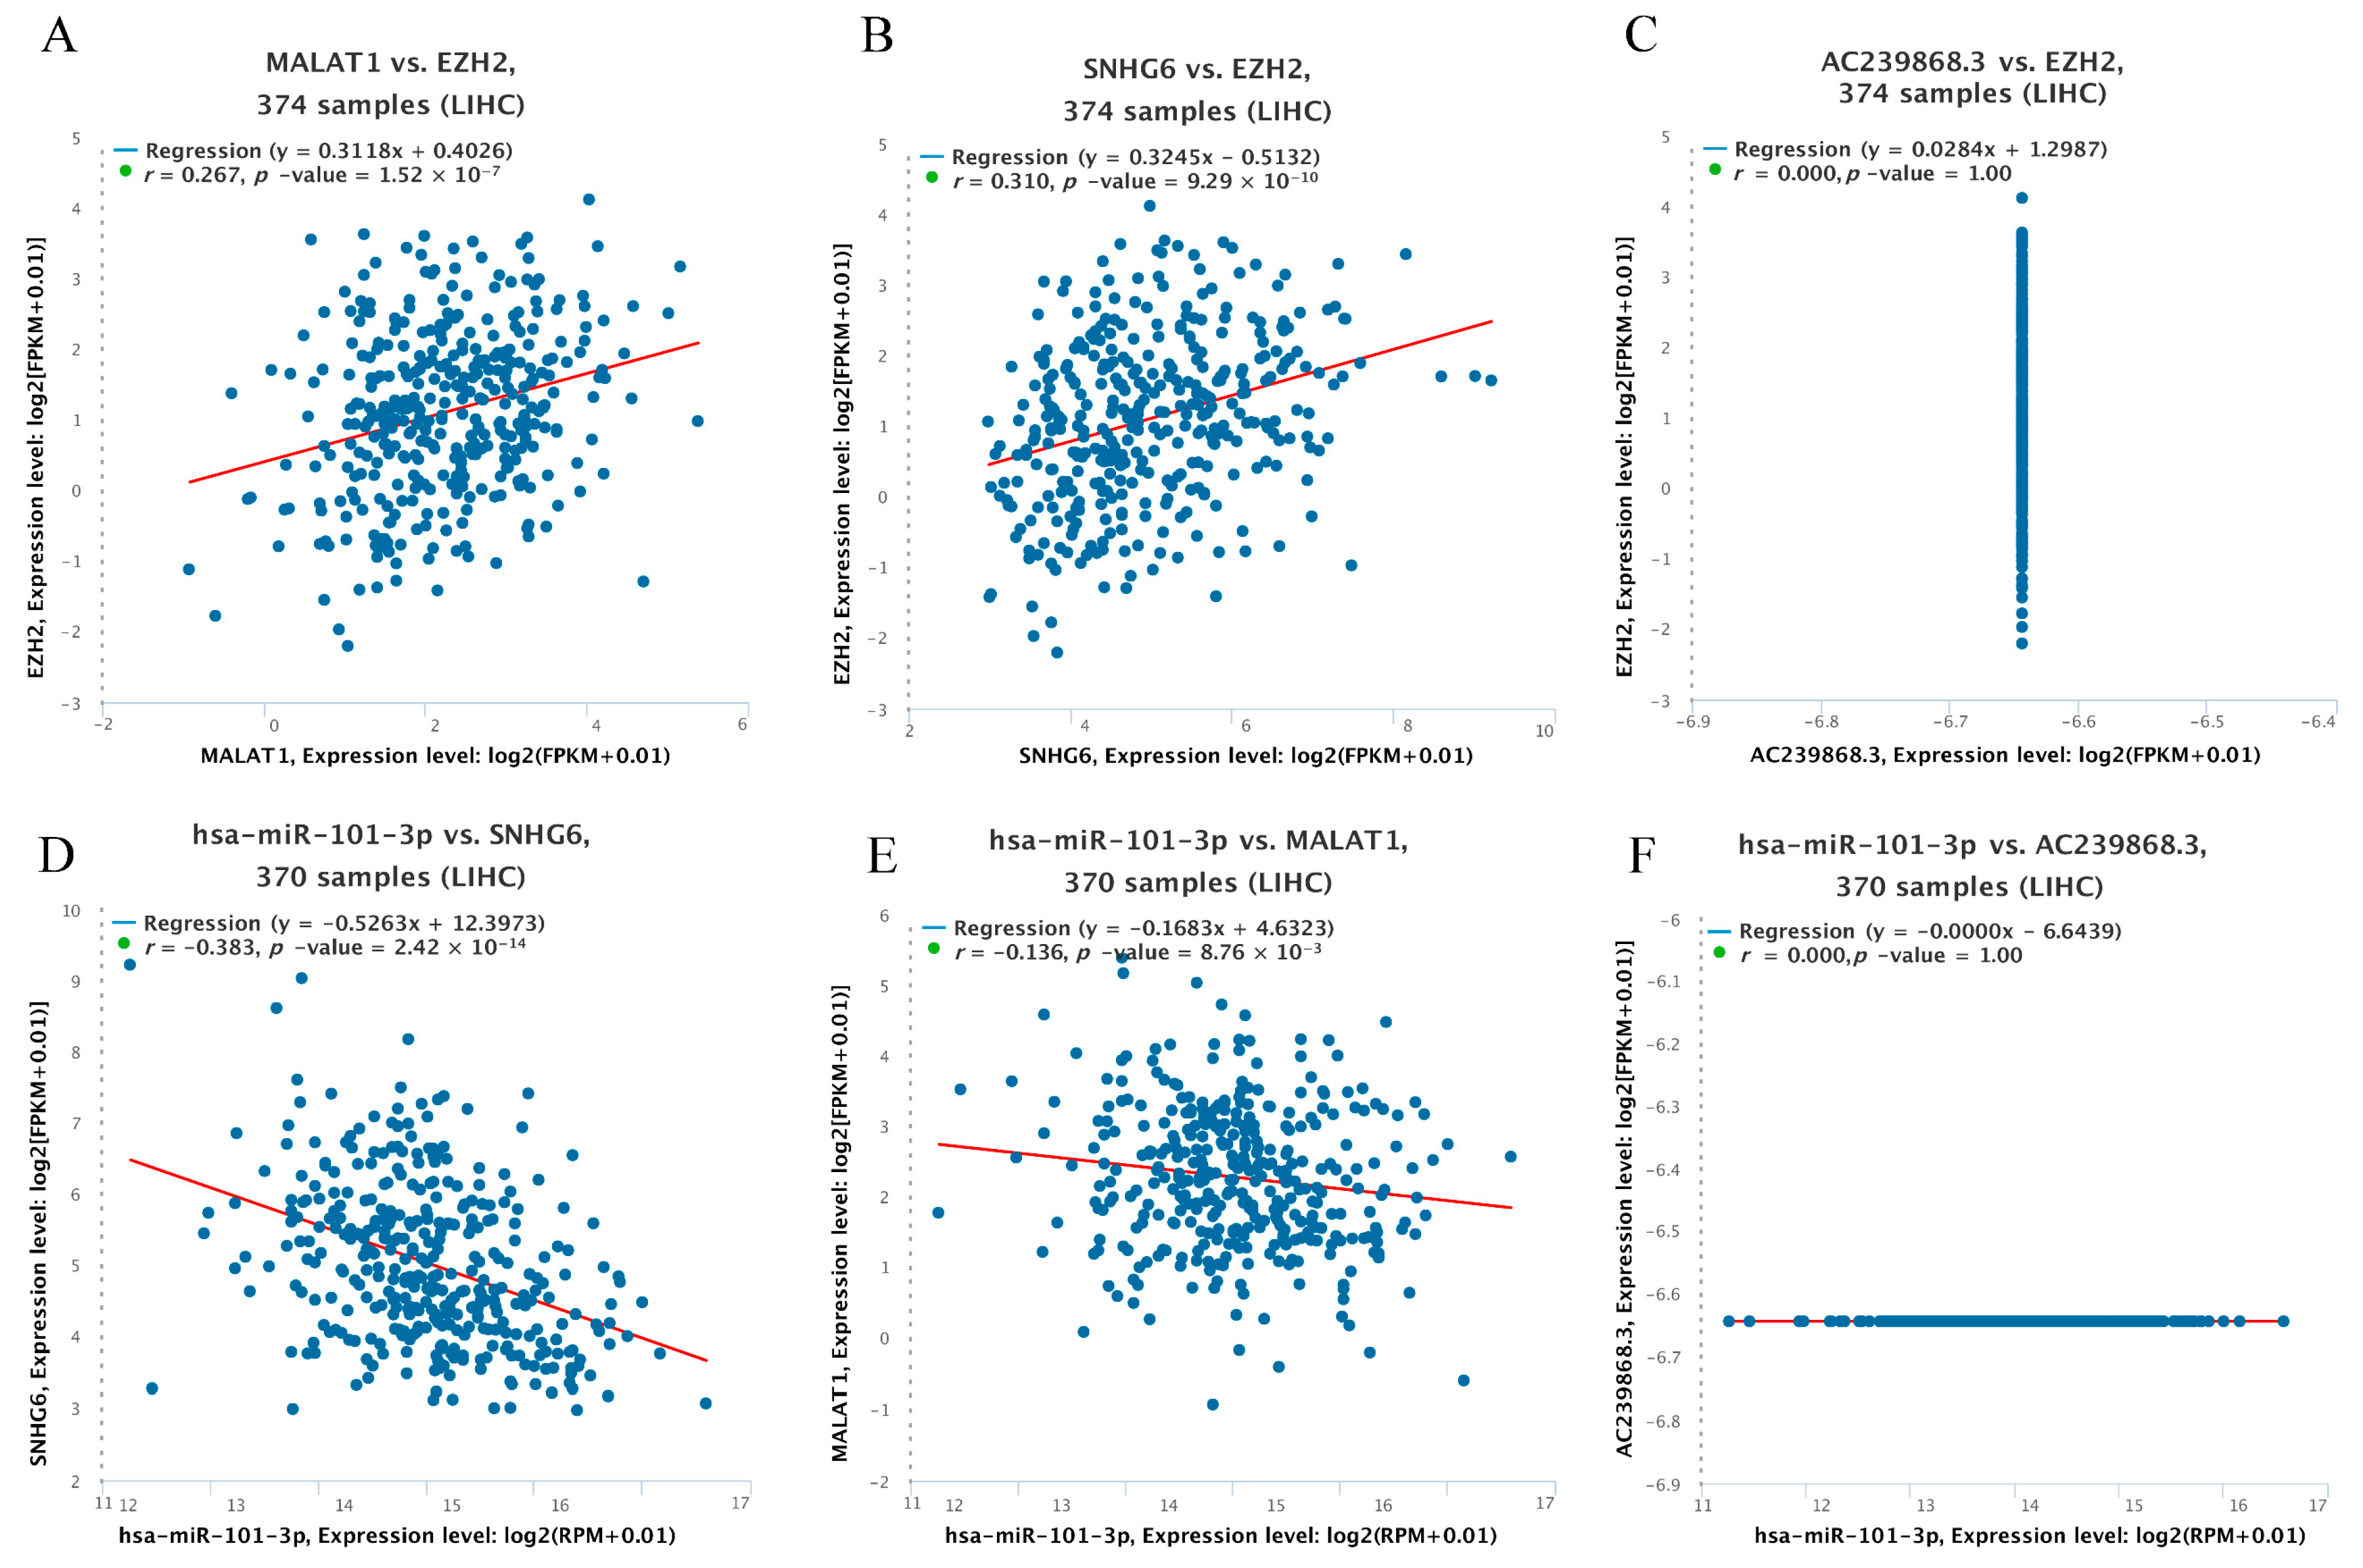
Here, we explored upstream lncRNAs of hsa-miR-101-3p based on the ENCORI database. The results reveal that 63 possible lncRNAs were identified as upstream lncRNAs of hsa-miR-101-3p. We assessed these lncRNAs’ differential expression levels between tumor and normal tissues using data from the TCGA and GTEx databases. Among the selected lncRNAs, we only identified three lncRNAs, namely, AC239868.3, SNHG6, and MALAT1, whose expression was significantly upregulated in HCC compared with normal controls (Figure 6A–C). Additionally, the pairing information of hsa-miR-101-3p–SNHG6, hsa-miR-101-3p–MALAT1, and hsa-miR-101-3p–AC239868.3 is displayed (Figure 6D–F). Meanwhile, we found that different pathological stages of HCC showed higher SNHG6 or MALAT1 expression compared with normal tissues (Figure 6G,H). Unfortunately, none of the data could be used to assess the correlation of AC239868.3 between different pathological stages of HCC and normal tissues. According to the competing endogenous RNA (ceRNA) theory, lncRNAs can act as endogenous RNAs and thereby regulate target gene transcripts by competing with shared miRNAs [23]. Thus, the correlation of expression values between the miRNA and the lncRNAs must be negative, and the correlation values between the lncRNAs and the mRNA must be positive. Subsequently, pairwise correlations between mRNA, miRNAs, and lncRNAs were explored to identify collinearity using the ENCORI database (Figure 7A–F). Eventually, SNHG6 and MALAT1 were determined to be directly targeted by hsa-miR-101-3p, and AC239868.3 was ultimately not identified as a potential upstream lncRNA of hsa-miR-101-3p.

3.6. Immune Cell Infiltration and Chemotactic Activity Analysis of EZH2 in LIHC

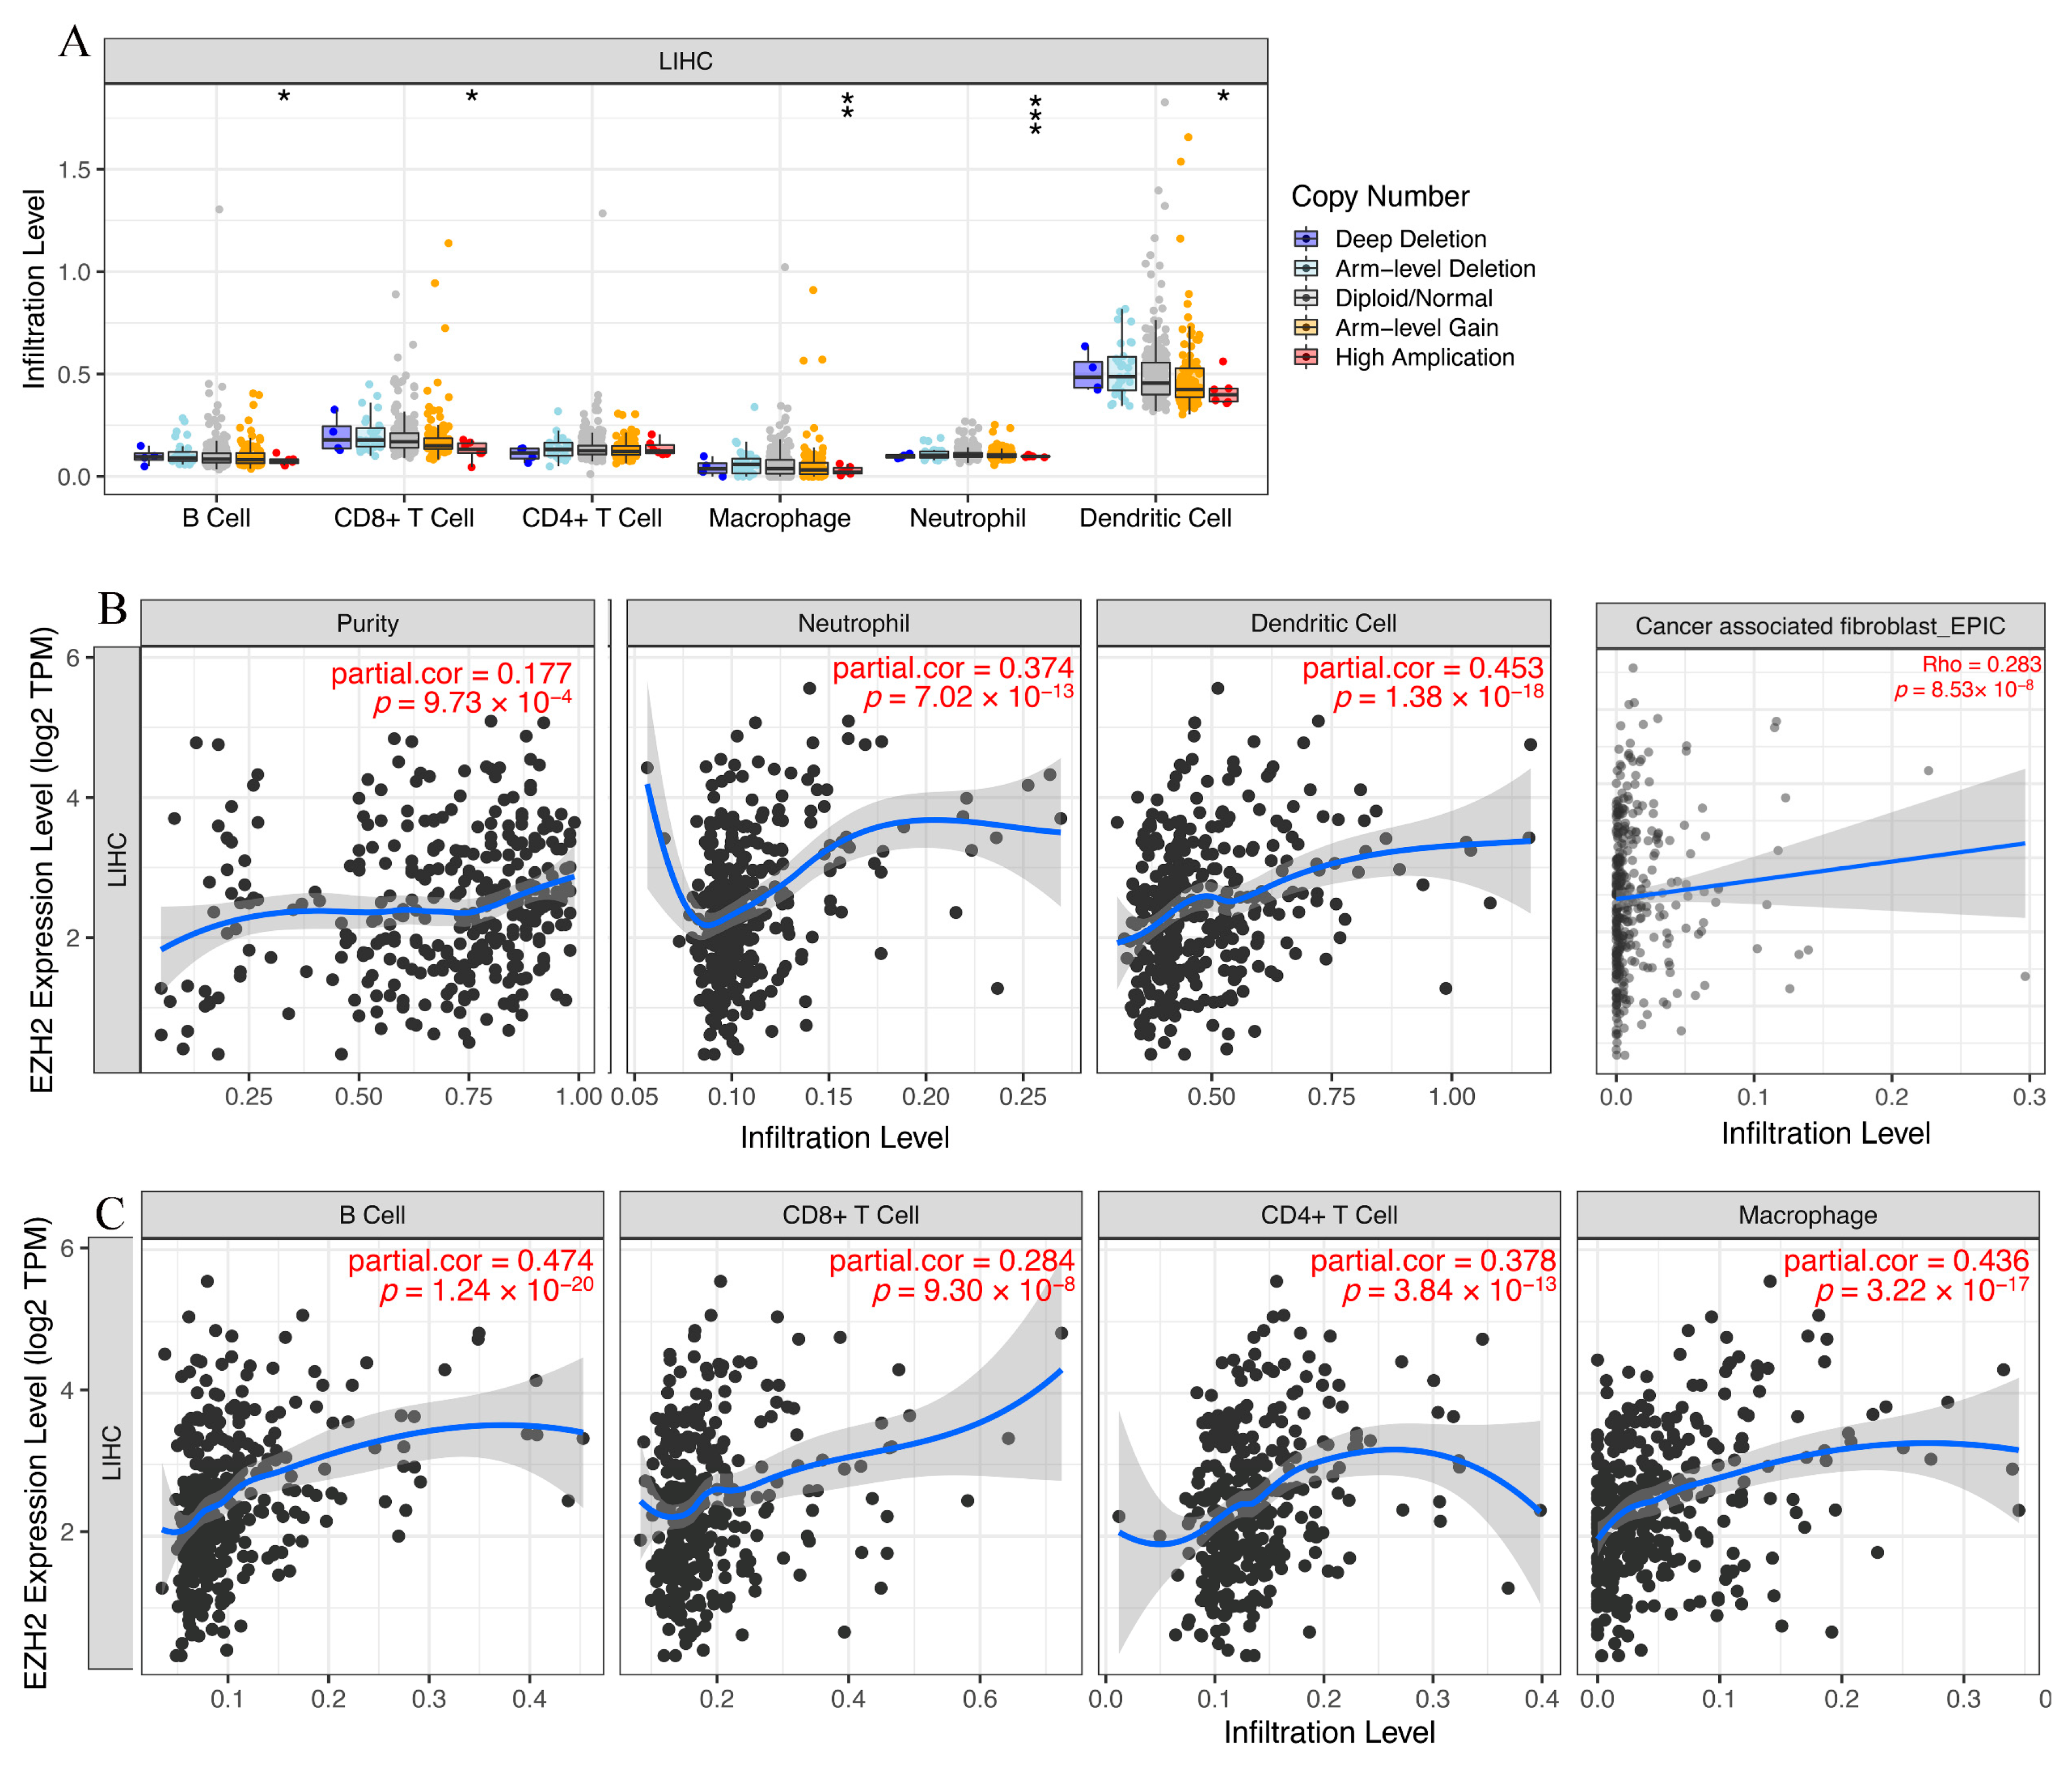
Given the known role of immune cells in tumor pathogenesis and the involvement of EZH2 in immune cell development, differentiation, and function [24], the identification of EZH2 expression associated with tumor-related immune cell infiltration will facilitate the monitoring of the HCC immunotherapy response and the exploration of the immune infiltration mechanism. We investigated the relationship between EZH2 and immune cell infiltration in HCC and found that the high copy number amplification in B cells, CD8+ T cells, macrophages, neutrophils, and dendritic cells indicated significantly downregulated expression in HCC (Figure 8A). Immune infiltration analysis revealed a significant correlation between the expression of EZH2 and the abundance of immune cell infiltration, including B cells, CD4+ T cells, CD8+ T cells, macrophages, neutrophils, dendritic cells, and cancer-associated fibroblasts (CAFs), in LIHC tissues (Figure 8B,C). Many of these factors, including CXCL chemokines and CCL chemokines, are important for the regulation and chemotaxis of immune cells, especially monocytes/macrophages, T lymphocytes, and eosinophils [25]. As listed in Table 1, EZH2 expression was significantly positively correlated with monocyte-/macrophage-related chemokines (CCL5, CCL7, CCL8, and CCL13), T lymphocyte-related chemokines (CCL1), mast cell-related chemokines (CCR1, CCR2, CCR3, CCR4, CCR5, CXCR2, and CXCR4), eosinophil-related chemokines (CCL26, CCL5, CCL13, and CCL5), and neutrophil-related chemokines (CXCL8). Collectively, these results are in line with expectations and strongly suggest that EZH2 is positively linked to immune cell infiltration and chemotactic activities and plays a vital role in LIHC immunity.

3.7. Expression Correlation of EZH2 and Biomarkers of Immune Cells in HCC

To further validate the notion that EZH2 is positively associated with immune cell infiltration in HCC, we investigated the relationship between EZH2 expression and the representative immune markers of several immune cells, including B cells, CD8+ T cells, CD4+ T cells, M1 macrophages, M2 macrophages, neutrophils, and dendritic cells (Table 2). In the GEPIA2 database, the expression levels of EZH2 were found to be strongly correlated with most immune markers, including B cells (CD19), CD8+ T cells (CD8A and CD8B), CD4+ T cells (CD4), M1 macrophages (IRF5), M2 macrophages (CD163, VSIG4, and MS4A4A), neutrophils (ITGAM), and dendritic cells (HLA-DPB1, HLA-DRA, HLA-DPA1, CD1C, NRP1, and ITGAX). Similar results were observed in the TIMER database. Taken together, the findings indicate that these immune marker genes play a key role in immune cell infiltration, indicating that EZH2 may be involved in immune surveillance and immune escape.

3.8. Correlation between EZH2 Expression and Immune Checkpoints in HCC

Immunotherapy based on PD-1/PDL1 and CTLA-4 has emerged as a new pillar of cancer treatment for patients with HCC [26]. To determine the influence that EZH2 expression had on immunotherapy in patients with LIHC, we next evaluated the relationship between EZH2 expression and PD-1, PD-L1, or CTLA-4 based on two different databases. For TIMER, the expression of EZH2 in HCC was significantly positively correlated with PD-1, PD-L1, and CTLA-4 (Figure 9A–C). We observed the same positive correlation in GEPIA (Figure 9D–F). Thus, these results imply that positive EZH2 expression may predict a better response to immunotherapy than negative expression.

3.9. Functional Analysis of EZH2 by GSEA

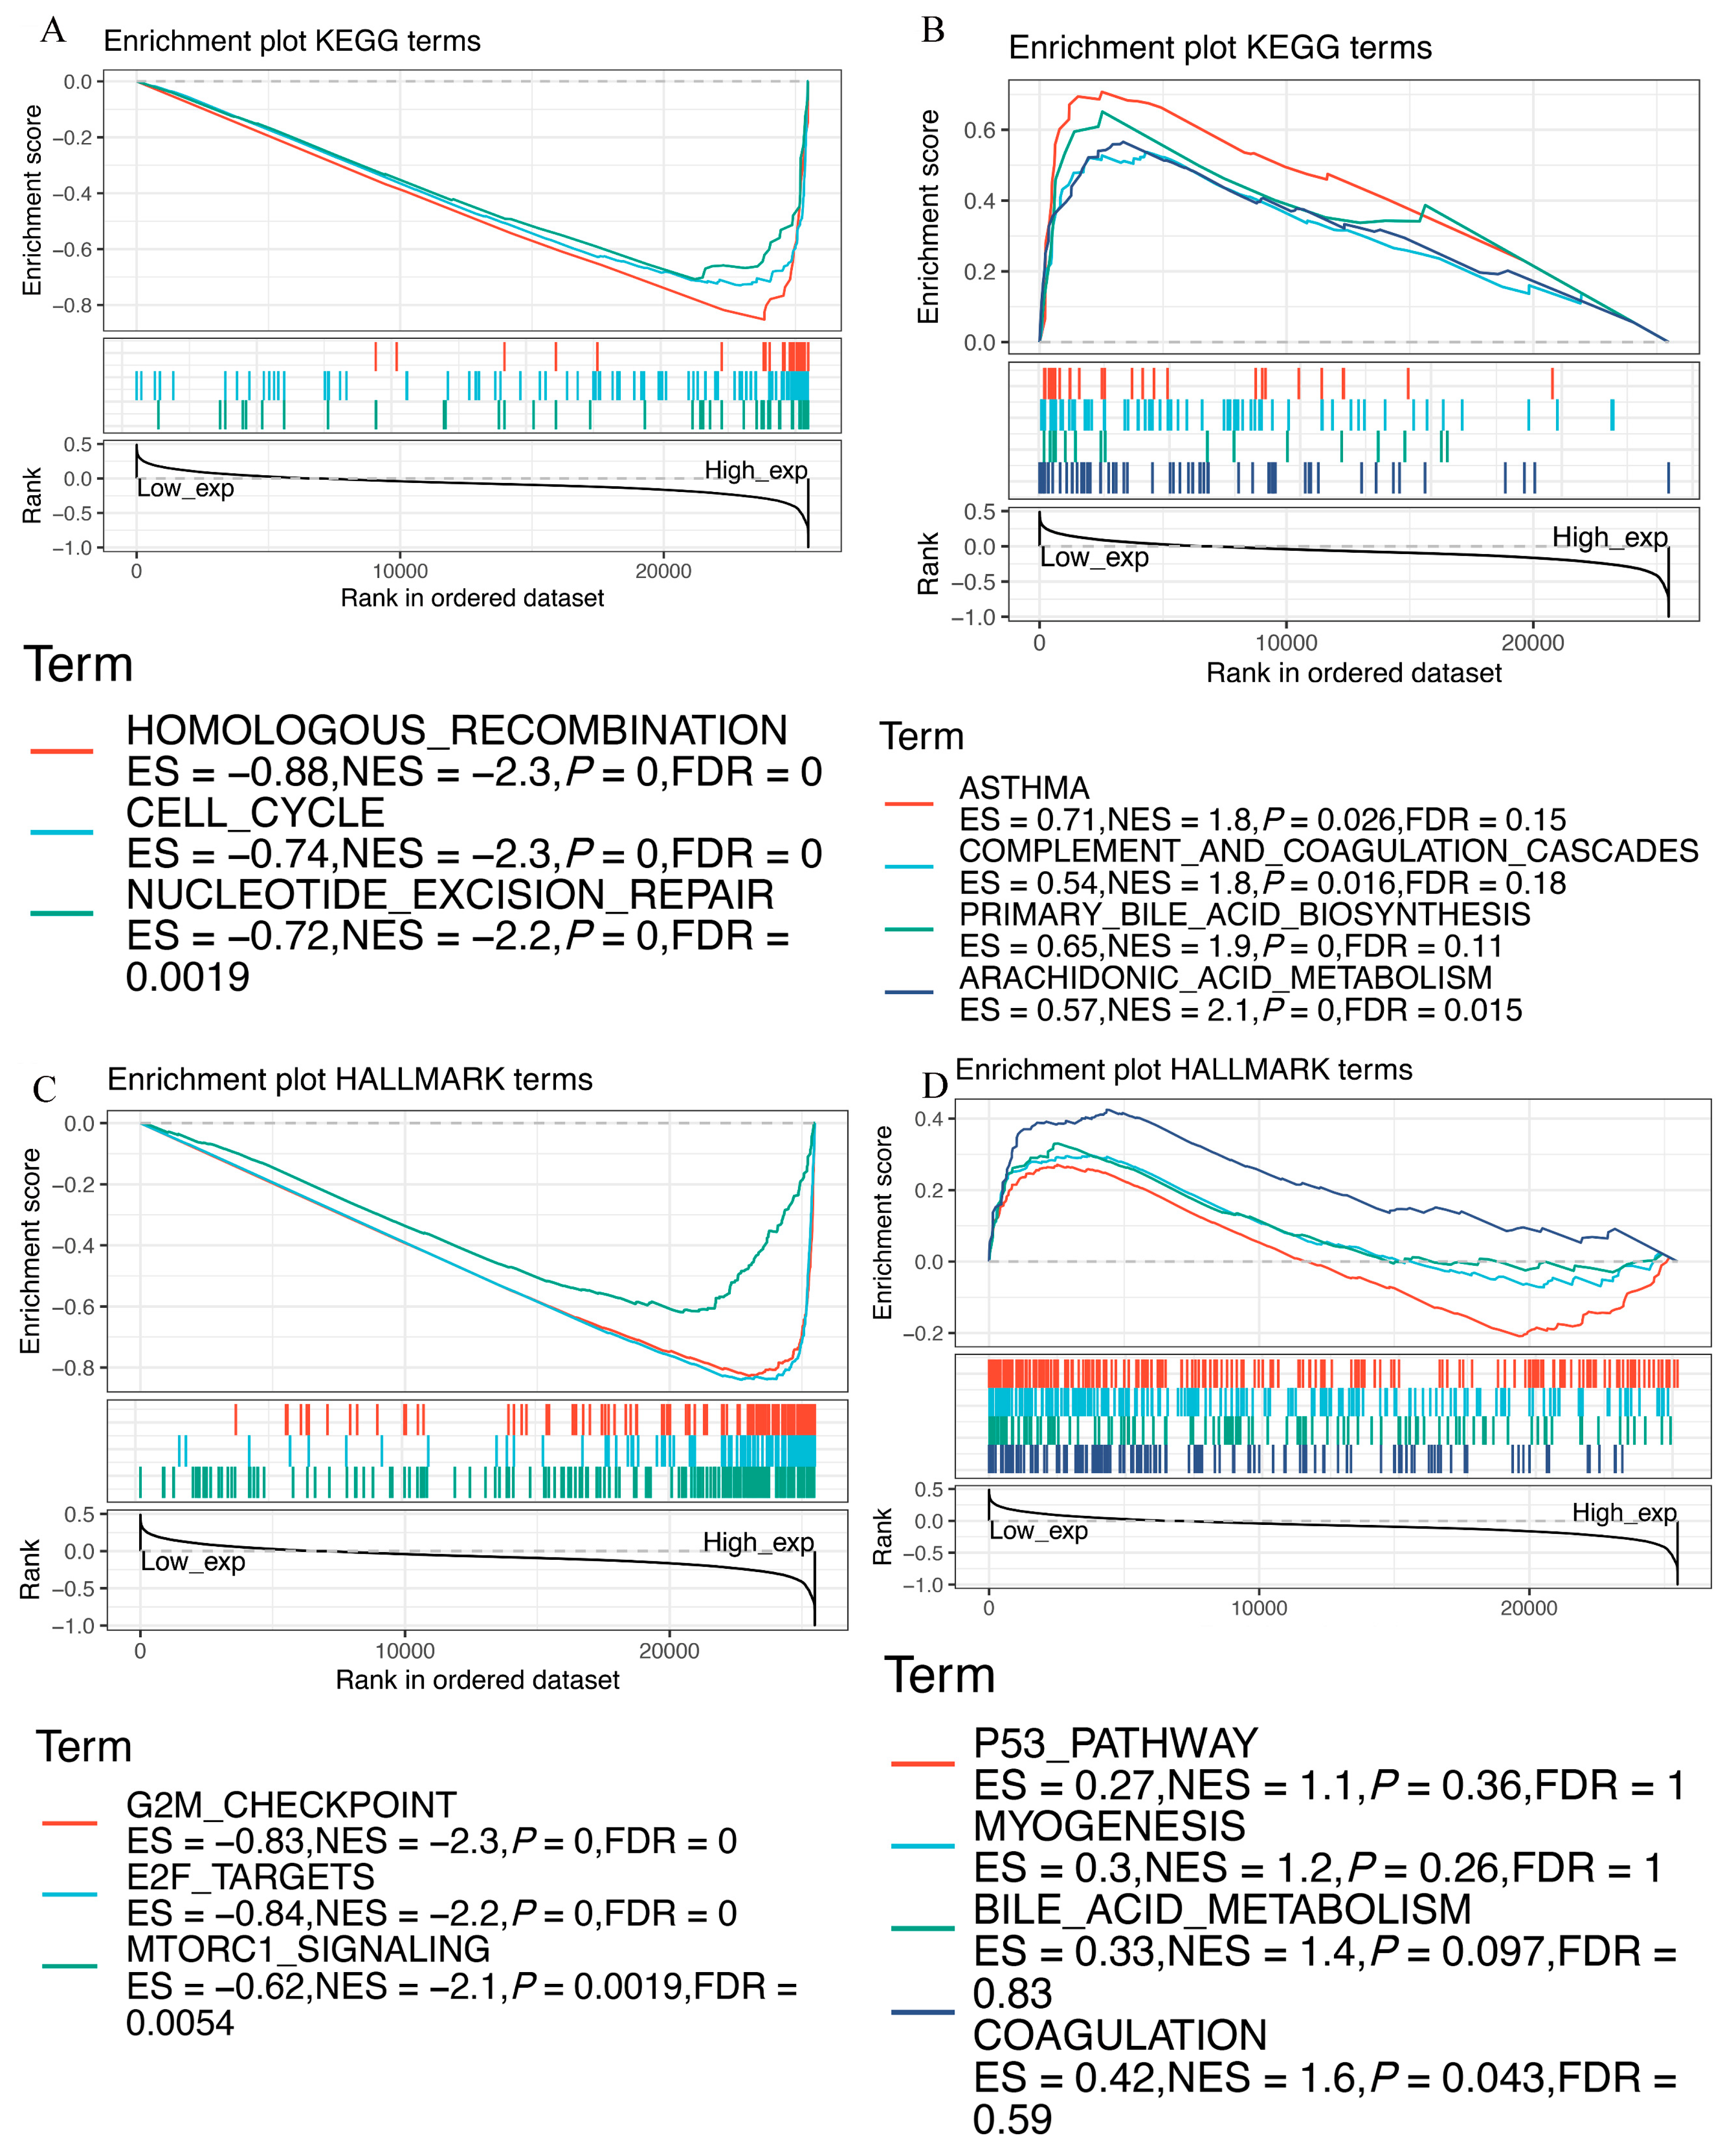
GSEA was performed to explore the biological role of EZH2. The KEGG enrichment terms indicated that high expression of EZH2 is mainly associated with the cell cycle, homologous recombination, and nucleotide excision repair, while low expression is mainly associated with asthma, complement and coagulation cascades, primary bile acid biosynthesis, and arachidonic acid metabolism (Figure 10A,B). HALLMARK terms indicated that high expression of EZH2 is associated with the G2M checkpoint, E2F targets, and mtorc1 signaling, while low expression of EZH2 is associated with the p53 pathway, myogenesis, bile acid metabolism, and coagulation (Figure 10C,D). These results suggest the possible signaling pathway and mechanism associated with EZH2’s role in immune and metabolic functioning.

4. Discussion

Liver cancer ranks sixth in terms of incidence among malignancies and is the fourth leading cause of tumor-related death worldwide [1]. HCC is a highly heterogeneous disease that has been documented at the interpatient, intertumoral, and intratumoral levels, which makes its effective treatment challenging [27,28]. Though some progress has been made in the treatment of HCC, such as surgical resection, microwave ablation, and liver transplantation, the prognosis of HCC patients remains poor. Therefore, exploring the pathogenesis of HCC and identifying new targets to combat HCC are urgently needed and possess great significance for its clinical treatment.
EZH2 encodes a member of the PcG family, which is involved in maintaining the transcriptional repressive state of genes over successive cell generations [29]. Existing studies have recognized the critical roles played by EZH2 in tumor angiogenesis and cell proliferation, as well as cell differentiation and apoptosis [30]. Some investigations have demonstrated ncRNA to be closely associated with the occurrence of HCC and its dysfunction to inhibit tumor growth and metastasis [31]. The importance of the immune status in the tumor microenvironment (TME) has been gradually recognized in recent years [32,33]. In HCC, the TME is immunosuppressive and promotes immune tolerance and evasion by various mechanisms, promoting tumor proliferation, invasion, and metastasis [34]. Indeed, either EZH2 or ncRNA can regulate inflammation and participate in immune gene expression, thus affecting the TME [24,35]. Thus, to determine the factor that influences the immunosuppression of the TME and the clinical response of immunotherapy, we need to explore some immunological genes affecting the abundance of immune cells in the TME. Targeted research may significantly change the clinical outcome of HCC.
Increasing evidence has addressed the role of EZH2 in different human malignancies, including ovarian cancer, pancreatic cancer, gastric cancer, and even HCC [36,37,38,39]. EZH2 has been reported to promote the recurrence and progression of HCC and thus is an important factor for tumor growth [36,40]. Previous studies have revealed that high EZH2 expression may represent a novel indicator of poor prognosis in patients with HCC [40,41]. These results are consistent with our present study. In the present study, pan-cancer expression and survival analyses were performed on EZH2 using TCGA datasets, and we found that EZH2 was abnormally expressed in 15 types of cancer, including BLCA, BRCA, CESC, CHOL, COAD, GBM, HNSC, KIRC, KIRP, LIHC, LUAD, LUSC, READ, STAD, and UCEC. In particular, high EZH2 expression in HCC tissues was associated with poor prognosis. The expression results were validated in GEPIA2 using the TCGA and GTEx datasets. Furthermore, we found that the EZH2 expression levels in liver cancers at advanced clinicopathological stages were significantly higher than those in tumors at early stages, implying that increased EZH2 expression may indicate tumor progression in these patients. These reports, together with our analytic results, show the oncogenic role of EZH2 in HCC.
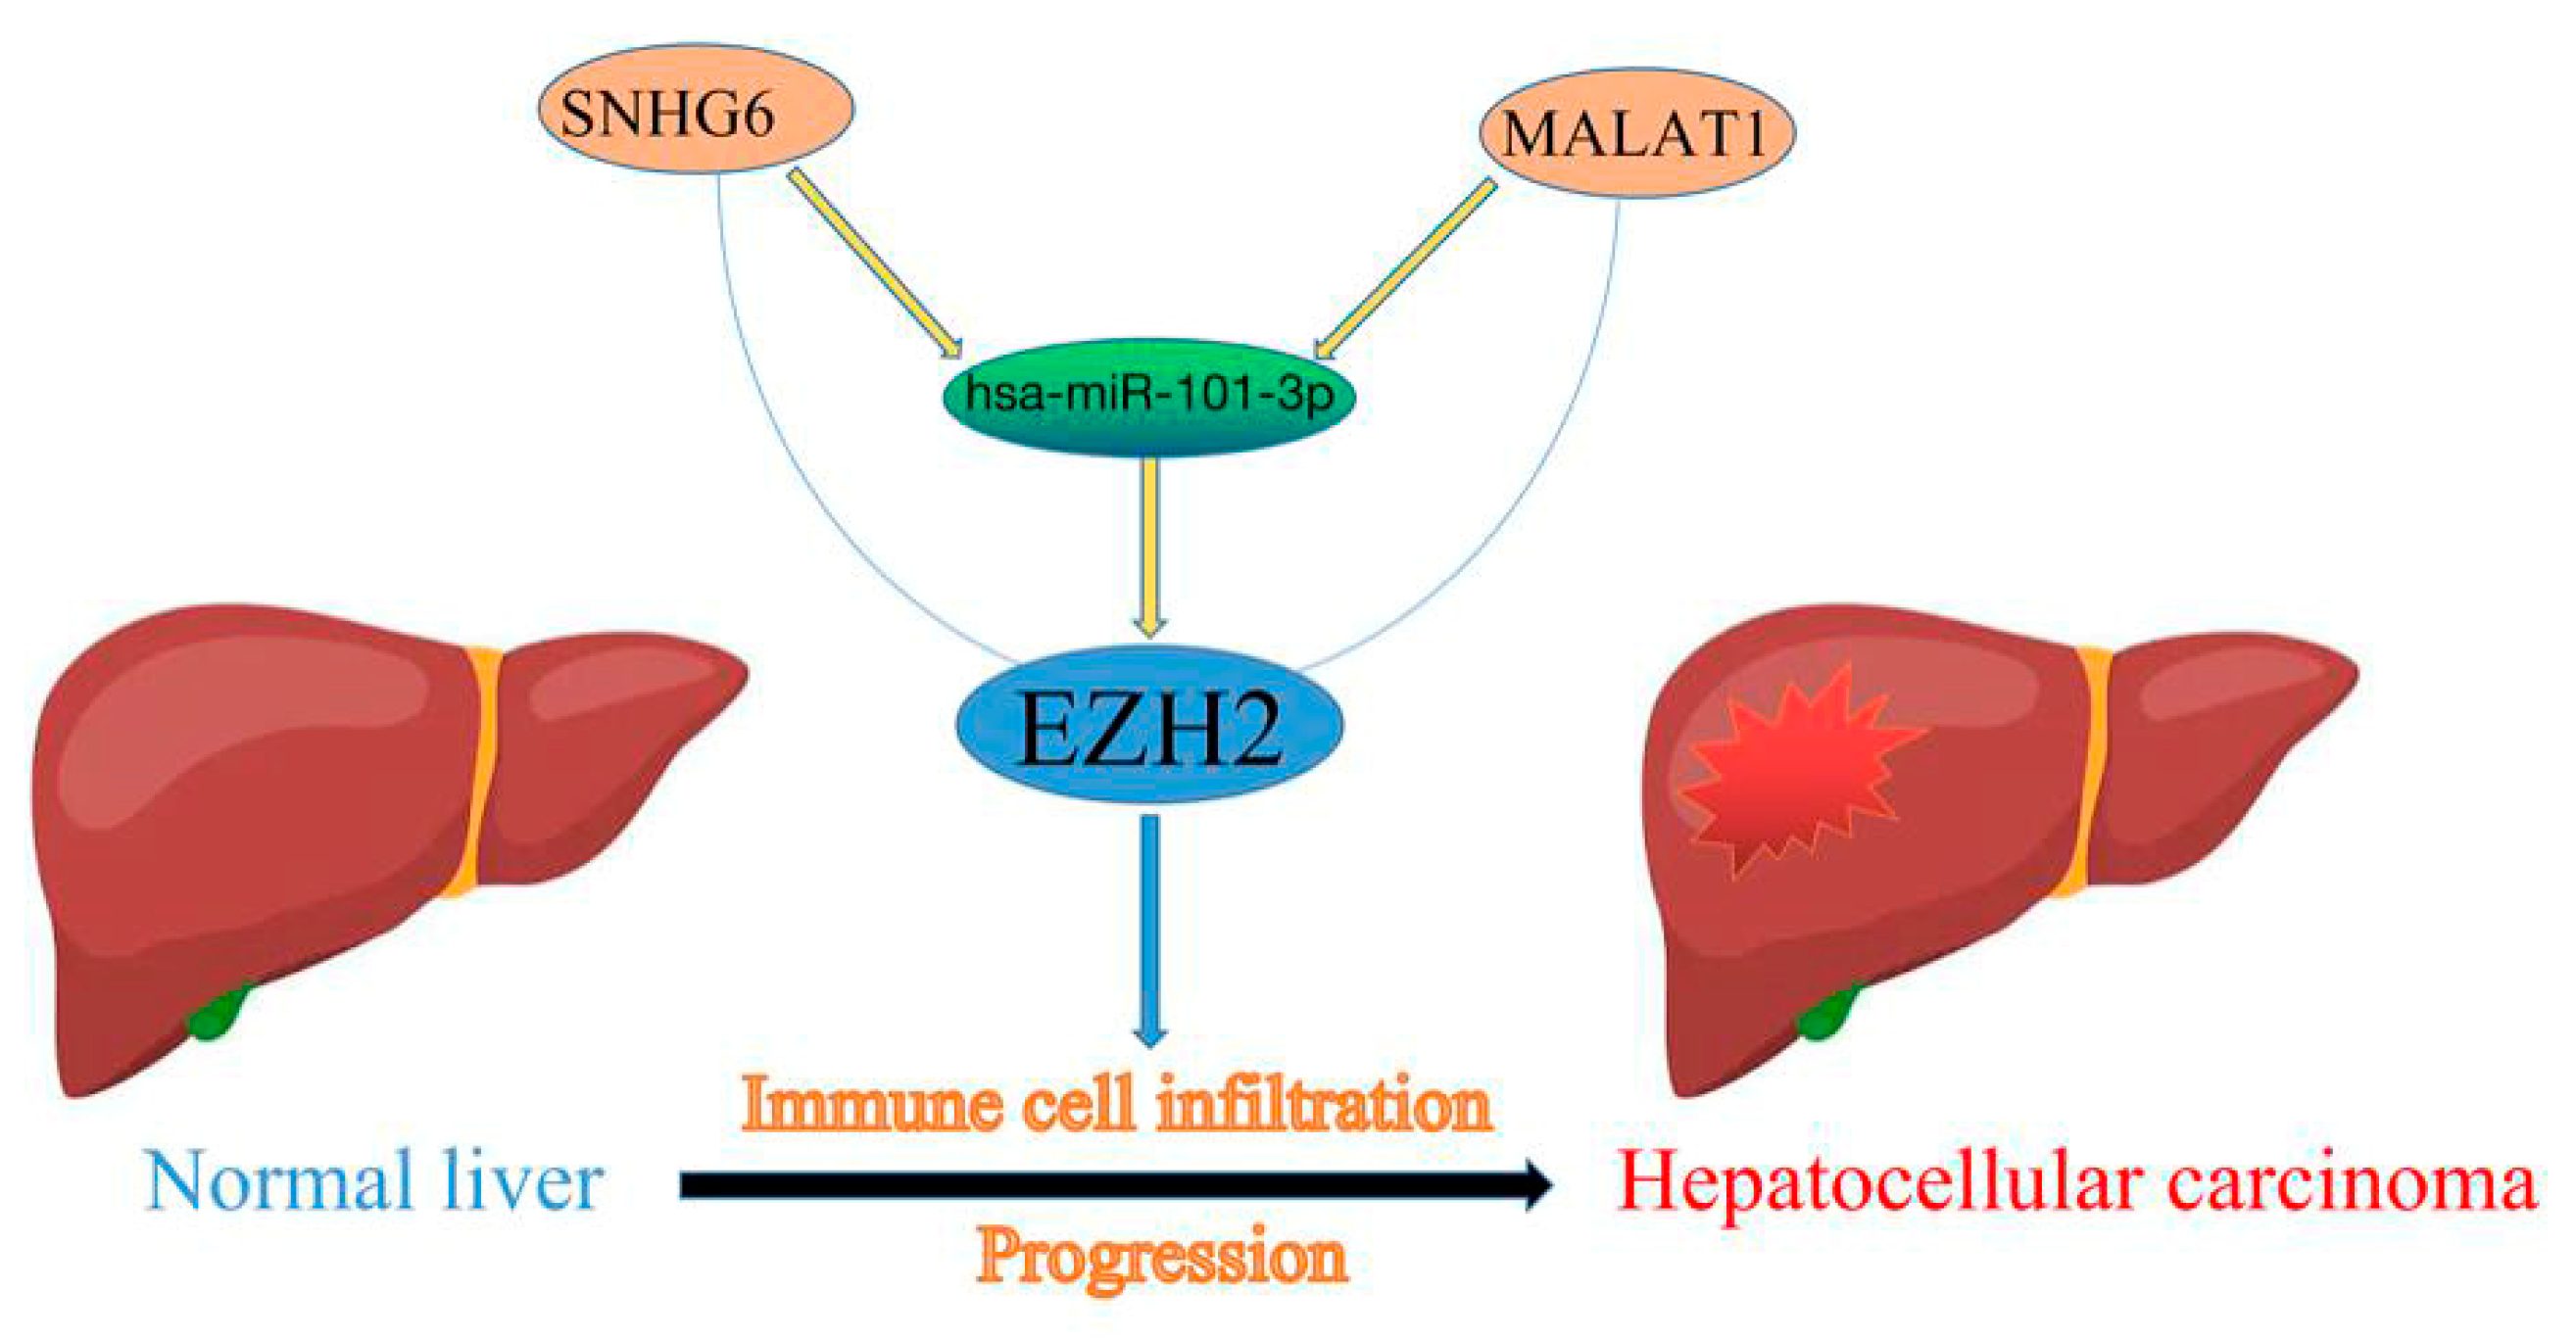
The published literature has largely focused on the role of these regulatory ncRNAs in cancer initiation and progression [42]. Firstly, to explore the upstream regulatory miRNAs of EZH2, we introduced seven prediction programs, namely, PITA, RNA22, miRmap, microT, miRanda, PicTar, and TargetScan, to predict possible miRNAs that could potentially bind to EZH2. At the end, twelve upstream miRNAs of EZH2 were confirmed using bioinformatics database prediction. Subsequently, differential expression analysis and mRNA–miRNA correlation analysis were performed to determine hsa-miR-101-3p as the upstream miRNA of EZH2 affecting the progression of patients with HCC. Next, upstream lncRNAs of the hsa-miR-101-3p/EZH2 axis were also predicted, and 63 possible lncRNAs were found. By conducting expression analysis and correlation analysis, two of the most potential upregulated lncRNAs, namely, SNHG6 and MALAT1, were identified as the upstream lncRNAs of hsa-miR-101-3p. In our study, hsa-miR-101-3p was shown to be downregulated in HCC tissues compared to normal tissues, and low hsa-miR-101-3p indicated a poor prognosis for HCC patients. SNHG6 and MALAT1 also demonstrated differential expression between normal tissues and tumor tissues. The in vitro experiments confirmed that HBV downregulated hsa-miR-101-3p expression by inhibiting its promoter activity, which resulted in the upregulation of Rap1b, and the downregulation of hsa-miR-101-3p or upregulation of Rap1b promoted the proliferation and migration of HCC cells [43]. SNHG6 may act as a competing endogenous RNA, effectively becoming a sink for hsa-miR-101-3p and thereby modulating the de-repression of zinc finger E-box binding homeobox 1, imposing an additional level of post-transcriptional regulation [44]. Likewise, dysregulation of MALAT1 has been found to participate in HCC progression [45,46]. Taken together, SNHG6 or MALAT1/hsa-miR-101-3p/EZH2 axis were identified as potential regulatory pathways in HCC (Figure 11).
Immunotherapies have emerged as promising therapeutic strategies in HCC. Tumor-infiltrating immune cells in the TME affect responsiveness to such therapies, as well as outcomes [47,48]. Thus, we further characterized the relationship between EZH2 expression and the infiltration levels of tumor-infiltrating immune cells in HCC tissues. We found that EZH2 expression was significantly positively correlated with various immune cells, including B cells, CD4+ T cells, CD8+ T cells, macrophages, neutrophils, dendritic cells, and CAFs, in HCC tissues. Meanwhile, EZH2 showed a positive correlation with biomarkers of immune cells and the chemotactic activity of tumor-related immune cells. From these findings, we speculated that immune cell infiltration might partially account for EZH2-mediated oncogenic roles and participate in the proliferation, migration, and immune response in HCC. However, the function of EZH2 and its roles in hepatocarcinogenesis and progression need to be explored through further clinical and experimental studies.
Currently, immune checkpoint inhibitors (ICB), such as anti-CTLA-4 and anti-PD-L1/PD-1 antibodies, elicit durable and effective responses in some solid tumors [49]. However, the efficacy and side effects for each patient during treatment show individual differences [50]. Therefore, it is necessary to identify patients who might benefit from ICB therapy. In our study, the expression level of EZH2 was significantly positively correlated with PD-1, PD-L1, and CTLA-4, which provided potential immunotherapy targets and indicated a better response to the immune-inhibiting reagents in patients with high EZH2 expression. The underlying mechanism of the relationship between EZH2 and ICB requires further exploration.

5. Conclusions

In summary, we found that EZH2 was highly expressed in multiple types of human cancer (including HCC) and was associated with a poor prognosis in HCC. We constructed an ncRNA-mediated regulatory mechanism of EZH2 in hepatocarcinogenesis and progression, namely, EZH2-hsa-miR-101-3p-SNHG6/MALAT1. Additionally, we found that EZH2 expression was not only associated with immune cell infiltration but also correlated with the expression of immune checkpoint genes.

Author Contributions

Z.C. and C.D. downloaded and analyzed the data; Z.C., X.L. and Z.W. designed the study; Z.C., M.X. and C.D. drafted the manuscript; Q.L., S.Z. and P.W. reviewed and revised the manuscript; Z.C. and P.W. edited the figures and tables of the article. All authors have read and agreed to the published version of the manuscript.

Funding

This word was supported by Grant from Health Commission of Zhejiang Province (JBZX-202004) and Research Project of Jinan Microecological Biomedicine Shandong Laboratory (JNL-2022022C).

Institutional Review Board Statement

Not applicable.

Informed Consent Statement

Not applicable.

Data Availability Statement

The datasets used and analyzed in the present study are available from the corresponding authors on reasonable request.

Conflicts of Interest

The authors declare no conflict of interest.

Abbreviations

HCCHepatocellular carcinoma
miRNAsMicroRNAs
KEGGKyoto Encyclopedia of Genes and Genomes
ncRNAsNon-coding RNA
TCGAThe Cancer Genome Atlas
GTExGenotype-Tissue Expression
BLCABladder urothelial carcinoma
BRCABreast invasive carcinoma
CESCCervical squamous cell carcinoma and Endocervical adenocarcinoma
CHOLCholangiocarcinoma
COADColon adenocarcinoma
ESCAEsophageal carcinoma
GBMGlioblastoma multiforme
HNSCHead and neck squamous cell carcinoma
KICHKidney chromophobe
KIRCKidney renal clear cell carcinoma
KIRPKidney renal papillary cell carcinoma
LIHCLiver hepatocellular carcinoma
LUADLung adenocarcinoma
LUSCLung squamous cell carcinoma
PAADPancreatic adenocarcinoma
PCPGPheochromocytoma and paraganglioma
PRADProstate adenocarcinoma
READRectum adenocarcinoma
STADStomach adenocarcinoma
THCAThyroid carcinoma
UCECUterine corpus endometrial carcinoma
HBVHepatitis B virus
HCVHepatitis C virus
EZH2Enhancer of Zeste Homolog 2
PcGPolycomb group
NCBINational Center for Biotechnology Information
HPAHuman Protein Atlas
FCFold change
OSOverall survival
DFSDisease-free survival
K-MKaplan-Meier
DSSDisease-specific survival
PFIProgression-free interval
GSEAGene set enrichment analysis
CeRNACompeting endogenous RNA
CAFsCancer-associated fibroblasts
TMETumor microenvironment
ICBImmune checkpoint inhibitors

References

  1. Kocarnik, J.M.; Compton, K.; Dean, F.E.; Fu, W.; Gaw, B.L.; Harvey, J.D.; Henrikson, H.J.; Lu, D.; Pennini, A.; Xu, R. Cancer Incidence, Mortality, Years of Life Lost, Years Lived with Disability, and Disability-Adjusted Life Years for 29 Cancer Groups From 2010 to 2019: A Systematic Analysis for the Global Burden of Disease Study 2019. JAMA Oncol. 2022, 8, 420–444. [Google Scholar] [PubMed]
  2. Forner, A.; Reig, M.; Bruix, J. Hepatocellular carcinoma. Lancet 2018, 391, 1301–1314. [Google Scholar] [CrossRef]
  3. Gao, Q.; Zhu, H.; Dong, L.; Shi, W.; Chen, R.; Song, Z.; Huang, C.; Li, J.; Dong, X.; Zhou, Y. Integrated Proteogenomic Characterization of HBV-Related Hepatocellular Carcinoma. Cell 2019, 179, 561–577.e522. [Google Scholar] [CrossRef] [PubMed]
  4. Shen, Y.-C.; Hsu, H.-C.; Lin, T.-M.; Chang, Y.-S.; Hu, L.-F.; Chen, L.-F.; Lin, S.-H.; Kuo, P.-I.; Chen, W.-S.; Lin, Y.-C.; et al. H1-Antihistamines Reduce the Risk of Hepatocellular Carcinoma in Patients with Hepatitis B Virus, Hepatitis C Virus, or Dual Hepatitis B Virus-Hepatitis C Virus Infection. J. Clin. Oncol. 2022, 40, 1206–1219. [Google Scholar] [CrossRef] [PubMed]
  5. Llovet, J.M.; Kelley, R.K.; Augusto, V.; Singal, A.G.; Eli, P.; Sasan, R.; Riccardo, L.; Kazuhiko, K.; Zucman-Rossi, J.; Finn, R.S. Hepatocellular carcinoma. Nat. Rev. Dis. Primers 2021, 7, 6. [Google Scholar] [CrossRef] [PubMed]
  6. Sangro, B.; Sarobe, P.; Hervás-Stubbs, S.; Melero, I. Advances in immunotherapy for hepatocellular carcinoma. Nat. Rev. Gastroenterol. Hepatol. 2021, 18, 525–543. [Google Scholar] [CrossRef]
  7. Zhang, L.; Ding, J.; Li, H.Y.; Wang, Z.H.; Wu, J. Immunotherapy for advanced hepatocellular carcinoma, where are we? Biochim. Biophys. Acta Rev. Cancer 2020, 1874, 188441. [Google Scholar] [CrossRef]
  8. Sauvageau, M.; Sauvageau, G. Polycomb Group Proteins: Multi-Faceted Regulators of Somatic Stem Cells and Cancer. Cell Stem Cell 2010, 7, 299–313. [Google Scholar] [CrossRef] [Green Version]
  9. Del Moral-Morales, A.; González-Orozco, J.C.; Hernández-Vega, A.M.; Hernández-Ortega, K.; Peña-Gutiérrez, K.M.; Camacho-Arroyo, I. EZH2 Mediates Proliferation, Migration, and Invasion Promoted by Estradiol in Human Glioblastoma Cells. Front. Endocrinol. 2022, 13, 703733. [Google Scholar] [CrossRef]
  10. Li, Z.; Wang, D.; Lu, J.; Huang, B.; Wang, Y.; Dong, M.; Fan, D.; Li, H.; Gao, Y.; Hou, P.; et al. Methylation of EZH2 by PRMT1 regulates its stability and promotes breast cancer metastasis. Cell Death Differ. 2020, 27, 3226–3242. [Google Scholar] [CrossRef]
  11. Huang, B.; Mu, P.; Yu, Y.; Zhu, W.; Jiang, T.; Deng, R.; Feng, G.; Wen, J.; Zhu, X.; Deng, Y. Inhibition of EZH2 and activation of ERRγ synergistically suppresses gastric cancer by inhibiting FOXM1 signaling pathway. Gastric Cancer 2020, 24, 72–84. [Google Scholar] [CrossRef] [PubMed]
  12. Li, Z.; Wang, D.; Chen, X.; Wang, W.; Wang, P.; Hou, P.; Li, M.; Chu, S.; Qiao, S.; Zheng, J.; et al. PRMT1-mediated EZH2 methylation promotes breast cancer cell proliferation and tumorigenesis. Cell Death Dis. 2021, 12, 1080. [Google Scholar] [CrossRef] [PubMed]
  13. Zheng, F.; Liao, Y.J.; Cai, M.-Y.; Liu, Y.-H.; Liu, T.-H.; Chen, S.-P.; Bian, X.-W.; Guan, X.-Y.; Lin, M.C.; Zeng, Y.-X.; et al. The putative tumour suppressor microRNA-124 modulates hepatocellular carcinoma cell aggressiveness by repressing ROCK2 and EZH2. Gut 2012, 61, 278–289. [Google Scholar] [CrossRef]
  14. Duan, R.; Du, W.; Guo, W. EZH2: A novel target for cancer treatment. J. Hematol. Oncol. 2020, 13, 104. [Google Scholar] [CrossRef]
  15. Kim, K.H.; Roberts, C.W. Targeting EZH2 in cancer. Nat. Med. 2016, 22, 128–134. [Google Scholar] [CrossRef]
  16. Liu, H.; Liu, Y.; Liu, W.; Zhang, W.; Xu, J. EZH2-mediated loss of miR-622 determines CXCR4 activation in hepatocellular carcinoma. Nat. Commun. 2015, 6, 8494. [Google Scholar] [CrossRef] [Green Version]
  17. Bae, A.-N.; Jung, S.-J.; Lee, J.-H.; Lee, H.; Park, S.G. Clinical Value of EZH2 in Hepatocellular Carcinoma and Its Potential for Target Therapy. Medicina 2022, 58, 155. [Google Scholar] [CrossRef]
  18. Li, T.; Fan, J.; Wang, B.; Traugh, N.; Chen, Q.; Liu, J.S.; Li, B.; Liu, X.S. TIMER: A Web Server for Comprehensive Analysis of Tumor-Infiltrating Immune Cells. Cancer Res. 2017, 77, e108–e110. [Google Scholar] [CrossRef] [Green Version]
  19. Tang, Z.; Kang, B.; Li, C.; Chen, T.; Zhang, Z. GEPIA2: An enhanced web server for large-scale expression profiling and interactive analysis. Nucleic Acids Res. 2019, 47, W556–W560. [Google Scholar] [CrossRef] [Green Version]
  20. Li, J.H.; Liu, S.; Zhou, H.; Qu, L.H.; Yang, J.H. starBase v2.0: Decoding miRNA-ceRNA, miRNA-ncRNA and protein-RNA interaction networks from large-scale CLIP-Seq data. Nucleic Acids Res. 2014, 42, D92–D97. [Google Scholar] [CrossRef] [Green Version]
  21. Wang, J.; Zhu, S.; Meng, N.; He, Y.; Lu, R.; Yan, G.R. ncRNA-Encoded Peptides or Proteins and Cancer. Mol. Ther. 2019, 27, 1718–1725. [Google Scholar] [CrossRef] [PubMed]
  22. Kobayashi, H.; Singer, R.H. Single-molecule imaging of microRNA-mediated gene silencing in cells. Nat. Commun. 2022, 13, 1435. [Google Scholar] [CrossRef] [PubMed]
  23. Wang, P.; Guo, Q.; Hao, Y.; Liu, Q.; Gao, Y.; Zhi, H.; Li, X.; Shang, S.; Guo, S.; Zhang, Y. LnCeCell: A comprehensive database of predicted lncRNA-associated ceRNA networks at single-cell resolution. Nucleic Acids Res. 2021, 49, D125–D133. [Google Scholar] [CrossRef]
  24. Sun, S.; Yu, F.; Xu, D.; Zheng, H.; Li, M. EZH2, a prominent orchestrator of genetic and epigenetic regulation of solid tumor microenvironment and immunotherapy. Biochim. Biophys. Acta 2022, 1877, 188700. [Google Scholar] [CrossRef] [PubMed]
  25. Huang, J.; Chen, Z.; Ding, C.; Lin, S.; Wan, D.; Ren, K. Prognostic Biomarkers and Immunotherapeutic Targets among CXC Chemokines in Pancreatic Adenocarcinoma. Front. Oncol. 2021, 11, 3143. [Google Scholar] [CrossRef] [PubMed]
  26. Szeto, G.L.; Finley, S.D. Integrative Approaches to Cancer Immunotherapy. Trends Cancer 2019, 5, 400–410. [Google Scholar] [CrossRef]
  27. Hoshida, Y.; Nijman, S.M.B.; Kobayashi, M.; Chan, J.A.; Brunet, J.-P.; Chiang, D.Y.; Villanueva, A.; Newell, P.; Ikeda, K.; Hashimoto, M.; et al. Integrative Transcriptome Analysis Reveals Common Molecular Subclasses of Human Hepatocellular Carcinoma. Cancer Res. 2009, 69, 7385–7392. [Google Scholar] [CrossRef] [Green Version]
  28. Torrecilla, S.; Sia, D.; Harrington, A.N.; Zhang, Z.; Cabellos, L.; Cornella, H.; Moeini, A.; Campreciós, G.; Leow, W.-Q.; Fiel, M.I.; et al. Trunk mutational events present minimal intra- and inter-tumoral heterogeneity in hepatocellular carcinoma. J. Hepatol. 2017, 67, 1222–1231. [Google Scholar] [CrossRef] [Green Version]
  29. Schuettengruber, B.; Bourbon, H.-M.; Di Croce, L.; Cavalli, G. Genome Regulation by Polycomb and Trithorax: 70 Years and Counting. Cell 2017, 171, 34–57. [Google Scholar] [CrossRef] [Green Version]
  30. Yuan, H.; Han, Y.; Wang, X.; Li, N.; Liu, Q.; Yin, Y.; Wang, H.; Pan, L.; Li, L.; Song, K.; et al. SETD2 Restricts Prostate Cancer Metastasis by Integrating EZH2 and AMPK Signaling Pathways. Cancer Cell 2020, 38, 350–365.e7. [Google Scholar] [CrossRef]
  31. Xue, C.; Gu, X.; Bao, Z.; Su, Y.; Lu, J.; Li, L. The Mechanism Underlying the ncRNA Dysregulation Pattern in Hepatocellular Carcinoma and Its Tumor Microenvironment. Front. Immunol. 2022, 13, 847728. [Google Scholar] [CrossRef] [PubMed]
  32. Hinshaw, D.C.; Shevde, L.A. The tumor microenvironment innately modulates cancer progression. Cancer Res. 2019, 79, 4557–4566. [Google Scholar] [CrossRef] [PubMed] [Green Version]
  33. Kaymak, I.; Williams, K.S.; Cantor, J.R.; Jones, R.G. Immunometabolic Interplay in the Tumor Microenvironment. Cancer Cell 2020, 39, 28–37. [Google Scholar] [CrossRef] [PubMed]
  34. Xiao, Y.; Yu, D. Tumor microenvironment as a therapeutic target in cancer. Pharmacol. Ther. 2020, 221, 107753. [Google Scholar] [CrossRef]
  35. Sang, L.-J.; Ju, H.-Q.; Liu, G.-P.; Tian, T.; Ma, G.-L.; Lu, Y.-X.; Liu, Z.-X.; Pan, R.-L.; Li, R.-H.; Piao, H.-L. LncRNA CamK-A Regulates Ca2+-Signaling-Mediated Tumor Microenvironment Remodeling. Mol. Cell 2018, 72, 71–83.e77. [Google Scholar] [CrossRef] [Green Version]
  36. Chen, S.; Pu, J.; Bai, J.; Yin, Y.; Wu, K.; Wang, J.; Shuai, X.; Gao, J.; Tao, K.; Wang, G. EZH2 promotes hepatocellular carcinoma progression through modulating miR-22/galectin-9 axis. J. Exp. Clin. Cancer Res. 2018, 37, 3. [Google Scholar] [CrossRef] [Green Version]
  37. Gan, L.; Xu, M.; Hua, R.-X.; Tan, C.; Zhang, J.; Gong, Y.; Wu, Z.; Weng, W.; Sheng, W.; Guo, W. The polycomb group protein EZH2 induces epithelial–mesenchymal transition and pluripotent phenotype of gastric cancer cells by binding to PTEN promoter. J. Hematol. Oncol. 2018, 11, 9. [Google Scholar] [CrossRef]
  38. Patil, S.; Steuber, B.; Kopp, W.; Kari, V.; Urbach, L.; Wang, X.; Küffer, S.; Bohnenberger, H.; Spyropoulou, D.; Zhang, Z.; et al. EZH2 Regulates Pancreatic Cancer Subtype Identity and Tumor Progression via Transcriptional Repression of GATA6. Cancer Res. 2020, 80, 4620–4632. [Google Scholar] [CrossRef]
  39. Wen, Y.; Hou, Y.; Yi, X.; Sun, S.; Guo, J.; He, X.; Li, T.; Cai, J.; Wang, Z. EZH2 activates CHK1 signaling to promote ovarian cancer chemoresistance by maintaining the properties of cancer stem cells. Theranostics 2021, 11, 1795–1813. [Google Scholar] [CrossRef]
  40. Zhang, D.-Y.; Sun, Q.-C.; Zou, X.-J.; Song, Y.; Li, W.-W.; Guo, Z.-Q.; Liu, S.-S.; Liu, L.; Wu, D.-H. Long noncoding RNA UPK1A-AS1 indicates poor prognosis of hepatocellular carcinoma and promotes cell proliferation through interaction with EZH2. J. Exp. Clin. Cancer Res. 2020, 39, 229. [Google Scholar] [CrossRef]
  41. Zhai, R.; Tang, F.; Gong, J.; Zhang, J.; Lei, B.; Li, B.; Wei, Y.; Liang, X.; Tang, B.; He, S. The relationship between the expression of USP22, BMI1, and EZH2 in hepatocellular carcinoma and their impacts on prognosis. OncoTargets Ther. 2016, 9, 6987–6998. [Google Scholar] [CrossRef] [Green Version]
  42. Zhao, H.; Xie, Z.; Tang, G.; Wei, S.; Chen, G. Knockdown of terminal differentiation induced ncRNA (TINCR) suppresses proliferation and invasion in hepatocellular carcinoma by targeting the miR-218-5p/DEAD-box helicase 5 (DDX5) axis. J. Cell. Physiol. 2020, 235, 6990–7002. [Google Scholar] [CrossRef] [PubMed]
  43. Sheng, Y.; Ding, S.; Chen, K.; Chen, J.; Wang, S.; Zou, C.; Zhang, J.; Cao, Y.; Huang, A.; Tang, H. Functional analysis of miR-101-3p and Rap1b involved in hepatitis B virus-related hepatocellular carcinoma pathogenesis. Biochem. Cell Biol. 2014, 92, 152–162. [Google Scholar] [CrossRef] [PubMed]
  44. Chang, L.; Yuan, Y.; Li, C.; Guo, T.; Qi, H.; Xiao, Y.; Dong, X.; Liu, Z.; Liu, Q. Upregulation of SNHG6 regulates ZEB1 expression by competitively binding miR-101-3p and interacting with UPF1 in hepatocellular carcinoma. Cancer Lett. 2016, 383, 183–194. [Google Scholar] [CrossRef] [PubMed]
  45. Peng, N.; He, J.; Li, J.; Huang, H.; Huang, W.; Liao, Y.; Zhu, S. Long noncoding RNA MALAT1 inhibits the apoptosis and autophagy of hepatocellular carcinoma cell by targeting the microRNA-146a/PI3K/Akt/mTOR axis. Cancer Cell Int. 2020, 20, 165. [Google Scholar] [CrossRef]
  46. Chen, F.; Zhong, Z.; Tan, H.Y.; Guo, W.; Zhang, C.; Cheng, C.; Wang, N.; Ren, J.; Feng, Y. Suppression of lncRNA MALAT1 by betulinic acid inhibits hepatocellular carcinoma progression by targeting IAPs via miR-22-3p. Clin. Transl. Med. 2020, 10, e190. [Google Scholar] [CrossRef]
  47. Luo, L.; Li, L.; Liu, L.; Feng, Z.; Zeng, Q.; Shu, X.; Cao, Y.; Li, Z. A Necroptosis-Related lncRNA-Based Signature to Predict Prognosis and Probe Molecular Characteristics of Stomach Adenocarcinoma. Front. Genet. 2022, 13, 833928. [Google Scholar] [CrossRef]
  48. Guo, Y.; Yang, J.; Ren, K.; Tian, X.; Gao, H.; Tian, X.; Zhang, X.; Kan, Q. The Heterogeneity of Immune Cell Infiltration Landscape and Its Immunotherapeutic Implications in Hepatocellular Carcinoma. Front. Immunol. 2022, 13, 813. [Google Scholar] [CrossRef]
  49. Kaushik, I.; Ramachandran, S.; Zabel, C.; Gaikwad, S.; Srivastava, S.K. The evolutionary legacy of immune checkpoint inhibitors. Semin. Cancer Biol. 2022; in press. [Google Scholar] [CrossRef]
  50. Servetto, A.; Salomone, F.; Di Costanzo, F.; Iuliano, R.; Marandino, L.; Napolitano, F.; Santaniello, A.; De Placido, P.; De Placido, S.; Di Maio, M.; et al. Inadequate health-related quality of life assessment and reporting in phase III clinical trials of immune checkpoint inhibitors in solid cancers: A systematic review. Crit. Rev. Oncol. 2022, 172, 103649. [Google Scholar] [CrossRef]
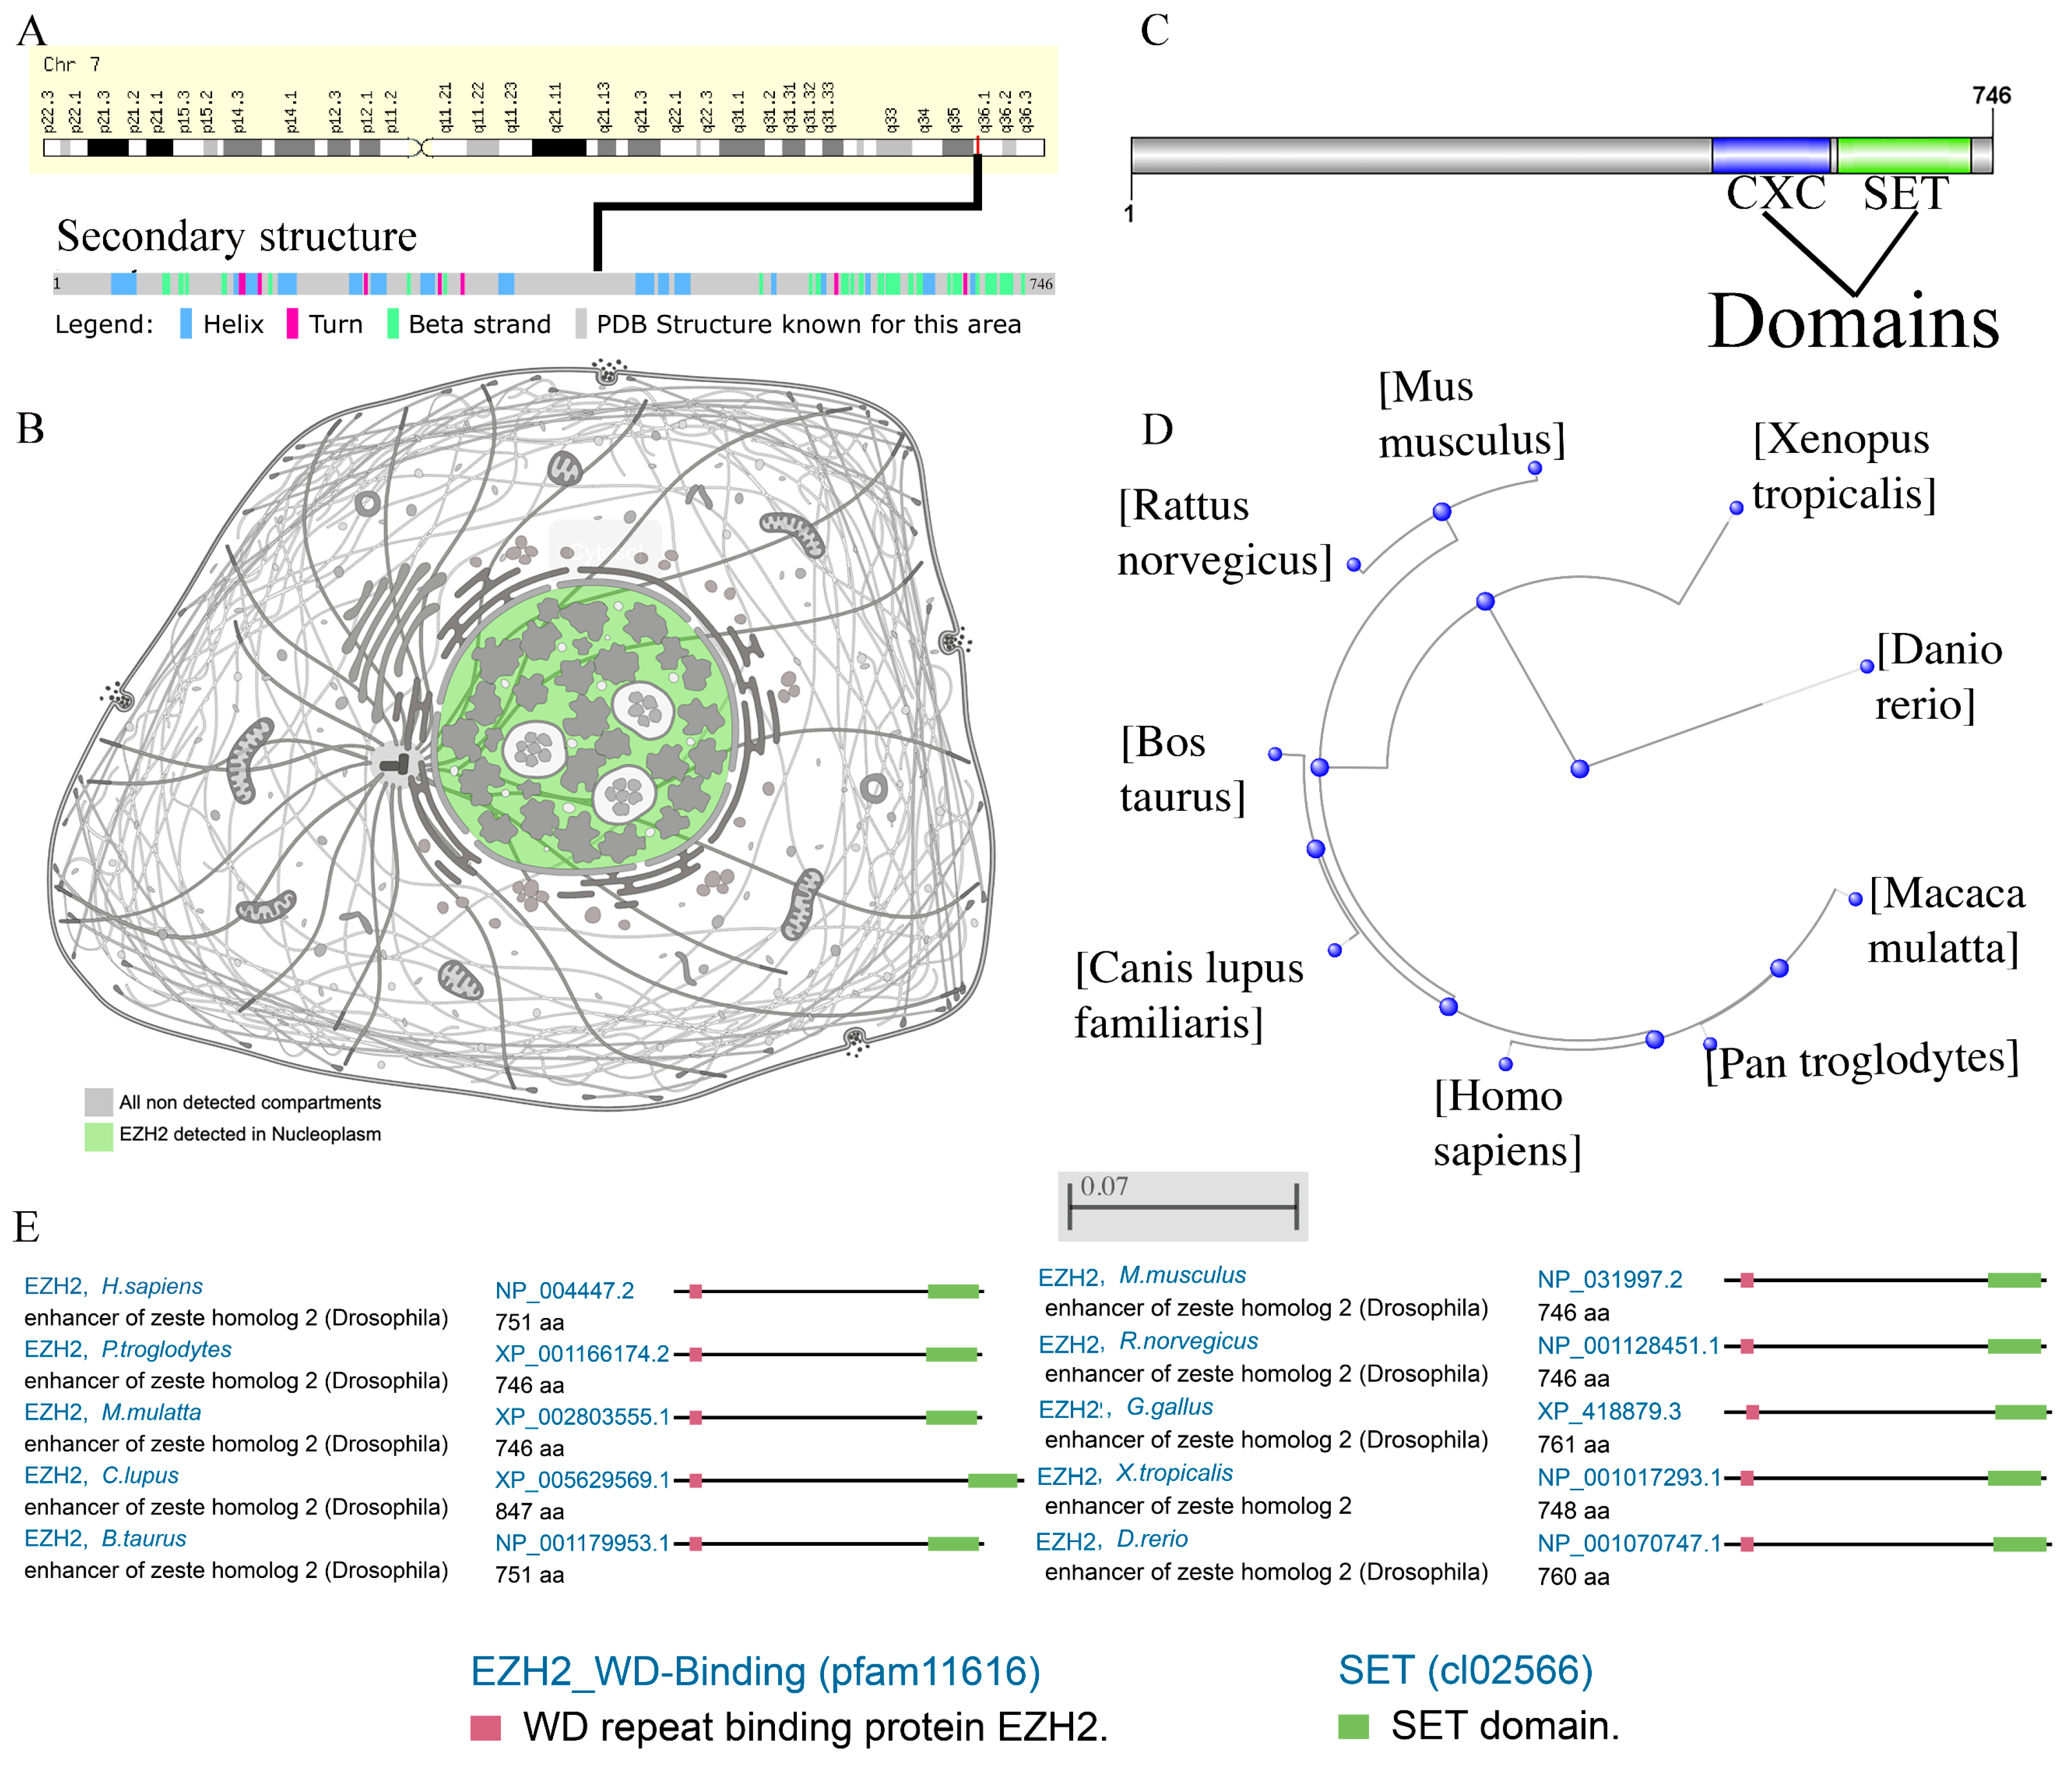
Figure 1. Chromosome localization, protein localization, and conservation analysis of EZH2. (A) Chromosome localization and protein secondary structure of EZH2 in humans. (B) The main location of the EZH2 protein in cells. (C) The conserved domain of EZH2 in the amino acid sequence. (D) The phylogenetic tree of EZH2 in different species. (E) Conservation of the EZH2 protein among different species.
Genes 13 00876 g001
Figure 2. The differential expression of EZH2 in different tumor types. (A) The expression status of the EZH2 gene in different cancer types was analyzed through TIMER2 (data from TCGA). ** p < 0.01; *** p < 0.001. (B) The expression status of the EZH2 gene in different cancer types was analyzed through GEPIA2 (data from TCGA and GTEx). * p < 0.05.
Genes 13 00876 g002
Figure 3. Kaplan-Meier survival curves of human cancers with high and low EZH2 expression analyzed by the GEPIA2 and Sangerbox databases. (A) Overall survival (OS). (B) Disease-free survival (DFS).
Genes 13 00876 g003
Figure 4. Kaplan-Meier survival curves of human cancers with high and low EZH2 expression analyzed by the GEPIA2 and Sangerbox databases. (AF) Progression-free interval (PFI). (GK) Disease-specific survival (DSS).
Genes 13 00876 g004
Figure 5. Prediction and identification the potential upstream regulatory miRNAs of EZH2 in HCC. (A) The predicted miRNA-EZH2 network. (B) The correlation between the candidate miRNAs and EZH2 in HCC, where red represents a positive correlation and blue represents a negative correlation. (C,D) Differential expression analysis of hsa-miR-101-3p and hsa-miR-26b-5p in HCC tissues and normal tissues. (E,F) Prognostic analysis of hsa-miR-101-3p and hsa-miR-26b-5p in HCC. (G) Pairing information of hsa-miR-101-3p and EZH2.
Genes 13 00876 g005
Figure 6. The differential expression level of upstream lncRNAs of hsa-miR-101-3p in different tumors and pathological stages. (AC) The expression of SNHG6, MALAT1, and AC239868.3 in TCGA HCC compared with “TCGA and (or) GTEx normal” data. (DF) Pairing information of hsa-miR-101-3p–SNHG6, hsa-miR-101-3p–MALAT1, and hsa-miR-101-3p–AC239868.3. (G,H) SNHG6 and MALAT1 differential expression in HCC with individual cancer stages. * p < 0.05; ** p < 0.01; *** p < 0.001.
Genes 13 00876 g006
Figure 7. Correlation analysis between lncRNAs and hsa-miR-101-3p or between lncRNAs and EZH2 in HCC. (A) SNHG6 and EZH2, (B) MALA1 and EZH2, (C) AC239868.3 and EZH2, (D) hsa-miR-101-3p and SNHG6, (E) hsa-miR-101-3p and MALA1, and (F) hsa-miR-101-3p and AC239868.3.
Genes 13 00876 g007
Figure 8. The relationship of immune cell infiltration with the EZH2 level in HCC. (A) The infiltration level of various immune cells under different copy numbers of EZH2 in HCC. (B,C) The correlation of the EZH2 expression level with neutrophil, cancer-associated fibroblast (CAF), dendritic cell, B cell, CD8+ T cell, and macrophage infiltration levels in HCC.
Genes 13 00876 g008
Figure 9. The relationship between EZH2 expression and immune checkpoint genes in HCC. (A,D) PDCD1, (B,E) CTLA4, and (C,F) CD274.
Genes 13 00876 g009
Figure 10. GSEA for samples with high and low EZH2 expression. (A) Enriched gene sets in the KEGG collection by samples with high EZH2 expression. (B) Enriched gene sets in KEGG by samples with low EZH2 expression. (C) Enriched gene sets in the HALLMARK collection by samples with high EZH2 expression. (D) Enriched gene sets in HALLMARK by samples with low EZH2 expression.
Genes 13 00876 g010
Figure 11. The model of the SNHG6/MALAT1-hsa-miR-101-3p-EZH2 axis in the carcinogenesis of HCC.
Genes 13 00876 g011
Table 1. The correlation between EZH2 expression and chemotactic activity for immune cells.
Immune CellsChemokineCorp Value
Monocytes/macrophagesCCL20.0542.98 × 10−1
CCL30.071.79 × 10−1
CCL50.122.06 × 10−2
CCL70.1611.86 × 10−3
CCL80.1445.54 × 10−3
CCL130.1378.24 × 10−3
CCL170.0345.19 × 10−1
CCL220.1025.04 × 10−2
T lymphocytesCCL20.0542.98 × 10−1
CCL10.1661.31 × 10−3
CCL220.1025.04 × 10−2
CCL170.0345.19 × 10−1
Mast cellsCCR10.251.06 × 10−6
CCR20.1426.20 × 10−3
CCR30.2471.48 × 10−6
CCR40.1961.42 × 10−4
CCR50.2491.20 × 10−6
CXCR20.1331.03 × 10−2
CXCR40.2975.58 × 10−9
EosinophilsCCL110.0691.82 × 10−1
CCL24−0.0069.07 × 10−1
CCL260.2832.85 × 10−8
CCL50.122.06 × 10−2
CCL70.1611.86 × 10−3
CCL130.1378.24 × 10−3
CCL30.071.79 × 10−1
NeutrophilsCXCL80.386.12 × 10−4
EZH2: Enhancer of Zeste Homolog 2; p values less than 0.05 are shown in bold.
Table 2. Correlation analysis between EZH2 and biomarkers of immune cells in HCC determined using the GEPIA and TIMER databases.
GEPIATIMER
RpRp
B cellsCD190.1101.10 × 10−10.2441.92 × 10−6
CD79A0.0837.90 × 10−50.1311.18 × 10−2
CD8+ T cellsCD8A0.2001.40 × 10−50.1805.05 × 10−4
CD8B0.2207.70 × 10−30.1681.17 × 10−3
CD4+ T cellsCD40.1408.20 × 10−10.2172.44 × 10−5
M1 macrophagesNOS2−0.0120.00 × 10−00.0039.48 × 10−1
IRF50.4405.00 × 10−10.4825.97 × 10−23
PTGS20.0352.80 × 10−30.0889.22 × 10−2
M2 macrophagesCD1630.1602.40 × 10−40.1015.21 × 10−2
VSIG40.1902.00 × 10−30.1005.41 × 10−2
MS4A4A0.1608.30 × 10−10.1025.07 × 10−2
NeutrophilsCEACAM80.0112.40 × 10−110.0946.95 × 10−2
ITGAM0.3402.20 × 10−10.2891.44 × 10−8
CCR70.0642.40 × 10−50.0831.10 × 10−1
Dendritic cellsHLA-DPB10.2209.00 × 10−20.1542.91 × 10−3
HLA-DQB10.0881.70 × 10−50.1464.87 × 10−3
HLA-DRA0.2201.20 × 10−40.1671.22 × 10−3
HLA-DPA10.2007.40 × 10−40.1582.28 × 10−3
CD1C0.1706.50 × 10−80.1142.85 × 10−2
NRP10.2801.10 × 10−60.2632.67 × 10−7
ITGAX0.2501.10 × 10−10.3485.15 × 10−12
HCC: hepatocellular carcinoma; EZH2: Enhancer of Zeste Homolog 2; p values less than 0.05 are shown in bold.
Publisher’s Note: MDPI stays neutral with regard to jurisdictional claims in published maps and institutional affiliations.