Abstract
The Guangxi Partridge chicken is a well-known chicken breed in southern China with good meat quality, which has been bred as a meat breed to satisfy the increased demand of consumers. Compared with line D whose body weight is maintained at the average of the unselected group, the growth rate and weight of the selected chicken group (line S) increased significantly after breeding for four generations. Herein, transcriptome analysis was performed to identify pivotal genes and signal pathways of selective breeding that contributed to potential mechanisms of growth and development under artificial selection pressure. The average body weight of line S chickens was 1.724 kg at 90 d of age, which showed a significant increase at 90 d of age than line D chickens (1.509 kg), although only the internal organ ratios of lung and kidney changed after standardizing by body weight. The myofiber area and myofiber density of thigh muscles were affected by selection to a greater extent than that of breast muscle. We identified 51, 210, 31, 388, and 100 differentially expressed genes (DEGs) in the hypothalamus, pituitary, breast muscle, thigh muscle, and liver between the two lines, respectively. Several key genes were identified in the hypothalamus-pituitary-muscle axis, such as FST, THSB, PTPRJ, CD36, PITX1, PITX2, AMPD1, PRKAB1, PRKAB2, and related genes for muscle development, which were attached to the cytokine–cytokine receptor interaction signaling pathway, the PPAR signaling pathway, and lipid metabolism. However, signaling molecular pathways and the cell community showed that elevated activity in the liver of line S fowl was mainly involved in focal adhesion, ECM-receptor interaction, cell adhesion molecules, and signal transduction. Collectively, muscle development, lipid metabolism, and several signaling pathways played crucial roles in the improving growth performance of Guangxi Partridge chickens under artificial selection for growth rate. These results support further study of the adaptation of birds under selective pressure.
Keywords:
Guangxi Partridge chicken; growth rate; breeding; transcriptome; hypothalamus; pituitary; muscle; liver 1. Introduction
Indigenous Chinese chicken breeds are distinct from commercial breeds of fowl due to their excellent production traits, such as great meat quality and disease resistance, and they possess a large share of the poultry market. Unlike developed breeds, however, native birds barely achieved their growth potential [1]. To meet the increased command for meat products, genetic selection for more yield in indigenous populations is essential. Selective pressure on broilers contributes to greater yield of cut parts, such as breasts and thighs [2].
Skeletal muscle is the largest organ of the body and, in addition to its role in motion, muscle also functions as the endocrine and metabolic organ to regulate energy balance, glucose uptake, and metabolic activities [3]. Meanwhile, quantity and quality of skeletal muscle are important characters of yield and as factors of interest by breeders and consumers. In recent years, increased studies have investigated the genetic mechanism that affects growth performance or meat quality in different breeds or developmental stages. Several genes (e.g., MYH15, MYOZ2, MYBPC3, IGF2, BCL-2, JUN, and FOS) were identified in breast muscle of fast-growing fowl breeds, which were involved in muscle regulation, muscle construction, and myoblast differentiation [4]. Differentially expressed lncRNAs between slow-growing native Gushi chickens and fast-growing Arbor Acres chickens influenced muscle development and growth [5]. SREBF1, GHR, and FASN have been recognized widely as causal genes of meat quality, and they were distinctively expressed in cattle muscle with diverse meat quality and growth performance [6]. Genome-wide association study revealed that MLNR, MED4, CAB39L, LDB2, and IGF2BP1 may be potential candidate gens for chicken growth and carcass traits [7].
Hormones of the endocrine system are important regulators in muscle development, of which growth hormone (GH), thyroid hormone, and androgens have been researched commonly in many species [8]. The secretion of hormones is primarily regulated by the dual stimulatory and inhibitory of the hypothalamus and pituitary [9]. The hypothalamic neurons also secrete orexigenic and anorexia neuropeptides, such as AGRP and α-MSH, to influence appetite and food intake [10]. Transcriptome analysis of the hypothalamus screened several genes in male Ross 308 strains with different growth rates, such as POMC, NMU, NPW, PMCH, GAL, and FOS, which displayed different expression patterns [11]. A total of 39 differentially expressed genes (DEGs) were identified by transcriptome analysis between high egg-yielding and low egg-yielding hens, and these DEGs were involved mainly in metabolism and transport of amino acids [12].
In addition, the liver similarly plays an important role in controlling energy homeostasis and metabolic activity. Increased growth may result in increased organ workload, increased metabolism, and metabolic diseases, such as cardiovascular ailments and ascites, which may lead to the failure of body systems [13]. Changes in gene expression and metabolic activity in the liver were correlated significantly with lipid metabolism through the PPAR signaling pathway and steroid biosynthesis [14]. Transcriptome analysis of meat birds, layer strains, and a F1 hybrids showed that the FoxOs was correlated highly with body weight through regulation of glucose metabolism [15].
Up to now, researchers have focused primarily on explaining discrepant production performances in low- and high-performing individuals in the same population or in different breeds, and they rarely explore effects on growth under generational selective pressure. The Guangxi Partridge chicken is a well-known indigenous chicken breed in southern China with good meat quality. Selective breeding has been used in Guangxi Partridge chicken to produce two lines with high selection intensity. Line S has been under selection for higher growth rate for four generations, while line D under selection for egg number. These two chicken lines with different growth performance were employed to explore the effect of short-term selection. In the present study, transcriptome sequencing was adopted to investigate the expression profile of mRNAs in the hypothalamus, pituitary, breast muscle, thigh muscle, and liver between two chicken lines that had different selection goals. Identification and functional analysis of differentially expressed mRNA indicated several important pathways that may be involved in rapid growth, development, and metabolism.
2. Materials and Methods
2.1. Experimental Animals and Tissue Samples
Breeding lines S and D of Guangxi Partridge chicken were raised at the Guangxi Fufeng Agricultural and Animal Husbandry Group Co., Ltd. (Nanning, China). Lines S and D have been selected for four generations from the same population of native Guangxi Partridge chicken. In line S, the higher body weight is the main selection goal, and selection proportion is about 0.03 for the male and about 0.20 for the female. In line D, the higher egg production is the main selection goal, under the premise of maintaining the body weight not less than the mean value of its initial population. Hybrid chickens generally take 90 to 130 d to reach market weight. Ten cockerels were selected randomly from two lines at 90 d of age. Body weight and organ weights (heart, liver, spleen, lung, kidney, and testis) of each individual were measured separately after fasting for 12 h (10 individual chickens per line). Then, the hypothalamus, pituitary, liver, breast muscle, and thigh muscle tissues were collected immediately after the birds were sacrificed. The dissected tissues were placed quickly into microtubes, which were frozen rapidly in liquid nitrogen and then preserved at −80 °C.
2.2. Examination of Muscle Fibers
Three chickens in each group were selected for measurement of muscle fiber size and density. Tissues of breast muscle and thigh muscle were dehydrated by gradient alcohol, paraffin embedded, sectioned, and stained terminally with hematoxylin and eosin. Tissue sections were observed using a CX31 microscope (Olympus Corporation, Tokyo, Japan) at a magnification of 200×. For each sample, three images without tissue damage were analyzed by Image-J (National Institute of Mental Health, Bethesda, MD, USA). Then, muscle fiber area and fiber density were calculated.
2.3. RNA Extraction and Sequencing
The hypothalamus, pituitary, liver, breast muscle, and thigh muscle tissues from three chickens from each group were used for RNA sequencing. Total RNA was extracted from each sample using Trizol reagent (Invitrogen, Carlsbad, CA, USA). The purity of RNA was measured by a Nanodrop 2000 spectrophotometer (Thermo Scientific, Waltham, MA, USA). Then, an Agilent 2100 Bioanalyzer (Agilent Technologies, Palo Alto, CA, USA) and RNase free agarose gel electrophoresis were used to detect RNA integrity and quality. RNA integrity number (RIN), which ranged from 0 to 10, reflects the quality of RNA. The RIN values of all RNA samples in this study were > 8.
mRNA was enriched with Oligo (dT) beads, and rRNA was removed using a Ribo-ZeroTM Magnetic Kit (Epicentre, Madison, WI, USA). The enriched mRNA was fragmented using fragmentation buffer, and then they were reversed into cDNA. RNase H, dNTP, DNA polymerase I, and buffer were used to synthesize the second-strand cDNA. Then, the cDNA fragments were purified, end repaired, poly (A) added, and ligated to Illumina sequencing adapters. The ligation products were size selected by agarose gel electrophoresis, PCR amplified. Paired-end sequencing was performed on Illumina Nova-Seq 6000 sequencing platform by Gene Denovo Biotechnology Co. (Guangzhou, China).
2.4. Transcriptome Mapping and Assembly
Reads obtained from the sequencing machines were further filtered by fastp (v 0.18.0). The reads that contained adapters or > 10% of unknown nucleotides (N) and low-quality reads that contained > 50% of low quality (Q-value ≤ 20) bases were filtered. Clean reads were then mapped to the chicken reference genome GCF_000002315.6 using HISAT (v2. 2.4). Then, the mapped reads were assembled by using StringTie (v1.3.1). FPKM (fragment per kilobase of transcript per million mapped reads) values were calculated to quantify the expression abundance of transcript.
2.5. RNA-seq Data Analysis
Differential expression analysis of RNA of the two groups was performed using the DESeq2 R package (v1.32.0). The transcripts with the parameters of adjusted p-value < 0.05 and |log2 (FoldChange)| > 1 were considered as DEGs. GO of the DEGs was performed with the online software DAVID (https://david.ncifcrf.gov/summary.jsp, accessed on 3 September 2021). Kyoto Encyclopedia of Genes and Genomes (KEGG) pathway analysis was performed by the R package ClusterProfiler (v4.0.5). The protein-protein interaction network was constructed based on DEGs using the online STRING (v11.5, https://cn.string-db.org, accessed on 8 October 2021) database and was visualized using Cyto-scape software (v3.8.2). The statistical power of this study was estimated by the SSPA R package (v2.22.1) [16].
2.6. Validation of RNA Expression by Quantitative-PCR
Nine genes were selected from the DEG of breast muscle and thigh muscle for quantitative verification. The primers were designed using Primer3 (v.0.4.0). qRT-PCR was determined using the Step-One plus Real-Time PCR System with ChamQ Universal SYBR qPCR Master Mix (#Q441-02, Vazyme, Nanjing, China). The information on primers is listed in Supplementary Table S1. The 20 μL reaction mixture contained 10 μL 2× ChamQ Universal SYBR qPCR Master Mix, 0.4 μL forward primer, 0.4 μL reverse primer, 2 μL cDNA, and 7.2 μL ddH2O. The procedure was as follows: 30 s of pre-denaturation at 95, followed by 40 cycles of 95 °C for 10 s and 60 °C for 30 s, solubility curve period at 95 °C for 15 s, 60 °C for 1 min, and 95 °C for 15 s. Expression of all genes was normalized to the GAPDH level. The relative mRNA expression levels were calculated using the normalized relative quantification method followed by 2−ΔΔCT.
2.7. Statistical Analysis
Data were analyzed using Prism (v.6.0; GraphPad Software, San Diego, CA, USA) for Student’s t-test. Data were expressed as the mean ± standard deviation (SD). When the p value was <0.05, the results were considered statistically significant. The linear regression and correlation of gene expression between RNA-seq and qRT-PCR were calculated by Excel.
3. Results
3.1. Growth Performance and Differences in Muscle Fiber between the Two Lines
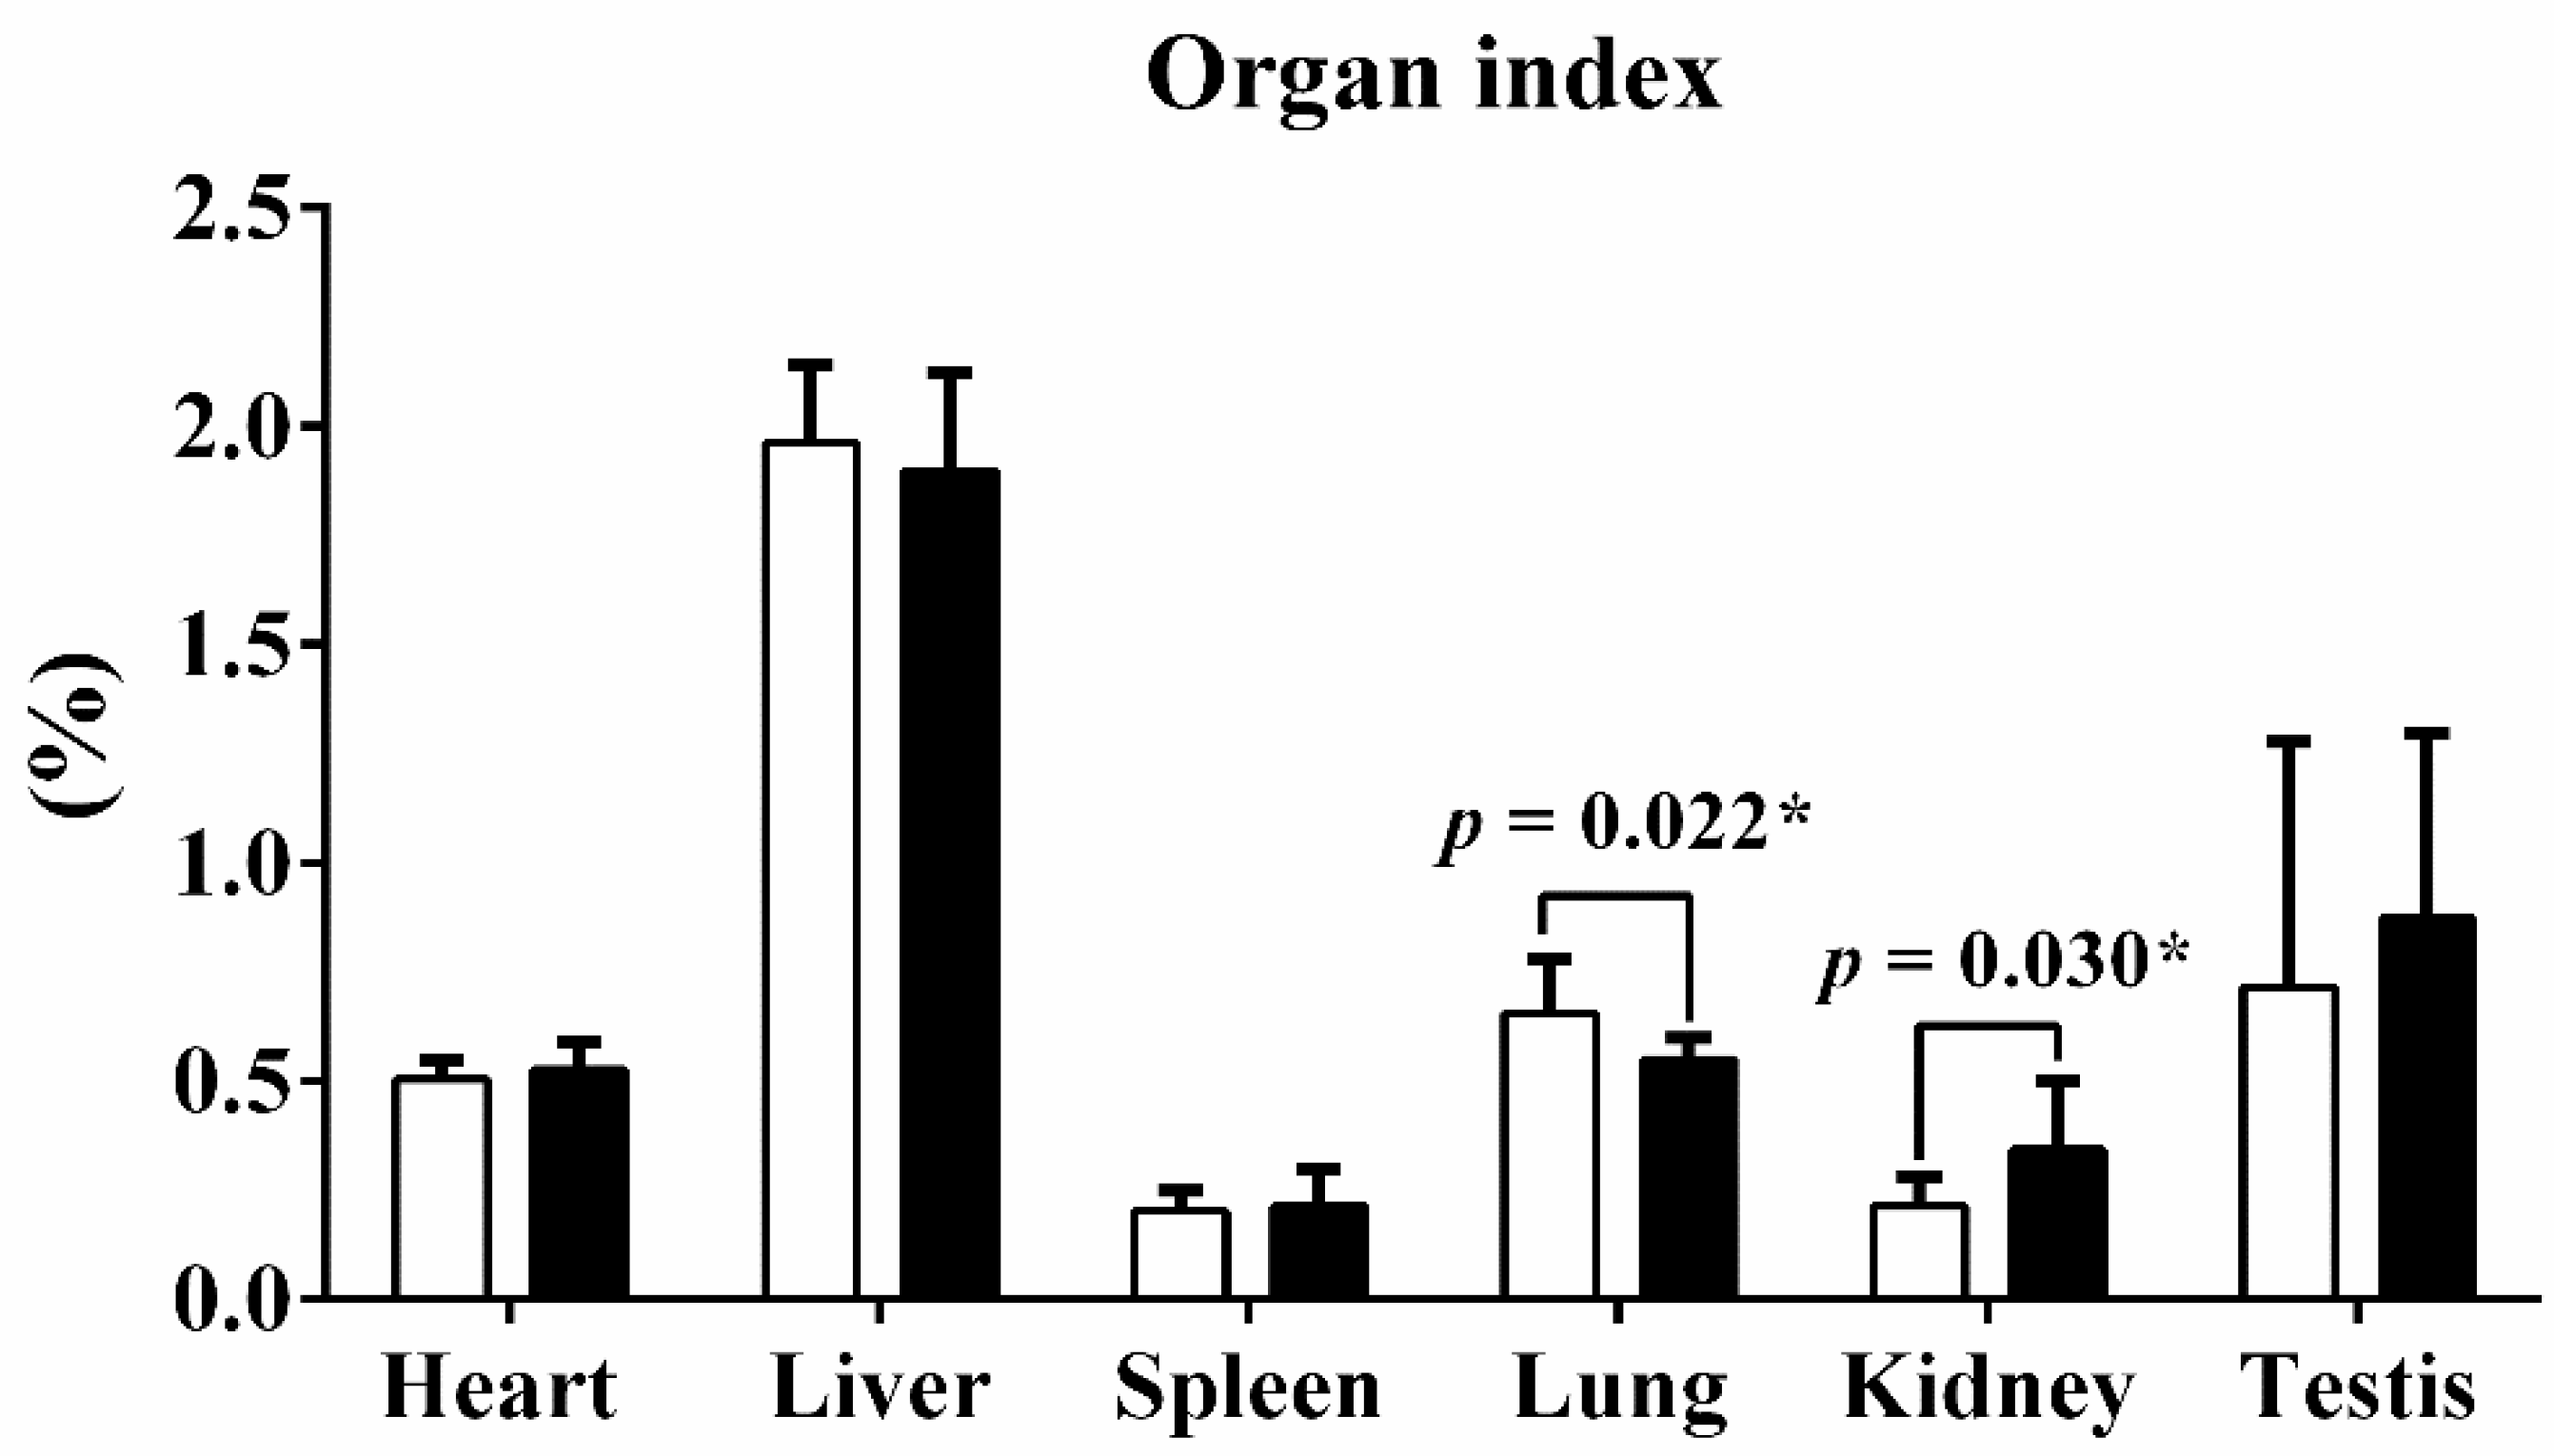
Guangxi Partridge chickens of lines D and S were raised for 90 d from hatching, and the weights of the body, heart, liver, lungs, spleen, kidneys, and testes were recorded after harvest. The mean weight of line S chickens was 1.724 ± 0.128 kg, which was significantly heavier than line D birds at 1.509 ± 0.084 kg (p < 0.001). Mass of heart, liver, and kidneys of line S chickens also increased (Table 1). The organ index quantified the ratio of organ weight to total body weight. Only the lung index and kidney index exhibited obvious alterations after being calibrated with body weight, but the other organ indices remained stable (Figure 1).

Table 1.
Body and organ weights of line D and line S at d90.

Figure 1.
The organ index of six tissues between two different lines. The organ index quantified the ratio of organ weight to total body weight. Values are shown as mean ± SD (n = 10 individuals per group). * represents p < 0.05.
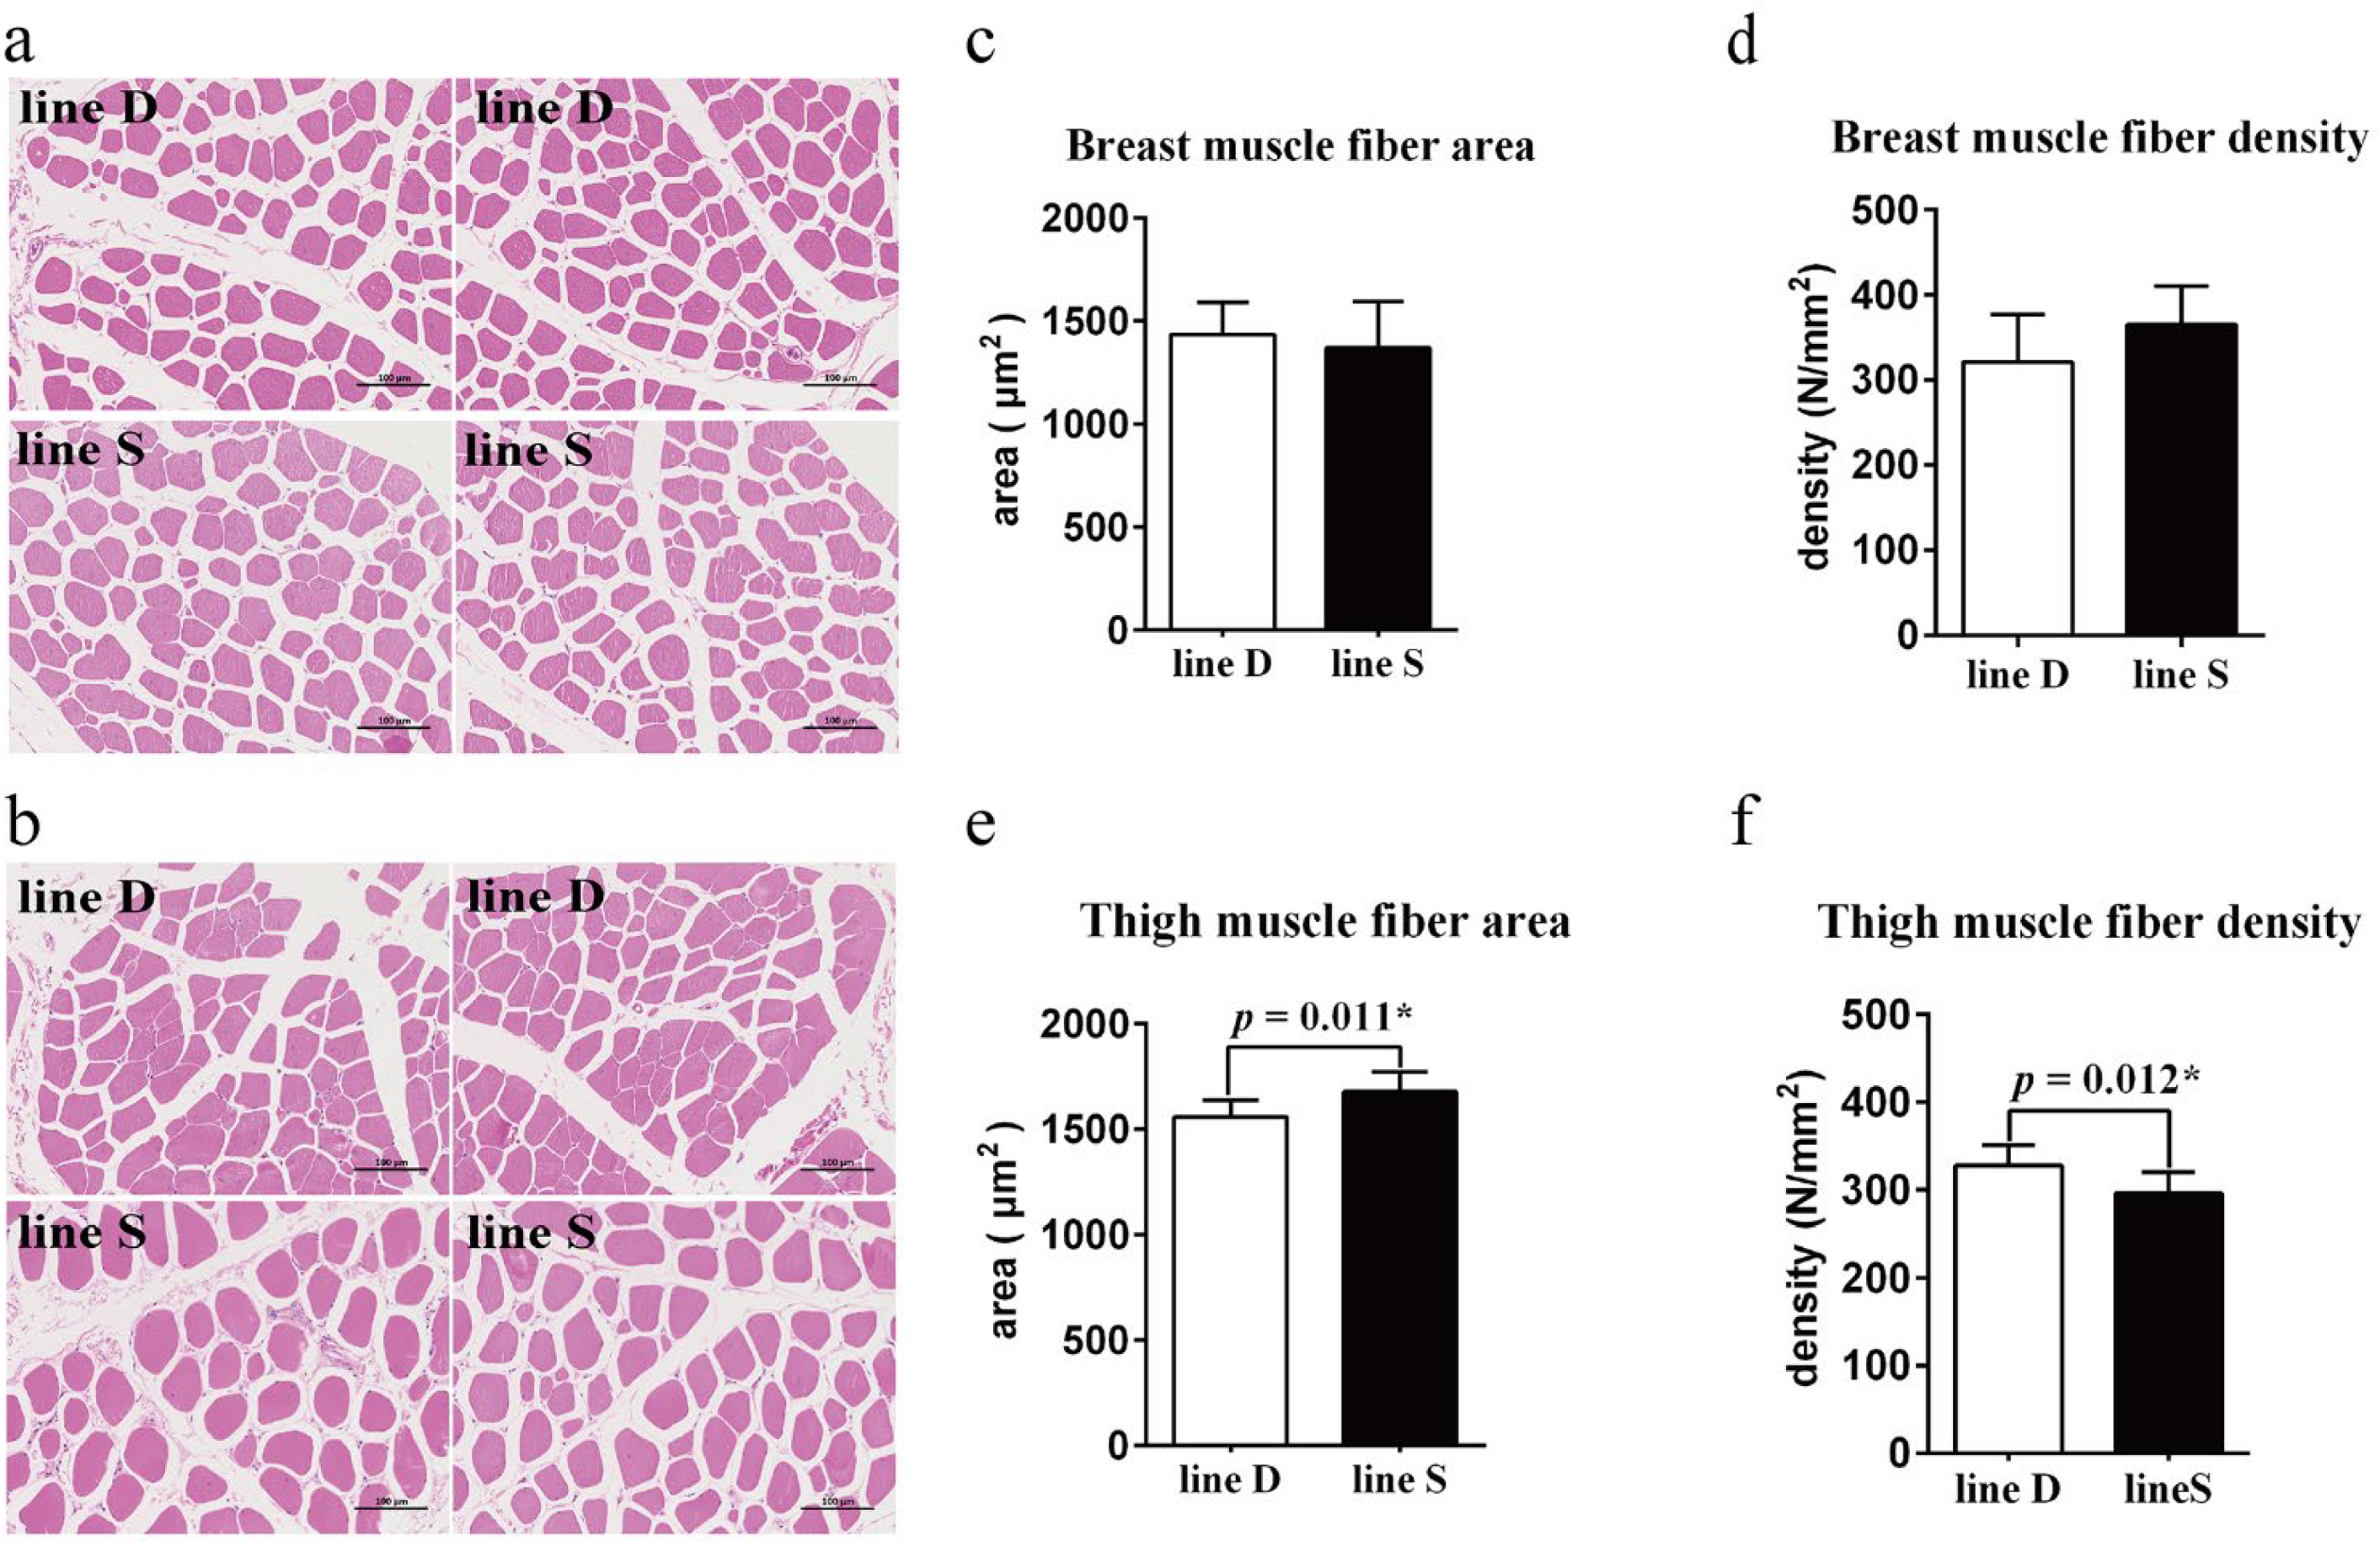
Muscle fiber morphology between the two chicken lines appeared similar (Figure 2a,b), and the difference in myofiber area and myofiber density (count of myofibers per mm2 of a cross-sectional area) in breast muscle between the two lines was not significant (p > 0.05) (Figure 2c,d). However, the myofiber area was enhanced significantly, and there was a lower quantity of myofiber of thigh muscle in line S (p < 0.05) (Figure 2e,f).
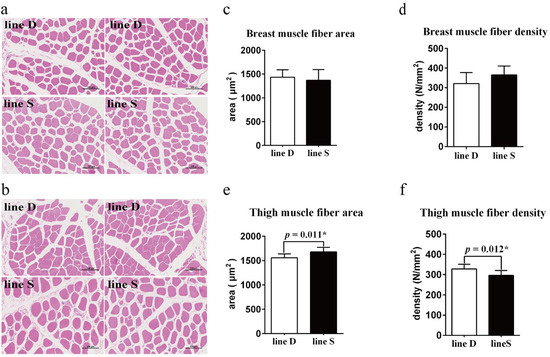
Figure 2.
Comparison of muscle fiber morphology and myofiber characteristics between the two lines. Myofiber morphology observation of breast muscle (a) and thigh muscle (b) tissue section. There are two images for each chicken line of different muscle tissue. Scale bar, 100 µm. Muscle fiber area (c) and muscle fiber density (d) of breast muscle. Muscle fiber area (e) and muscle fiber density (f) of thigh muscle. Values are shown as mean ± SD (n = 3 per group). * represents p < 0.05.
3.2. Analysis of Differentially Expressed Genes
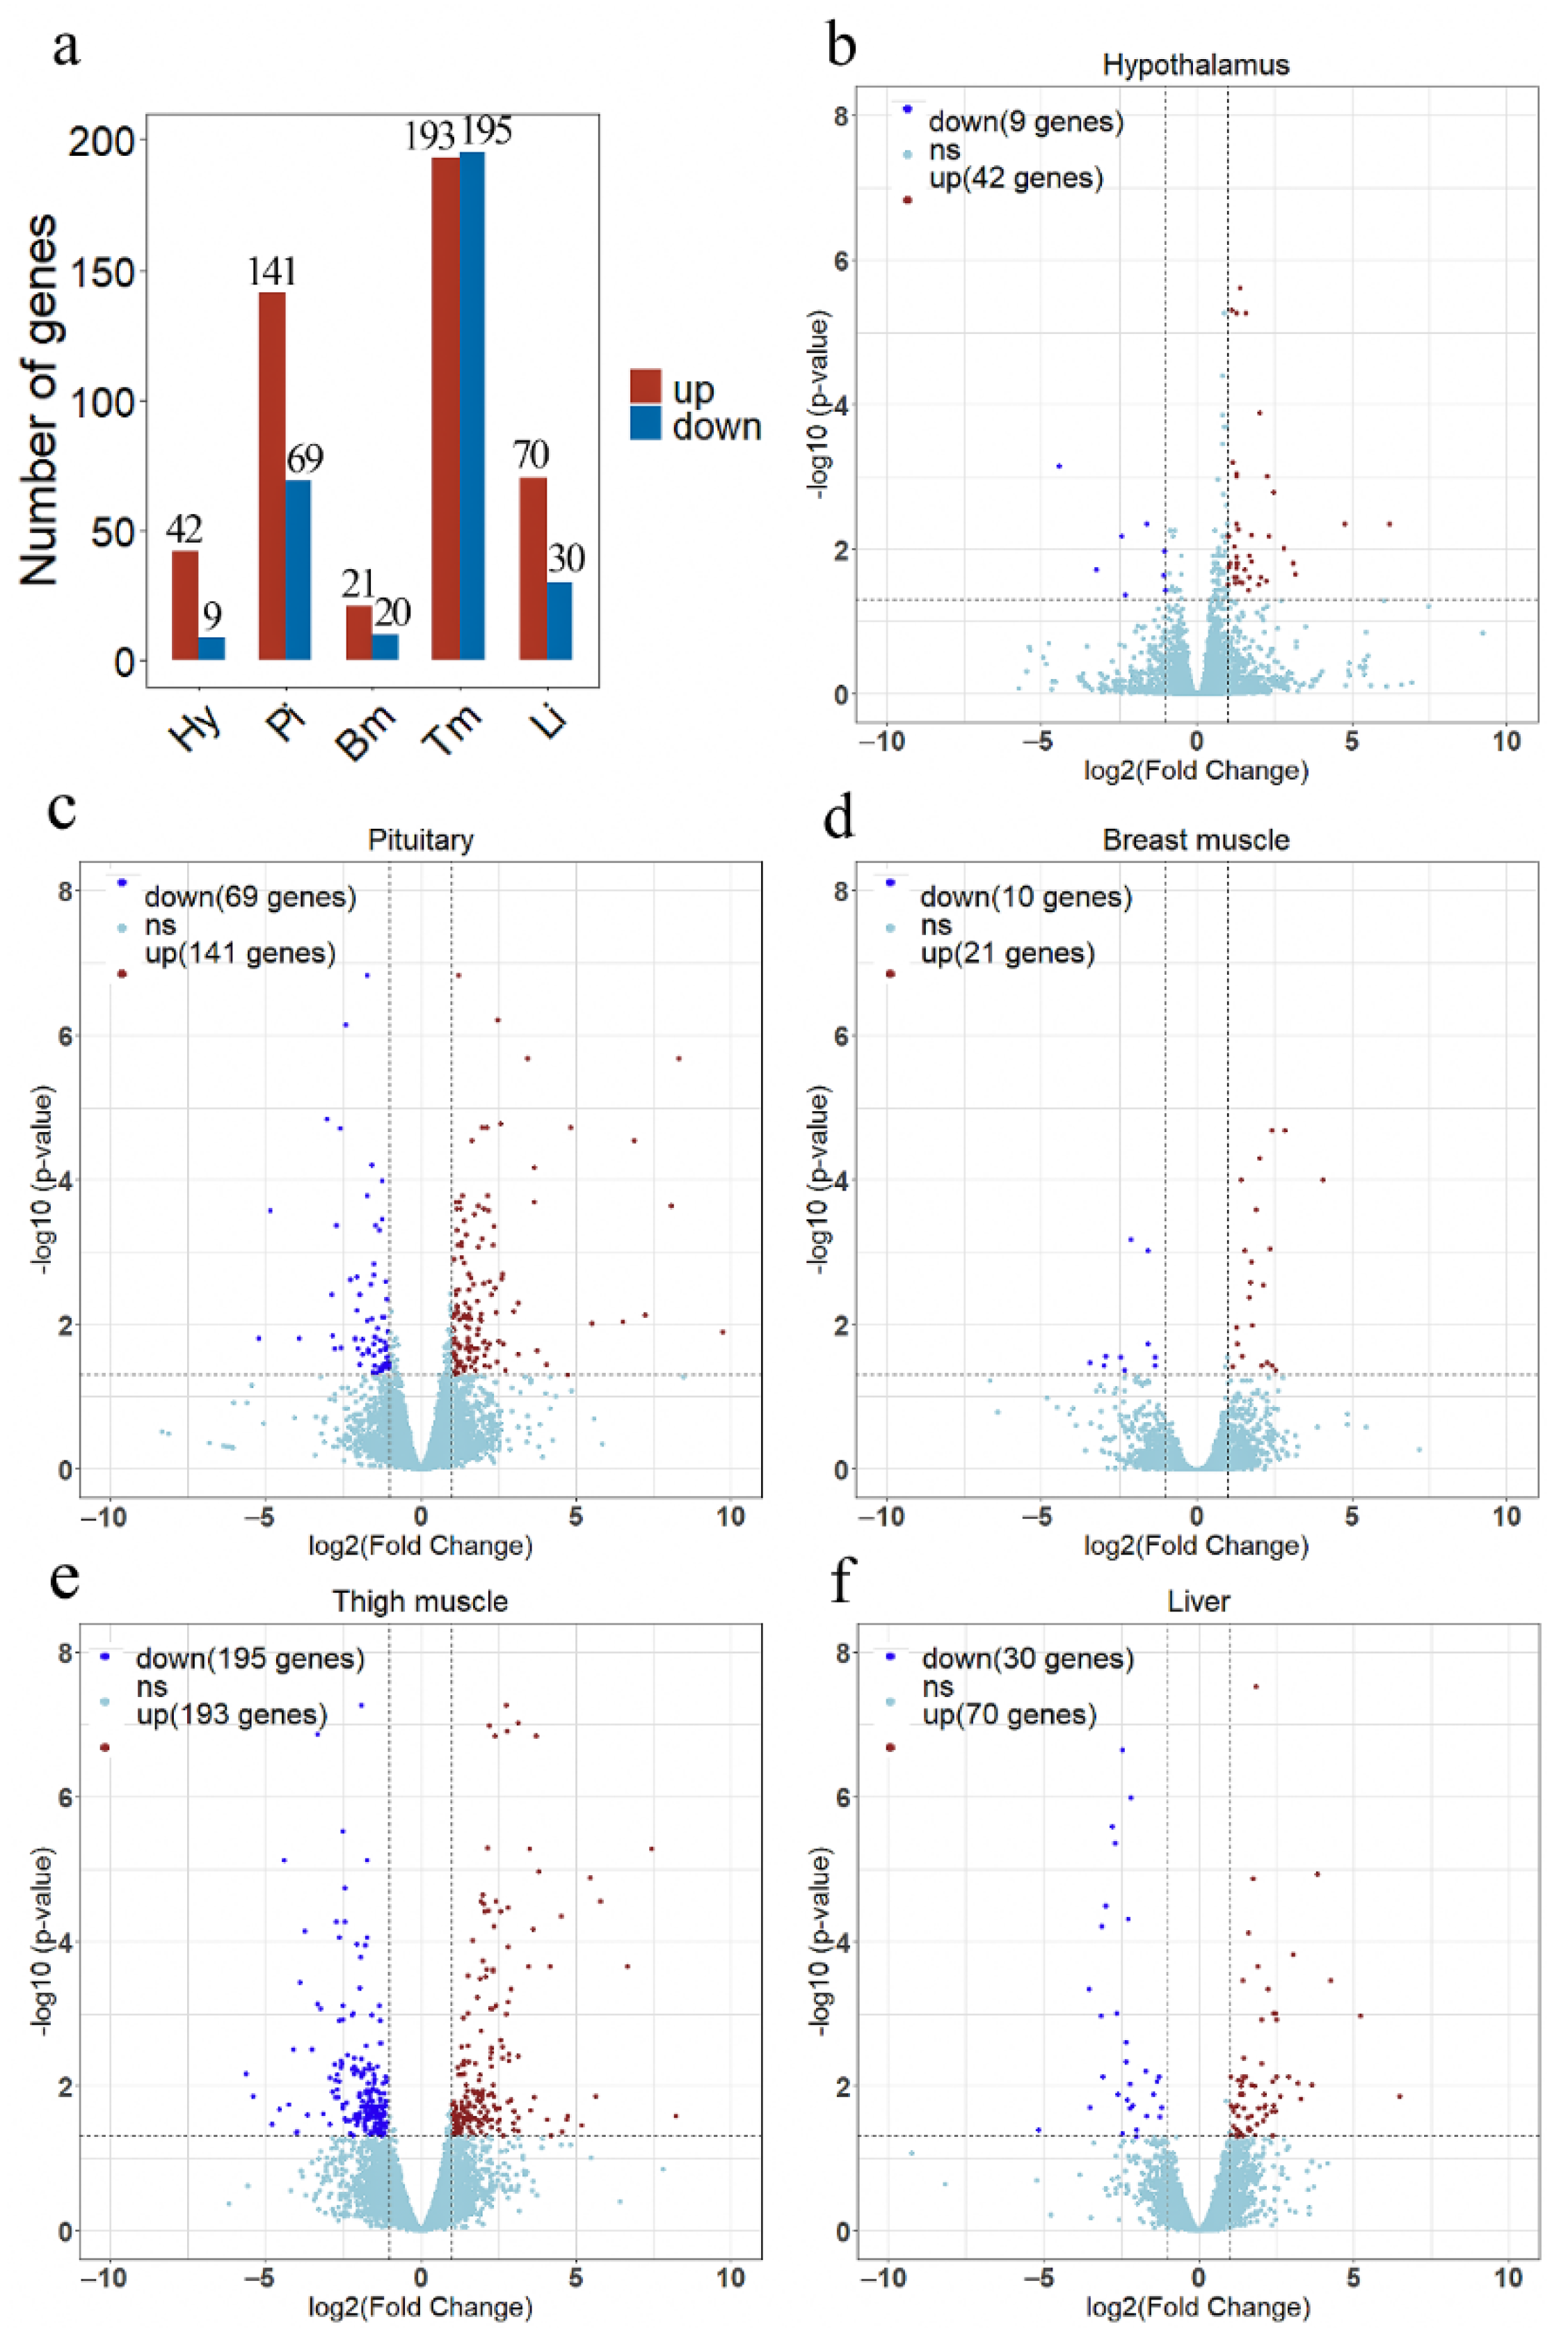
In each line, three animals were selected with close to average body weight, and five different tissues were collected from each sample. 30 RNA samples ware used to construct separate RNA-seq libraries. A total 110 Gb of raw data were obtained from RNA sequencing. More than 90% of the clean reads were mapped to the broiler reference genome (GCF_000002315.6), which included 87% in the exonic regions and 9% in the introns. The average percentages of Q20 and Q30 bases were >97.34% and >92.75%, respectively (Supplementary Table S2). There was an average of 50,244,659 clean reads for each sample after quality control. Correlation analysis of gene expression levels showed a high correlation among samples, which indicated that the selection of experimental samples was reliable (Supplementary Figure S1). The statistical power ranged from 0.69 to 0.84 for different tissues (Supplementary Figure S2). A total of 51, 210, 31, 388, and 100 DEGs were identified in the hypothalamus, pituitary, breast muscle, thigh muscle, and liver between lines S and D (Figure 3a). Heatmap of the DEGs showed that these DEGs easily differentiated line S from line D (Supplementary Figure S3).
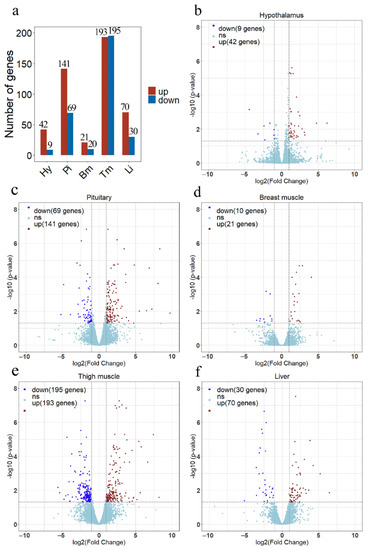
Figure 3.
The results of differential expression analysis in each tissue between line S and line D. (a) The overview of the number of differentially expressed genes (DEGs) in each tissue. The volcano plots show differentially expressed genes in the hypothalamus (b), pituitary (c), breast muscle (d), thigh muscle (e), and liver (f). Red dots indicate up-regulated genes in line S, dark blue dots indicate down-regulated genes in line S, and the light blue dots indicate no significant changes in gene expression. Significant DEGs were identified by filtering the p-value < 0.05 and |log2 (Fold Change)| > 1. Hy, Hypothalamus; Pi, Pituitary; Bm, Breast muscle; Tm, Thigh muscle; and Li, Liver.
3.2.1. Hypothalamus and Pituitary Tissues
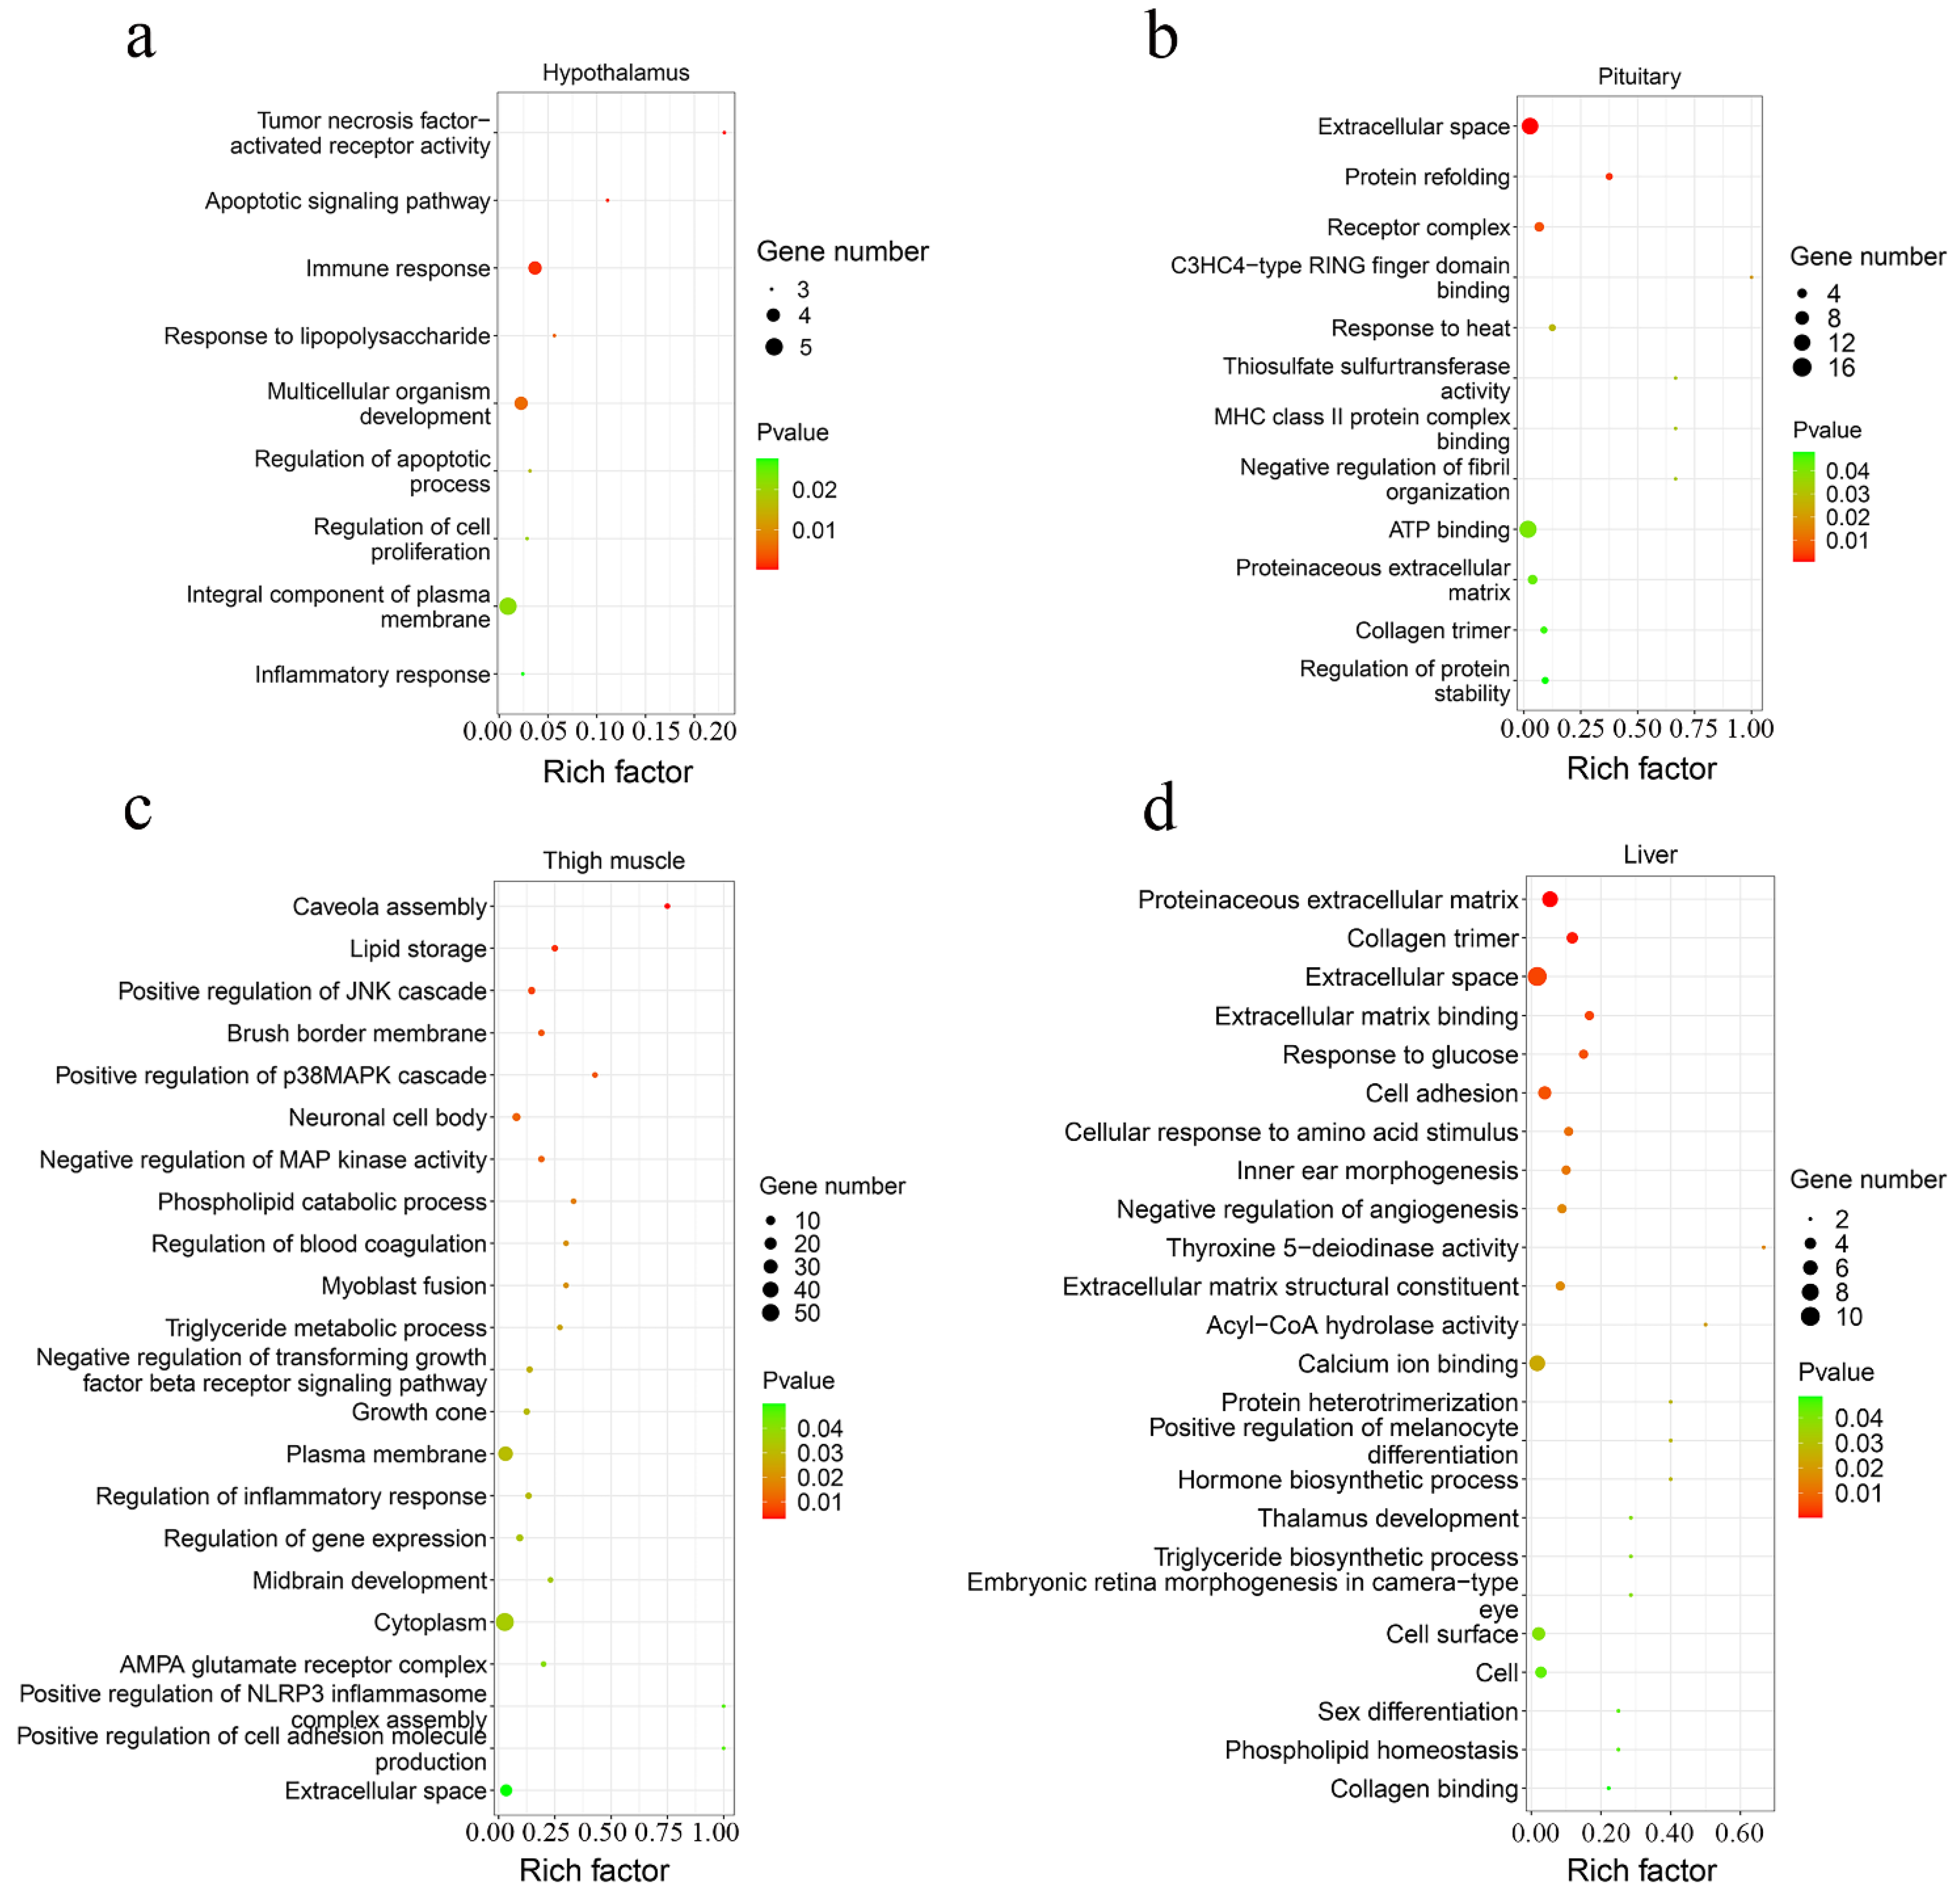
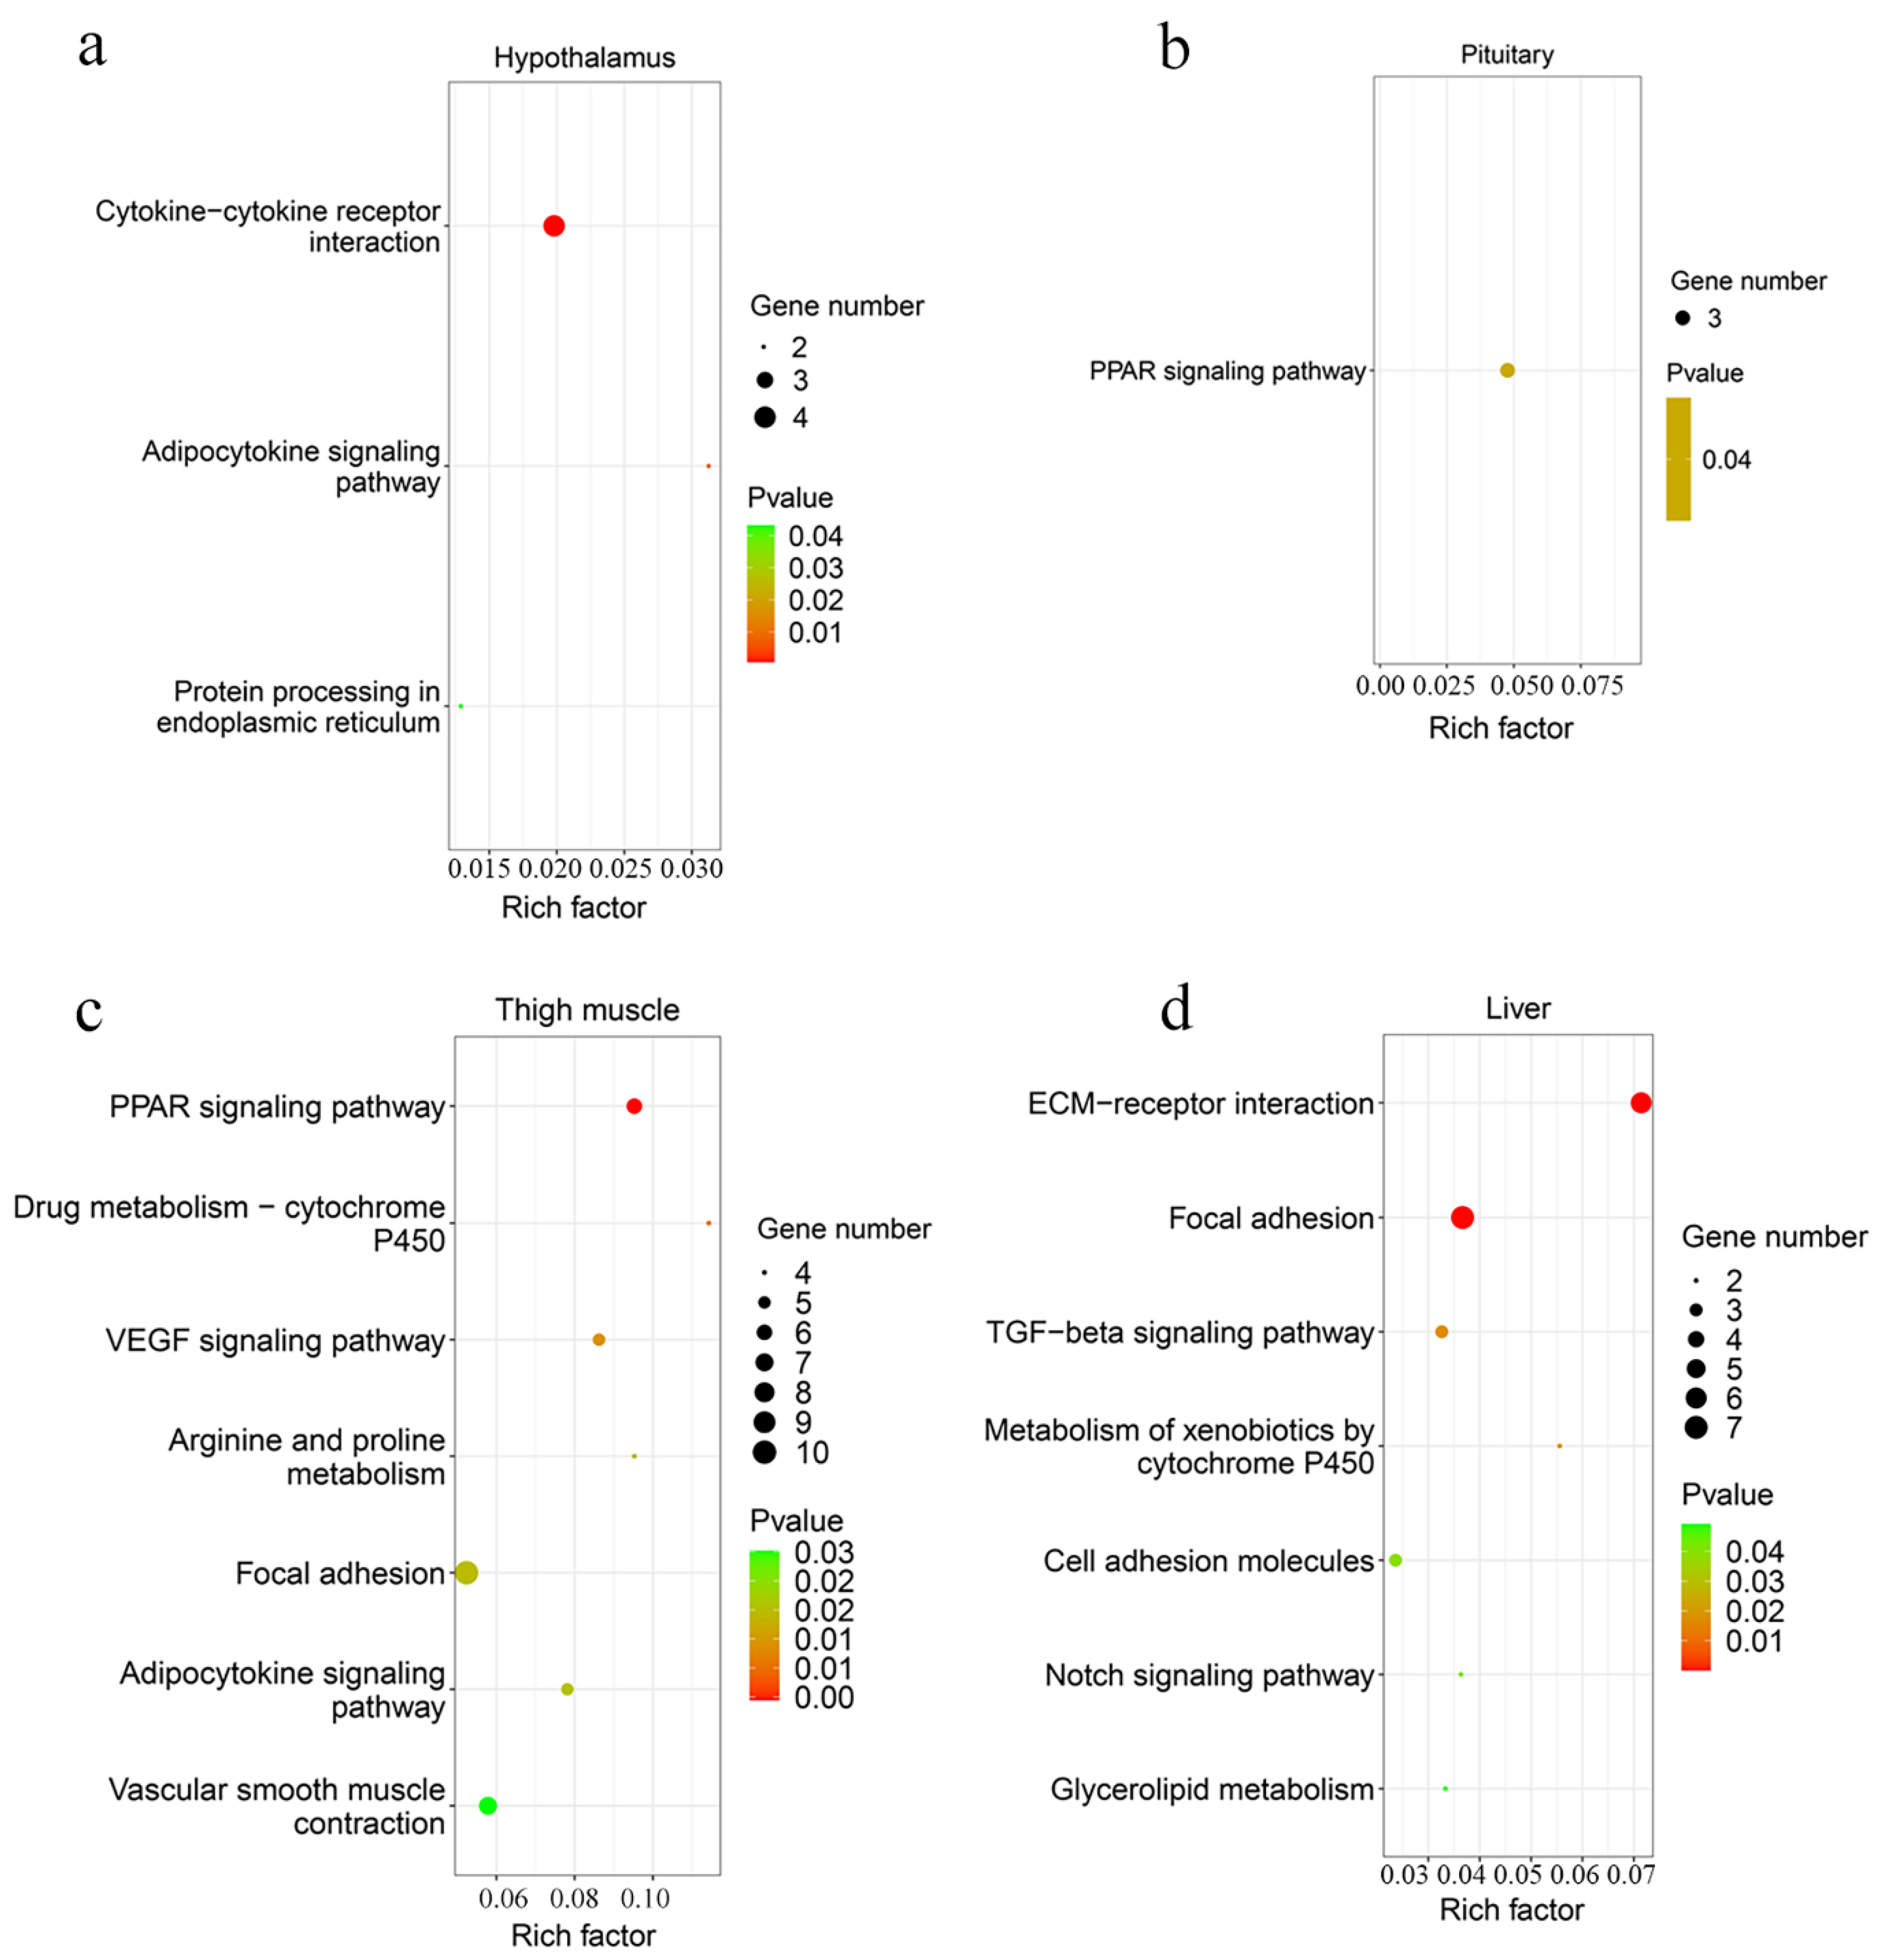
A total of 42 up-regulated and 9 down-regulated genes were identified in the hypothalamus, and 141 increased and 69 decreased genes were screened in the pituitary (Figure 3b,c, Supplementary Table S3). Among them, there were 11 common DEGs in the hypothalamus and pituitary, which included DS cell adhesion molecule (DSCAM), peptidase inhibitor 16 (PI16), leptin receptor (LEPR), and others. In total, 9 and 12 Gene Oncology (GO) terms significantly enriched terms were found in the hypothalamus and pituitary, respectively (Figure 4a,b). TNFRSF18, TNFRSF8, and TNFRSF1B dominated almost all enriched GO items in the hypothalamus (Supplementary Table S4). Furthermore, these three genes and LEPR were involved in the cytokine-cytokine receptor interaction pathway, which is the prominent KEGG pathway in the hypothalamus (Figure 5a, Table 2 and Supplementary Table S5). Nevertheless, only the PPAR signaling pathway was enriched significantly in the pituitary, which included HMGCS1, ACSL6, and PLTP genes (Figure 5b, Table 2 and Supplementary Table S5).
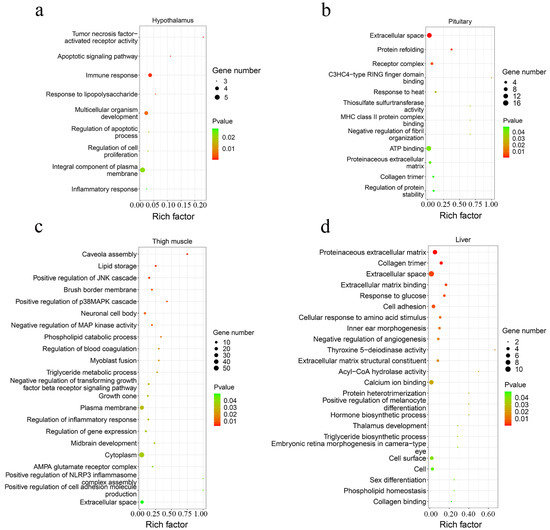
Figure 4.
The scatter plot of GO functional enrichment. The enriched GO terms of DEGs in the hypothalamus (a), pituitary (b), thigh muscle (c), and liver (d).
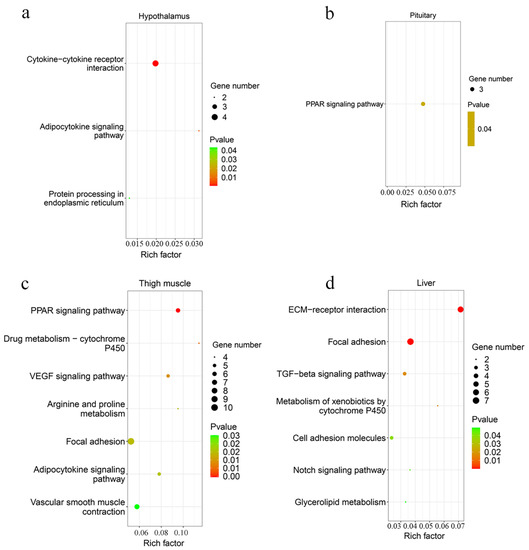
Figure 5.
The scatter plot of KEGG pathway analysis. The enriched KEGG pathway of DEGs in the hypothalamus (a), pituitary (b), thigh muscle (c), and liver (d).
Table 2.
The significantly enriched KEGG pathway and related differential genes in each tissue.
3.2.2. Muscle Tissues
A total of 193 up-regulated genes and 195 down-regulated genes were identified in the thigh muscle, but only 21 up-regulated genes and 10 down-regulated genes were found in breast muscle (Figure 3d,e, Supplementary Table S3). The expression of genes related to muscle development, such as MYH1D, MSTN, MYH10, MYLPF, MYLK4, MYL1, and MYBPC1, were altered in muscle tissues. There were 12 DEGs both in breast muscle and thigh muscle, such as MYBPC1, UBB, MHCIY, SLC25A30, RSRP1, DDX59, and DDIT4. The 388 DEGs of the thigh muscle were enriched significantly to 22 GO terms and 7 KEGG pathways (Figure 4c and Figure 5c). The PPAR signaling pathway had a high rich factor and showed the most significant differences, including GK2, ACOX2, APOA1, ACSL1, FABP3, and CD36. Focal adhesion and vascular smooth muscle contraction comprised the largest number of DEGs (Table 2). In addition, the functions of DEGs were also related to metabolism, such as drug metabolism-Cytochrome P450, arginine and proline metabolism, and the adipocytokine signaling pathway. Due to the fewer number of DEGs in breast muscle, we did not find significantly enriched KEGG pathway or GO terms.
3.2.3. Liver Tissue
In the liver, there were 70 up-regulated and 30 down-regulated DEGs, which were mainly related to the cellular community (focal adhesion), signaling molecules and interactions (ECM-receptor interaction, cell adhesion molecules), and signal transduction (TGF-β signaling pathway, Notch signaling pathway) in liver (Figure 3f and Figure 5d, Supplementary Table S3). Almost all the genes enriched in these pathways were up-regulated in liver in the fast-growing group (Table 2). The ECM-receptor interaction pathway and focal adhesion involved the largest numbers of DEGs, which included COL1A1, COL1A2, COL6A1, and COL6A3. These four genes were also enriched in several GO terms that included an extracellular matrix structural constituent (GO:0005201), a protein heterotrimerization (GO:0070208), a cellular response to amino acid stimulus (GO:0071230), and cell adhesion (GO:0007155) (Figure 4d, Supplementary Table S4). Interestingly, the focal adhesion was a common pathway between the liver and thigh muscles. Among enrichment pathways of liver, glycerolipid metabolism and metabolism of xenobiotics by cytochrome P450 were related to metabolism.
3.3. Interaction Network between DEGs
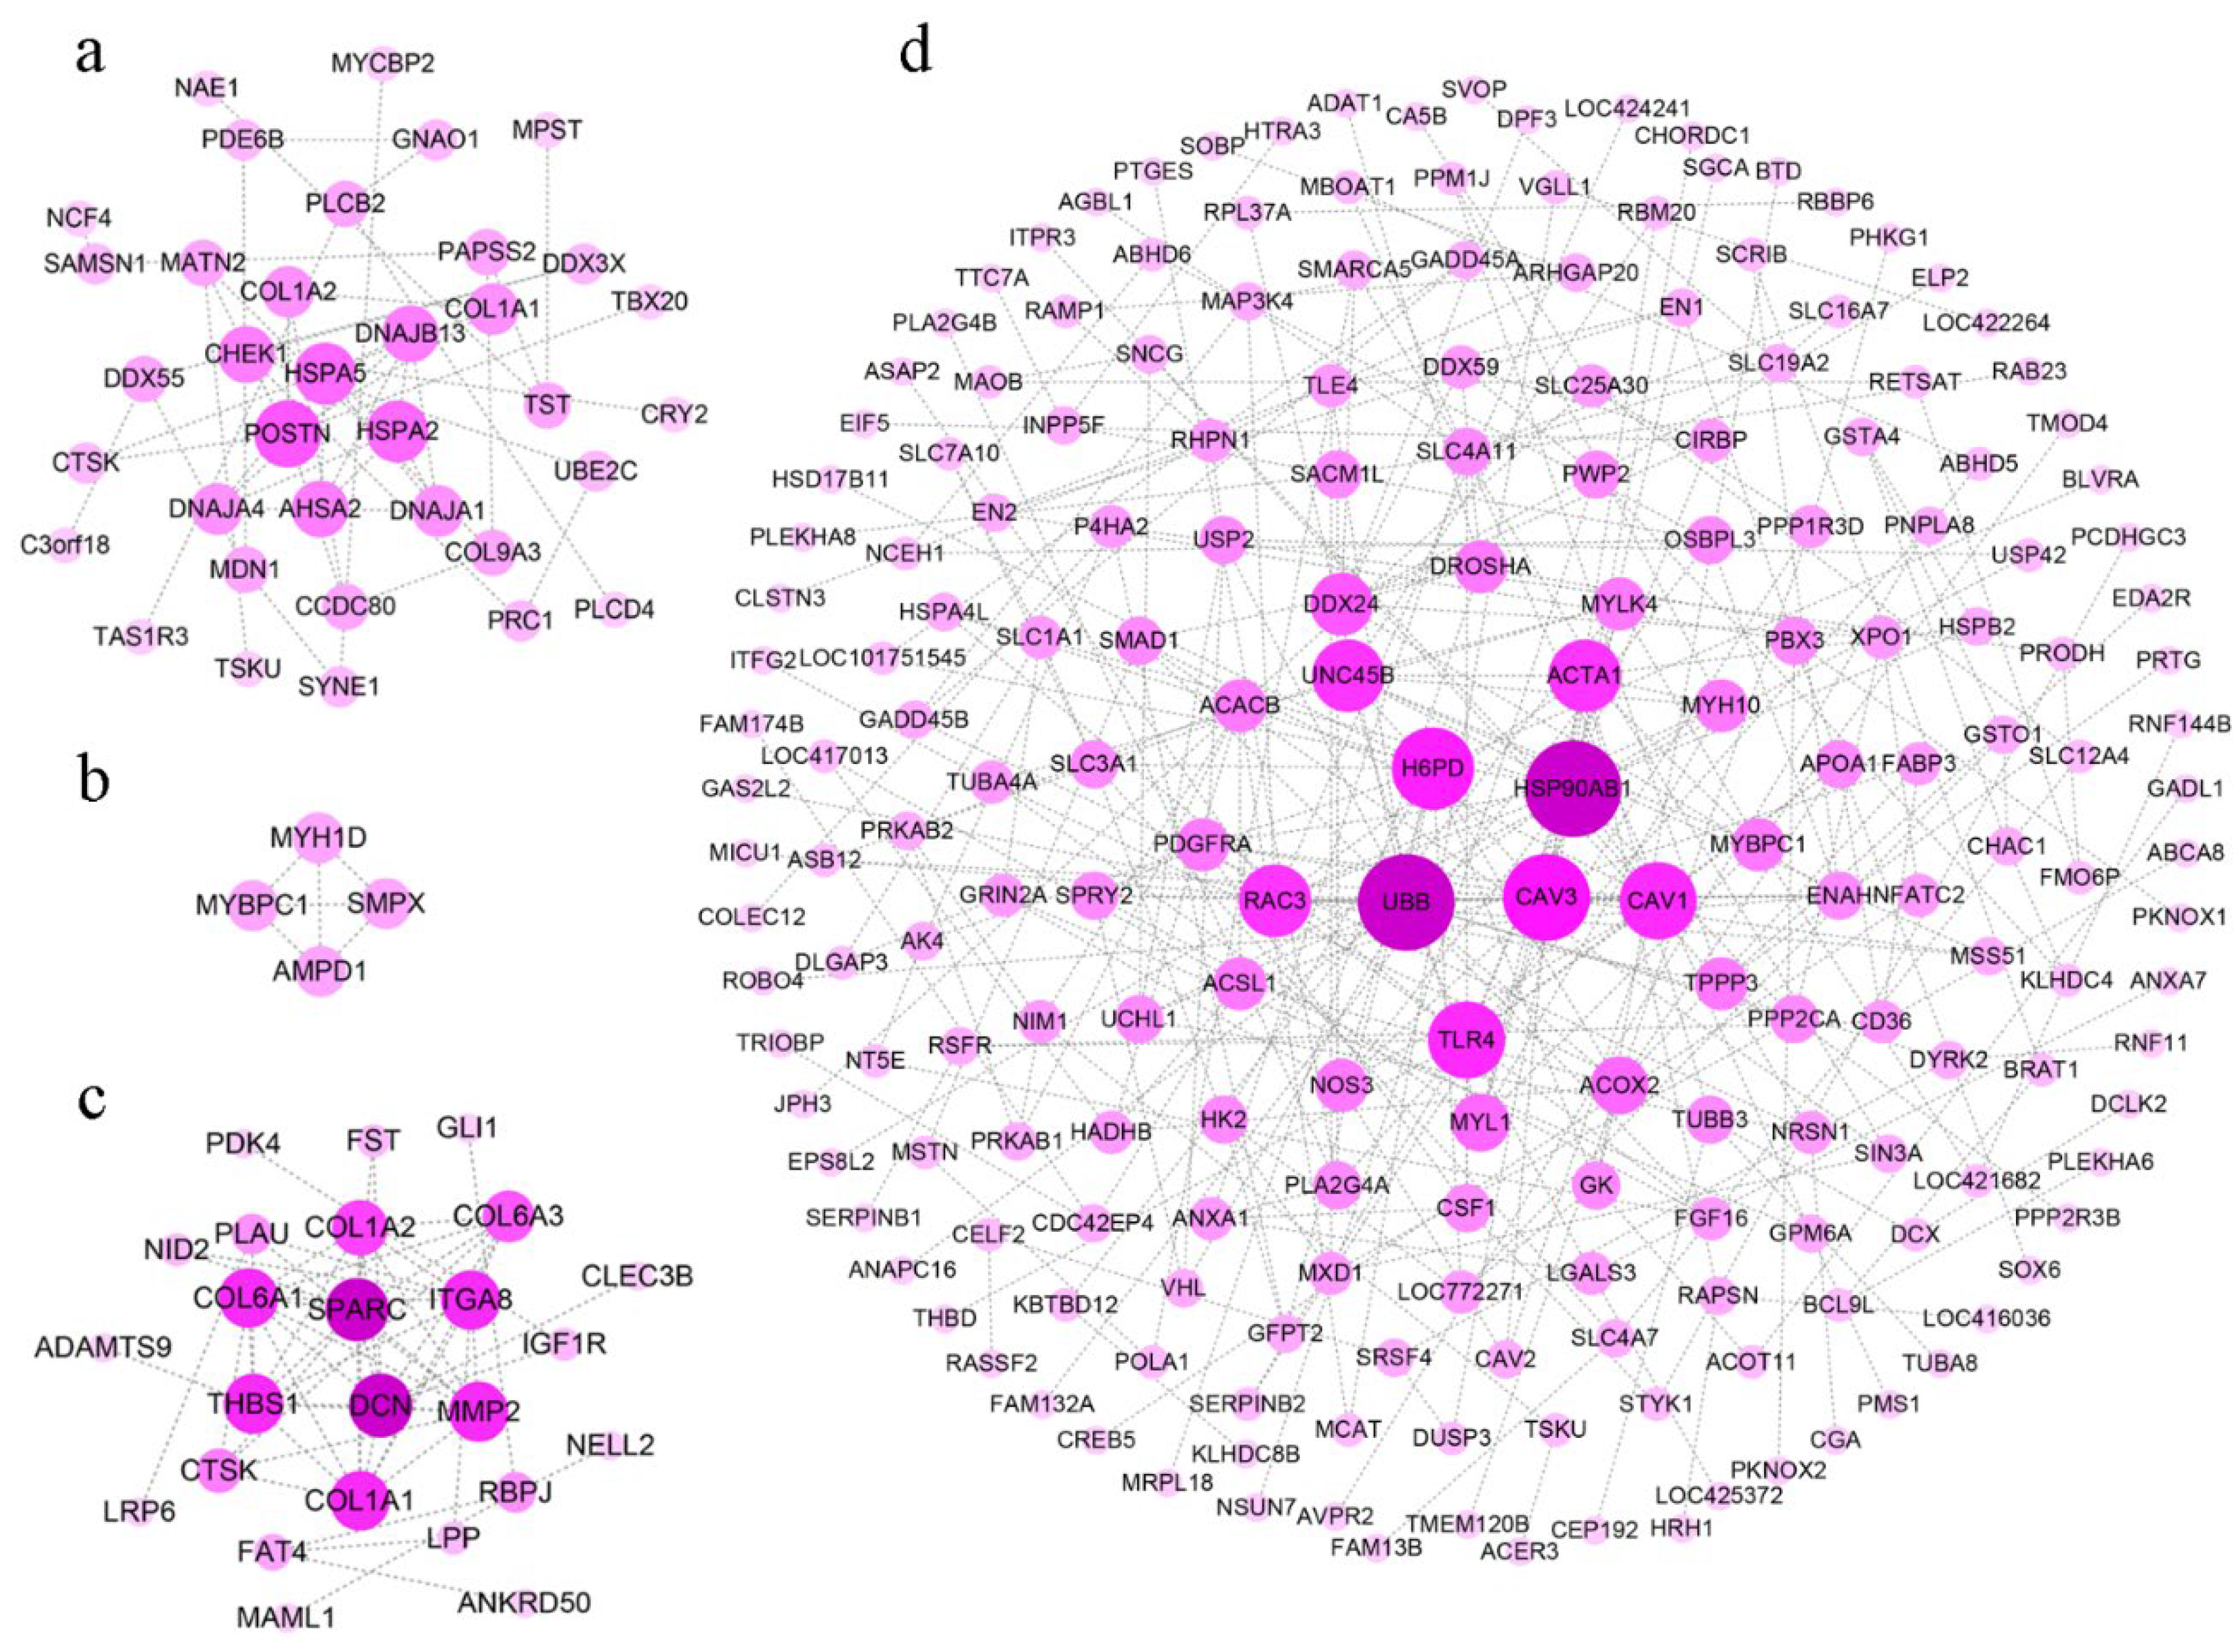
To clearly discover hub genes related to growth traits in a complex regulatory network, gene interactions were explored using the String database, and we constructed protein interaction networks in different tissues. DEGs in the hypothalamus failed to form regulatory networks because of a weak association in this study. Based on DEGs in the pituitary, the protein interaction network in the pituitary suggested that POSTN, HSPA2, HSPA5, DNAJB13, AHSA2, and DNAJA1 occupied the most critical locations (Figure 6a).
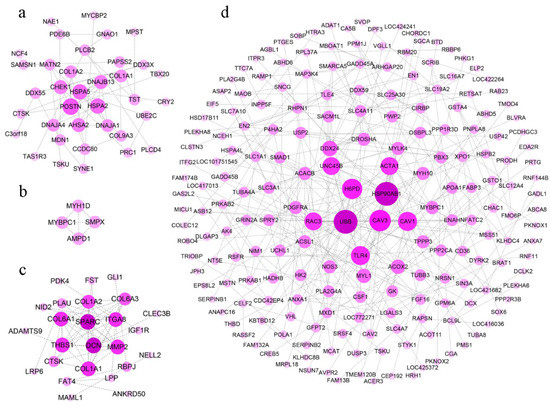
Figure 6.
The protein-protein interaction network based on the DEGs between line S and line D. The protein-protein interaction network of DEGs in pituitary (a), breast muscle (b), thigh muscle (c), and liver (d) were analyzed and visualized by String and Cytoscape. The darker dots in the center indicate higher levels of gene interaction degree.
Only MYBPC1, SMPX, MYH1D, and AMPD1 were involved in the formation of the regulatory network in a few DEGs in breast muscle (Figure 6b). These genes were related to metabolic pathways and muscle contraction. In thigh muscle, abundant DEGs showed more complex regulatory networks, in which UBB, CAV3, TLR4, HSP90AB1, H6PD, ACTA1, and several genes that were expressed peculiarly in myosin (i.e., MYH10, MYL1, and MYBPC1) were hub genes (Figure 6c).
In the regulatory network in the liver, the hub genes (i.e., DSN, ITGA8, THBS1, COL1A1, COL6A3, and COL1A2) were engaged in ECM-receptor interaction, focal adhesion, and the TGF-β signaling pathway (Figure 6d, Table 2). These pathways were up-regulated, which indicated there was increased metabolic activity in the liver during rapid growth.
3.4. Validation of RNA-seq
Nine DEGs were selected randomly to verify the accuracy of RNA-seq by the qRT-PCR method. The qRT-PCR analysis indicated decreased expression of EDA2R, ACSL1, CD36, PITX2, FHL2, and FABP3 genes and increased expression of DNAJB5, DUSP1, and DDX59 genes in the fast-growing line S of chickens, which was consistent with transcriptome results (Figure 7).
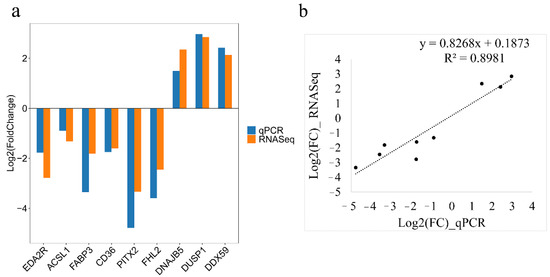
Figure 7.
Validation of the RNA sequencing analysis data by quantitative real-time PCR (qRT-PCR) analysis. (a) The expression levels of differentially expressed genes were determined by qRT-PCR and RNA-Seq. Log2(FoldChange) < 0 represents down-regulated expression in line S and log2(FoldChange) > 0 represents up-regulated expression in line S. (b) The correlation analysis of gene expression between RNA-seq and qRT-PCR.
4. Discussion
Traditionally, the long growth period of indigenous breeds contributes to low profits in the poultry industry. In this study, distinct phenotypic differences were observed between these two lines. The body weight of the fast-growing line S after four generations of selective breeding increased 14.25% (215 g) on average compared with the slow-growing line D. Under identical feed conditions, commercial chickens showed a higher myofiber area and a decreased amount of breast muscle [17]. In the present study, myofiber area and density between the two lines in breast muscle exhibited no significant difference. High amounts of myofiber improved the weight of skeletal muscle, and it also enhanced body weight [18]. In addition, our results showed that the myofiber area of the breast muscle was significantly lower than that of the thigh muscle from both lines, which was consistent with studies of fast-growing Ross 308 broilers and slow-growing Xueshan chickens [18]. Growth rate not only affects muscle fiber density and size, but also affects meat quality, such as meat color and drop loss [19]. In our previous study, we found that the lightness, yellowness, and drip loss were elevated in breast and thigh muscles from Guangxi Partridge line S chickens, and pH and shear force were decreased in muscles from line S chickens [20]. Here, we speculated that weight differences caused by artificial selection led to a greater influence on thigh muscle, which was consistent with a higher number of DEGs and more distinct phenotypic differences in the thigh muscle.
We used transcriptome analysis of various tissues to explore the biological mechanisms of artificial selective pressure for growth rate in broilers. In summary, 51, 210, 31, 388, and 100 DEGs were found in hypothalamus, pituitary, breast muscle, thigh muscle, and liver, respectively. The results from nine DEGs detected by qRT-PCR were consistent with RNA-Seq, which proved the reliability of transcriptome sequencing results. Based on functional analysis and pathway analysis, there were differences in cell proliferation and differentiation, muscle development, metabolic processes, and signal transduction after artificial selection for growth rate.
4.1. Hypothalamus and Pituitary
TNFRSF18, TNFRSF8, TNFRSF1B, and LEPR genes were identified in the hypothalamus and they came in cytokine–cytokine receptor interaction signaling pathways. The TNF receptor superfamily (TNFRSF) is the receptor of the TNF superfamily (TNFSF) of cytokine-like molecules. The interactions of TNFSF ligands and TNFRSF receptors mediated signaling that was involved in survival, proliferation, and differentiation [21]. The TNF-α triggered different key steps in the insulin signaling pathway and then altered insulin sensitivity, which was important for regulation of feed intake [22,23]. Previous studies have suggested that the cytokine-cytokine receptor interaction signaling pathway played a role in upstream regulatory pathways of PPAR signaling pathways in lipid metabolism [24].
In this study, three DEGs (i.e., HMGCS1, ACSL6, and PLTP) and six DEGs (i.e., GK2, ACOX2, APOA1, ACSL1, FABP3, and CD36) that were found in the pituitary and thigh muscle, respectively, were involved in the PPAR signaling pathway, which functions in lipid metabolism, regulation of muscle fiber type, and energy utilization [25,26,27]. PPAR signaling is a key signaling pathway for muscle growth and regeneration, and it is dependent on activation of the PI3K-Akt-mTOR signaling axis to exert functions [28].
Growth and development of creatures are regulated by several hormones secreted by the hypothalamus and the pituitary. However, no significant change in the expression levels of hormones and their associated receptor genes were detected in the hypothalamus and pituitary except for FST, TSHB, and LEPR. Follistatin (FST) promoted muscle fiber formation and regulated muscle mass by inhibiting the binding activity of myostatin and its receptor, which determined increased expression in breast muscle in fast-growing exotic broilers [29,30,31]. Thyrotropin subunit β isoform X1 (TSHB) regulated seasonal reproductive behavior in birds; compared with Red Junglefowl, the level of TSHB was higher in the pituitary of White Leghorn chickens, which indicated a contribution to domesticated traits [32]. The LEPR gene encoded the leptin receptor, which functioned as a crucial regulator of food intake and body weight by regulating insulin sensitivity through the JAK2 and STAT3 pathways [33,34,35,36]. Polymorphisms of the LEPR gene were associated with backfat thickness, intramuscular fat content and growth in pigs, and feed efficiency in chickens [37,38]. Significant alteration of these hormone receptors and pathways in the hypothalamus and the pituitary may clarify the growth difference between the two lines by regulating feed intake, insulin sensitivity, downstream muscle growth, and metabolic signaling pathways.
4.2. Skeletal Muscle
Several pathways for thigh muscle in the selected bred line S were associated with lipid metabolism, such as the adipocytokine signaling pathway, the PPAR signaling pathway, and glycerolipid metabolism, which included CD36, PRKAB1, PRKAB2, FABP3, and others. The membrane fatty acid transporter CD36 is known for its role in metabolism and oxidation of fatty acids. The expression of CD36 was enhanced to improve fatty acid transport when muscle oxidation capacity was increased [39]. PRKAB1 and PRKAB2 encoded the β1 and γ2 regulatory subunit of activated protein kinase (AMPK). These two genes were associated significantly with feed intake, feed conversion ratio, and body weight [40].
As expected, most of the genes critical for myogenesis were upregulated in line S with increased growth rates, such as MHCIY, MYBPC1, and MYH1D in breast muscle, and MHCIY, MYLPF, MYLK4, MYL1, and ACTA1 in thigh muscle. Nevertheless, there were also genes like MYH10, MYH1D, and MYBPC1 with lower expression levels in thigh muscle of line S. These genes were also highly connected in the protein interaction network.
Myofibers can be divided into oxidative (type I and IIA) and glycolytic fibers (type IIB) in chickens. Oxidative fibers and glycolytic fibers exhibit different contractility, glycolytic metabolism and oxidative metabolism based on mitochondrial oxidative phosphorylation [41]. In addition, the ratio of oxidative (type IIA) fibers and glycolytic fibers showed a temporal-dependent pattern and impact on pork quality [42,43]. The down-regulated MYL1, which is a fast muscle fiber maker [44], and the up-regulated slow-type isoform MYBPC1, indicated that the proportion of glycolic myofibers was increased in thigh muscle of line S chickens. This is consistent with a previous study that the size and types of myofibers between meat-type and egg-type chickens were different, and selection for growth promoted radial hypertrophy of type II muscle fibers [45]. In general, we hypothesized that selective pressure transformed myofiber types by changes in related genes and resulted further in weight variation in the fast-growing line S. In total, lipid metabolism and muscle development explained the increased growth rate and hypertrophy of muscle fiber in the selected line.
There are several other candidate genes associated with production traits. RNA-Seq showed down-regulated expression of PITX1 and PITX2 in thigh muscle tissue of line S. Paired-like homeodomain transcription factor 2 (PITX2) and paired-like homeodomain transcription factor 1 (PITX1) are important transcription factors, which were highly expressed in skeletal muscle and modulate skeletal muscle development and organ morphogenesis [46,47,48]. Multiple studies have shown that PITX2 was correlated significantly with the growth traits and meat quality of chickens, pigs, cattle, sheep, and other animals [49,50,51,52,53,54]. Mice with over-expressed PITX1 exhibited decreased body weight, muscle mass, muscle strength, and atrophic muscle fibers [55]. However, the causal variants of PITX1 generated the feathered leg trait in chickens and pigeons without impairment of growth performance [56,57]. AMP deaminase 1 isoform X1 (AMPD1) that was expressed specifically in skeletal muscle, was up-regulated during muscle development [58]. The AMPD1 gene was associated with meat production and growth through backfat thickness, body weight, and inosine monophosphate acid concentrations [59,60,61]. According to our results, up-regulated AMPD1 in breast muscle of line S indicated increased activity related to muscle development. These genes are involved in variations in lines as regulators of body weight and control of growth performance.
4.3. Liver
In liver, fast-growing line S focused on specific signaling pathways. Signaling molecules and interactions (i.e., ECM-receptor interaction, cell adhesion molecules), cellular community—eukaryotes (focal adhesion), and signal transduction (i.e., TGF-β signaling pathway, notch signaling pathway) suggested that the speedy development was affected by the integration of complex pathways. Focal adhesion, which connects the extracellular matrix and cytoskeleton, was an important site for the signal transduction pathway in various biological processes [62]. ECM-receptor interaction and focal adhesion were the most enriched pathways in three chicken breeds with different growth rates [4], which was consistent with this study. COL1A1, COL1A2, COL6A1, and COL6A3 that encode collagen α chain are involved in ECM-receptor interaction and focal adhesion. Mutations in these four genes were associated with myopathy and osteogenesis imperfecta [63,64]. Secreted protein acidic and cysteine rich (SPARC), thrombospondin 1 (THBS1), and decorin (DCN), which occupied the core of the regulatory network, are extracellular matrix-related genes. SPARC and DCN were associated with insulin resistance and obesity [65,66]. Secretion of SPARC by adipose tissue was increased by insulin and the adipokine leptin [65]. THBS1 bound to many transforming growth factors and cell surface receptors to regulate cellular adhesion, platelet aggregation, angiogenesis, and hepatic steatosis [67]. As a potential mediator of insulin resistance, THBS1 reflected the complex phenotype between obesity and metabolic syndrome or diabetes in humans [66]. DCN that was involved in cell growth and angiogenesis inhibited tumor progression and fibrosis [68].
Interestingly, almost all the genes enriched in these pathways were upregulated in the liver along with increased growth, which indicated a significant improvement in liver metabolic function in the fast-growing line S. Increased activity of signaling molecular pathways and cell community in liver affects the interactions of multiple complex pathways. This suggests appropriate changes in signaling pathways and metabolic function are required to accommodate improved growth performance.
5. Conclusions
The growth rate of Guangxi Partridge chickens has been improved profoundly after four generations of selective breeding for growth velocity. Transcriptome analysis was adopted to explore developmental mechanisms of growth and functional features of each tissue between two lines with different growth rates. Reduced LEPR expression in the hypothalamus and the pituitary reduced the inhibitory effect on food intake and weight gain through leptin signaling pathways and many neuroendocrine processes. The cytokine-cytokine receptor interaction signaling pathway in the hypothalamus, which regulated insulin sensitivity, varied the uptake and utilization of fatty acids though the PPAR signaling pathway, the adipocytokine signaling pathway, and glycerolipid metabolism. Genes that were related to myogenesis, such as MHCIY, MYBPC1, and MYL1, suggested that the muscle fiber type and muscle development was transformed in muscle tissue. Cellular community-related activities and pathways were improved in the liver. Collectively, our results determined the developmental dynamics in several tissues between the two lines and provide new insight into mechanisms of breeding.
Supplementary Materials
The following are available online at https://www.mdpi.com/article/10.3390/genes13050798/s1, Figure S1: The heatmap of correlations between all tissues; Figure S2: The statistical power of RNA-seq differential expression analysis; Figure S3: The heatmap of DEGs in each tissue; Table S1: Primers used for qRT-PCR; Table S2: Overall statistics and read mapping to the reference for each library; Table S3: List of DEGs in each tissue between line S and line D chickens; Table S4: List of significantly enriched GO terms of DEGs; and Table S5: List of significantly enriched KEGG pathway of DEGs.
Author Contributions
Data curation, M.S., Q.Z. and Y.T.; Formal analysis, M.S., K.S., Q.Z., Y.D., Y.S., J.T., M.Y. and D.L.; Y.T.; Funding acquisition, Y.L. and C.F.; Investigation, Q.Z., Y.L. and C.F.; Methodology, M.S., K.S. and D.L.; Project administration, Y.L., Y.T. and C.F.; Supervision, C.F.; Validation, M.S., K.S. and K.H.; Visualization, M.S.; Writing—original draft, M.S., K.S. and Q.Z.; Writing—review and editing, Y.L. and C.F. All authors have read and agreed to the published version of the manuscript.
Funding
This work was funded by the National Key R&D Program of China (Grant No. 2021YFD1300100), the Guangxi Key R&D Program (No. AB21220005), and the Revitalization Program of Biological Breeding of Jiangsu Province (No. JBGS[2021]109).
Institutional Review Board Statement
All trials were designed and permitted by guidelines for animal welfare and use of animals. All procedures conducted with the chickens were approved by the Institutional Animal Care and Ethical Committee of Nanjing Agricultural University, Nanjing, Jiangsu, China (SYXK2011-0036).
Informed Consent Statement
Not applicable.
Data Availability Statement
The raw sequence data of the current study were deposited in the NCBI Sequence Read Archive (SRA), http://www.ncbi.nlm.nih.gov/bioproject/PRJNA809839 (accessed on 24 February 2022).
Acknowledgments
Thanks to Thomas A. Gavin, Cornell University, for improving the English of this manuscript.
Conflicts of Interest
Y.T. is an employee of Guangxi Fufeng Agricultural and Animal Husbandry Group Co., Ltd. that did not provide financial support to this study. All the other authors declare no conflicts of interest. The funders had no role in the design of the study; in the collection, analyses, or interpretation of data; in the writing of the manuscript; or in the decision to publish the results.
References
- Siegel, P.B. Evolution of the modern broiler and feed efficiency. Annu. Rev. Anim. Biosci. 2014, 2, 375–385. [Google Scholar] [CrossRef] [PubMed]
- Maharjan, P.; Martinez, D.A.; Weil, J.; Suesuttajit, N.; Umberson, C.; Mullenix, G.; Hilton, K.M.; Beitia, A.; Coon, C.N. Review: Physiological growth trend of current meat broilers and dietary protein and energy management approaches for sustainable broiler production. Anim. Int. J. Anim. Biosci. 2021, 15, 100284. [Google Scholar] [CrossRef] [PubMed]
- Tomas, E.; Kelly, M.; Xiang, X.; Tsao, T.S.; Keller, C.; Keller, P.; Luo, Z.; Lodish, H.; Saha, A.K.; Unger, R.; et al. Metabolic and hormonal interactions between muscle and adipose tissue. Proc. Nutr. Soc. 2004, 63, 381–385. [Google Scholar] [CrossRef] [PubMed] [Green Version]
- Zhang, Z.; Du, H.; Yang, C.; Li, Q.; Qiu, M.; Song, X.; Yu, C.; Jiang, X.; Liu, L.; Hu, C.; et al. Comparative transcriptome analysis reveals regulators mediating breast muscle growth and development in three chicken breeds. Anim. Biotechnol. 2019, 30, 233–241. [Google Scholar] [CrossRef] [PubMed]
- Ren, T.; Li, Z.; Zhou, Y.; Liu, X.; Han, R.; Wang, Y.; Yan, F.; Sun, G.; Li, H.; Kang, X. Sequencing and characterization of lncRNAs in the breast muscle of Gushi and Arbor Acres chickens. Genome 2018, 61, 337–347. [Google Scholar] [CrossRef] [PubMed] [Green Version]
- Cao, X.K.; Cheng, J.; Huang, Y.Z.; Wang, X.G.; Ma, Y.L.; Peng, S.J.; Chaogetu, B.; Zhuoma, Z.; Chen, H. Growth Performance and Meat Quality Evaluations in Three-Way Cross Cattle Developed for the Tibetan Plateau and their Molecular Understanding by Integrative Omics Analysis. J. Agric. Food Chem. 2019, 67, 541–550. [Google Scholar] [CrossRef] [PubMed]
- Zhang, Y.; Wang, Y.; Li, Y.; Wu, J.; Wang, X.; Bian, C.; Tian, Y.; Sun, G.; Han, R.; Liu, X.; et al. Genome-wide association study reveals the genetic determinism of growth traits in a Gushi-Anka F(2) chicken population. Heredity 2021, 126, 293–307. [Google Scholar] [CrossRef]
- Martín, A.I.; Priego, T.; López-Calderón, A. Hormones and Muscle Atrophy. Adv. Exp. Med. Biol. 2018, 1088, 207–233. [Google Scholar] [CrossRef]
- Kühn, E.R.; Geelissen, S.M.; Van der Geyten, S.; Darras, V.M. The release of growth hormone (GH): Relation to the thyrotropic- and corticotropic axis in the chicken. Domest. Anim. Endocrinol. 2005, 29, 43–51. [Google Scholar] [CrossRef]
- Cone, R.D. Studies on the physiological functions of the melanocortin system. Endocr. Rev. 2006, 27, 736–749. [Google Scholar] [CrossRef]
- Piórkowska, K.; Żukowski, K.; Połtowicz, K.; Nowak, J.; Ropka-Molik, K.; Derebecka, N.; Wesoły, J.; Wojtysiak, D. Identification of candidate genes and regulatory factors related to growth rate through hypothalamus transcriptome analyses in broiler chickens. BMC Genom. 2020, 21, 509. [Google Scholar] [CrossRef] [PubMed]
- Wang, C.; Ma, W. Hypothalamic and pituitary transcriptome profiling using RNA-sequencing in high-yielding and low-yielding laying hens. Sci. Rep. 2019, 9, 10285. [Google Scholar] [CrossRef] [PubMed] [Green Version]
- Julian, R.J. Production and growth related disorders and other metabolic diseases of poultry—A review. Vet. J. 2005, 169, 350–369. [Google Scholar] [CrossRef] [PubMed]
- Li, H.; Wang, T.; Xu, C.; Wang, D.; Ren, J.; Li, Y.; Tian, Y.; Wang, Y.; Jiao, Y.; Kang, X.; et al. Transcriptome profile of liver at different physiological stages reveals potential mode for lipid metabolism in laying hens. BMC Genom. 2015, 16, 763. [Google Scholar] [CrossRef] [Green Version]
- Willson, N.L.; Forder, R.E.A.; Tearle, R.; Williams, J.L.; Hughes, R.J.; Nattrass, G.S.; Hynd, P.I. Transcriptional analysis of liver from chickens with fast (meat bird), moderate (F1 layer x meat bird cross) and low (layer bird) growth potential. BMC Genom. 2018, 19, 309. [Google Scholar] [CrossRef] [Green Version]
- van Iterson, M.; van de Wiel, M.A.; Boer, J.M.; de Menezes, R.X. General power and sample size calculations for high-dimensional genomic data. Stat. Appl. Genet. Mol. Biol. 2013, 12, 449–467. [Google Scholar] [CrossRef]
- Koomkrong, N.; Theerawatanasirikul, S.; Boonkaewwan, C.; Jaturasitha, S.; Kayan, A. Breed-Related Number and Size of Muscle Fibres and Their Response to Carcass Quality in Chickens. Ital. J. Anim. Sci. 2015, 14, 4145. [Google Scholar] [CrossRef] [Green Version]
- Huo, W.; Weng, K.; Li, Y.; Zhang, Y.; Zhang, Y.; Xu, Q.; Chen, G. Comparison of muscle fiber characteristics and glycolytic potential between slow- and fast-growing broilers. Poult. Sci. 2021, 101, 101649. [Google Scholar] [CrossRef]
- Chodová, D.; Tůmová, E.; Ketta, M.; Skřivanová, V. Breast meat quality in males and females of fast-, medium- and slow-growing chickens fed diets of 2 protein levels. Poult. Sci. 2021, 100, 100997. [Google Scholar] [CrossRef]
- Shi, K.; Zhao, Q.; Shao, M.; Duan, Y.; Li, D.; Lu, Y.; Tang, Y.; Feng, C. Untargeted Metabolomics Reveals the Effect of Selective Breeding on the Quality of Chicken Meat. Metabolites 2022, 12, 367. [Google Scholar] [CrossRef]
- Dostert, C.; Grusdat, M.; Letellier, E.; Brenner, D. The TNF Family of Ligands and Receptors: Communication Modules in the Immune System and Beyond. Physiol. Rev. 2019, 99, 115–160. [Google Scholar] [CrossRef] [PubMed]
- Te Pas, M.F.W.; Borg, R.; Buddiger, N.J.H.; Wood, B.J.; Rebel, J.M.J.; van Krimpen, M.M.; Calus, M.P.L.; Park, J.E.; Schokker, D. Regulating appetite in broilers for improving body and muscle development-A review. J. Anim. Physiol. Anim. Nutr. 2020, 104, 1819–1834. [Google Scholar] [CrossRef] [PubMed]
- Bastard, J.P.; Maachi, M.; Lagathu, C.; Kim, M.J.; Caron, M.; Vidal, H.; Capeau, J.; Feve, B. Recent advances in the relationship between obesity, inflammation, and insulin resistance. Eur. Cytokine Netw. 2006, 17, 4–12. [Google Scholar] [PubMed]
- Liu, L.; Cui, H.; Fu, R.; Zheng, M.; Liu, R.; Zhao, G.; Wen, J. The regulation of IMF deposition in pectoralis major of fast-and slow-growing chickens at hatching. J. Anim. Sci. Biotechnol. 2017, 8, 77. [Google Scholar] [CrossRef] [PubMed] [Green Version]
- Manickam, R.; Duszka, K.; Wahli, W. PPARs and Microbiota in Skeletal Muscle Health and Wasting. Int. J. Mol. Sci. 2020, 21, 8056. [Google Scholar] [CrossRef] [PubMed]
- Wang, Y.X.; Zhang, C.L.; Yu, R.T.; Cho, H.K.; Nelson, M.C.; Bayuga-Ocampo, C.R.; Ham, J.; Kang, H.; Evans, R.M. Regulation of muscle fiber type and running endurance by PPARdelta. PLoS Biol. 2004, 2, e294. [Google Scholar] [CrossRef] [Green Version]
- Cui, H.; Zheng, M.; Zhao, G.; Liu, R.; Wen, J. Identification of differentially expressed genes and pathways for intramuscular fat metabolism between breast and thigh tissues of chickens. BMC Genom. 2018, 19, 55. [Google Scholar] [CrossRef]
- Mamoshina, P.; Volosnikova, M.; Ozerov, I.V.; Putin, E.; Skibina, E.; Cortese, F.; Zhavoronkov, A. Machine Learning on Human Muscle Transcriptomic Data for Biomarker Discovery and Tissue-Specific Drug Target Identification. Front. Genet. 2018, 9, 242. [Google Scholar] [CrossRef]
- Lee, S.J.; Lee, Y.S.; Zimmers, T.A.; Soleimani, A.; Matzuk, M.M.; Tsuchida, K.; Cohn, R.D.; Barton, E.R. Regulation of muscle mass by follistatin and activins. Mol. Endocrinol. (Baltim. Md.) 2010, 24, 1998–2008. [Google Scholar] [CrossRef] [Green Version]
- Amthor, H.; Nicholas, G.; McKinnell, I.; Kemp, C.F.; Sharma, M.; Kambadur, R.; Patel, K. Follistatin complexes Myostatin and antagonises Myostatin-mediated inhibition of myogenesis. Dev. Biol. 2004, 270, 19–30. [Google Scholar] [CrossRef]
- Dushyanth, K.; Shukla, R.; Chatterjee, R.N.; Bhattacharya, T.K. Expression and polymorphism of Follistatin (FST) gene and its association with growth traits in native and exotic chicken. Anim. Biotechnol. 2020, 1–11. [Google Scholar] [CrossRef] [PubMed]
- Fallahshahroudi, A.; Løtvedt, P.; Bélteky, J.; Altimiras, J.; Jensen, P. Changes in pituitary gene expression may underlie multiple domesticated traits in chickens. Heredity 2019, 122, 195–204. [Google Scholar] [CrossRef] [PubMed] [Green Version]
- Pan, W.W.; Myers, M.G., Jr. Leptin and the maintenance of elevated body weight. Nat. Rev. Neurosci. 2018, 19, 95–105. [Google Scholar] [CrossRef] [PubMed]
- Flak, J.N.; Myers, M.G., Jr. Minireview: CNS Mechanisms of Leptin Action. Mol. Endocrinol. (Baltim. Md.) 2016, 30, 3–12. [Google Scholar] [CrossRef] [PubMed] [Green Version]
- Bates, S.H.; Stearns, W.H.; Dundon, T.A.; Schubert, M.; Tso, A.W.; Wang, Y.; Banks, A.S.; Lavery, H.J.; Haq, A.K.; Maratos-Flier, E.; et al. STAT3 signalling is required for leptin regulation of energy balance but not reproduction. Nature 2003, 421, 856–859. [Google Scholar] [CrossRef] [PubMed]
- Kondo, H.; Shimomura, I.; Matsukawa, Y.; Kumada, M.; Takahashi, M.; Matsuda, M.; Ouchi, N.; Kihara, S.; Kawamoto, T.; Sumitsuji, S.; et al. Association of adiponectin mutation with type 2 diabetes: A candidate gene for the insulin resistance syndrome. Diabetes 2002, 51, 2325–2328. [Google Scholar] [CrossRef] [Green Version]
- Cristina, Ó.; Oliver, A.; Noguera, J.L.; Clop, A.; Barragán, C.; Varona, L.; Rodríguez, C.; Toro, M.; Sánchez, A.; Pérez-Enciso, M.; et al. Test for positional candidate genes for body composition on pig chromosome 6. Genet. Sel. Evol. GSE 2002, 34, 465–479. [Google Scholar] [CrossRef] [Green Version]
- El Moujahid El, M.; Chen, S.; Jin, S.; Lu, Y.; Zhang, D.; Ji, C.; Yang, N. Association of leptin receptor gene polymorphisms with growth and feed efficiency in meat-type chickens. Poult. Sci. 2014, 93, 1910–1915. [Google Scholar] [CrossRef]
- Bonen, A.; Dyck, D.J.; Ibrahimi, A.; Abumrad, N.A. Muscle contractile activity increases fatty acid metabolism and transport and FAT/CD36. Am. J. Physiol. 1999, 276, E642–E649. [Google Scholar] [CrossRef]
- Brooke, M.H.; Kaiser, K.K. Muscle fiber types: How many and what kind? Arch. Neurol. 1970, 23, 369–379. [Google Scholar] [CrossRef]
- Jin, S.; Moujahid, E.M.E.; Duan, Z.; Zheng, J.; Qu, L.; Xu, G.; Yang, N.; Chen, S. Association of AMPK subunit gene polymorphisms with growth, feed intake, and feed efficiency in meat-type chickens. Poult. Sci. 2016, 95, 1492–1497. [Google Scholar] [CrossRef] [PubMed]
- Ono, Y.; Iwamoto, H.; Takahara, H. The relationship between muscle growth and the growth of different fiber types in the chicken. Poult. Sci. 1993, 72, 568–576. [Google Scholar] [CrossRef] [PubMed]
- Kim, J.M.; Lim, K.S.; Ko, K.B.; Ryu, Y.C. Estimation of pork quality in live pigs using biopsied muscle fibre number composition. Meat Sci. 2018, 137, 130–133. [Google Scholar] [CrossRef] [PubMed]
- Burguière, A.C.; Nord, H.; von Hofsten, J. Alkali-like myosin light chain-1 (myl1) is an early marker for differentiating fast muscle cells in zebrafish. Dev. Dyn. Off. Publ. Am. Assoc. Anat. 2011, 240, 1856–1863. [Google Scholar] [CrossRef] [PubMed]
- Aberle, E.D.; Stewart, T.S. Growth of fiber types and apparent fiber number in skeletal muscle of broiler- and layer-type chickens. Growth 1983, 47, 135–144. [Google Scholar] [PubMed]
- Vallejo, D.; Hernández-Torres, F.; Lozano-Velasco, E.; Rodriguez-Outeiriño, L.; Carvajal, A.; Creus, C.; Franco, D.; Aránega, A.E. PITX2 Enhances the Regenerative Potential of Dystrophic Skeletal Muscle Stem Cells. Stem Cell Rep. 2018, 10, 1398–1411. [Google Scholar] [CrossRef] [Green Version]
- Buckingham, M.; Rigby, P.W. Gene regulatory networks and transcriptional mechanisms that control myogenesis. Dev. Cell 2014, 28, 225–238. [Google Scholar] [CrossRef] [Green Version]
- Zhao, H.; He, S.; Wang, S.; Zhu, Y.; Xu, H.; Luo, R.; Lan, X.; Cai, Y.; Sun, X. Two New Insertion/Deletion Variants of the PITX2 Gene and their Effects on Growth Traits in Sheep. Anim. Biotechnol. 2018, 29, 276–282. [Google Scholar] [CrossRef]
- Zhang, S.; Zhao, H.; Lei, C.; Pan, C.; Chen, H.; Lin, Q.; Lan, X. Effects of genetic variations within goat PITX2 gene on growth traits and mRNA expression. Anim. Biotechnol. 2020, 31, 107–114. [Google Scholar] [CrossRef]
- Zhang, S.; Xu, H.; Kang, Z.; Cai, H.; Dang, R.; Lei, C.; Chen, H.; Guo, X.; Lan, X. Bovine pituitary homeobox 2 (PITX2): mRNA expression profiles of different alternatively spliced variants and association analyses with growth traits. Gene 2018, 669, 1–7. [Google Scholar] [CrossRef]
- Jiang, Y.; Tang, S.; Wang, C.; Wang, Y.; Qin, Y.; Wang, Y.; Zhang, J.; Song, H.; Mi, S.; Yu, F.; et al. A genome-wide association study of growth and fatness traits in two pig populations with different genetic backgrounds. J. Anim. Sci. 2018, 96, 806–816. [Google Scholar] [CrossRef] [PubMed] [Green Version]
- Cao, H.; Dong, X.; Mao, H.; Xu, N.; Yin, Z. Expression Analysis of the PITX2 Gene and Associations between Its Polymorphisms and Body Size and Carcass Traits in Chickens. Animals 2019, 9, 1001. [Google Scholar] [CrossRef] [PubMed] [Green Version]
- Cao, H.; Zhou, W.; Tan, Y.; Xu, X.; Mao, H.; Dong, X.; Xu, N.; Yin, Z. Chronological Expression of PITX2 and SIX1 Genes and the Association between Their Polymorphisms and Chicken Meat Quality Traits. Animals 2021, 11, 445. [Google Scholar] [CrossRef] [PubMed]
- Wu, W.; Zuo, B.; Ren, Z.; Hapsari, A.A.; Lei, M.; Xu, D.; Li, F.; Xiong, Y. Identification of four SNPs and association analysis with meat quality traits in the porcine Pitx2c gene. Sci. China. Life Sci. 2011, 54, 426–433. [Google Scholar] [CrossRef] [Green Version]
- Pandey, S.N.; Cabotage, J.; Shi, R.; Dixit, M.; Sutherland, M.; Liu, J.; Muger, S.; Harper, S.Q.; Nagaraju, K.; Chen, Y.W. Conditional over-expression of PITX1 causes skeletal muscle dystrophy in mice. Biol. Open 2012, 1, 629–639. [Google Scholar] [CrossRef] [Green Version]
- Li, J.; Lee, M.; Davis, B.W.; Lamichhaney, S.; Dorshorst, B.J.; Siegel, P.B.; Andersson, L. Mutations Upstream of the TBX5 and PITX1 Transcription Factor Genes Are Associated with Feathered Legs in the Domestic Chicken. Mol. Biol. Evol. 2020, 37, 2477–2486. [Google Scholar] [CrossRef]
- Domyan, E.T.; Kronenberg, Z.; Infante, C.R.; Vickrey, A.I.; Stringham, S.A.; Bruders, R.; Guernsey, M.W.; Park, S.; Payne, J.; Beckstead, R.B.; et al. Molecular shifts in limb identity underlie development of feathered feet in two domestic avian species. eLife 2016, 5, e12115. [Google Scholar] [CrossRef]
- Sabina, R.L.; Ogasawara, N.; Holmes, E.W. Expression of three stage-specific transcripts of AMP deaminase during myogenesis. Mol. Cell. Biol. 1989, 9, 2244–2246. [Google Scholar] [CrossRef]
- Iuliano, R.; Trapasso, F.; Le Pera, I.; Schepis, F.; Samà, I.; Clodomiro, A.; Dumon, K.R.; Santoro, M.; Chiariotti, L.; Viglietto, G.; et al. An adenovirus carrying the rat protein tyrosine phosphatase eta suppresses the growth of human thyroid carcinoma cell lines in vitro and in vivo. Cancer Res. 2003, 63, 882–886. [Google Scholar]
- Wei, C.B.; Wang, J.Q.; Chen, F.Y.; Niu, H.; Li, K. DNA sequence polymorphism within the bovine adenosine monophosphate deaminase 1 (AMPD1) is associated with production traits in Chinese cattle. Genet. Mol. Res. GMR 2015, 14, 1025–1033. [Google Scholar] [CrossRef]
- Wang, L.; Mo, X.; Xu, Y.; Zuo, B.; Lei, M.; Li, F.; Jiang, S.; Deng, C.; Xiong, Y. Molecular characterization and expression patterns of AMP deaminase1 (AMPD1) in porcine skeletal muscle. Comp. Biochem. Physiol. Part B Biochem. Mol. Biol. 2008, 151, 159–166. [Google Scholar] [CrossRef] [PubMed]
- Yam, J.W.; Tse, E.Y.; Ng, I.O. Role and significance of focal adhesion proteins in hepatocellular carcinoma. J. Gastroenterol. Hepatol. 2009, 24, 520–530. [Google Scholar] [CrossRef] [PubMed]
- Butterfield, R.J.; Foley, A.R.; Dastgir, J.; Asman, S.; Dunn, D.M.; Zou, Y.; Hu, Y.; Donkervoort, S.; Flanigan, K.M.; Swoboda, K.J.; et al. Position of glycine substitutions in the triple helix of COL6A1, COL6A2, and COL6A3 is correlated with severity and mode of inheritance in collagen VI myopathies. Hum. Mutat. 2013, 34, 1558–1567. [Google Scholar] [CrossRef] [PubMed] [Green Version]
- Ho Duy, B.; Zhytnik, L.; Maasalu, K.; Kändla, I.; Prans, E.; Reimann, E.; Märtson, A.; Kõks, S. Mutation analysis of the COL1A1 and COL1A2 genes in Vietnamese patients with osteogenesis imperfecta. Hum. Genom. 2016, 10, 27. [Google Scholar] [CrossRef] [PubMed] [Green Version]
- Kos, K.; Wilding, J.P. SPARC: A key player in the pathologies associated with obesity and diabetes. Nat. Rev. Endocrinol. 2010, 6, 225–235. [Google Scholar] [CrossRef]
- Matsuo, Y.; Tanaka, M.; Yamakage, H.; Sasaki, Y.; Muranaka, K.; Hata, H.; Ikai, I.; Shimatsu, A.; Inoue, M.; Chun, T.H.; et al. Thrombospondin 1 as a novel biological marker of obesity and metabolic syndrome. Metab. Clin. Exp. 2015, 64, 1490–1499. [Google Scholar] [CrossRef] [Green Version]
- Lawler, J. The functions of thrombospondin-1 and-2. Curr. Opin. Cell Biol. 2000, 12, 634–640. [Google Scholar] [CrossRef]
- Järvinen, T.A.; Prince, S. Decorin: A Growth Factor Antagonist for Tumor Growth Inhibition. BioMed Res. Int. 2015, 2015, 654765. [Google Scholar] [CrossRef] [Green Version]

Publisher’s Note: MDPI stays neutral with regard to jurisdictional claims in published maps and institutional affiliations. |
© 2022 by the authors. Licensee MDPI, Basel, Switzerland. This article is an open access article distributed under the terms and conditions of the Creative Commons Attribution (CC BY) license (https://creativecommons.org/licenses/by/4.0/).