Abstract
Salsola ferganica is a natural desert herbaceous plant in the arid area of western and northwestern China. Because of its salt tolerance and drought resistance, it is of great significance in desert afforestation and sand-fixing capacity. There has been much research on the genes involved in plants under desert stresses in recent years. The application of the best internal reference genes for standardization was a critical procedure in analyzing the gene expression under different types. Even so, the reference gene has not been reported in the application of gene expression normalization of S. ferganica. In this study, nine reference genes (TUA-1726, TUA-1760, TUB, GAPDH, ACT, 50S, HSC70, APT, and U-box) in S. ferganica were adopted and analyzed under six different treatments (ABA, heat, cold, NaCl, methyl viologen (MV), and PEG). The applicability of candidate genes was evaluated by statistical software, including geNorm, NormFinder, BestKeeper, and RefFinder, based on their stability values in all the treatments. These results indicated that the simultaneous selection of two stable reference genes would fully standardize the optimization of the normalization research. To verify the feasibility of the above internal reference genes, the CT values of AP2/ERF transcription factor family genes were standardized using the most (ACT) and least (GAPDH) stable reference genes in S. ferganica seedlings under six abiotic stresses. The research showed that HSC70 and U-box were the most appropriate reference genes in ABA stressed samples, and ACT and U-box genes were the optimal references for heat-stressed samples. TUA-1726 and U-box showed the smallest value in gene expression levels of cold treatment. The internal reference groups of the best applicability for the other samples were U-box and ACT under NaCl treatment, ACT and TUA-1726 under MV stress, HSC70 and TUB under PEG treatment, and ACT in all samples. ACT and U-box showed higher stability than the other genes based on the comprehensive stability ranking of RefFinder, as determined by the geometric mean in this study. These results will contribute to later gene expression studies in other closely related species and provide an important foundation for gene expression analysis in S. ferganica.
1. Introduction
Chenopodiaceae is one of the largest families of angiosperms. Because of its tolerance to drought, salt, and cold, Chenopodiaceae plants can be found in warm and cold zones, semiarid and saline alkaline areas, and the Gobi Desert in Xinjiang, Gansu, and Qinghai provinces, and Chenopodiaceae plants are mostly halophytic or xerophytic [1]. To date, 184 species of Chenopodiaceae [2] belonging to 38 genera have been found in China. Salsola ferganica is an annual herb of Chenopodiaceae that has the characteristics of salt tolerance, drought tolerance, and alkaline tolerance. In the process of seed germination and seedling establishment, external environmental factors such as cold, heat, and salt play an important role. Because S. ferganica plants have lived in harsh environments for a long time, they have evolved some morphological and physiological adaptations for survival [3]; for example, the leaves are fuzzy, and the seeds are spiral-shaped and have wings. The characteristics of the plant have very important ecological and scientific research value for the restoration of desert vegetation and the study of stress resistance mechanisms [4]. This unique adaptation to the desert environment may play an indispensable part in the expression of some functional genes. Therefore, it is particularly important to screen for stress-tolerance genes at the transcriptome level.
qRT-PCR is an experimental means used to determine the levels of specific products by continuously detecting the change in the fluorescence signal during PCR index amplification, and we can infer the initial amount of the target gene product according to this method. This technology not only realizes both qualitative and quantitative results but also greatly improves the specificity, sensitivity, and accuracy of gene expression detection compared with ordinary PCR [5,6]. This technique is also widely used in gene expression research because it can effectively solve the contamination problem of ordinary PCR. Nevertheless, the data of qRT-PCR are inevitably affected by many reasons, including the integrity of the cDNA template, primer specificity, annealing temperature [7,8,9]. The internal reference gene used in the normalization method can correct the experimental error. Until now, few studies on gene expression in S. ferganica have yielded only a few genes as reference genes for normalizing experimental data. Accordingly, it is particularly significant to choose the most stable and active internal reference genes.
Stable expression is the basic principle of screening internal reference genes in any environment [10], such as under different treatments, within different structures, and across different growth phases. Hence, the screening of appropriate reference genes for the study of new species is the beginning of the application of qRT-PCR in the experimental scheme [11]. Because the protein product encoded by a housekeeping gene is necessary to maintain the basic function of cells [12,13], internal reference genes are mainly screened from housekeeping genes due to their stable expression in various samples. At present, several statistical software programs, such as geNorm [14], NormFinder [15], BestKeeper [16], and RefFinder, have also been designed to judge the applicability of the internal housekeeping genes by use of normalization data. These software programs use different calculation methods, varying greatly in the stability rank of candidate genes. Therefore, we referred to the geometric mean method to calculate the comprehensive ranking of the stability of each candidate gene to select the best reference gene.
In this article, we selected nine internal reference genes commonly used for stability evaluation. These genes are α-tubulin (TUA-1726 and TUA-1760), U-box domain-containing protein (U-box), actin (ACT), glyceraldehyde-3-phosphate dehydrogenase (GAPDH), heat shock protein 70 (HSC 70), adenine phosphoribosyl transferase-like protein (APT), β-tubulin (TUB), and 50S ribosomal protein (50S). The stable expression of these genes under different stresses (ABA, drought, NaCl, heat, cold, and methyl viologen (MV)) was analyzed, and the stability of the internal reference genes in S. ferganica was comprehensively evaluated by geNorm, NormFinder, BestKeeper, and RefFinder software. In addition, to further verify the suitability of these genes as internal reference genes, we selected the most stable internal reference gene (Actin) and the least stable internal reference gene (GAPDH) in S. ferganica and provided detailed expression research of eight AP2/ERF TF family genes as an example for data normalization. Thus, this study provides useful values and beginning points for screening internal reference genes for expression research using the qRT-PCR method in S. ferganica and lays a theoretical foundation for further research on desert plants.
2. Materials and Methods
2.1. Plant Materials and Treatments
In this paper, the seeds of S. ferganica were collected near group 103, Wujiaqu, Xinjiang (44°19′ N, 86°57′ E; 429 mH). S. ferganica seeds of the same size with full grains and no diseases and pests were cultured in a 9 cm diameter Petri dish covered with two layers of filter paper; 8 mL of distilled water was added to each dish. Then, the S. ferganica seeds were cultivated under 16 h/8 h (light /dark) and 25 °C/18 °C for 5 days in artificial climate equipment (RGX400E, Taisite, Tianjin, China). Seed germination was observed every day.
Under the cold- and heat-treated samples, the S. ferganica seedlings were cultivated in 4 or 38 °C, respectively. For salt treatment, S. ferganica seedlings were treated with 100 mM/L NaCl (>99.5%, 7647-14-5, Jinhuada, Guangzhou, China). For ABA (≥98%, 21293-29-8, Solarbio, Beijing, China) and MV (≥98%, 1910-42-5, Macklin, Shanghai, China) treatment, S. ferganica seedlings were grown under 100 μmol/L of either chemical with a 16/8 h day/night light cycle, and groups of seedlings were placed in PEG6000 (10%) (25322-68-3, Kermel, Tianjing, China) solutions in the growth chamber for the drought treatment. All stressed S. ferganica seedlings were sampled at 4 time points: 0, 1, 3, and 6 h after treatment. All materials were quickly frozen in liquid nitrogen and then stored at −80 °C for RNA extraction and gene expression analysis. Three biological replicates were set for each treatment, and each replicate included at least six seedlings.
2.2. RNA Extraction and cDNA Synthesis
In this chapter, the samples stored in liquid nitrogen were reduced to a fine powder. Total RNA from all samples was extracted by an Omega Total RNA Extraction Kit (Omega Bio-Tek, Beijing, China), and the RNA samples were quantified by an ultramicrospectropho-tometer (EpochTM, Bio-Tek, Santa Clara, CA, USA). The absorbance at 260/280 nm was 1.8–2.2, and the integrity of RNA was assessed by 1% agarose gel electrophoresis. The extracted RNA was inverted into first-strand cDNA according to EasyScript® First-Strand cDNA Synthesis Super-Mix (TransGen Biotech, Beijing, China), and the reverse cDNA was diluted 10× for subsequent experiments and refrigerated at −20 °C for standby.
2.3. PCR Primer Design
In a previous study, transcriptome data were analyzed, and internal reference gene sequences were obtained. All the internal reference gene primers were designed with Primer 5.0 software [17]. The primers were synthesized by Shanghai Sangon Biotech Company and stored at 4 °C.
2.4. Detection of Amplification Efficiency and Selection of Reference Genes
According to previous studies, a total of 9 housekeeping genes (TUA-1726, TUA-1760, TUB, GAPDH, ACT, 50S, HSC 70, APT, U-box) were selected for analysis of expression stability under abiotic stress in S. ferganica. The amplification products were diluted with stock solution 10, 102, and 103 times for qRT-PCR amplification. All data were plotted along a standard curve, the amplification efficiency of primers was analyzed. The original CT value was used to calculate primer amplification efficiency (E) and correlation coefficient (R2) respectively with the following formula: E = 10−1/slope − 1 [18], where the slope was derived from the regression equation and was calculated using Excel linear regression reference genes [19]. The primer data of the candidate housekeeping genes are given in Table 1.

Table 1.
Analysis of S. ferganica internal reference genes, primer information, and PCR amplification data.
2.5. qRT-PCR Analysis
qRT-PCR was performed according to the requirements of the 2 × SYBR Green qPCR mix reagent Manual of Beijing Aidlab Biotechnologies Company (Aidlab, Beijing, China). The fluorescence quantitative reaction of 9 internal reference genes was completed on a LightCycler® 96 fluorescence quantitative instrument (LightCycler® 96 Instrument, Roche, IN, USA) with a 20 μL reaction system as follows: 2 × SYBR qPCR Mix 12.5 μL; ddH2O 10.5 μL; reverse primers and forward primers, respectively, 0.5 μL; and cDNA template, 1 μL. Each sample was tested by the three-step method in the PCR cycle. The experimental system was as follows: predenaturation at 94 °C for 30 s; denaturation at 94 °C for 20 s; annealing at 60 °C; and extension for 30 s at 72 °C over 40 cycles. After the completion of the reaction system and program, the data reading was automatically completed by fluorescence quantitative PCR.
2.6. Gene Expression Stability Analysis
All CT values gained from qRT-PCR were used to evaluate the stable values of all selected genes using the above three software (geNorm, NormFinder, and BestKeeper), and combined with the analysis results, the comprehensive ranking of candidate genes in different treatments was calculated by RefFinder according to the formula Q = 2−ΔCT (ΔCT = CTmax − CTmin in samples). GeNorm calculates the expression stability by analyzing the Q value after input processing. An M value < 1.5 is considered within the range of stability, and the stability becomes increasingly stable with a decrease in the M value; conversely, the gene stability decreases with an increase in the M value. The principle of NormFinder analysis is similar to the principle of geNorm. Q value is used for calculation. Similarly, as the value decreases, the relative expression level of genes becomes more stable. In NormFinder, the linking of the samples set between intragroup and intergroup variations was applied to the calculation of gene expression stability. The CT value of the original data was directly used in the best keeper analysis to obtain the mean and standard deviation. Finally, the above data were compared and analyzed through the RefFinder website to obtain the most stable internal reference gene.
2.7. Stability Evaluation of Candidate Genes
To evaluate the applicability of the selected optimum gene, eight AP2/ERF TF family genes that play an indispensable role in plant hormone signals and the regulation of gene expression related to biological and abiotic stress [20,21] served as indicator genes. For the salt stress treatments, the seedlings were grown in pots under 0, 100, 200, 300, and 400 mmol/L NaCl for 0, 4, or 24 h. These procedures, total RNA extraction, cDNA synthesis, transcription factor family gene primer design and verification, and qRT-PCR analysis of expression, were performed using processed samples. Three technical and biological replicates were carried out in this study.
3. Results
3.1. Primer Specificity and Amplification Efficiency of Candidate Reference Genes
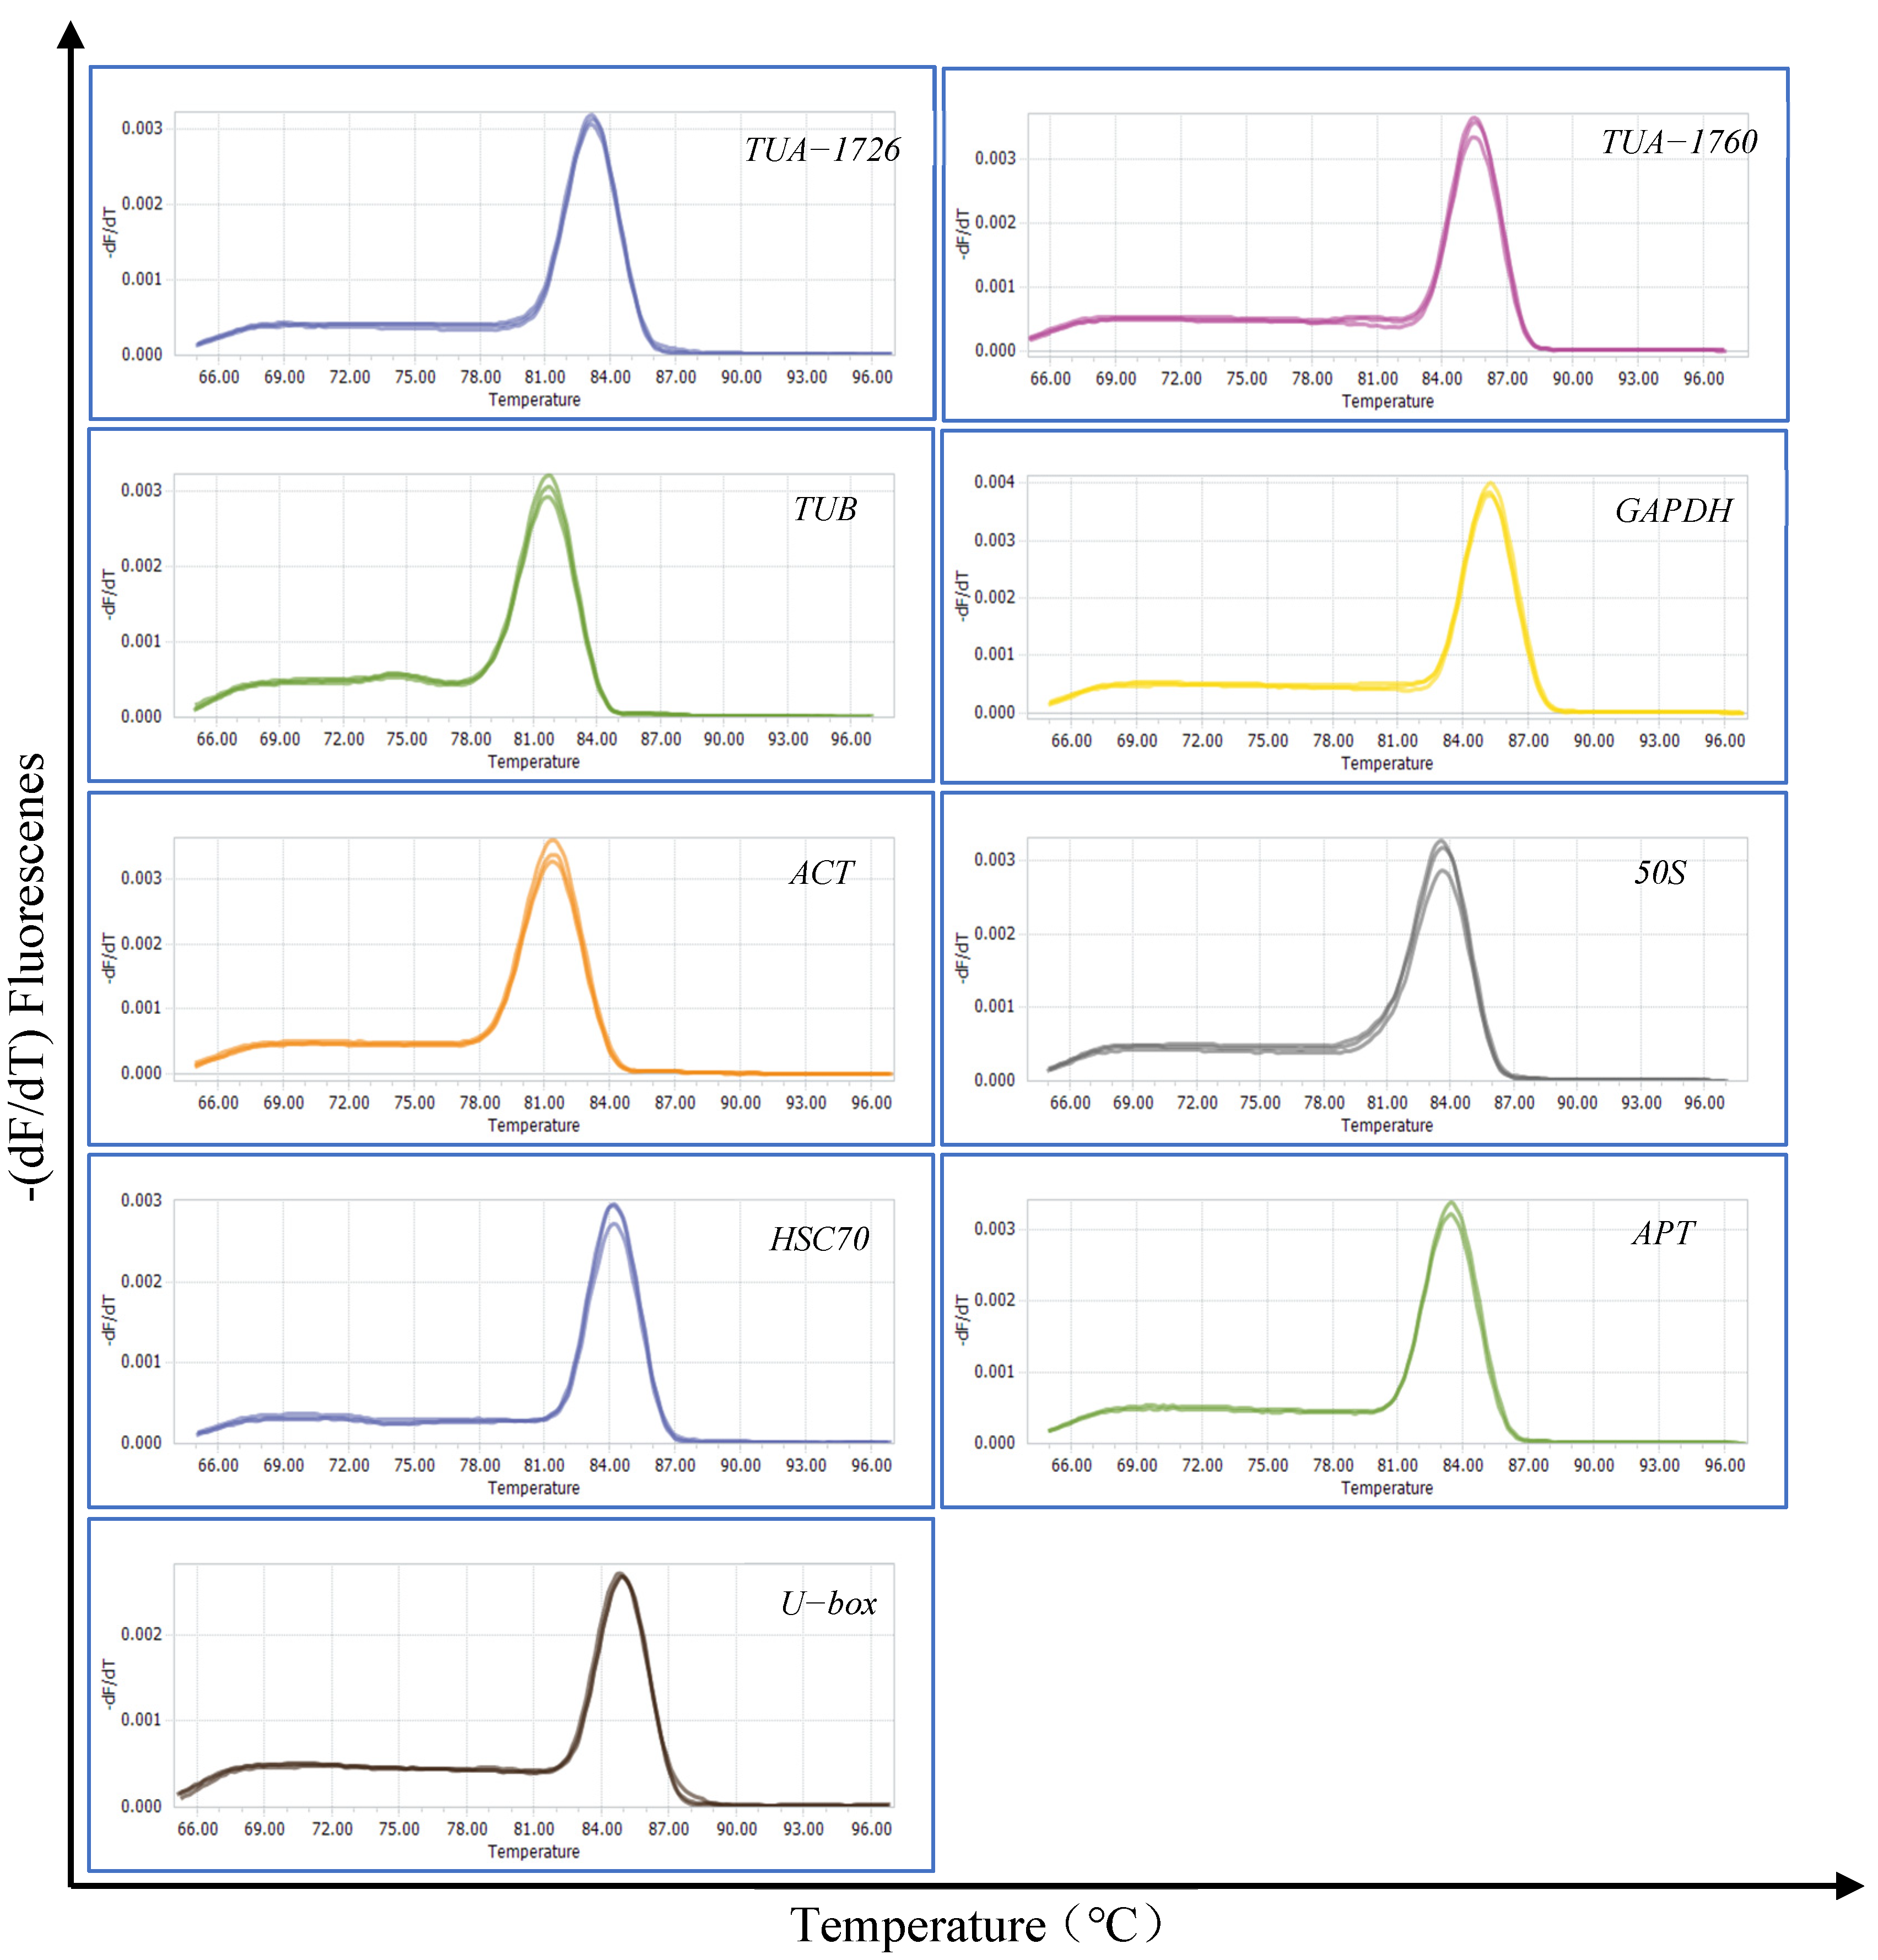
Total RNA was quantified by gel electrophoresis and the OD260/280 value. The successful extraction was that two complete and clear RNA bands (28S and 18S) was displayed, and the OD260/280 value was between 2.0 and 2.2. Nine genes (TUA-1726, TUA-1760, TUB, GAPDH, ACT, 50S, HSC 70, APT, and U-box) were selected and used as candidate reference genes. Data about these nine candidate genes and primers are presented in Table 1. The specificity of the primers was verified by agarose gel (1%) electrophoresis and dissolution curves (Figure S1). The gel electrophoresis showed that all primers of the nine reference genes showed a single and bright band, and the melting curve analysis also showed a single peak (Figure 1). The dissolution curves showed an acceptable amplification efficiency range of 90–110%, and the correlation coefficient (R2) ranged from 0.99 to 1 (Table 1). The above results meet the requirements of candidate reference gene screening.
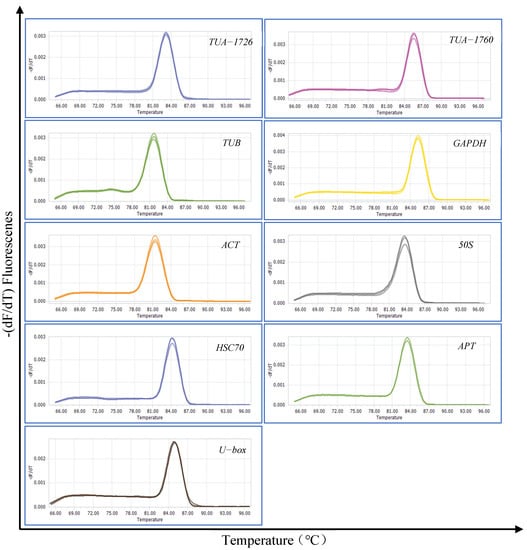
Figure 1.
Melting curves of 9 candidate reference genes.
3.2. Relative Expression of Candidate Genes in Different Treatments
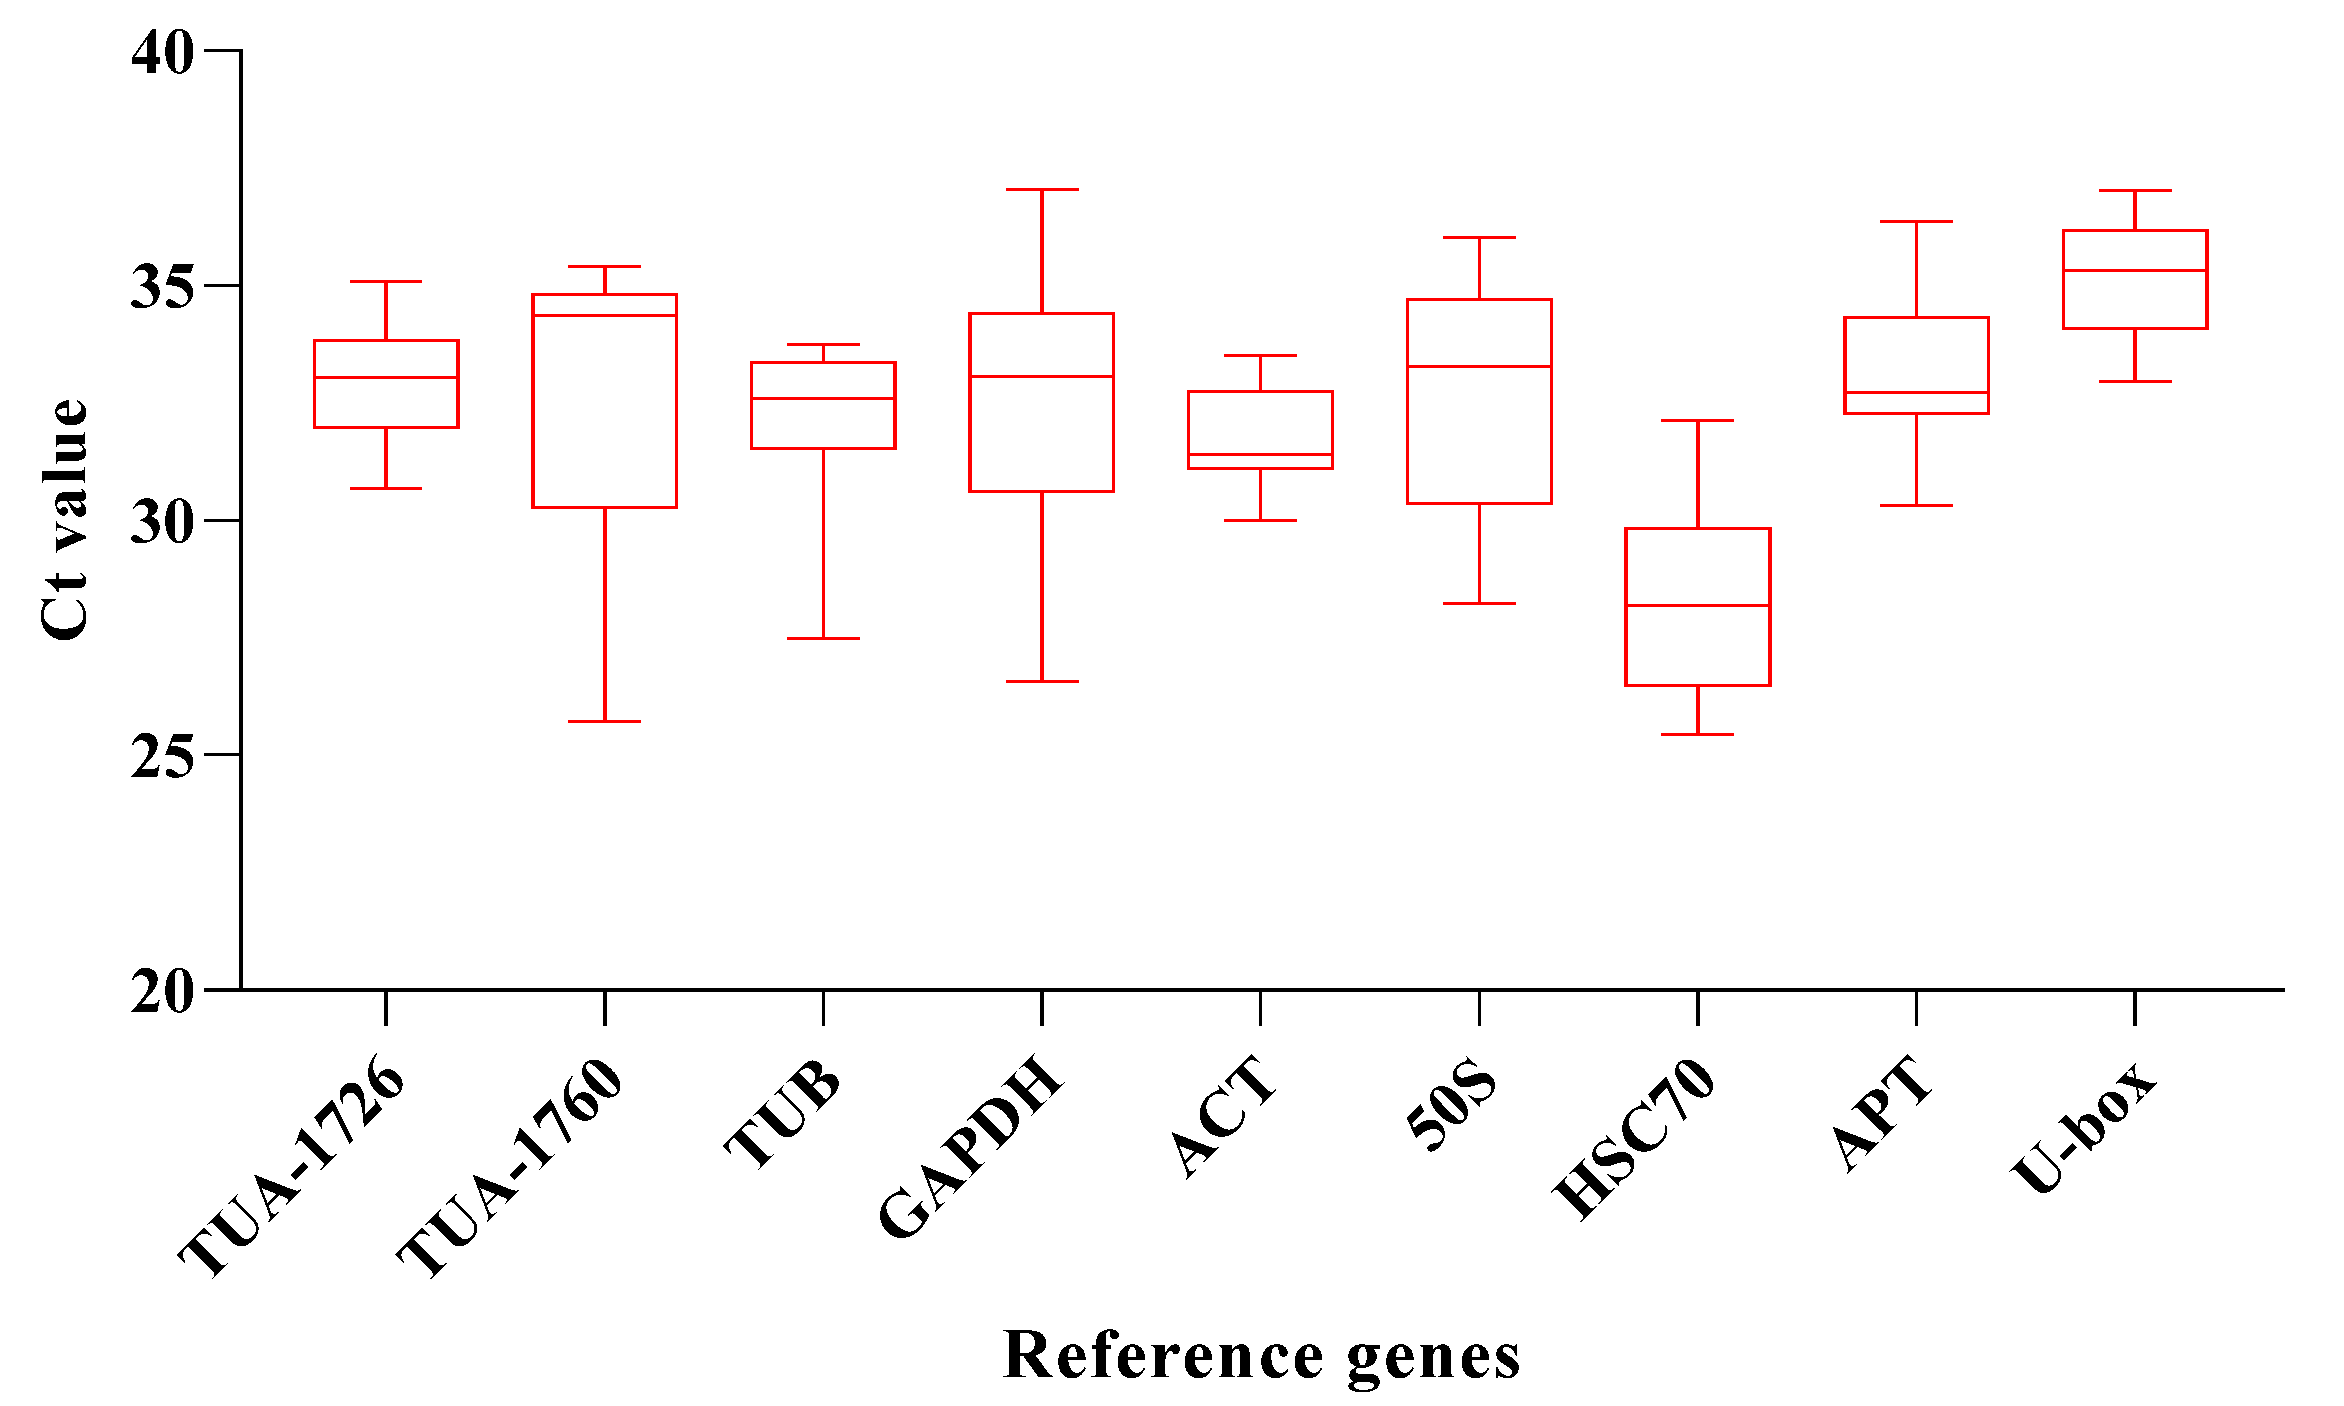
qRT-PCR assays were used to measure the transcriptional abundance of the 9 housekeeping genes across 24 samples, including six abiotic stress conditions (ABA, drought, NaCl, heat, cold, and MV) and 4 different time treatments (0, 1, 3, and 6 h). The result pointed out that the average Ct values of these housekeeping genes were between 26 and 36, with most of them ranging from 30 to 33 in all plant samples. The expression of HSC70 was the highest in the control, and the Ct value was 26.46. Accordingly, the gene abundance level was also the highest. For candidate genes, the average Ct value was between 28 and 35, and the Ct value of U-box is the highest, reaching 35.04, which means that it has the lowest expression level than other internal reference genes. The average Ct of HSC70 was the lowest, only 28.04, which means that the expression of HSC70 is the highest compared with other internal reference genes (Figure 2). The uneven results also indicated that there was no significant expression regularity of different reference genes under different stresses, which needs to be further evaluated by stability analysis software.
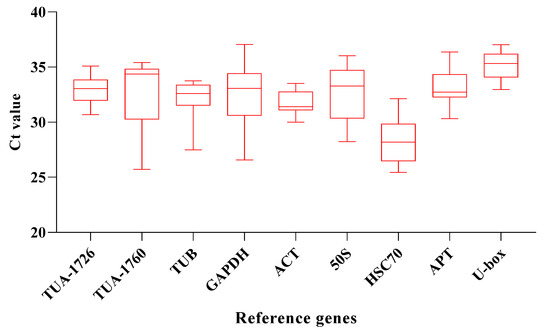
Figure 2.
Average CT value of 9 candidate genes. The line across the box represents the median. The boxpoints out the 25th and 75th percentiles. Whiskers represent the maximum and minimum values across all samples.
3.3. Stability Evaluation of Candidate Genes
In this paper, the gene expression of S. ferganica was quantified by qRT-PCR under six stresses (i.e., ABA, drought, NaCl, heat, MV, and cold). Then, four softwares (geNorm, NormFinder, BestKeeper, and RefFinder) were calculated to analyze the size of CT value, and the most suitable internal reference genes were further selected.
3.3.1. geNorm Analysis
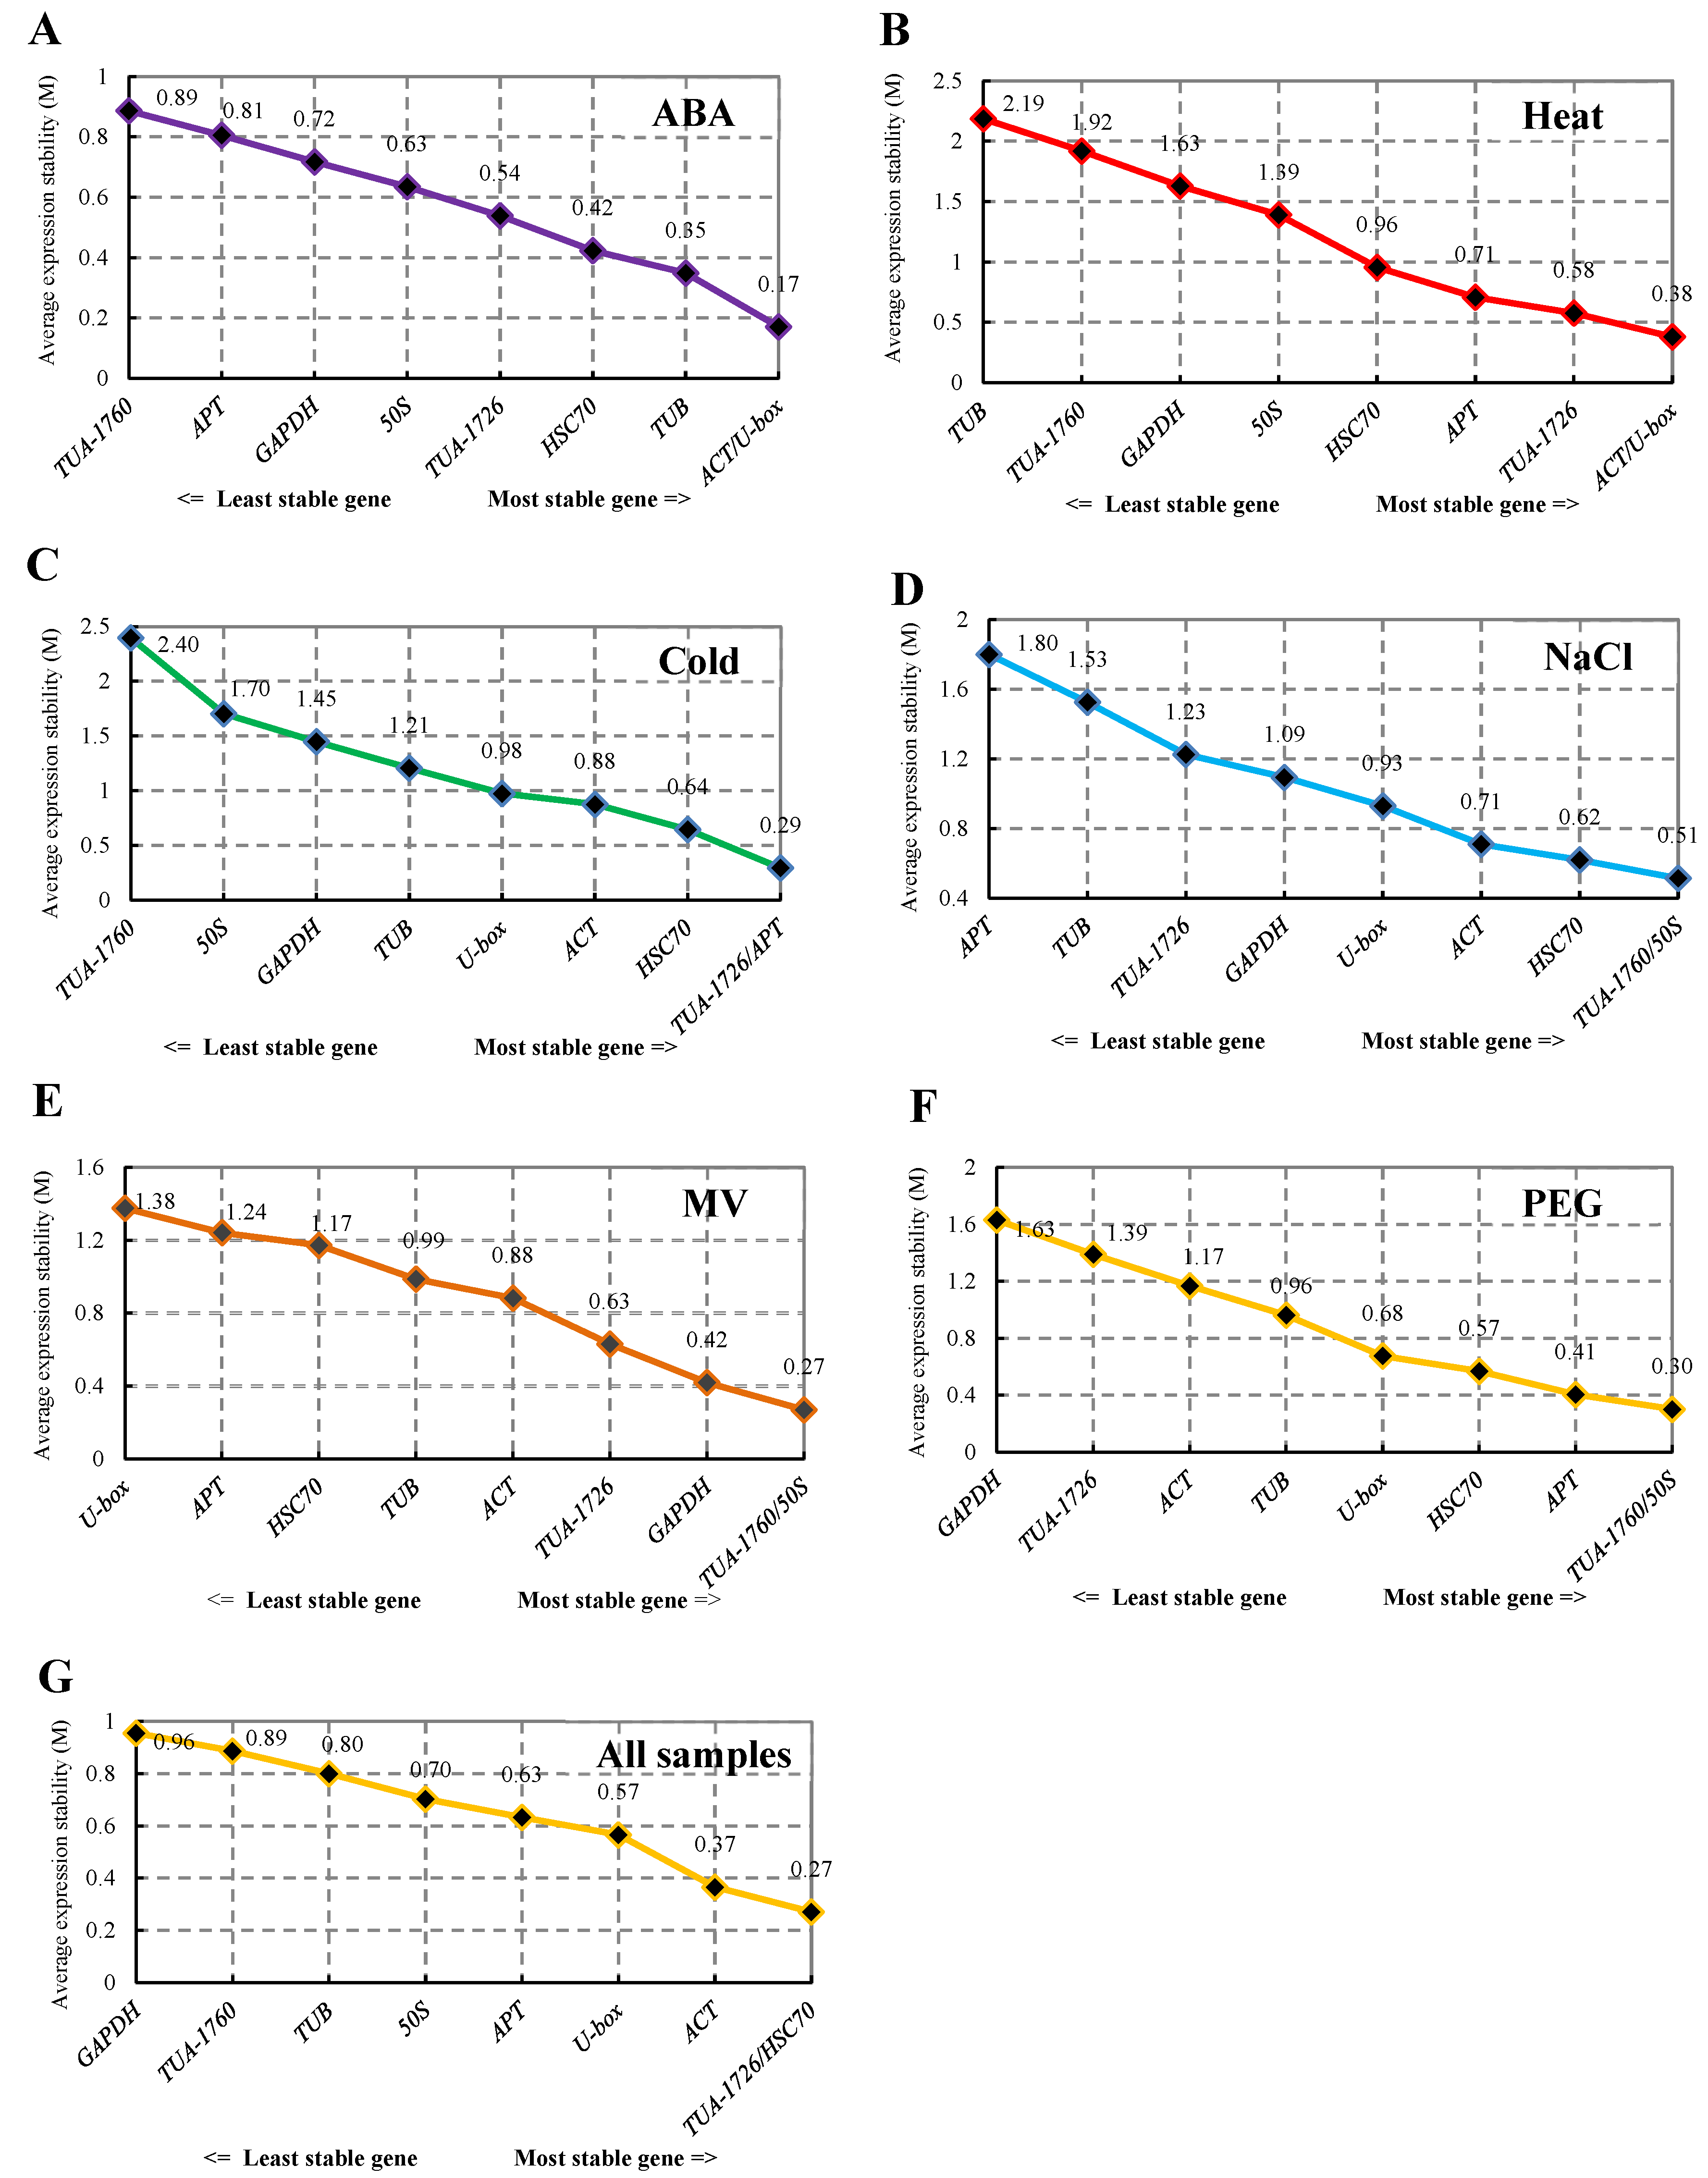
The expression stability of the nine housekeeping genes was analyzed using geNorm software. The value of M was the standard for ranking the expression stability of screened genes. With the increase in M value, the gene showed increasingly poor stability, and the average pairwise variation is for each candidate gene compared with all other genes [14]. The stability sequencing of internal reference genes of S. ferganica was calculated by geNorm under six abiotic stresses (Figure 3). As illustrated in Figure 3, the M values from six treatments and all samples were arranged from large to small. ACT and U-box (M = 0.17) had lower M values than other genes. thus, they were the most stable under ABA treatment. The most stable genes were ACT and U-box under heat treatment, which was the same as ABA treatment. While TUB was the most unstable, with an M value of 2.19. As the cold stress group, the most stable internal reference genes were TUA-1726 and APT, with an M value of 0.08. The stability of TUA-1760 and 50S was the highest in the NaCl, MV, and PEG treatments, but APT, U-box, and GAPDH were analyzed as the internal reference genes with the worst stability for these three treatments. When all 24 samples were analyzed together, the combination of TUA-1726 and HSC70 was the smallest M value, while GAPDH was the most unstable (Figure 3).
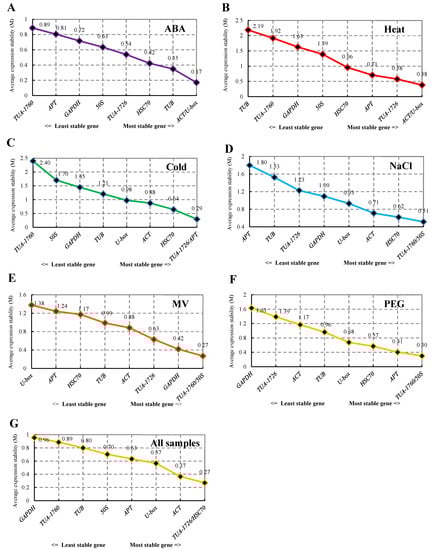
Figure 3.
Expression stability values of 9 internal reference genes analyzed by geNorm software. (A) Internal reference genes in the ABA treatment group. (B) Internal reference genes of heat-treated samples. (C) Stability ranking of internal reference genes in all samples treated with cold. (D) Internal reference genes from NaCl-treated samples. (E) Reference genes derived from MV. (F) PEG-treated samples representing drought treatment. (G) All samples used in this study.
In addition, screening the number of the most suitable reference genes needed for experimental standardization, the best-paired variation value (Vn/Vn + 1) [14] was analyzed using geNorm. This calculation method is calculated for selecting the number of genes by standardized gene expression. If the value exceeds 0.15, n + 1 is the most appropriate number of internal reference genes. Such as, the left and right values of the ABA treatment group were lower than 0.15, which showed that the two candidate housekeeping genes standardized gene expression (Figure 4).
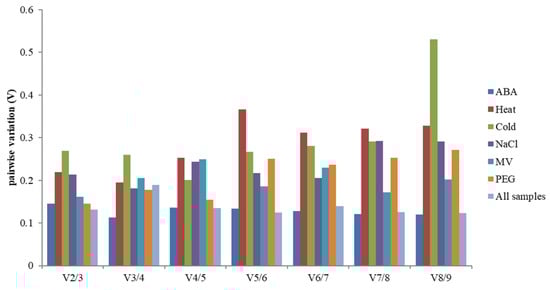
Figure 4.
The V value analysis of 9 candidate genes under abiotic stress by geNorm. Pairwise variation (Vn/Vn + 1) analysis of 9 candidate reference genes analyzed in six sample subsets.
3.3.2. NormFinder Analysis
NormFinder software is a basic application plug-in unit installed in Microsoft Excel, which can screen the internal reference gene with the best stability among all candidate genes; this software package analyses the stability value of expression based on the estimation of intragroup variation and intergroup variation [22] and sorts the candidate genes. Similar to geNorm software, lower stability values indicate a more appropriate reference gene [23]. The stability values of each internal reference gene in each stress group are shown in Table 2.
Table 2.
Expression stability ranking of all candidate genes under 6 abiotic stresses on NormFinder.
In ABA-treated samples, the two most suitable genes (HSC70 and TUA-1726) and the least stable genes (APT and TUA-1760) were identified in NormFinder. Among the heat-treated samples, ACT had the lowest stable value, with a value of 0.19, which indicated that it expresses the greatest stability at the expression level. For the cold stress samples, TUA-1726 is the most suitable internal reference gene, and TUA-1760 was ranked as the most active gene. U-box was calculated as the optimal internal reference gene under NaCl stress, while the stable value of APT is the largest of all genes. About the MV treatment, ACT was still in the top position; on the contrary, U-box was the most active. Moreover, TUB and HSC70 were recognized as the most suitable candidate genes, while GAPDH was the least stably expressed gene in PEG treatments. For all stress samples, ACT, TUA-1726, and HSC70 were calculated to be the three stable expression genes. On the contrary, GAPDH was the most unstable, which was the same as the conclusion of geNorm above. This part concludes that ACT was the optimum reference gene compared with all other genes. This result further verifies the stability of ACT, and GAPDH was likely the least stable housekeeping gene.
3.3.3. BestKeeper Analysis
BestKeeper analysis the original CT values of all samples and ranks the stability of candidate housekeeping genes by determining the SD and CV values of each candidate gene [24]. The stability of gene expression changed inversely with the SD value. The results of the stability analysis of different treated samples from highest to lowest are shown in Table 3. Accordingly, the U-box was the best reference gene under ABA, heat, and cold stresses, and the lowest CV ± SD values of the three treatments were 1.434 ± 0.507, 1.842 ± 0.646, and 1.484 ± 0.53, respectively. The sequence of gene expression stability in the NaCl treatment was TUA-1726 > U-box > TUB > ACT > APT > TUA-1760 > HSC70 > GAPDH > 50S. TUA-1726 TUA was the housekeeping gene with the lowest SD value, and 50S was the most unstable gene. HSC70 was the best housekeeping gene under MV stress and PEG stress. The order of gene stability across all samples was U-box > APT > TUB > ACT > HSC70 > TUA-1726 > 50S >TUA-1760 > GAPDH. In conclusion, the optimum reference gene calculated for all the above samples was likely U-box. Because the above results are heterogeneous under different treatments, this cannot be taken as the final result. Therefore, additional analytical tools should be used for normalization.
Table 3.
Stability ranking of all sample genes calculated by BestKeeper software.
3.3.4. RefFinder Analysis
In the above analyses, we analyzed the optimum internal reference genes for different treatments based on the above three software commonly, but the analysis ranking of the three softwares was different. To standardize the analysis and to verify whether the software produces heterogeneous results, we used the RefFinder website to comprehensively compare and analyze the data from the above three software programs and rank the stability of all genes through comprehensive analysis. The gene with the highest gene expression stability was ACT for heat, MV, and all samples. Insides, the most stable internal reference gene in the other samples was HSC70 (2.11) under ABA treatment, TUA-1726 (1.41) under cold stress, U-box (2.11) under NaCl treatment, and HSC70 (1.68) in PEG stress samples (Figure 5). The above results also point out that a single reference gene in the experiment could not standardize the gene expression of plants in all environments and could only be used for one or more abiotic stresses.
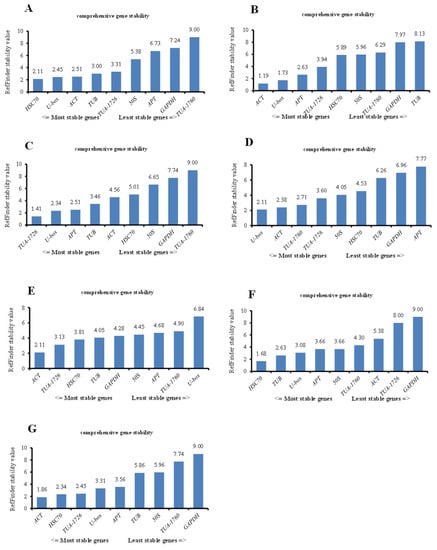
Figure 5.
Stability ranking of all reference genes in different treatments of S. ferganica calculated by the RefFinder in all samples. (A) Internal reference genes in the ABA treatment group. (B) Internal reference genes in heat-treated samples. (C) Stability ranking of internal reference genes in all samples treated with cold. (D) Internal reference genes from NaCl-treated samples. (E) Reference genes derived from MV. (F) PEG-treated samples representing drought treatment. (G) All samples used in this study.
Second, we integrated the sequence of the housekeeping genes into RefFinder with different treatments, and the most suitable internal reference gene was selected based on the geometric mean (Table 4). In all treatments, the lowest comprehensive ranking was the best internal reference gene, while the highest ranking was the most unstable. Therefore, ACT (2.857) was the best housekeeping gene, followed by U-box (3.286) and HSC70 (3.571). GAPDH was the least stable of candidate gene expression, and the geometric mean of its comprehensive ranking was 7.857 (Table 4).
Table 4.
Expression stability ranking of 9 candidate genes in all stressed samples analyzed using the geometric mean method in RefFinder.
3.4. Validation of the Best- and Worst-Ranked Reference Genes
To verify the selection of the optimal housekeeping genes, the expression patterns of eight AP2/ERF transcription factor family genes were changed with 0, 100, 200, 300, and 400 mmol/L NaCl stress treatments for 0, 4, and 24 h. In this article, the most stable and active housekeeping genes from all stress sample sets, ACT and GAPDH, were used for normalization. Except for AP2-1982, the expression patterns of the other AP2 genes were similar, and all genes showed the highest expression when treated with 400 mmol/L NaCl for 4 h. When normalized to GAPDH, the expression pattern was obviously underestimated, and the highest expression was found with 300 mmol/L NaCl treatment for 4 h. Therefore, the gene expression patterns in AP2/ERF transcription factor family genes differed greatly from those of the reference genes (Figure 6). Hence, screening an appropriate reference gene was the first step in the comprehensive research of stress-tolerance genes.
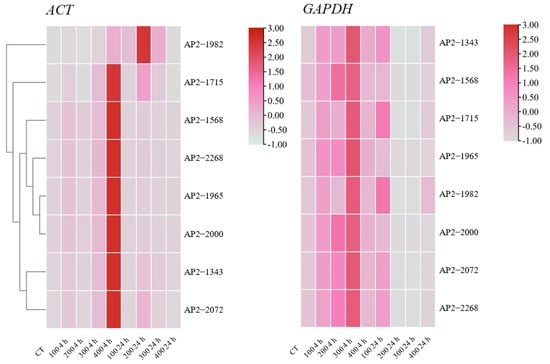
Figure 6.
Expression heatmaps of eight transcription factors in S. ferganica under NaCl stress. The best (ACT) and worst (GAPDH) reference genes were used to normalize the expression data. cDNA and the above gene expression analysis were the same samples in this experiment. Samples were collected from five-day-old seedlings subjected to 0, 100, 200, 300, and 400 mmol/L NaCl stress after 0, 4, and 24 h of treatment.
4. Discussion
In nature, abiotic stress environment continuously affects the growth and development of plants, such as drought, high temperature, cold and excessive salt in the soil [25]. Desert plants play an irreplaceable ecological role in desert ecosystems because of their salt-alkali tolerance and drought tolerance [26]. S. ferganica is a crucial desert plant, and with the increase in demand, there is a need to comprehensively analyze its expression mechanisms under stress from morphological, physiological, and molecular biological points of view, which will help promote the reproduction of desert plants and the governance of desert areas.
With the increasing interest in research on stress-related genes in desert plants, the demand for new high-throughput technologies such as genomics, transcriptomics, and proteomics has also increased [27,28]. SMRT-seq and qRT-PCR are important tools for determining the expression of stress-related genes and explaining their effectiveness in all stages of growth and development. qRT-PCR is a highly reliable method to verify targeted differential gene expression. Due to its high efficiency and sensitivity at the molecular level, gene expression research is generally carried out by qRT-PCR [29]. However, a stable housekeeping gene is a prerequisite for accurate standardization of expression data by qRT-PCR [30,31]. In most experiments, a single housekeeping gene is currently selected to evaluate qRT-PCR data [32]. However, it is found that using two or more internal references for normalization will produce a more accurate and stable relative expression level. Although several internal reference genes have been used to analyze the expression of related genes in Salsola laricifolia under drought stress, β-actin is the most suitable internal reference gene [33]. However, the storage of internal reference genes under abiotic stress was still insufficient. Therefore, high-throughput sequencing-based transcriptome data from SMRT-seq are essential for meticulously selecting candidate internal reference genes for expression normalization, but this gene expression analysis needs further expression stability verification under relevant environmental stress conditions [10].
The common methods for preliminary screening of housekeeping genes are mainly based on the functions of housekeeping genes, such as participating in protein coding, cell signaling, morphogenesis, and so on [34]. For instance, ACT and TUB genes are mainly involved in the main components of the cytoskeleton synthesis; Likewise, GAPDH, EF-1α, and UBQ genes can play significant roles in the material metabolism and life activities of organisms [35]. The internal reference genes should not be limited to ideal states, and their expression levels should be the same across conditions [36]. Subsequent research pointed out that the expression level of the internal reference gene can be affected by the species, environment, physiology, and developmental stage [37]. Thus, no internal reference gene was continuously and stably expressed under all experimental conditions. For instance, genes such as ACT, GAPDH, and U-box are thought to be expressed differently in different species and under different environmental stress [38,39,40]. PP2A and GAPDH are the most suitable internal reference genes in sorghum across different structures and under abiotic stresses [11]. However, the stable expression of GAPDH in all treatment samples was poor in this study (Figure 5, Table 4). Similar results were also verified in Anemone flaccida [41]. In this research, the geNorm results indicated that ACT and U-box were the most stable genes under ABA and heat treatment at the seedling stage, while 50S and TUA-1760 were the optimal internal reference genes under NaCl, MV, and PEG treatment (Figure 3). Therefore, the qRT-PCR data of a species under specific conditions must be standardized using internal reference genes before conducting gene expression research [42].
In this study, samples of S. ferganica from six abiotic stress treatments were collected for screening nine candidate internal reference genes. Several different calculation methods were used to comprehensively analyze the normalization of gene expression data to determine the order of expression stability for internal reference genes under each treatment. The results showed that there were some differences in the expression stability ranking of candidate internal reference genes based on the different calculation methods. After consulting the literature, the analysis results were found to be different under different calculation methods [43,44,45]. Since each method analyzed in the study also has advantages and disadvantages, using only one of these methods is not enough to obtain unbiased results. Therefore, more than three methods are recommended for analysis and calculation. We used the ranking methods of geNorm, NormFinder, BestKeeper, and RefFinder to calculate the geometric average for the final stability consensus ranking in the paper. Based on the comprehensive RefFinder ranking results calculated using the three software tools and the ΔCt method, the combinations of HSC70 and U-box, ACT and U-box, TUA-1726 and U-box, U-box and ACT, ACT and TUA-1726, and HSC70 and TUB were recommended as reference genes for analyses of ABA, heat, cold, NaCl, MV, and PEG, respectively (Figure 5). ACT and U-box were recommended as reference genes for the analyses of all samples together (Table 4). These rankings also confirmed that there were differences in the expression levels of some housekeeping genes in plants based on space-, time-, and environment-dependent patterns. This internal reference gene screening process under multiple culture conditions can be used as a guide for researchers to study desert plants.
AP2/ERF (APETALA 2/ethylene-responsive element binding factor) is a large superfamily of transcription factors in various plants. The expression of AP2/ERF transcription factors can affect the expression of functional genes related to abiotic stress tolerance, such as drought [46], high salt [47], and cold [48]. Two reference genes (ACT and GAPDH) identified in the existing research were used to analyze the expression profile of eight transcription factor genes in S. ferganica (AP2-1982, AP2-1715, AP2-1586, AP2-2268, AP2-1965, AP2-2000, AP2-1343, and AP2-2072). The eight AP2/ERF transcription factor family genes showed different specific expression patterns under standardization with the most stable and active internal candidate genes and showed an increase in expression after salt treatment (Figure 6). This finding indicates that AP2/ERF genes play a vital part in the salt tolerance mechanism of S. ferganica and shows that it is necessary to screen housekeeping genes at the molecular level. The above discussion shows that our research approach is feasible; that is, under a variety of stresses, we used a variety of calculation methods to screen appropriate internal reference genes for a specific species to normalize qRT-PCR data. The appropriate internal reference genes we found in S. ferganica are expected to assist in future gene expression research.
5. Conclusions
We calculated the expression stability of nine candidate genes under six abiotic stresses in this research. Inside, ACT was the best stable internal reference gene for heat and MV treatment; the housekeeping gene that can best be corrected for target gene about ABA stress and PEG stress was HSC70; U-box was the optimal gene among the NaCl treatment samples; the most stable internal reference genes in all samples were ACT and HSC70; the geometric mean was calculated to analyze the comprehensive stability of all internal reference genes. Finally, the most stable internal parameter genes were ACT and U-box. The above was further verified that different treatments should use different endogenous reference genes to standardize the expression level of the gene of interest. In general, the selection of internal reference genes in this study provides a reference for the related plant biochemical and molecular research of S. ferganica under different stress conditions, which will greatly contribute to our exploration of the molecular mechanism of adverse environment tolerance and have important scientific significance for promoting research on desert plants.
Supplementary Materials
The following supporting information can be downloaded at: https://www.mdpi.com/article/10.3390/genes13040571/s1, Figure S1: Primer specificity and amplicon size. Agarose gel electrophoresis (2.0%) shows amplification of a single PCR product of the expected size for 9 genes (Line 1–9: TUA-1726, TUA-1760, TUB, GAPDH, ACT, 50S, HSC 70, APT, and U-box).
Author Contributions
Conceptualization, S.Z. and S.W.; software, S.W.; validation, S.Z. and S.W.; data curation, S.W.; writing—original draft preparation, S.W.; writing—review and editing, S.Z. and S.W; project administration, S.Z.; funding acquisition, S.Z. All authors have read and agreed to the published version of the manuscript.
Funding
This research was funded by the National Natural Science Foundation of China (grant no. 31960333) and Natural Science Foundation of Xinjiang Uygur Autonomous Region (grant no. 2019D01C017).
Institutional Review Board Statement
Not applicable.
Informed Consent Statement
Not applicable.
Data Availability Statement
Not applicable.
Conflicts of Interest
The authors declare no conflict of interest.
References
- Gao, H.B.; Zhang, F.C. Advances in research on the molecular mechanism of plant salinity tolerance and morphological characters of Chenopodiaceae. Biotechnol. Bull. 2008, 4, 22–26. [Google Scholar]
- Du, H.; Zhou, L.G.; Li, C.; Sui, P. Recent studies on the chemistry and bioactivity of Chenopodiaceous plants. Nat. Prod. Res. Dev. 2007, 19, 884–889. [Google Scholar]
- Ma, Y.; Zhang, J.; Li, X.; Zhang, S.; Lan, H. Effects of environmental stress on seed germination and seedling growth of Salsola ferganica (Chenopodiaceae). Acta Ecol. Sin. 2016, 36, 456–463. [Google Scholar] [CrossRef]
- Wang, Y.; Jiang, G.Q.; Han, Y.N.; Liu, M.M. Effects of salt, alkali and salt–alkali mixed stresses on seed germination of the halophyte Salsola ferganica (Chenopodiaceae). Acta Ecol. Sin. 2013, 33, 354–360. [Google Scholar] [CrossRef]
- Wong, M.L.; Medrano, J.F. Real-time PCR for mRNA quantitation. Biotechniques 2005, 39, 75–85. [Google Scholar] [CrossRef]
- Derveaux, S.; Vandesompele, J.; Hellemans, J. How to do successful gene expression analysis using real-time PCR. Methods 2010, 50, 227–230. [Google Scholar] [CrossRef]
- Nguyen, D.Q.; Eamens, A.L.; Grof, C.P.L. Reference gene identification for reliable normalisation of quantitative RT-PCR data in Setaria viridis. Plant. Methods 2018, 14, 24. [Google Scholar] [CrossRef]
- Wang, B.; Du, H.; Yao, Z.; Ren, C.; Ma, L.; Wang, J.; Zhang, H.; Ma, H. Validation of reference genes for accurate normalization of gene expression with quantitative real-time PCR in Haloxylon ammodendron under different abiotic stresses. Physiol. Mol. Biol. Plants 2018, 24, 455–463. [Google Scholar] [CrossRef]
- Zhang, Z.; Li, C.; Zhang, J.; Chen, F.; Gong, Y.; Li, Y.; Su, Y.; Wei, Y.; Zhao, Y. Selection of the reference gene for expression normalization in Papaver somniferum L. under abiotic stress and hormone treatment. Genes 2020, 11, 124. [Google Scholar]
- Zhou, Y.; Xia, H.; Liu, X.; Lin, Z.; Guo, Y.; Deng, H.; Wang, J.; Lin, L.; Deng, Q.; Lv, X.; et al. Identification of Suitable Reference Genes for qRT-PCR Normalization in Kiwifruit. Horticulturae 2022, 8, 170. [Google Scholar] [CrossRef]
- Sudhakar Reddy, P.; Srinivas Reddy, D.; Sivasakthi, K.; Bhatnagar-Mathur, P.; Vadez, V.; Sharma, K.K. Evaluation of Sorghum [Sorghum bicolor (L.)] reference genes in various tissues and under abiotic stress conditions for quantitative real-time PCR data normalization. Front. Plant Sci. 2016, 7, 529. [Google Scholar] [CrossRef] [PubMed]
- Bustin, S.A. Quantification of mRNA using real-time reverse transcription PCR (RT-PCR): Trends and problems. J. Mol. Endocrinol. 2002, 29, 23–39. [Google Scholar] [CrossRef]
- Yang, R.W. Molecular Biology; Nanjing University Press: Nanjing, China, 2007. [Google Scholar]
- Vandesompele, J.; De Preter, K.; Pattyn, F.; Poppe, B.; Van Roy, N.; De Paepe, A.; Speleman, F. Accurate normalization of real-time quantitative RT-PCR data by geometric averaging of multiple internal control genes. Genome Biol. 2002, 3, Research0034.1. [Google Scholar] [CrossRef] [PubMed] [Green Version]
- Andersen, C.L.; Jensen, J.L.; Ørntoft, T.F. Normalization of real-time quantitative reverse transcription-PCR data: A model-based variance estimation approach to identify genes suited for normalization, applied to bladder and colon cancer data sets. Cancer Res. 2004, 64, 5245–5250. [Google Scholar] [CrossRef] [PubMed] [Green Version]
- Pfaffl, M.W.; Tichopad, A.; Prgomet, C.; Neuvians, T.P. Determination of stable housekeeping genes, differentially regulated target genes and sample integrity: BestKeeper—Excel-based tool using pair-wise correlations. Biotechnol. Lett. 2004, 26, 509–515. [Google Scholar] [CrossRef] [PubMed]
- Chen, Z.G.; Ye, X.Y.; Xing, S.Q.; Hou, H.Y. Study on real time fluorescence quantitative PCR detection technology of potato leaf roll virus. Hunan Agric. Sci. 2018, 9, 9–12. [Google Scholar]
- Kong, Q.; Yuan, J.; Gao, L.; Zhao, S.; Jiang, W.; Huang, Y.; Bie, Z. Identification of suitable reference genes for gene expression normalization in qRT-PCR analysis in watermelon. PLoS ONE 2014, 9, e90612. [Google Scholar]
- Tong, Z.; Gao, Z.; Wang, F.; Zhou, J.; Zhang, Z. Selection of reliable reference genes for gene expression studies in peach using real-time PCR. BMC Mol. Biol. 2009, 10, 71. [Google Scholar] [CrossRef] [Green Version]
- Mizoi, J.; Shinozaki, K.; Yamaguchi-Shinozaki, K. AP2/ERF family transcription factors in plant abiotic stress responses. Biochim. Biophys. Acta BBA Gene Regul. Mech. 2012, 1819, 86–96. [Google Scholar] [CrossRef]
- Xie, Z.; Nolan, T.M.; Jiang, H.; Yin, Y. AP2/ERF transcription factor regulatory networks in hormone and abiotic stress responses in Arabidopsis. Front. Plant Sci. 2019, 10, 228. [Google Scholar] [CrossRef] [Green Version]
- Zhong, H.-Y.; Chen, J.-W.; Li, C.-Q.; Chen, L.; Wu, J.-Y.; Chen, J.-Y.; Lu, W.-J.; Li, J.-G. Selection of reliable reference genes for expression studies by reverse transcription quantitative real-time PCR in litchi under different experimental conditions. Plant Cell Rep. 2011, 30, 641–653. [Google Scholar] [CrossRef]
- Lv, Y.; Li, Y.; Liu, X.; Xu, K. Identification of ginger (Zingiber officinale Roscoe) reference genes for gene expression analysis. Front. Genet. 2020, 11, 586098. [Google Scholar] [CrossRef]
- Li, C.; Xu, J.; Deng, Y.; Sun, H.; Li, Y. Selection of reference genes for normalization of cranberry (Vaccinium macrocarpon Ait.) gene expression under different experimental conditions. PLoS ONE 2019, 14, e0224798. [Google Scholar] [CrossRef]
- Zhu, J.K. Abiotic stress signaling and responses in plants. Cell 2016, 167, 313–324. [Google Scholar] [CrossRef] [PubMed] [Green Version]
- Zhang, J.-G.; Wang, X.-P.; Li, X.-R.; Zhang, Z.-S.; Wang, G.; Wang, S.; Ma, F.-Y. Advances and prospect of researches on desert plant life history strategies. J. Desert Res. 2005, 25, 306–314. [Google Scholar]
- Tian, J.; Wang, Y.; Yan, S.; Sun, S.; Jia, J.; Hu, X. Metabolomics technology and its applications in agricultural animal and plant research. Hereditas 2020, 42, 452–465. [Google Scholar] [PubMed]
- Bouton, J. The economic benefits of forage improvement in the United States. Euphytica 2007, 154, 263–270. [Google Scholar] [CrossRef]
- Xiao, F.; Zheng, Y.; Chen, J.; Zhao, C.; Chen, H.; Wang, L.; Liu, S. Selection and validation of reference genes in all-red Amaranth (Amaranthus tricolor L.) seedlings under different culture conditions. J. Hortic. Sci. Biotechnol. 2021, 96, 604–613. [Google Scholar] [CrossRef]
- Cheng, T.; Zhu, F.; Sheng, J.; Zhao, L.; Zhou, F.; Hu, Z.; Diao, Y.; Jin, S. Selection of suitable reference genes for quantitive real-time PCR normalization in Miscanthus lutarioriparia. Mol. Biol. Rep. 2019, 46, 4545–4553. [Google Scholar] [CrossRef] [PubMed]
- Li, C.; Hu, L.; Wang, X.; Liu, H.; Tian, H.; Wang, J. Selection of reliable reference genes for gene expression analysis in seeds at different developmental stages and across various tissues in Paeonia ostii. Mol. Biol. Rep. 2019, 46, 6003–6011. [Google Scholar] [CrossRef]
- Jaiswal, P.; Kaur, N.; Randhawa, G. Identification of reference genes for real-time PCR gene expression studies during seed development and under abiotic stresses in Cyamopsis tetragonoloba (L.) Taub. bioRxiv 2018, 313437. [Google Scholar]
- Wen, Z.B.; Zhang, M.L. Reference gene selection for real-time quantitative PCR in Salsola laricifolia under soil drought stress. Plant Physiol. J. 2015, 51, 2031–2038. [Google Scholar]
- Yeap, W.C.; Loo, J.M.; Wong, Y.C.; Kulaveerasingam, H. Evaluation of suitable reference genes for qRT-PCR gene expression normalization in reproductive, vegetative tissues and during fruit development in oil palm. Plant Cell Tissue Organ Cult. PCTOC 2014, 116, 55–66. [Google Scholar] [CrossRef]
- Chen, M.-D.; Wang, B.; Li, Y.-P.; Zeng, M.-J.; Liu, J.-T.; Ye, X.-R.; Zhu, H.-S.; Wen, Q.-F. Reference gene selection for qRT-PCR analyses of luffa (Luffa cylindrica) plants under abiotic stress conditions. Sci. Rep. 2021, 11, 3161. [Google Scholar] [CrossRef]
- Guénin, S.; Mauriat, M.; Pelloux, J.; Van Wuytswinkel, O.; Bellini, C.; Gutierrez, L. Normalization of qRT-PCR data: The necessity of adopting a systematic, experimental conditions-specific, validation of references. J. Exp. Bot. 2009, 60, 487–493. [Google Scholar] [CrossRef] [Green Version]
- Yang, Z.; Zhang, R.; Zhou, Z. Identification and Validation of Reference Genes for Gene Expression Analysis in Schima superba. Genes 2021, 12, 732. [Google Scholar] [CrossRef]
- Chandna, R.; Augustine, R.; Bisht, N.C. Evaluation of candidate reference genes for gene expression normalization in Brassica juncea using real time quantitative RT-PCR. PLoS ONE 2012, 7, e36918. [Google Scholar] [CrossRef]
- Xu, Z.; Dai, J.; Su, W.; Wu, H.; Shah, K.; Xing, L.; Ma, J.; Zhang, D.; Zhao, C. Selection and Validation of Reliable Reference Genes for Gene Expression Studies in Different Genotypes and TRV-Infected Fruits of Peach (Prunus persica L. Batsch) during Ripening. Genes 2022, 13, 160. [Google Scholar] [CrossRef]
- Moazzam Jazi, M.; Ghadirzadeh Khorzoghi, E.; Botanga, C.; Seyedi, S.M. Identification of reference genes for quantitative gene expression studies in a non-model tree Pistachio (Pistacia vera L.). PLoS ONE 2016, 11, e0157467. [Google Scholar] [CrossRef]
- Zhao, Z.; Zhou, H.; Nie, Z.; Wang, X.; Luo, B.; Yi, Z.; Li, X.; Hu, X.; Yang, T. Appropriate reference genes for RT-qPCR normalization in various organs of Anemone flaccida Fr. Schmidt at different growing stages. Genes 2021, 12, 459. [Google Scholar] [CrossRef]
- Zhang, J.; Zhu, C.-S.; Huo, Y.-B.; Zhang, B.; Ma, Z.-Q.; Feng, J.-T.; Zhang, X. Validation of suitable reference genes for quantitative gene expression analysis in Tripterygium wilfordii. Mol. Biol. Rep. 2019, 46, 4161–4174. [Google Scholar] [CrossRef] [PubMed]
- Wu, Y.; Zhang, C.; Yang, H.; Lyu, L.; Li, W.; Wu, W. Selection and Validation of Candidate Reference Genes for Gene Expression Analysis by RT-qPCR in Rubus. Int. J. Mol. Sci. 2021, 22, 10533. [Google Scholar] [CrossRef] [PubMed]
- Livak, K.J.; Schmittgen, T.D. Analysis of relative gene expression data using real-time quantitative PCR and the 2−ΔΔCT Method. Methods 2001, 25, 402–408. [Google Scholar] [CrossRef] [PubMed]
- Chen, J.; Huang, Z.; Huang, H.; Wei, S.; Liu, Y.; Jiang, C.; Zhang, J.; Zhang, C. Selection of relatively exact reference genes for gene expression studies in goosegrass (Eleusine indica) under herbicide stress. Sci. Rep. 2017, 7, 46494. [Google Scholar] [CrossRef] [PubMed] [Green Version]
- Faraji, S.; Filiz, E.; Kazemitabar, S.K.; Vannozzi, A.; Palumbo, F.; Barcaccia, G.; Heidari, P. The AP2/ERF gene family in Triticum durum: Genome-wide identification and expression analysis under drought and salinity stresses. Genes 2020, 11, 1464. [Google Scholar] [CrossRef]
- Do, T.H.; Pongthai, P.; Ariyarathne, M.; Teh, O.-K.; Fujita, T. AP2/ERF transcription factors regulate salt-induced chloroplast division in the moss Physcomitrella patens. J. Plant Res. 2020, 133, 537–548. [Google Scholar] [CrossRef]
- Ritonga, F.N.; Ngatia, J.N.; Wang, Y.; Khoso, M.A.; Farooq, U.; Chen, S. AP2/ERF, an important cold stress-related transcription factor family in plants: A review. Physiol. Mol. Biol. Plants 2021, 27, 1953–1968. [Google Scholar] [CrossRef]


Publisher’s Note: MDPI stays neutral with regard to jurisdictional claims in published maps and institutional affiliations. |
© 2022 by the authors. Licensee MDPI, Basel, Switzerland. This article is an open access article distributed under the terms and conditions of the Creative Commons Attribution (CC BY) license (https://creativecommons.org/licenses/by/4.0/).