Functional Similarities of Protein-Coding Genes in Topologically Associating Domains and Spatially-Proximate Genomic Regions
Abstract
1. Introduction
2. Results
2.1. Functional Similarities of Gene Pairs in the Same TAD and between Different TADs
2.2. Functional Similarities of Gene Pairs in the Same Gap Region and between Different Gap Region
2.3. Expression Levels of the Gene Pairs in the Same and Different TAD and Gap Region
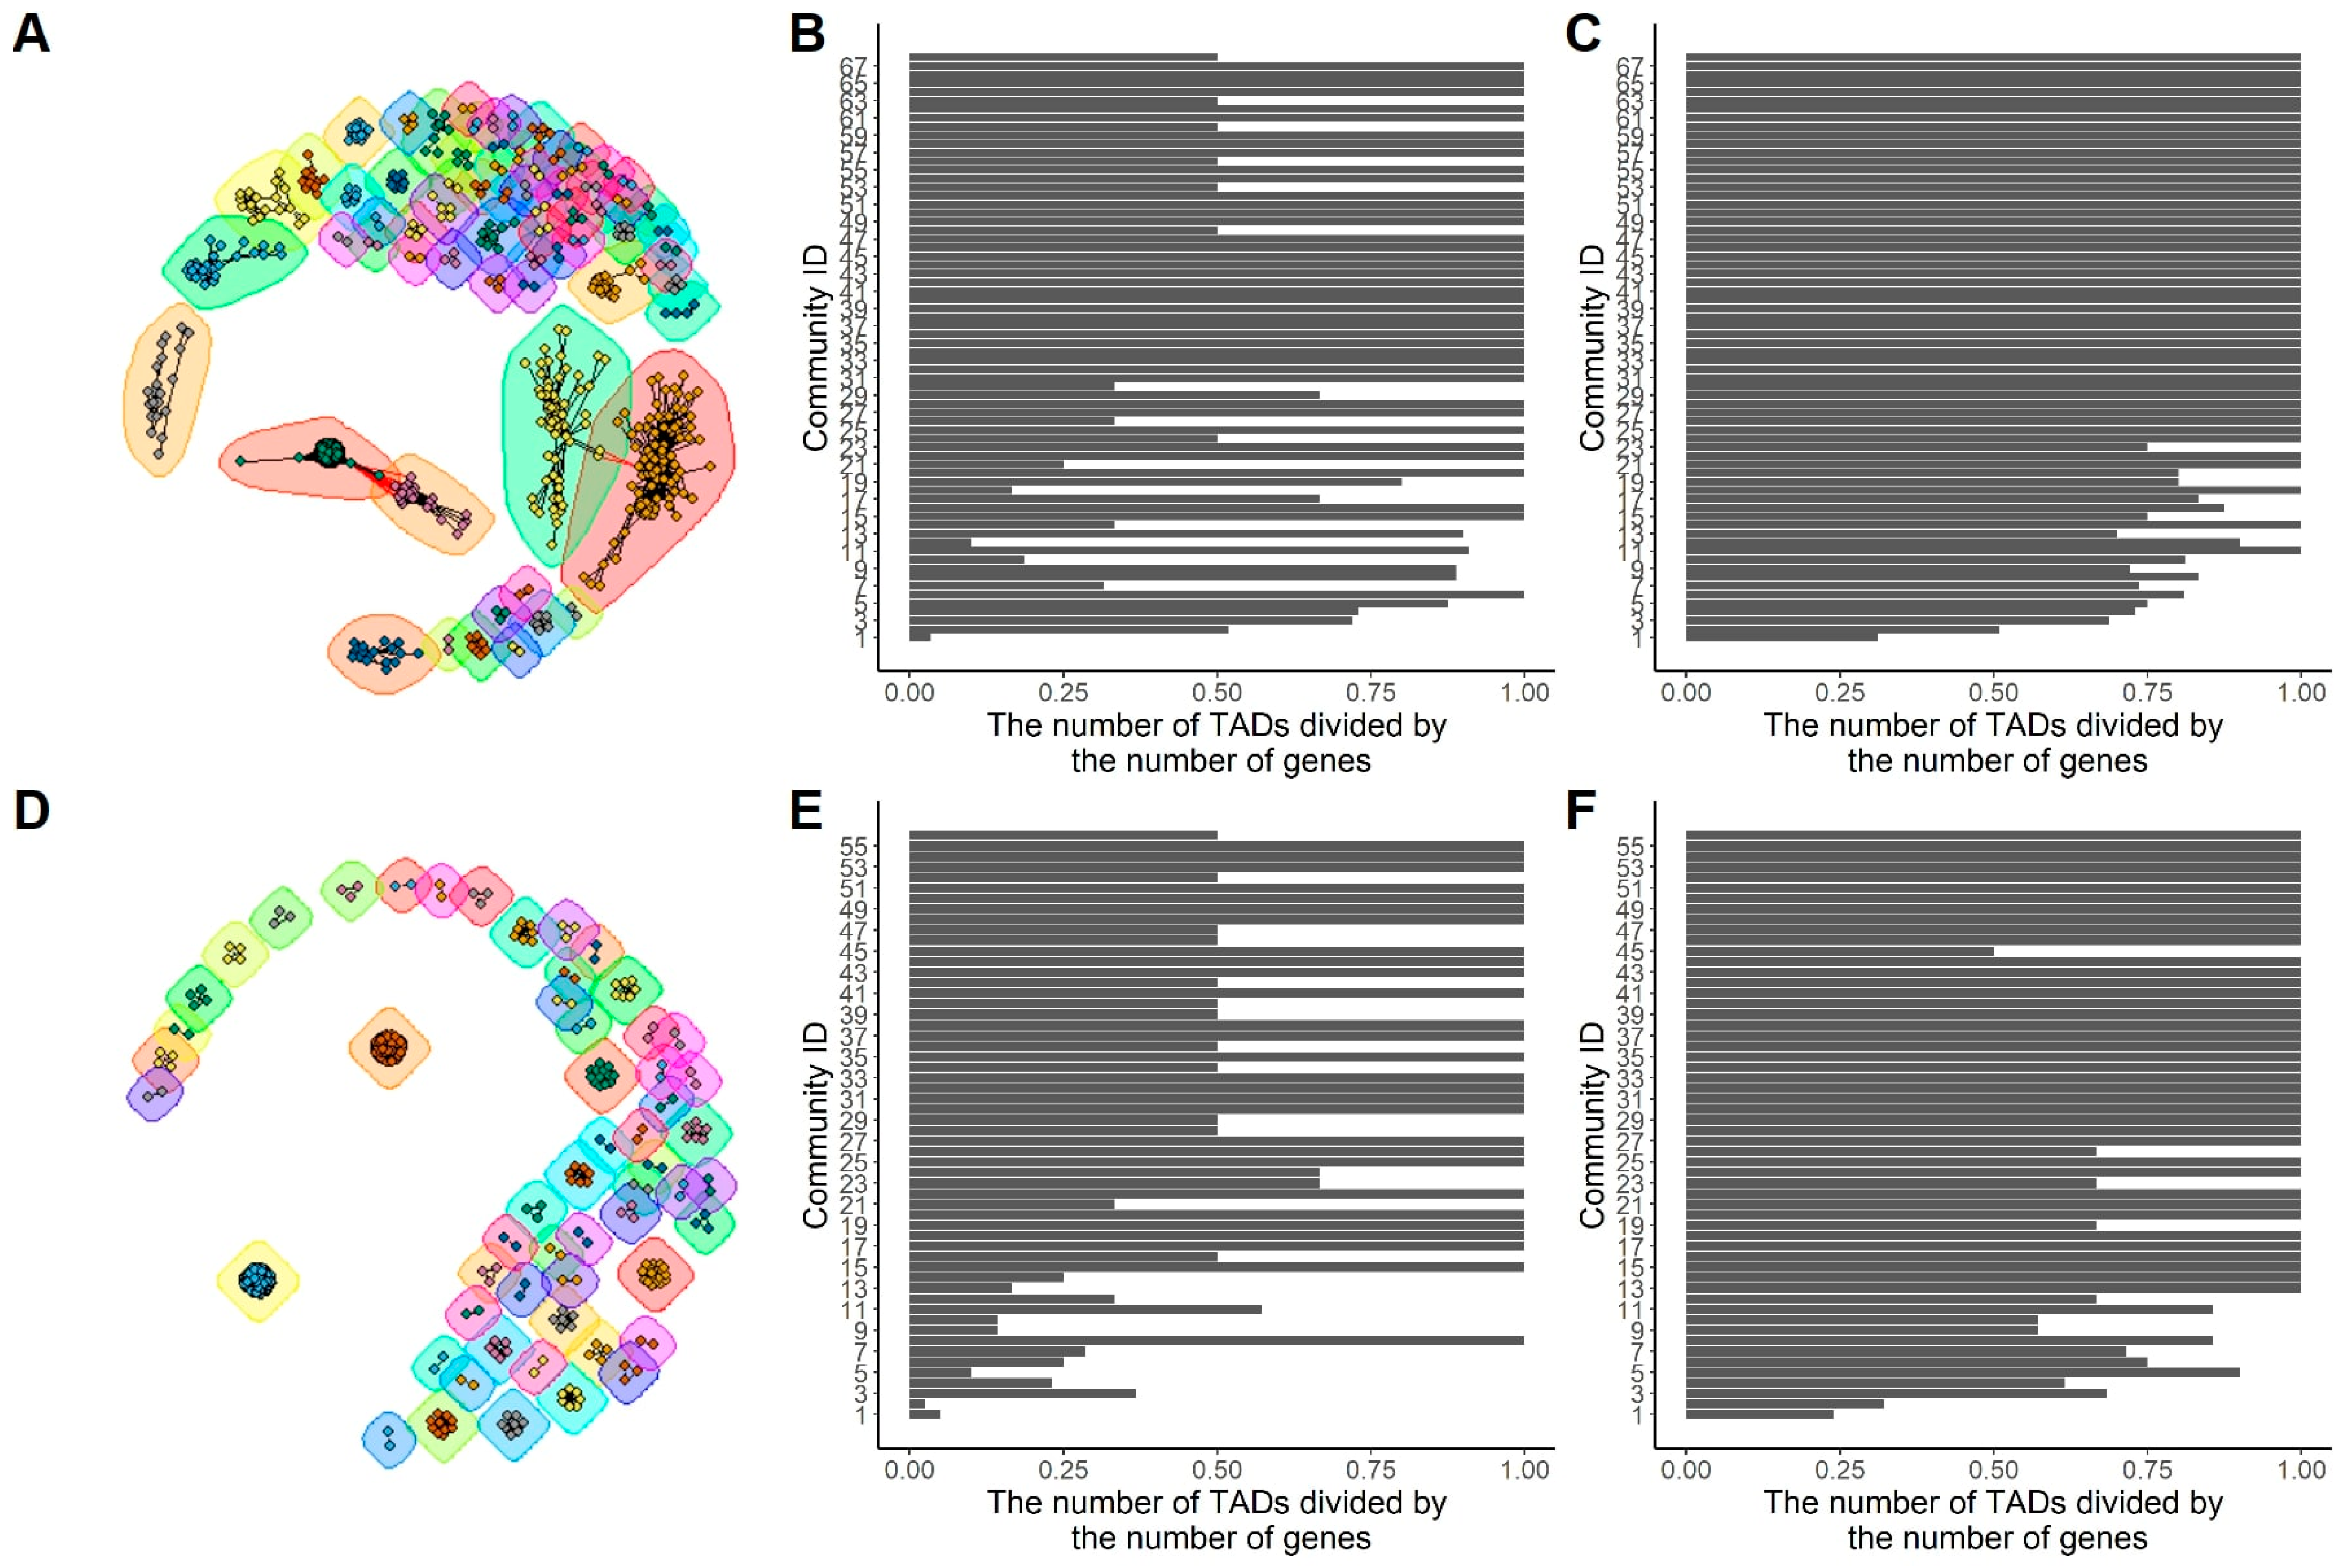
2.4. Functional Similarity Network: The Functional Analysis Based on Network Community
2.5. Gene–Gene Spatial Interaction Network: Graph Reconstruction by a Graph Autoencoder
2.6. Gene–Gene Spatial Interaction Network: Functional Inference Based on Reconstructed Networks
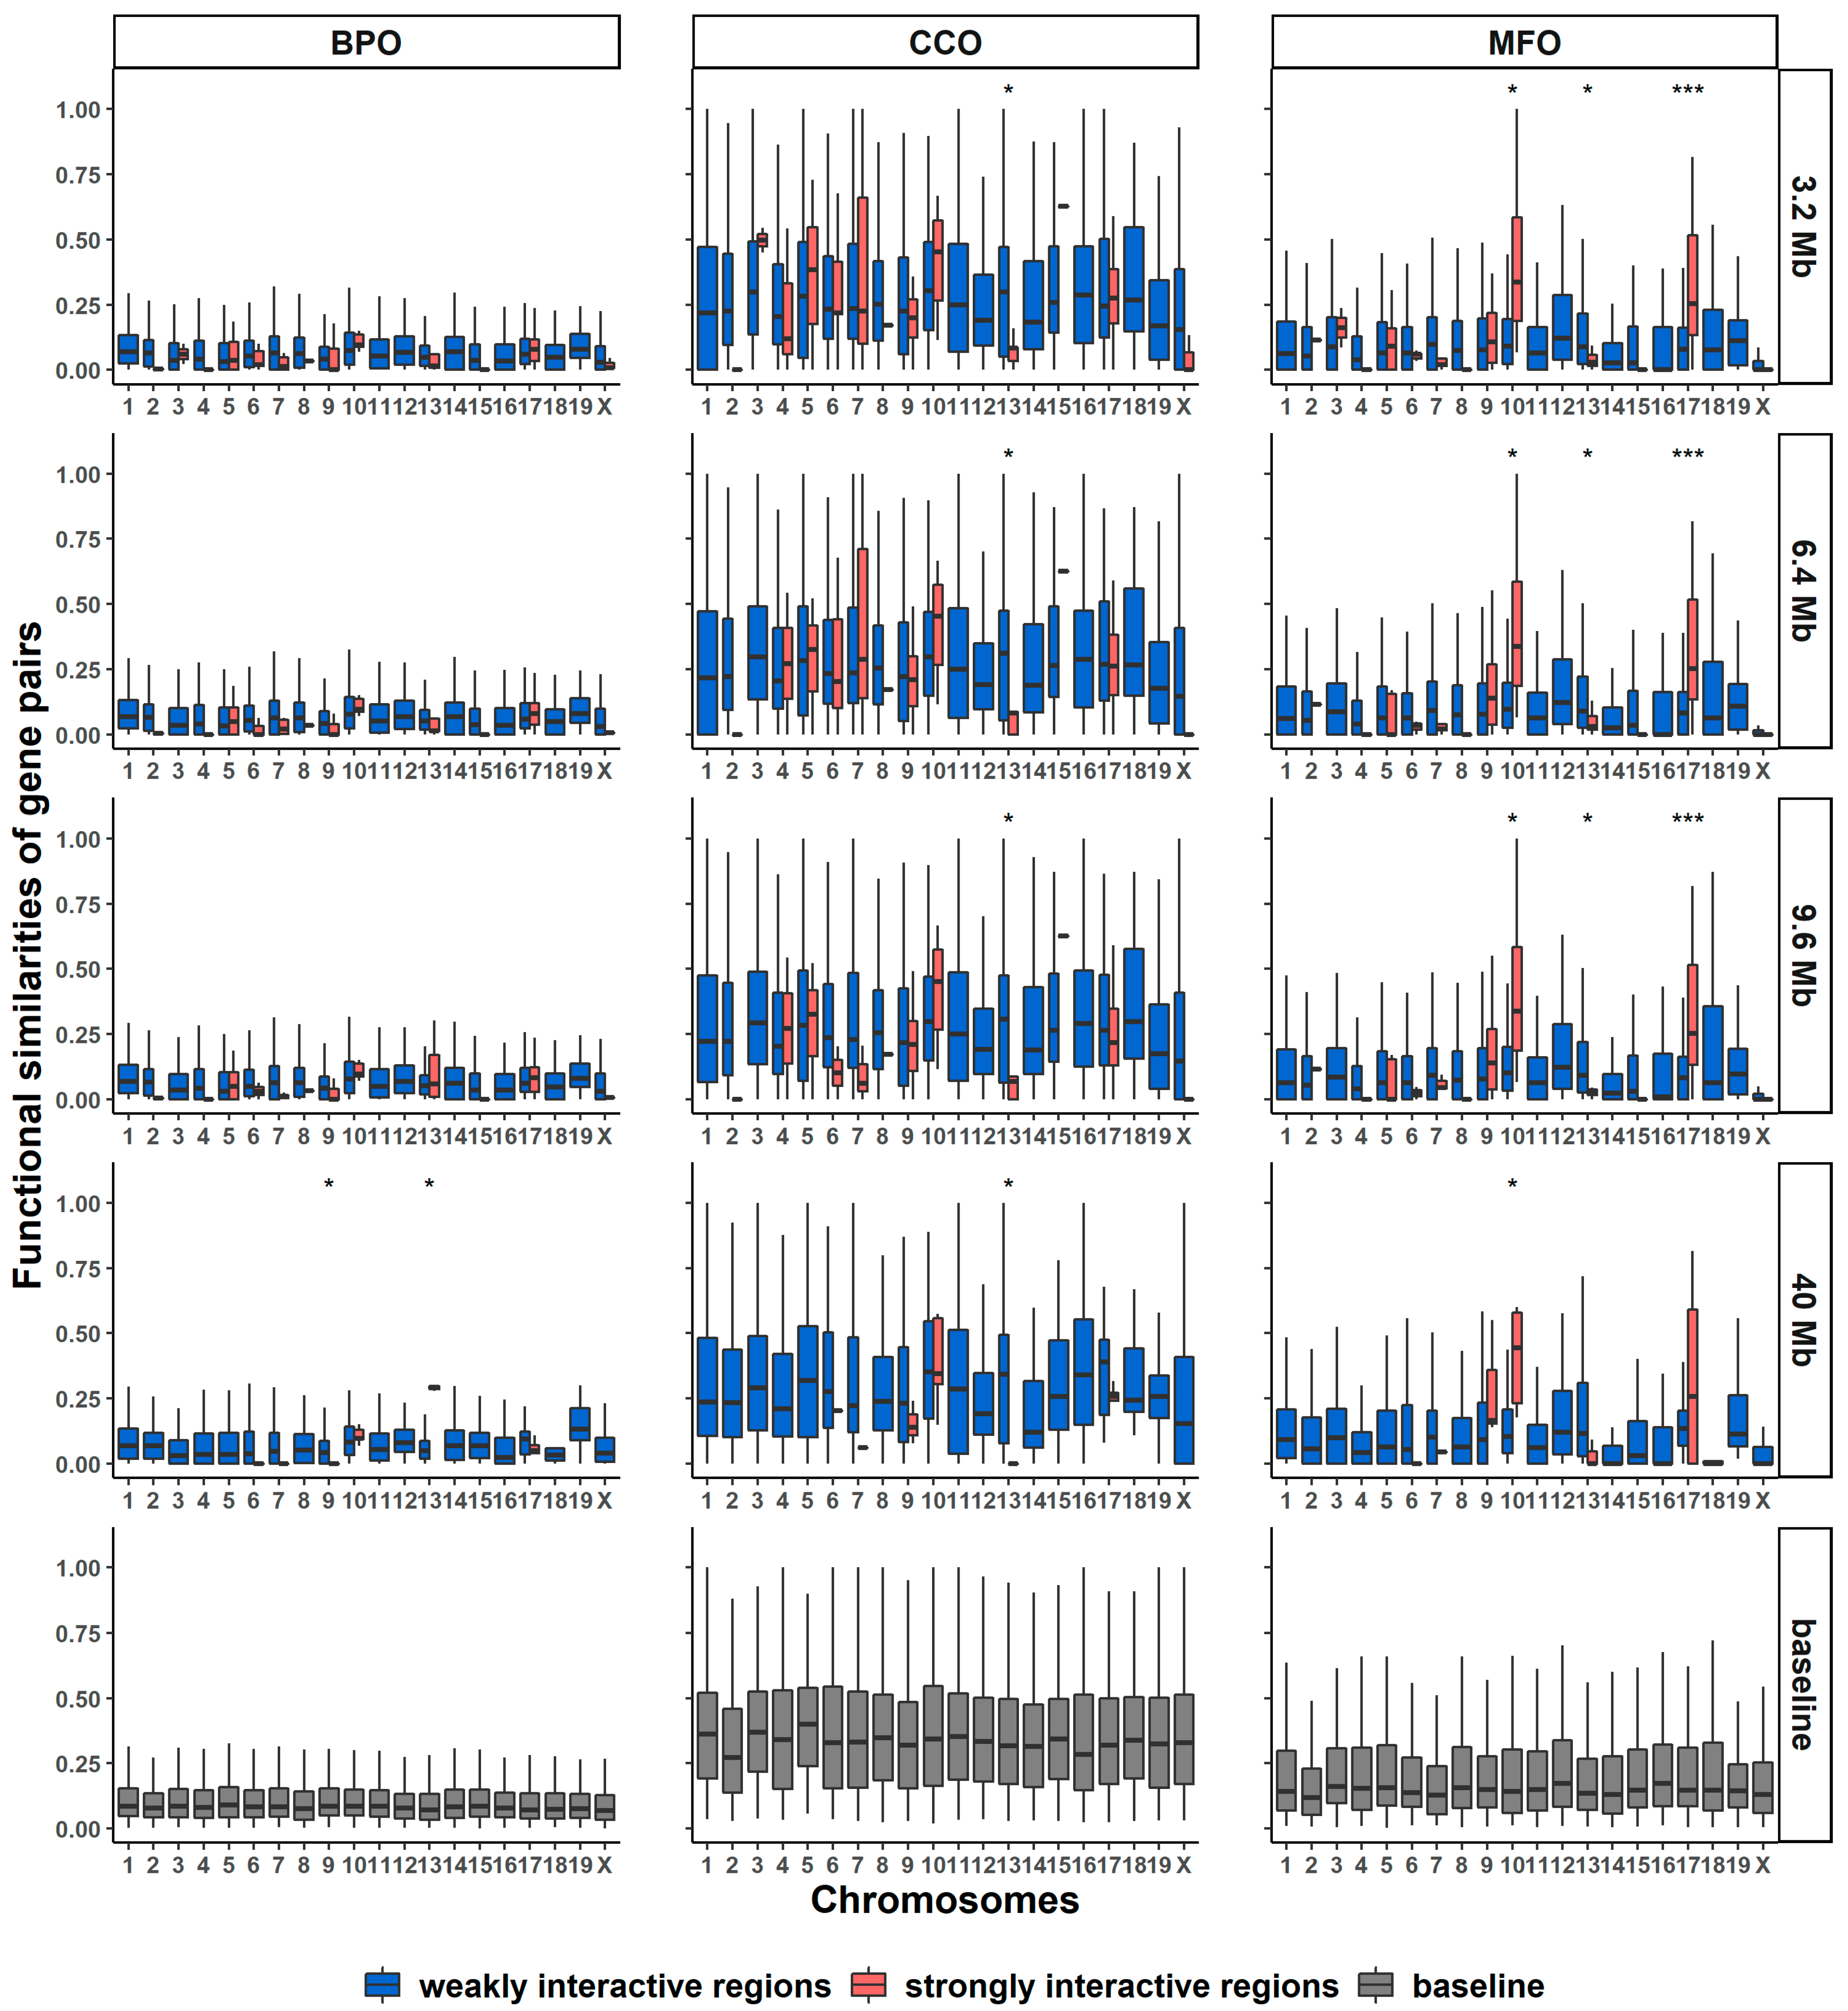
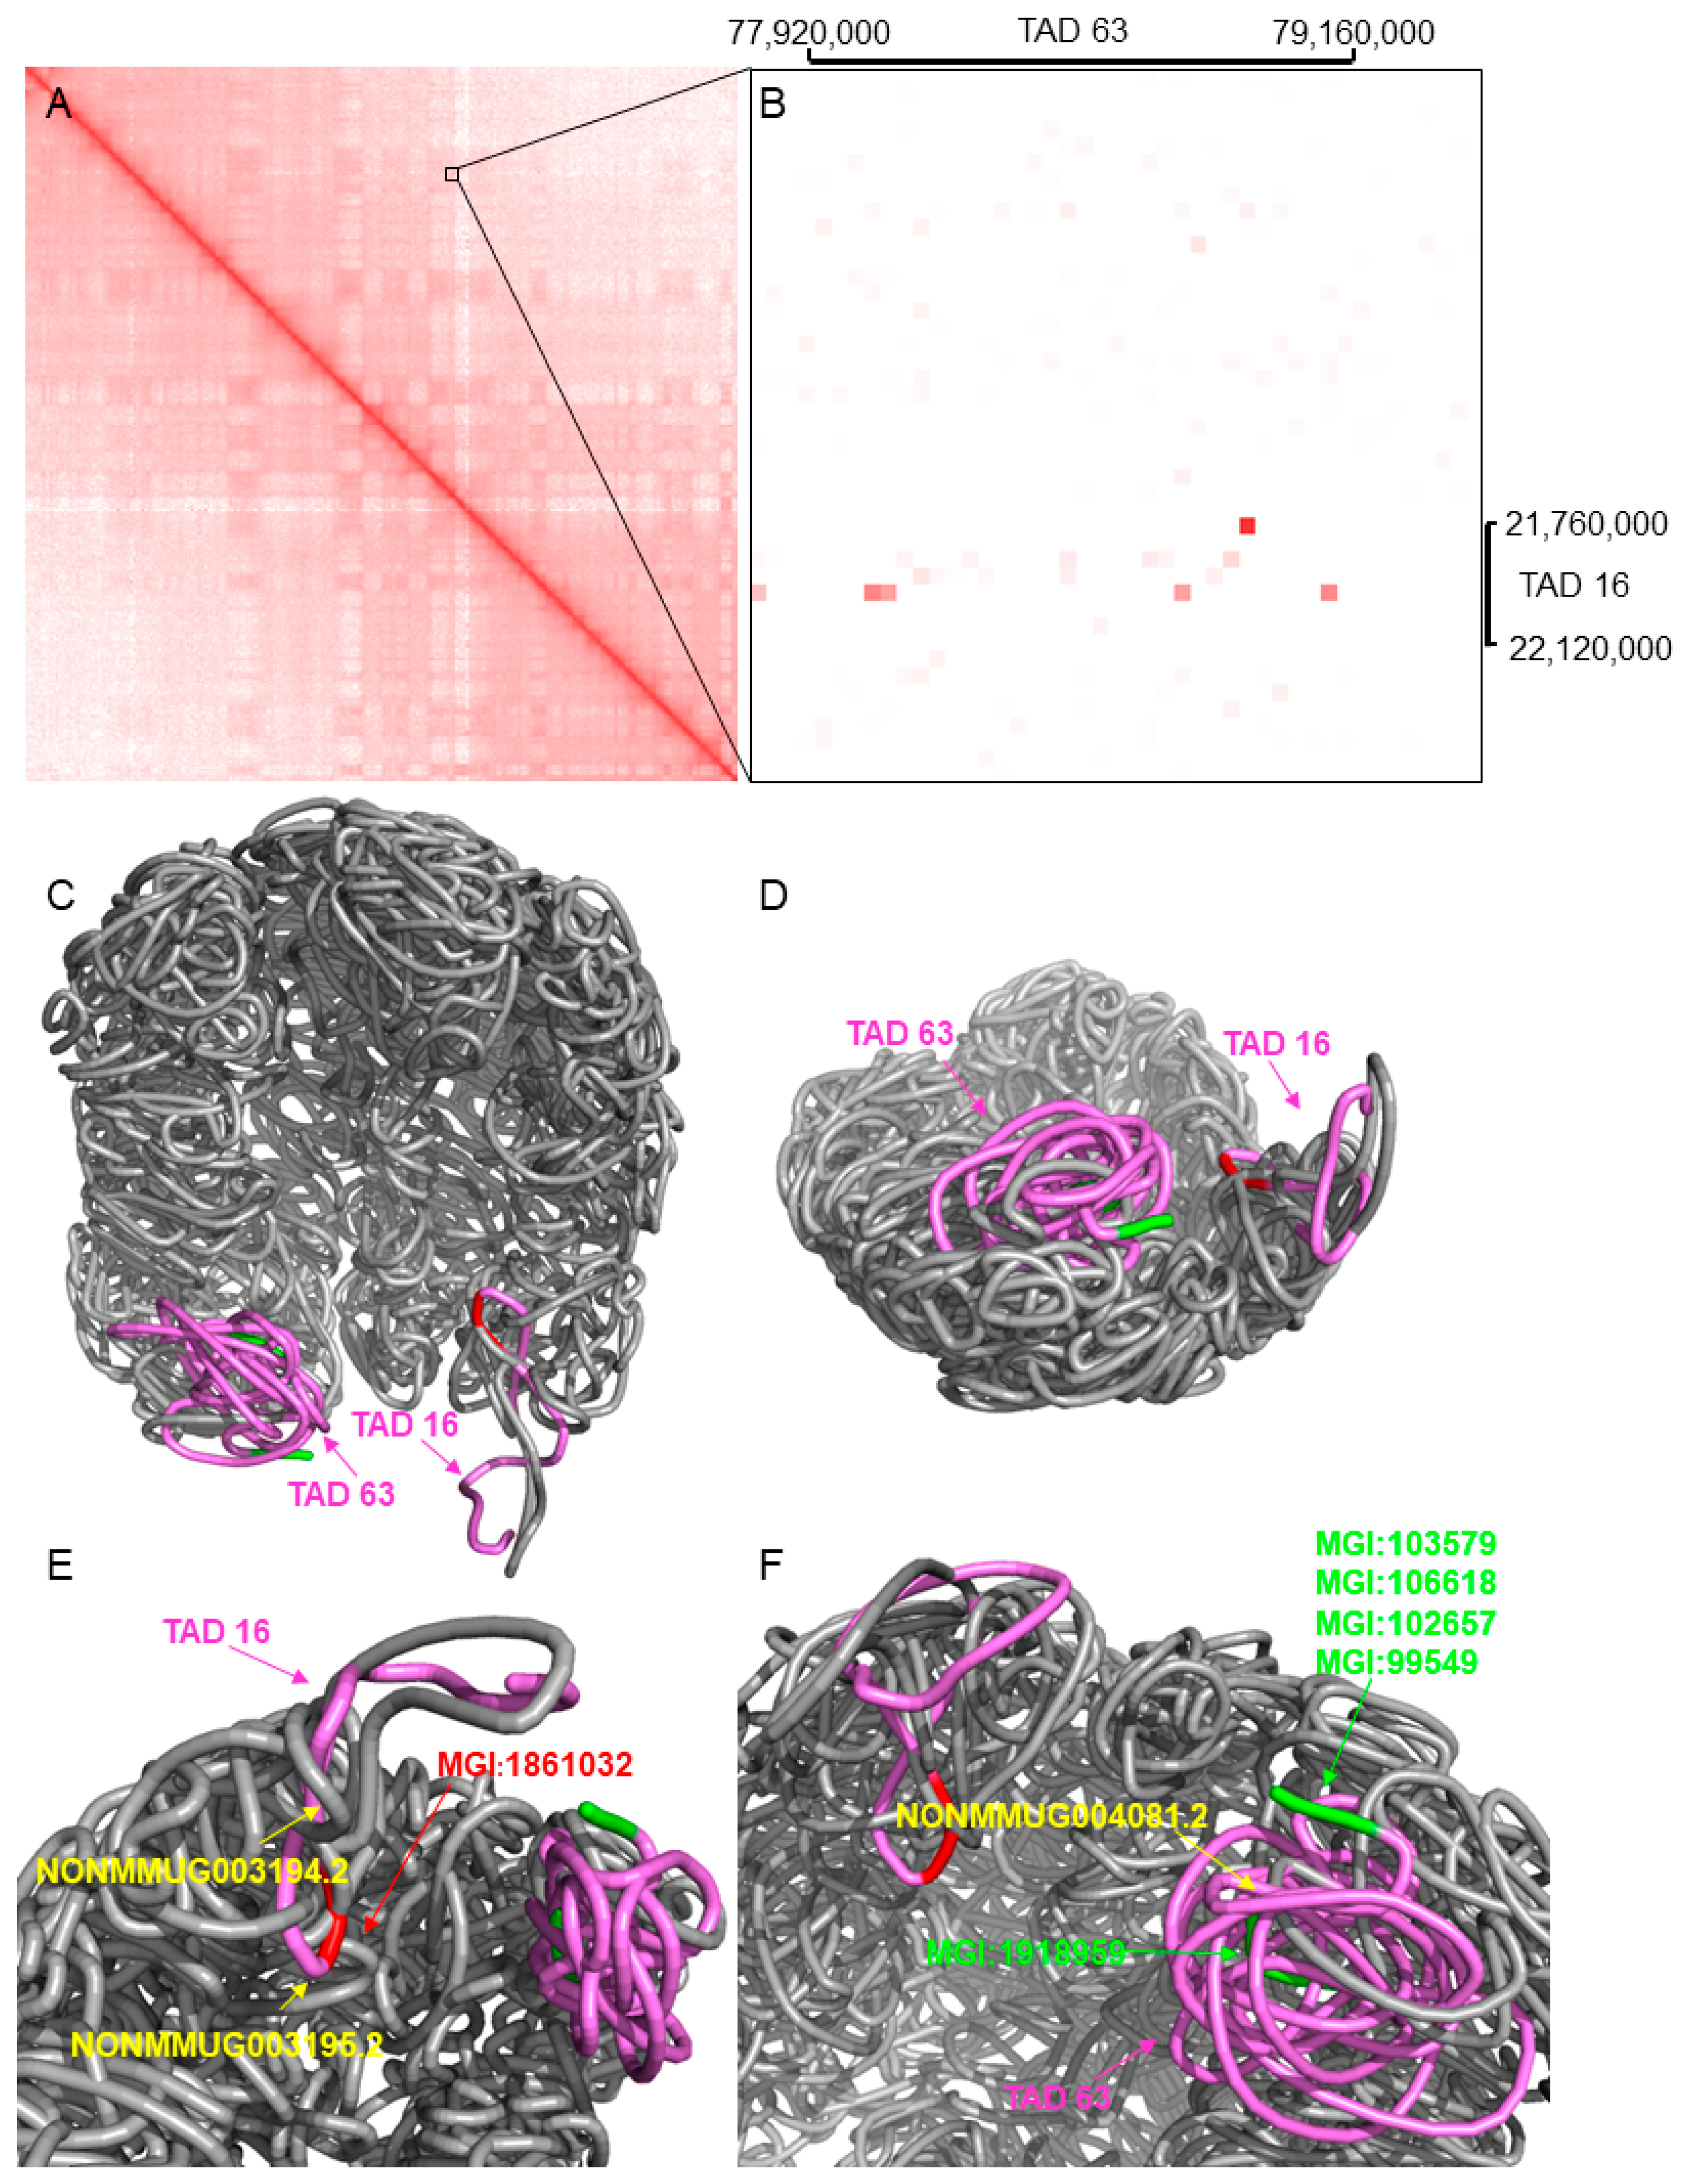
2.7. Identifying Gene Pairs with Similar Functions from Long-Range Interactive Regions
3. Materials and Methods
3.1. Gene Ontology Definition
3.2. Calculation of Gene Function Similarity
3.3. Gene, TAD, and lncRNA Definitions
3.4. Removal of Duplicate Mouse and Human Genes
3.5. Calculation of the Similarity of Gene Expression Levels
3.6. GO Term Enrichment
3.7. Mouse Pathway
3.8. Network Community Detection
3.9. Graph Autoencoder
3.10. Function Inference Based on the Reconstructed Networks
3.11. Detection of Functionally Similar Gene Pairs from Long-Range Highly Interactive Regions
4. Discussion
5. Conclusions
Supplementary Materials
Author Contributions
Funding
Institutional Review Board Statement
Informed Consent Statement
Data Availability Statement
Conflicts of Interest
References
- Cremer, T.; Cremer, C. Chromosome territories, nuclear architecture and gene regulation in mammalian cells. Nat. Rev. Genet. 2001, 2, 292. [Google Scholar] [CrossRef] [PubMed]
- Schneider, R.; Grosschedl, R. Dynamics and interplay of nuclear architecture, genome organization, and gene expression. Genes Dev. 2007, 21, 3027–3043. [Google Scholar] [CrossRef] [PubMed]
- Lieberman-Aiden, E.; Van Berkum, N.L.; Williams, L.; Imakaev, M.; Ragoczy, T.; Telling, A.; Amit, I.; Lajoie, B.R.; Sabo, P.J.; Dorschner, M.O. Comprehensive mapping of long-range interactions reveals folding principles of the human genome. Science 2009, 326, 289–293. [Google Scholar] [CrossRef]
- De Laat, W.; Dekker, J. 3C-based technologies to study the shape of the genome. Methods 2012, 58, 189–191. [Google Scholar] [CrossRef] [PubMed]
- Van Bortle, K.; Nichols, M.H.; Li, L.; Ong, C.-T.; Takenaka, N.; Qin, Z.S.; Corces, V.G. Insulator function and topological domain border strength scale with architectural protein occupancy. Genome Biol. 2014, 15, R82. [Google Scholar] [CrossRef] [PubMed]
- Aitken, S.J.; Ibarra-Soria, X.; Kentepozidou, E.; Flicek, P.; Feig, C.; Marioni, J.C.; Odom, D.T. CTCF maintains regulatory homeostasis of cancer pathways. Genome Biol. 2018, 19, 106. [Google Scholar] [CrossRef]
- Dixon, J.R.; Selvaraj, S.; Yue, F.; Kim, A.; Li, Y.; Shen, Y.; Hu, M.; Liu, J.S.; Ren, B. Topological domains in mammalian genomes identified by analysis of chromatin interactions. Nature 2012, 485, 376. [Google Scholar] [CrossRef]
- Duan, Z.; Andronescu, M.; Schutz, K.; McIlwain, S.; Kim, Y.J.; Lee, C.; Shendure, J.; Fields, S.; Blau, C.A.; Noble, W.S. A three-dimensional model of the yeast genome. Nature 2010, 465, 363. [Google Scholar] [CrossRef]
- Tanizawa, H.; Iwasaki, O.; Tanaka, A.; Capizzi, J.R.; Wickramasinghe, P.; Lee, M.; Fu, Z.; Noma, K.-I. Mapping of long-range associations throughout the fission yeast genome reveals global genome organization linked to transcriptional regulation. Nucleic Acids Res. 2010, 38, 8164–8177. [Google Scholar] [CrossRef]
- Le, T.B.; Imakaev, M.V.; Mirny, L.A.; Laub, M.T. High-resolution mapping of the spatial organization of a bacterial chromosome. Science 2013, 342, 731–734. [Google Scholar] [CrossRef]
- Li, S.; Heermann, D.W. Transcriptional regulatory network shapes the genome structure of Saccharomyces cerevisiae. Nucleus 2013, 4, 216–228. [Google Scholar] [CrossRef] [PubMed][Green Version]
- Naumova, N.; Imakaev, M.; Fudenberg, G.; Zhan, Y.; Lajoie, B.R.; Mirny, L.A.; Dekker, J. Organization of the mitotic chromosome. Science 2013, 342, 948–953. [Google Scholar] [CrossRef] [PubMed]
- Wang, Z.; Cao, R.; Taylor, K.; Briley, A.; Caldwell, C.; Cheng, J. The properties of genome conformation and spatial gene interaction and regulation networks of normal and malignant human cell types. PLoS ONE 2013, 8, e58793. [Google Scholar] [CrossRef] [PubMed]
- Grob, S.; Schmid, M.W.; Grossniklaus, U. Hi-C analysis in Arabidopsis identifies the KNOT, a structure with similarities to the flamenco locus of Drosophila. Mol. Cell 2014, 55, 678–693. [Google Scholar] [CrossRef]
- Yan, J.; Chen, S.-A.A.; Local, A.; Liu, T.; Qiu, Y.; Dorighi, K.M.; Preissl, S.; Rivera, C.M.; Wang, C.; Ye, Z. Histone H3 lysine 4 monomethylation modulates long-range chromatin interactions at enhancers. Cell Res. 2018, 28, 204–220. [Google Scholar] [CrossRef]
- Oluwadare, O.; Cheng, J. ClusterTAD: An unsupervised machine learning approach to detecting topologically associated domains of chromosomes from Hi-C data. BMC Bioinform. 2017, 18, 480. [Google Scholar] [CrossRef]
- Rajpurkar, A.R.; Mateo, L.J.; Murphy, S.E.; Boettiger, A.N. Deep learning connects DNA traces to transcription to reveal predictive features beyond enhancer-promoter contact. Nat. Commun. 2021, 12, 3423. [Google Scholar] [CrossRef]
- Shen, Y.; Yue, F.; McCleary, D.F.; Ye, Z.; Edsall, L.; Kuan, S.; Wagner, U.; Dixon, J.; Lee, L.; Lobanenkov, V.V. A map of the cis-regulatory sequences in the mouse genome. Nature 2012, 488, 116. [Google Scholar] [CrossRef]
- Palstra, R.-J.; Tolhuis, B.; Splinter, E.; Nijmeijer, R.; Grosveld, F.; de Laat, W. The β-globin nuclear compartment in development and erythroid differentiation. Nat. Genet. 2003, 35, 190. [Google Scholar] [CrossRef]
- Ghavi-Helm, Y.; Klein, F.A.; Pakozdi, T.; Ciglar, L.; Noordermeer, D.; Huber, W.; Furlong, E.E. Enhancer loops appear stable during development and are associated with paused polymerase. Nature 2014, 512, 96. [Google Scholar] [CrossRef]
- Le Dily, F.; Baù, D.; Pohl, A.; Vicent, G.P.; Serra, F.; Soronellas, D.; Castellano, G.; Wright, R.H.; Ballare, C.; Filion, G. Distinct structural transitions of chromatin topological domains correlate with coordinated hormone-induced gene regulation. Genes Dev. 2014, 28, 2151–2162. [Google Scholar] [CrossRef] [PubMed]
- Symmons, O.; Uslu, V.V.; Tsujimura, T.; Ruf, S.; Nassari, S.; Schwarzer, W.; Ettwiller, L.; Spitz, F. Functional and topological characteristics of mammalian regulatory domains. Genome Res. 2014, 24, 390–400. [Google Scholar] [CrossRef] [PubMed]
- Sexton, T.; Cavalli, G. The role of chromosome domains in shaping the functional genome. Cell 2015, 160, 1049–1059. [Google Scholar] [CrossRef] [PubMed]
- Liu, T.; Wang, Z. Reconstructing the high-resolution chromosome three-dimensional structures by Hi-C complex networks. BMC Bioinform. 2018, 19, 39–50. [Google Scholar] [CrossRef] [PubMed]
- Cao, R.; Cheng, J. Deciphering the association between gene function and spatial gene–gene interactions in 3D human genome conformation. BMC Genom. 2015, 16, 880. [Google Scholar] [CrossRef]
- Bantignies, F.; Roure, V.; Comet, I.; Leblanc, B.; Schuettengruber, B.; Bonnet, J.; Tixier, V.; Mas, A.; Cavalli, G. Polycomb-dependent regulatory contacts between distant HOX loci in Drosophila. Cell 2011, 144, 214–226. [Google Scholar] [CrossRef]
- Véron, A.S.; Lemaitre, C.; Gautier, C.; Lacroix, V.; Sagot, M.-F. Close 3D proximity of evolutionary breakpoints argues for the notion of spatial synteny. BMC Genom. 2011, 12, 303. [Google Scholar] [CrossRef]
- Noordermeer, D.; De Wit, E.; Klous, P.; Van De Werken, H.; Simonis, M.; Lopez-Jones, M.; Eussen, B.; De Klein, A.; Singer, R.H.; De Laat, W. Variegated gene expression caused by cell-specific long-range DNA interactions. Nat. Cell Biol. 2011, 13, 944. [Google Scholar] [CrossRef]
- Lallemand, T.; Leduc, M.; Landès, C.; Rizzon, C.; Lerat, E. An overview of duplicated gene detection methods: Why the duplication mechanism has to be accounted for in their choice. Genes 2020, 11, 1046. [Google Scholar] [CrossRef]
- Nehrt, N.L.; Clark, W.T.; Radivojac, P.; Hahn, M.W. Testing the ortholog conjecture with comparative functional genomic data from mammals. PLoS Comput. Biol. 2011, 7, e1002073. [Google Scholar] [CrossRef]
- Ashburner, M.; Ball, C.A.; Blake, J.A.; Botstein, D.; Butler, H.; Cherry, J.M.; Davis, A.P.; Dolinski, K.; Dwight, S.S.; Eppig, J.T. Gene Ontology: Tool for the unification of biology. Nat. Genet. 2000, 25, 25. [Google Scholar] [CrossRef] [PubMed]
- Zhao, C.; Wang, Z. GOGO: An improved algorithm to measure the semantic similarity between gene ontology terms. Sci. Rep. 2018, 8, 15107. [Google Scholar] [CrossRef] [PubMed]
- Bork, P.; Dandekar, T.; Diaz-Lazcoz, Y.; Eisenhaber, F.; Huynen, M.; Yuan, Y. Predicting function: From genes to genomes and back1. J. Mol. Biol. 1998, 283, 707–725. [Google Scholar] [CrossRef] [PubMed]
- Bult, C.J.; Eppig, J.T.; Kadin, J.A.; Richardson, J.E.; Blake, J.A.; Group, M.G.D. The Mouse Genome Database (MGD): Mouse biology and model systems. Nucleic Acids Res. 2008, 36, D724–D728. [Google Scholar] [CrossRef]
- Eppig, J.T.; Smith, C.L.; Blake, J.A.; Ringwald, M.; Kadin, J.A.; Richardson, J.E.; Bult, C.J. Mouse Genome Informatics (MGI): Resources for mining mouse genetic, genomic, and biological data in support of primary and translational research. Methods Mol Biol. 2017, 1488, 47–73. [Google Scholar]
- Hinrichs, A.S.; Karolchik, D.; Baertsch, R.; Barber, G.P.; Bejerano, G.; Clawson, H.; Diekhans, M.; Furey, T.S.; Harte, R.A.; Hsu, F. The UCSC genome browser database: Update 2006. Nucleic Acids Res. 2006, 34, D590–D598. [Google Scholar] [CrossRef]
- Howe, K.L.; Achuthan, P.; Allen, J.; Allen, J.; Alvarez-Jarreta, J.; Amode, M.R.; Armean, I.M.; Azov, A.G.; Bennett, R.; Bhai, J.; et al. Ensembl 2021. Nucleic Acids Res. 2021, 49, D884–D891. [Google Scholar] [CrossRef]
- Yang, Y.; Zhang, Y.; Ren, B.; Dixon, J.R.; Ma, J. Comparing 3D Genome Organization in Multiple Species Using Phylo-HMRF. Cell Syst. 2019, 8, 494–505.e14. [Google Scholar] [CrossRef]
- Durand, N.C.; Shamim, M.S.; Machol, I.; Rao, S.S.; Huntley, M.H.; Lander, E.S.; Aiden, E.L. Juicer Provides a One-Click System for Analyzing Loop-Resolution Hi-C Experiments. Cell Syst. 2016, 3, 95–98. [Google Scholar] [CrossRef]
- Abdennur, N.; Mirny, L.A. Cooler: Scalable storage for Hi-C data and other genomically labeled arrays. Bioinformatics 2020, 36, 311–316. [Google Scholar] [CrossRef]
- Wolff, J.; Rabbani, L.; Gilsbach, R.; Richard, G.; Manke, T.; Backofen, R.; Grüning, B.A. Galaxy HiCExplorer 3: A web server for reproducible Hi-C, capture Hi-C and single-cell Hi-C data analysis, quality control and visualization. Nucleic Acids Res. 2020, 48, W177–W184. [Google Scholar] [CrossRef] [PubMed]
- Zhao, Y.; Li, H.; Fang, S.; Kang, Y.; Hao, Y.; Li, Z.; Bu, D.; Sun, N.; Zhang, M.Q.; Chen, R. NONCODE 2016: An informative and valuable data source of long non-coding RNAs. Nucleic Acids Res. 2016, 44, D203–D208. [Google Scholar] [CrossRef] [PubMed]
- Consortium, U. UniProt: The universal protein knowledgebase. Nucleic Acids Res. 2018, 46, 2699. [Google Scholar]
- Altschul, S.; Madden, T.; Schaffer, A.; Zhang, J.; Zhang, Z.; Miller, W.; Lipman, D. Gapped BLAST and PSI-BLAST: A new generation of protein database search programs. Nucleic Acids Res. 1997, 25, 3389–3402. [Google Scholar] [CrossRef]
- Kolodziejczyk, A.A.; Kim, J.K.; Tsang, J.C.; Ilicic, T.; Henriksson, J.; Natarajan, K.N.; Tuck, A.C.; Gao, X.; Bühler, M.; Liu, P. Single cell RNA-sequencing of pluripotent states unlocks modular transcriptional variation. Cell Stem Cell 2015, 17, 471–485. [Google Scholar] [CrossRef]
- Mi, H.; Muruganujan, A.; Huang, X.; Ebert, D.; Mills, C.; Guo, X.; Thomas, P.D. Protocol Update for large-scale genome and gene function analysis with the PANTHER classification system (v.14.0). Nat. Protoc. 2019, 14, 703–721. [Google Scholar] [CrossRef]
- Kanehisa, M.; Furumichi, M.; Tanabe, M.; Sato, Y.; Morishima, K. KEGG: New perspectives on genomes, pathways, diseases and drugs. Nucleic Acids Res. 2017, 45, D353–D361. [Google Scholar] [CrossRef]
- Tenenbaum, D.; Maintainer, B.P. KEGGREST: Client-Side REST Access to the Kyoto Encyclopedia of Genes and Genomes (KEGG), R Package Version 1.34.0; 2021. Available online: https://bioconductor.org/packages/release/bioc/html/KEGGREST.html (accessed on 7 October 2021).
- Butts, C.T. Network: A Package for Managing Relational Data in R. J. Stat. Softw. 2008, 24, 1–36. [Google Scholar] [CrossRef]
- Newman, M.E.; Girvan, M. Finding and evaluating community structure in networks. Phys. Rev. E 2004, 69, 026113. [Google Scholar] [CrossRef]
- Ognyanova, K. Network Analysis with R and Igraph; NetSciX 2016 School of Code Workshop: Wroclaw, Poland, 2016. [Google Scholar]
- Shannon, P.; Markiel, A.; Ozier, O.; Baliga, N.S.; Wang, J.T.; Ramage, D.; Amin, N.; Schwikowski, B.; Ideker, T. Cytoscape: A software environment for integrated models of biomolecular interaction networks. Genome Res. 2003, 13, 2498–2504. [Google Scholar] [CrossRef]
- Assenov, Y.; Ramírez, F.; Schelhorn, S.-E.; Lengauer, T.; Albrecht, M. Computing topological parameters of biological networks. Bioinformatics 2007, 24, 282–284. [Google Scholar] [CrossRef] [PubMed]
- Doncheva, N.T.; Assenov, Y.; Domingues, F.S.; Albrecht, M. Topological analysis and interactive visualization of biological networks and protein structures. Nat. Protoc. 2012, 7, 670. [Google Scholar] [CrossRef] [PubMed]
- Salha, G.; Hennequin, R.; Vazirgiannis, M. Simple and effective graph autoencoders with one-hop linear models. arXiv 2020, arXiv:2001.07614. [Google Scholar]
- Filippova, D.; Patro, R.; Duggal, G.; Kingsford, C. Identification of alternative topological domains in chromatin. Algorithms Mol. Biol. 2014, 9, 14. [Google Scholar] [CrossRef] [PubMed]
- Weinreb, C.; Raphael, B.J. Identification of hierarchical chromatin domains. Bioinformatics 2015, 32, 1601–1609. [Google Scholar] [CrossRef]
- Ramírez, F.; Bhardwaj, V.; Arrigoni, L.; Lam, K.C.; Grüning, B.A.; Villaveces, J.; Habermann, B.; Akhtar, A.; Manke, T. High-resolution TADs reveal DNA sequences underlying genome organization in flies. Nat. Commun. 2018, 9, 189. [Google Scholar] [CrossRef]
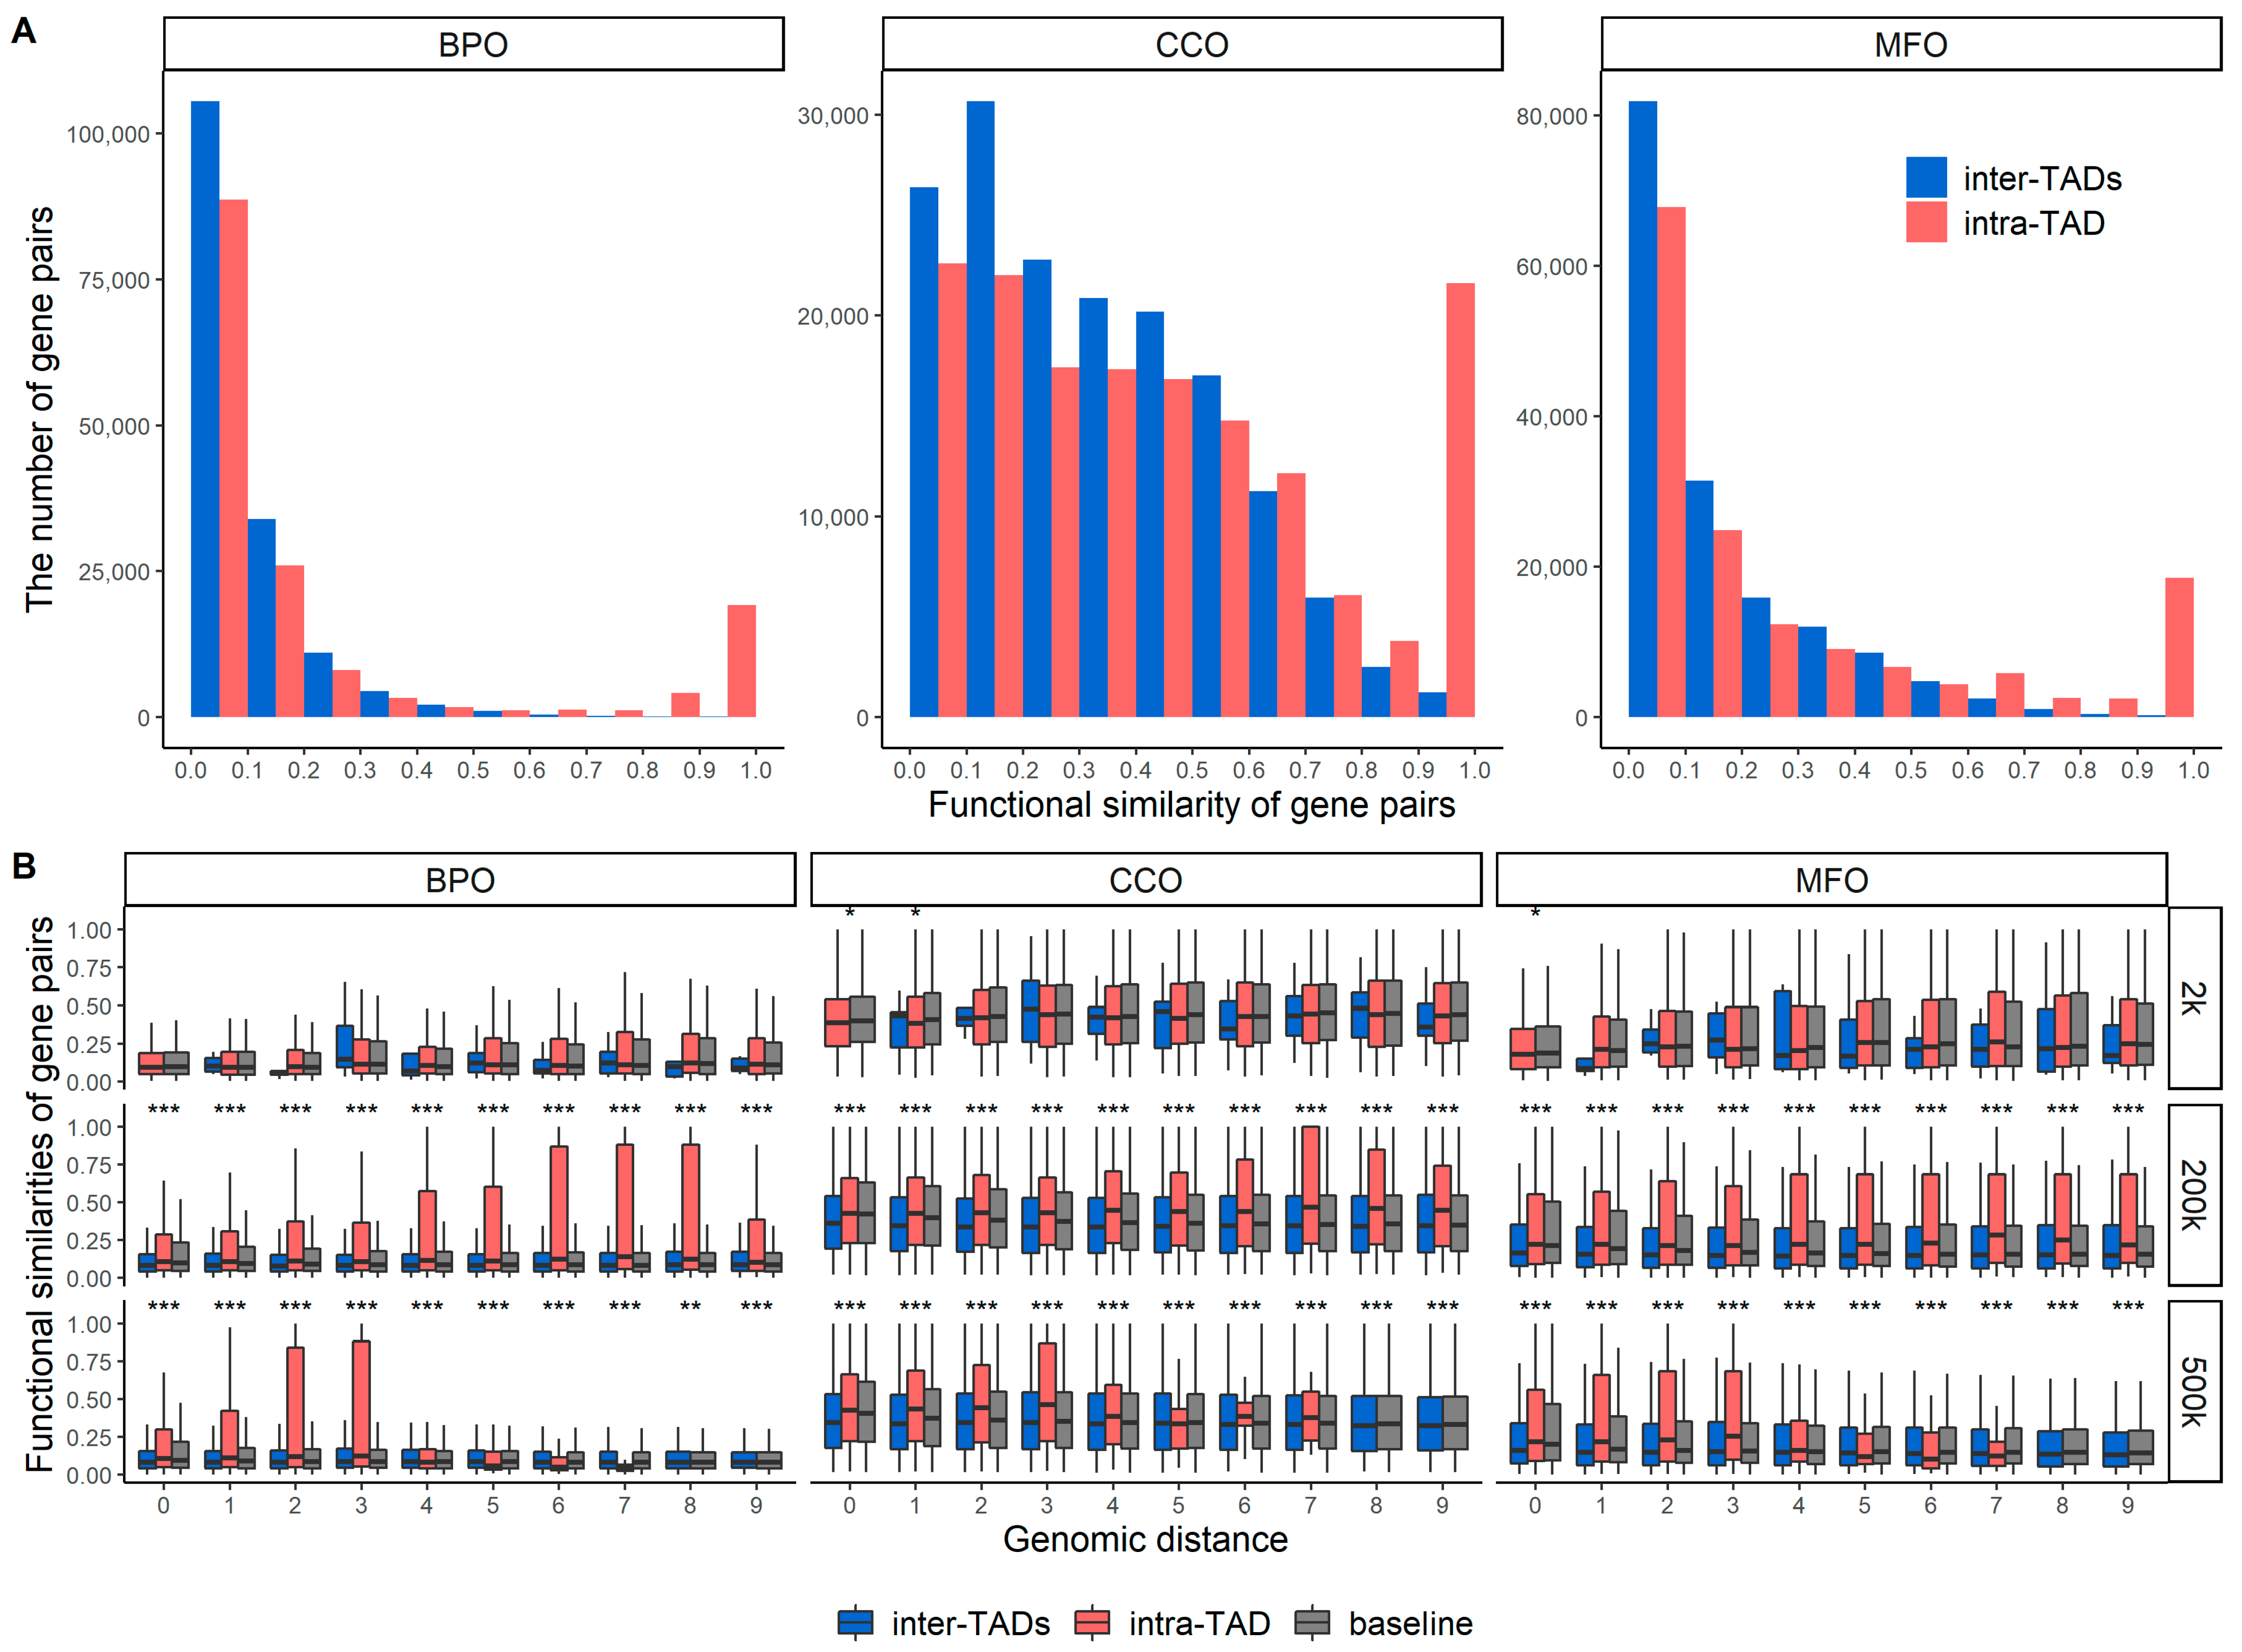
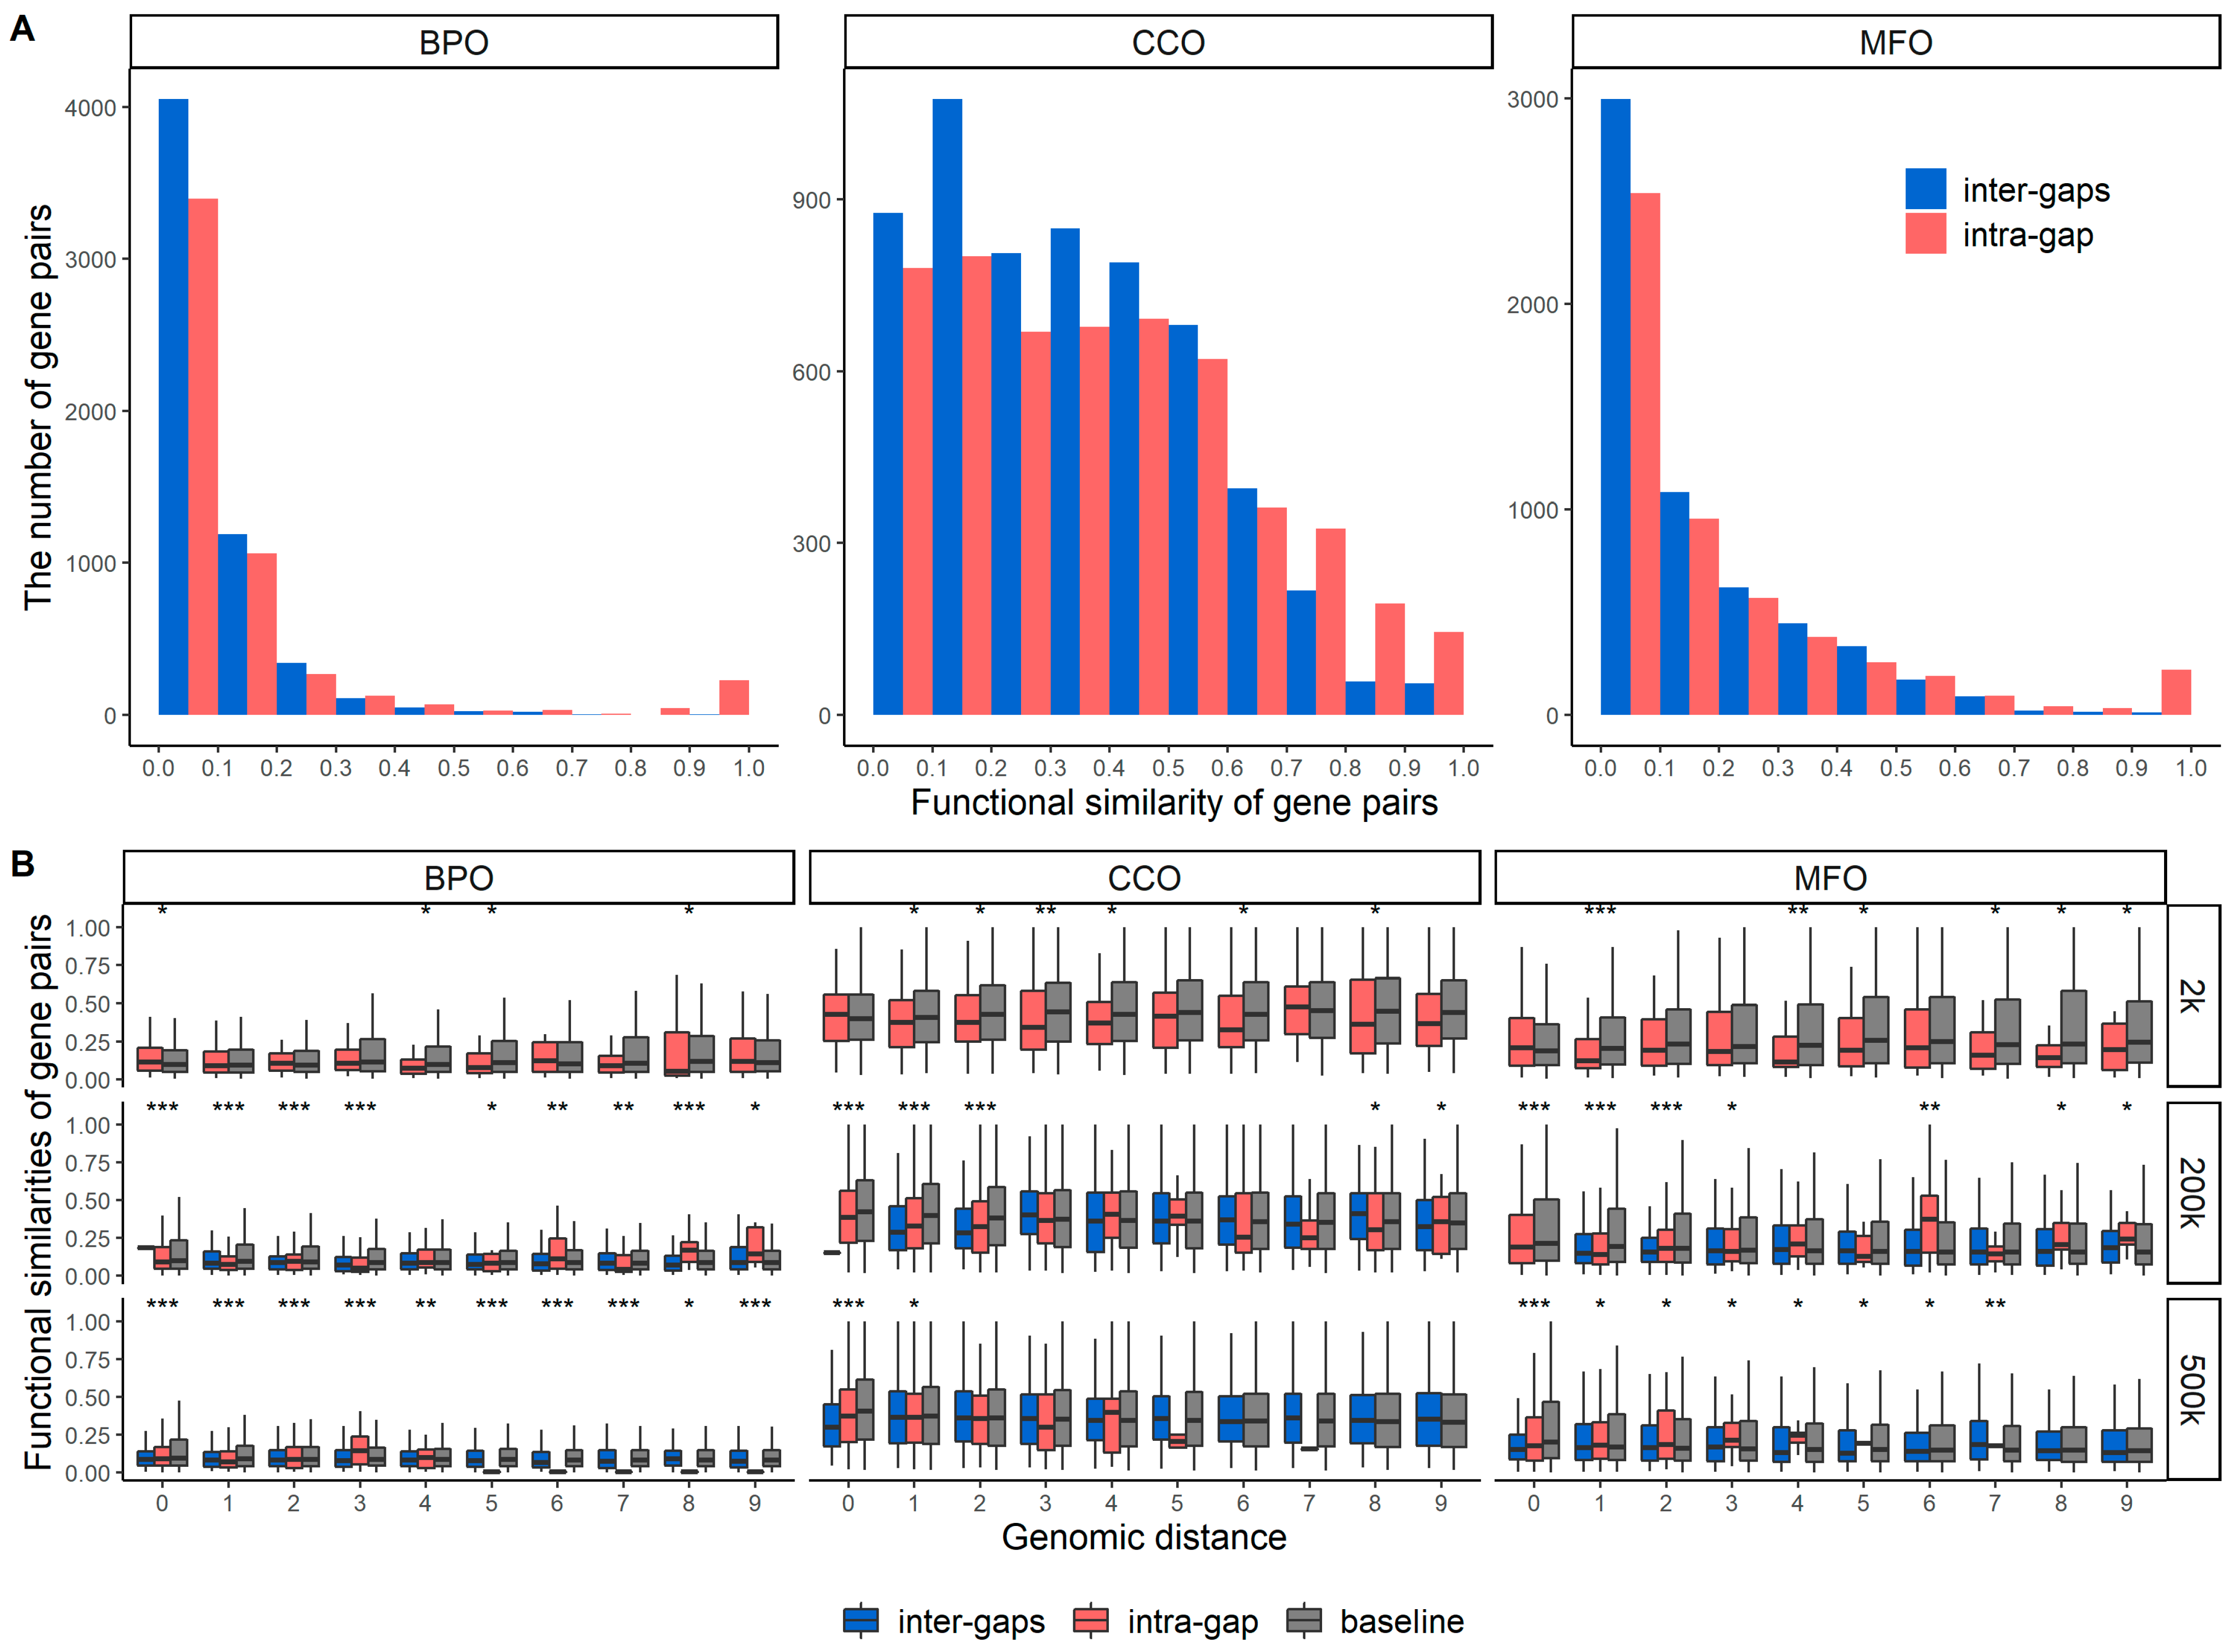

| BPO | CCO | MFO | |
|---|---|---|---|
| Intra-TAD | 0.635 | 0.423 | 0.601 |
| Intra-gap | 0.586 | 0.326 | 0.32 |
| Inter-TADs | 0.058 | 0.052 | 0.036 |
| Inter-gaps | 0.07 (p-value: 0.1) | 0.099 | 0.025 (p-value: 0.31) |
| Baseline | 0.062 | 0.029 | 0.055 |
| Species | Experimental Settings | Number of Genes in the Network | The Area under the Curve (AUC) | Average Precision (AP) | ||
|---|---|---|---|---|---|---|
| Number of Hi-C Contacts between Gene Pairs | Genomic Distance between Gene Pairs | Network Type | ||||
| Mouse | ≥800 | ≥1 Mbp | HiC-GGSI | 66 | 0.89 ± 0.069 | 0.93 ± 0.042 |
| HiC-TAD-GGSI | 230 | 0.98 ± 0.011 | 0.99 ± 0.006 | |||
| ≥2 Mbp | HiC-GGSI | 53 | 0.86 ± 0.096 | 0.88 ± 0.094 | ||
| HiC-TAD-GGSI | 71 | 0.85 ± 0.083 | 0.9 ± 0.047 | |||
| ≥1200 | ≥1 Mbp | HiC-GGSI | 58 | 0.83 ± 0.084 | 0.84 ± 0.082 | |
| HiC-TAD-GGSI | 226 | 0.98 ± 0.009 | 0.99 ± 0.01 | |||
| ≥2 Mbp | HiC-GGSI | 48 | 0.77 ± 0.11 | 0.84 ± 0.083 | ||
| HiC-TAD-GGSI | 66 | 0.86 ± 0.046 | 0.87 ± 0.059 | |||
| Human | ≥5 | ≥1 Mbp | HiC-GGSI | 197 | 0.8 ± 0.036 | 0.86 ± 0.029 |
| HiC-TAD-GGSI | 275 | 0.94 ± 0.011 | 0.96 ± 0.006 | |||
| ≥2 Mbp | HiC-GGSI | 167 | 0.77 ± 0.034 | 0.81 ± 0.021 | ||
| HiC-TAD-GGSI | 186 | 0.83 ± 0.024 | 0.88 ± 0.021 | |||
| ≥10 | ≥1 Mbp | HiC-GGSI | 108 | 0.65 ± 0.077 | 0.72 ± 0.092 | |
| HiC-TAD-GGSI | 203 | 0.96 ± 0.017 | 0.97 ± 0.014 | |||
| ≥2 Mbp | HiC-GGSI | 67 | 0.73 ± 0.076 | 0.79 ± 0.077 | ||
| HiC-TAD-GGSI | 86 | 0.83 ± 0.072 | 0.86 ± 0.07 | |||
| Chimpanzee | ≥0 | ≥0.5 Mbp | HiC-GGSI | 171 | 0.8 ± 0.029 | 0.83 ± 0.016 |
| HiC-TAD-GGSI | 209 | 0.85 ± 0.021 | 0.87 ± 0.019 | |||
| ≥0.7 Mbp | HiC-GGSI | 167 | 0.79 ± 0.026 | 0.81 ± 0.026 | ||
| HiC-TAD-GGSI | 177 | 0.79 ± 0.018 | 0.82 ± 0.017 | |||
| ≥5 | ≥0.5 Mbp | HiC-GGSI | 31 | 0.74 ± 0.16 | 0.83 ± 0.1 | |
| HiC-TAD-GGSI | 88 | 0.97 ± 0.022 | 0.97 ± 0.026 | |||
| ≥0.7 Mbp | HiC-GGSI | 25 | 0.7 ± 0.25 | 0.81 ± 0.159 | ||
| HiC-TAD-GGSI | 41 | 0.82 ± 0.107 | 0.83 ± 0.096 | |||
| Species | Experimental Settings | GO Terms Considered for Evaluation | Average of the Best Functional Similarity between True GO Terms and the GO Terms Inferred from: | ||||
|---|---|---|---|---|---|---|---|
| Number of Hi-C Contacts between Gene Pairs | Genomic Distance between Gene Pairs | Network Type | Original Network | Reconstructed Network | Union of Original and Reconstructed Networks | ||
| Mouse | ≥800 | ≥1 Mbp | HiC-GGSI | Top 1 | 0.25 ± 0.0 | 0.27 ± 0.114 | 0.31 ± 0.078 |
| Top 4 | 0.4 ± 0.0 | 0.48 ± 0.193 | 0.46 ± 0.087 | ||||
| HiC-TAD-GGSI | Top 1 | 0.47 ± 0.0 | 0.52 ± 0.025 | 0.51 ± 0.024 | |||
| Top 4 | 0.72 ± 0.0 | 0.82 ± 0.014 | 0.8 ± 0.031 | ||||
| ≥2 Mbp | HiC-GGSI | Top 1 | 0.26 ± 0.0 | 0.43 ± 0.119 | 0.29 ± 0.044 | ||
| Top 4 | 0.38 ± 0.0 | 0.79 ± 0.196 | 0.41 ± 0.057 | ||||
| HiC-TAD-GGSI | Top 1 | 0.45 ± 0.0 | 0.49 ± 0.155 | 0.51 ± 0.052 | |||
| Top 4 | 0.68 ± 0.0 | 0.77 ± 0.216 | 0.75 ± 0.057 | ||||
| ≥1200 | ≥1 Mbp | HiC-GGSI | Top 1 | 0.25 ± 0.0 | 0.34 ± 0.122 | 0.27 ± 0.014 | |
| Top 4 | 0.38 ± 0.0 | 0.61 ± 0.193 | 0.42 ± 0.02 | ||||
| HiC-TAD-GGSI | Top 1 | 0.48 ± 0.0 | 0.53 ± 0.014 | 0.52 ± 0.022 | |||
| Top 4 | 0.73 ± 0.0 | 0.81 ± 0.013 | 0.79 ± 0.029 | ||||
| ≥2 Mbp | HiC-GGSI | Top 1 | 0.27 ± 0.0 | 0.46 ± 0.08 | 0.28 ± 0.014 | ||
| Top 4 | 0.39 ± 0.0 | 0.74 ± 0.098 | 0.41 ± 0.016 | ||||
| HiC-TAD-GGSI | Top 1 | 0.45 ± 0.0 | 0.45 ± 0.048 | 0.47 ± 0.031 | |||
| Top 4 | 0.69 ± 0.0 | 0.8 ± 0.135 | 0.72 ± 0.045 | ||||
| Human | ≥5 | ≥1 Mbp | HiC-GGSI | Top 1 | 0.65 ± 0.0 | 0.79 ± 0.067 | 0.81 ± 0.053 |
| Top 4 | 0.79 ± 0.0 | 0.89 ± 0.048 | 0.9 ± 0.04 | ||||
| HiC-TAD-GGSI | Top 1 | 0.72 ± 0.0 | 0.86 ± 0.0 | 0.86 ± 0.0 | |||
| Top 4 | 0.86 ± 0.0 | 0.94 ± 0.0 | 0.94 ± 0.0 | ||||
| ≥2 Mbp | HiC-GGSI | Top 1 | 0.63 ± 0.0 | 0.71 ± 0.059 | 0.84 ± 0.049 | ||
| Top 4 | 0.78 ± 0.0 | 0.83 ± 0.044 | 0.9 ± 0.033 | ||||
| HiC-TAD-GGSI | Top 1 | 0.68 ± 0.0 | 0.83 ± 0.0 | 0.83 ± 0.0 | |||
| Top 4 | 0.82 ± 0.0 | 0.93 ± 0.001 | 0.93 ± 0.001 | ||||
| ≥10 | ≥1 Mbp | HiC-GGSI | Top 1 | 0.49 ± 0.0 | 0.63 ± 0.106 | 0.82 ± 0.08 | |
| Top 4 | 0.71 ± 0.0 | 0.79 ± 0.064 | 0.9 ± 0.048 | ||||
| HiC-TAD-GGSI | Top 1 | 0.66 ± 0.0 | 0.85 ± 0.0 | 0.85 ± 0.0 | |||
| Top 4 | 0.85 ± 0.0 | 0.93 ± 0.001 | 0.93 ± 0.001 | ||||
| ≥2 Mbp | HiC-GGSI | Top 1 | 0.54 ± 0.0 | 0.65 ± 0.076 | 0.72 ± 0.053 | ||
| Top 4 | 0.69 ± 0.0 | 0.79 ± 0.064 | 0.85 ± 0.047 | ||||
| HiC-TAD-GGSI | Top 1 | 0.58 ± 0.0 | 0.83 ± 0.0 | 0.83 ± 0.0 | |||
| Top 4 | 0.77 ± 0.0 | 0.91 ± 0.003 | 0.91 ± 0.003 | ||||
| Chimpanzee | ≥0 | ≥2 Mbp | HiC-GGSI | Top 1 | 0.42 ± 0.0 | 0.45 ± 0.018 | 0.49 ± 0.026 |
| Top 4 | 0.59 ± 0.0 | 0.64 ± 0.036 | 0.68 ± 0.04 | ||||
| HiC-TAD-GGSI | Top 1 | 0.44 ± 0.0 | 0.5 ± 0.027 | 0.53 ± 0.018 | |||
| Top 4 | 0.62 ± 0.0 | 0.7 ± 0.028 | 0.72 ± 0.007 | ||||
| ≥3 Mbp | HiC-GGSI | Top 1 | 0.41 ± 0.0 | 0.44 ± 0.024 | 0.46 ± 0.031 | ||
| Top 4 | 0.58 ± 0.0 | 0.64 ± 0.036 | 0.65 ± 0.048 | ||||
| HiC-TAD-GGSI | Top 1 | 0.43 ± 0.0 | 0.51 ± 0.026 | 0.52 ± 0.019 | |||
| Top 4 | 0.62 ± 0.0 | 0.71 ± 0.024 | 0.72 ± 0.005 | ||||
| ≥5 | ≥2 Mbp | HiC-GGSI | Top 1 | 0.37 ± 0.0 | 0.38 ± 0.011 | 0.18 ± 0.062 | |
| Top 4 | 0.53 ± 0.0 | 0.54 ± 0.01 | 0.36 ± 0.107 | ||||
| HiC-TAD-GGSI | Top 1 | 0.4 ± 0.0 | 0.44 ± 0.036 | 0.45 ± 0.169 | |||
| Top 4 | 0.58 ± 0.0 | 0.61 ± 0.024 | 0.64 ± 0.158 | ||||
| ≥3 Mbp | HiC-GGSI | Top 1 | 0.42 ± 0.0 | 0.43 ± 0.004 | 0.21 ± 0.076 | ||
| Top 4 | 0.61 ± 0.0 | 0.61 ± 0.005 | 0.37 ± 0.1 | ||||
| HiC-TAD-GGSI | Top 1 | 0.41 ± 0.0 | 0.44 ± 0.04 | 0.72 ± 0.201 | |||
| Top 4 | 0.61 ± 0.0 | 0.62 ± 0.022 | 0.8 ± 0.148 | ||||
| Genes and lncRNAs | |
|---|---|
| TAD 16 | Gene MGI:1861032: retinoic acid early transcript delta |
| LncRNA NONMMUG003194.2 | |
| LncRNA NONMMUG003195.2 | |
| TAD 63 | Gene MGI:1918959: synapse defective 1 |
| LncRNA NONMMUG004081.2 | |
| Gene MGI:106618: tubulin polyglutamylase complex subunit 1 | |
| Gene MGI:103579: mucosal vascular addressin cell adhesion molecule 1 | |
| Gene MGI:99549: granzyme M | |
| Gene MGI:102657: cell division cycle 34 |
Publisher’s Note: MDPI stays neutral with regard to jurisdictional claims in published maps and institutional affiliations. |
© 2022 by the authors. Licensee MDPI, Basel, Switzerland. This article is an open access article distributed under the terms and conditions of the Creative Commons Attribution (CC BY) license (https://creativecommons.org/licenses/by/4.0/).
Share and Cite
Zhao, C.; Liu, T.; Wang, Z. Functional Similarities of Protein-Coding Genes in Topologically Associating Domains and Spatially-Proximate Genomic Regions. Genes 2022, 13, 480. https://doi.org/10.3390/genes13030480
Zhao C, Liu T, Wang Z. Functional Similarities of Protein-Coding Genes in Topologically Associating Domains and Spatially-Proximate Genomic Regions. Genes. 2022; 13(3):480. https://doi.org/10.3390/genes13030480
Chicago/Turabian StyleZhao, Chenguang, Tong Liu, and Zheng Wang. 2022. "Functional Similarities of Protein-Coding Genes in Topologically Associating Domains and Spatially-Proximate Genomic Regions" Genes 13, no. 3: 480. https://doi.org/10.3390/genes13030480
APA StyleZhao, C., Liu, T., & Wang, Z. (2022). Functional Similarities of Protein-Coding Genes in Topologically Associating Domains and Spatially-Proximate Genomic Regions. Genes, 13(3), 480. https://doi.org/10.3390/genes13030480


