Article

Identification of Genomic Regions Associated with Agronomic and Disease Resistance Traits in a Large Set of Multiple DH Populations

1
Ethiopian Institute of Agricultural Research (EIAR), Ambo Agricultural Research Center, Ambo P.O. Box 37, West Shoa, Ethiopia
2
International Maize and Wheat Improvement Center (CIMMYT), ICRAF House, P.O. Box 1041-00621, Nairobi 00100, Kenya
3
International Maize and Wheat Improvement Center (CIMMYT), 12.5 KM Peg, Harare P.O. Box MP163, Zimbabwe
4
West Africa Centre for Crop Improvement (WACCI), College of Basic and Applied Sciences, University of Ghana, Legon, P.O. Box LG23, Accra 00233, Ghana
*
Author to whom correspondence should be addressed.
Genes 2022, 13(2), 351; https://doi.org/10.3390/genes13020351
Submission received: 17 December 2021 / Revised: 8 February 2022 / Accepted: 8 February 2022 / Published: 15 February 2022
(This article belongs to the Special Issue Research on Tropical Food Crop Genomics)

Abstract

:
Breeding maize lines with the improved level of desired agronomic traits under optimum and drought conditions as well as increased levels of resistance to several diseases such as maize lethal necrosis (MLN) is one of the most sustainable approaches for the sub-Saharan African region. In this study, 879 doubled haploid (DH) lines derived from 26 biparental populations were evaluated under artificial inoculation of MLN, as well as under well-watered (WW) and water-stressed (WS) conditions for grain yield and other agronomic traits. All DH lines were used for analyses of genotypic variability, association studies, and genomic predictions for the grain yield and other yield-related traits. Genome-wide association study (GWAS) using a mixed linear FarmCPU model identified SNPs associated with the studied traits i.e., about seven and eight SNPs for the grain yield; 16 and 12 for anthesis date; seven and eight for anthesis silking interval; 14 and 5 for both ear and plant height; and 15 and 5 for moisture under both WW and WS environments, respectively. Similarly, about 13 and 11 SNPs associated with gray leaf spot and turcicum leaf blight were identified. Eleven SNPs associated with senescence under WS management that had depicted drought-stress-tolerant QTLs were identified. Under MLN artificial inoculation, a total of 12 and 10 SNPs associated with MLN disease severity and AUDPC traits, respectively, were identified. Genomic prediction under WW, WS, and MLN disease artificial inoculation revealed moderate-to-high prediction accuracy. The findings of this study provide useful information on understanding the genetic basis for the MLN resistance, grain yield, and other agronomic traits under MLN artificial inoculation, WW, and WS conditions. Therefore, the obtained information can be used for further validation and developing functional molecular markers for marker-assisted selection and for implementing genomic prediction to develop superior elite lines.

1. Introduction

Maize is an important staple food crop in sub-Saharan Africa (SSA) where a large area is under maize production [1]. In east Africa, 82.48 million hectares (m ha) were covered by maize and about 156.21 million tons of maize grain were produced with productivity of 1.89 tons per ha (http://www.fao.org/faostat/, accessed on 2 November 2021). Both biotic and abiotic stresses are the major threats to crop production, particularly maize in SSA. Drought stress, high costs of improved seeds and fertilizers [2], and biotic stresses such as maize lethal necrosis (MLN) disease are the limiting factors for maize production in east Africa.
MLN was first reported in Kenya in 2011 and later reported in Tanzania, Uganda, Rwanda, D.R. Congo, and Ethiopia [3,4,5]. Maize chlorotic mottle virus (MCMV) and sugarcane mosaic virus (SCMV) viruses were the confirmed pathogens that have jointly incited the MLN disease [5,6,7]. Both MCMV and SCMV are transmitted by insect vectors (MCMV by thrips and semipersistent beetles; SCMV by aphids) [5,8]. MCMV has been confirmed for its transmission by seeds and infected soils, making the management of MLN more challenging [6,9,10,11]. Based on the maize plant growth stages and environment conduciveness for MLN causing pathogens, the yield losses ranged from 30–100% [12]. Thus, the management of MLN demands proper identification of resistant germplasm sources and associated genes or quantitative trait loci (QTL) that aid to develop the resistant hybrids or varieties [13].
Doubled haploid (DH) lines allow complete homozygosity over lines developed through pedigree breeding; this allows precision in phenotyping over multiple locations and years [14]. Further, high genetic variance in DH lines enhances response to selection [15] by increasing heritability for various traits. Compared to breeding under well-watered (WW) conditions, the genetic variability, trait heritability, disease resistance, and selection gain are very low for breeding under water stress (WS) conditions [16]; thus, WS condition makes the identification of best genotypes and expression of complex traits. These challenges are designed to be solved through established managed drought tolerance and disease screening facilities, not to lose the genetic variations, and to produce good yield under stress conditions. Understanding the maize crop’s behavior under WS for grain yield and yield-related traits, proper statistical design and breeding scheme help to select the best genotypes under WS environments [16,17].
Advancement in next-generation sequencing tools promoted genome-wide association studies (GWAS) in many crops including maize [18]. Association analysis is based on the non-random association between genotypes and phenotypes of the diverse distantly related individuals [19]. The significance of the marker–phenotype association could be declared when the marker polymorphism is located within the linkage disequilibrium (LD) region. To detect an association of complex traits, a minimum LD average with cut-off point of r2 =0.1 was used [19]. In maize, the rate of LD decay approximated to 1, 2, and 200–500 kb in landraces, diverse inbred lines, and commercial elite inbred lines, respectively [20].
GWAS is useful in allele mining by dissecting the quantitative traits [19]. QTL or gene mapping consists of linkage map construction and identifying genomic regions associated with the targeted QTL [21]. QTL mapping helps to understand the genetic inheritance of quantitative traits [22,23]. Breeding for drought tolerance is complex since the trait is influenced by the environment and many genes with small effects [24]. In maize, about 239 QTLs related to drought tolerance were reported [25,26]. Five drought-tolerant QTLs closely linked to grain yield were reported by Agrama and Moussa [27]. Semagn et al. [2] reported four meta-QTLs associated with grain yield for both under drought and optimum management. The high QTL detection power and fine resolution of mapping are exploited by joint linkage association mapping in multiple biparental populations [28,29,30]. The identification and validation of novel genomic regions associated with economically important traits under WW and WS as well as MLN are important to accelerate the development of climate-resilient improved maize varieties to enhance high maize productions in smallholder families and contribute to food security [12,31,32].
Genomic selection (GS) uses genome-wide markers to predict the breeding values of individuals by trapping the effects of both major and minor genes [33]. In GS, from the training population, the effect of all markers are estimated, and then the genomic estimated breeding values (GEBVs) of the untested but genotyped lines are computed [33]. Lines in the testing population are only genotyped, not phenotyped, and thus important in reducing the breeding cycle and increasing the genetic gain per unit time. GS is effective in several crops over a wide range of marker densities, trait complexities, and breeding populations [34,35,36], where varying levels of prediction accuracy have been achieved in different studies.
To understand how WS affects grain yield and other key traits, this study was performed using a tropical maize population under drought and optimum conditions across multi-location field trials and the MLN effect under artificial inoculation in Kenya. The objectives of the study were to (i) evaluate the large set of 879 tropical and subtropical maize DH lines for their responses to MLN disease severity under artificial inoculation, grain yield (GY), and other yield-related traits under WW and WS conditions; (ii) identify genomic regions and putative candidate genes associated with these traits across the three management conditions; and (iii) assess the potential of GS within management conditions. This study will provide valuable information for uncovering the genetic basis of GY under WW and WS conditions.

2. Materials and Methods

2.1. Plant Materials and Field Trials

In this study, 1462 DH lines from 40 populations were phenotyped in multiple locations under WW, WS, and MLN artificial inoculation conditions. Whereas, among these DH lines, 879 DH lines derived from 26 DH populations were genotyped, for the final analyses, we used only 879 DH lines. There are 26 parental lines were used to develop these DH populations (Supplementary Table S1). Among these, three lines with LapostaSequiaC17 background are known for their drought tolerance, whereas other CIMMYT maize lines such as CML312, CML395, CML442, CML444, and CML539 are commonly used as parents for most of single cross testers of most of commercial hybrids released in east and southern Africa. Additionally, new lines, which showed a better level of resistance for foliar diseases, were also used in a way to bring both biotic and abiotic stress tolerant lines together in a set of lines. The DH lines were crossed to a single cross tester from the opposite heterotic group. All DH lines were formed 17 sets and planted as 17 trials. There were seven commercial checks used, which were repeated in each trial, acting as connecting genotypes for each trial. Both genotypes and checks were replicated two times. The trials were connected by common checks (DK8031, H517, Pioneer30G19, PAN4M19, DUMA43, DH04, and WE1101). All the DH lines were evaluated in 17 connected trials under WW (Kakamega and Kiboko), WS (Kiboko), and MLN (Naivasha) conditions in Kenya. A single row of the plot with 4 m length in two replications was arranged in an α lattice design. Two seeds were planted per hill and thinned to one while 75 cm spacing between rows and 25 cm between plants was used. Eleven commercial checks were used in each trial. All recommended agronomic practices were applied uniformly to each trial.

2.2. Mass Production and Artificial Inoculation of MLN Viruses

The detailed protocol on the preparation of inoculum is explained in earlier studies [12,13,37]. In brief, the stock isolates of MCMV and SCMV pathogens were mass-produced in separately managed greenhouses. The sap extraction of both MCMV and SCMV pathogen inoculum was made using 0.1 mM potassium–phosphate and pH 7.0 extraction buffers in 1:10 ratio and mixed at a ratio of 4 SCMV:1 MCMV to create MLN disease inoculum. The inoculum was sieved using cheesecloth, and then carborundum was added to the mixture of MLN inciting pathogen inoculum at the rate of 0.02 g/mL to create a wound that enhances an attachment and penetration of the virus particles into the host plant. Before field inoculation, the mixture of MCMV and SCMV virus inoculum was checked using the target pathogen-specific antibodies using enzyme-linked immuno-sorbent assay (ELISA). Field inoculation was performed using a backpack motorized knapsack sprayer at the four weeks of plant growth stage after planting, and the second inoculation was made one week after the first spray to keep a uniform inoculation. Two weeks after the second inoculation, the establishment, development, and existence of the MLN disease-causing viruses were rechecked using ELISA kits. The MLN disease severity (MLN-DS) rating scale of 1–9 was used, where 1 is highly resistant with no MLN disease symptoms and 9 is highly susceptible or necrosis symptoms or total death of the plant. The MLN disease data were recorded four times at ten-day- intervals starting from the third week of the post-inoculation. The progress of MLN disease or area under the disease progress curve (AUDPC) was calculated from the recorded MLN-DS data over four time intervals [5,32,38].

2.3. Phenotyping and Data Analysis

The DH lines were evaluated at Kakamega under WW management, Kiboko under both WW and WS at different sites, and Naivasha under artificial inoculation of MLN for two seasons. Grain yield (GY, ton/ha), anthesis date (AD, 50% of pollen shed), silking date (SD, 50 % of silking), anthesis silking interval (ASI, the difference between anthesis and sinking dates), plant height (PH, cm) measured from the ground level to the base of the tassel after milk stage, ear height (EH, cm) measured from the ground level to the node bearing the uppermost ear after milking stage, moisture (MOI, percent moisture content of the grain at the time of harvesting using moisture meter), senescence (SEN, percent leaves lost chlorophyll to green leaves at the mid-silking), grey leaf spot (GLS, recorded using 1–9 scale), turcicum leaf blight (TLB, measured using 1–9 rating scale), common rust (CR, recorded using 1–9 rating scale), and MLN-DS (measured using the rating scale of 1 to 9 score) were recorded and analyzed. All the traits were phenotyped in all the trials but not in all the management conditions. For example, AD, ASI, EH, PH, MOI, and GY traits were phenotyped under both WW and WS; TLB, GLS, and CR under WW; SEN and ER under WS; and MLN-DS and AUDPC under MLN management conditions.
Statistical model fitting for different traits was checked by plotting the histogram with standardized residuals. A plot of residuals against fitted values has shown that the residuals were symmetrically distributed with constant variance for all traits; thus, the data were not transformed. The phenotypic traits were analyzed with the restricted maximum likelihood (REML) method designed in the multi-environment trial analysis (META) R software developed in CIMMYT [39]. The following mixed model was used for across environments data analyses.
Y i j k l = μ + G i + L j + G L i j + R L k j + B R L l j k + e i j k l  
where: Y i j k l is the phenotypic observation at the ith genotype, jth environment in kth replication of the lth incomplete block, μ is overall means, Gi is the genetic effect of the ith genotype, Lj is the effect of the jth environment, G L i j is genotype by environment interaction, R L k j is the effect of the kth replication at the jth environment, B R L l j k is the effect of the lth incomplete block in the kth replication at the jth environment, and e i j k l is the residual. The selected traits’ broad-sense heritability (H2) was calculated as follows:
H 2 = σ G 2 / ( σ G 2 / σ G 2 + σ G x E 2 L + σ e 2 L R ) ,
where σ G 2 , σ G x E 2 , σ e 2 , L, and R referred to the genotypic, genotype by environment interaction, error variance, environment, and replication, respectively. Best linear unbiased estimates (BLUEs) and best linear unbiased predictions (BLUPs) for all traits were calculated. The traits phenotypic distribution and Pearson’s correlation coefficient were performed and displayed using R scrips (http://www.R-project.org, accessed on 17 November 2021).

2.4. Genotypic Data Analyses

All 879 DH lines were genotyped with a high-density genotype by sequencing (GBS) platform using the pre-developed protocol at the Institute for Genomic Diversity, Cornell University, Ithaca, USA [2,31,40]. DNA was extracted from the young leaves using the cetyltrimethylammonium bromide (CTAB) method [41]. Raw GBS data had a total of 955,120 SNPs loci distributed across maize genome. The raw GBS SNPs data were imputed by default parameter filling methods [24,42]. Different filtering criteria were applied to the raw data to obtain input data for LD and GWAS analyses. For LD, the raw data were filtered based on no missing data and >10% minor allele frequency (MAF). The BLUPs for the selected traits (MLN-DS, AUDPC, AD, ASI, GY, EH, MOI, SEN, and PH) across environments were used for the GWAS study. SNPs quality screening was performed using trait analysis by association, evolution, and linkage (TASSEL v.5.2.24) software [43] by filtering and discarding the SNPs with a <0.05 of MAF and heterozygosity of >0.05, resulted into 226,940 SNPs. SNPs and physical distance between SNPs were used to detect genome-wide LD [44]. LD decay was calculated at r2 = 0.2 and r2 = 0.1 using average pairwise distance, where the nonlinear model r2 was used [45,46]. Scatter plots and fitted smooth curves for estimating LD decay were plotted using the LOESS function in R [47].

2.5. Population Structure and GWAS

The genetic relationship tree construction for 879 DH lines was performed using Darwin 6.0.21 software. At the first step, the genetic distance matrix was calculated based on the mean Euclidean method where homozygote 100 and heterozygote 50% similarity were considered. Secondly, the unweighted neighbor-joining clustering method was employed to construct the diversity tree of the genotypes. The population structure of 879 DH lines, which had both phenotypic and genotypic data, were analyzed and sub-grouped using structure software 2.3.4 version with 6745 SNPs [48,49] based on the variability of allele frequencies both within and between populations genetic distance. The number of discontinuous population structure clusters (K) was predicted from one to five with ten iterations. The true number of population structure clusters (delta K value) were harvested online using an available structure harvester software based on the highest ln P(D). The unique population genetic subcluster was represented by each color bar at a p = 0.001. The period of length of burn-in was set to 10,000, and Markov Chain Monte Carlo (MCMC) values were set to 10,000 cycles [48].
GWAS analysis was performed with the R package “FarmCPU—Fixed and random model Circulating Probability Unification” [50]. GBS marker data in the “hapmap” format were converted to numeric (0, 1, 2) with the “GAPIT” package [51]. The first three principal components (PCs) obtained from TASSEL [43] were used as an input for GWAS in FarmCPU. The kinship matrix was calculated with the default kinship algorithm. The analysis was performed with a maxLoop of five, p threshold of 0.01, a quantitative trait nucleotide (QTN) threshold of 0.01, and a MAF threshold of 0.05. The maxLoop refers to the total number of iterations used. The p values selected into the model for the first iteration, the p-value selected into the model from the second iteration, and the minimum MAF of SNPs used in the analysis refers to the p threshold, QTN threshold, and MAF threshold, respectively. To determine the significance threshold, multiple testing correction was conducted where the total number of tests was estimated based on the average extent of LD at r2 = 0.1. Concerning the above, the significant associations were declared when p values in independent tests were less than 9 × 10⁻⁶ [38,52]. The Blast search against maize reference genome “B73” was performed for the significant SNPs; subsequently, the candidate gene adjacent or exactly in the same position with the significant SNPs identified and annotated and the candidate gene biological function described for each of the studied target traits (http://blast.maizegdb.org/home.php, accessed on 23 November 2021; http://www.maizegdb.org, accessed on 23 November 2021). CurlyWhurly Version 1.19 was used to plot and visualize the first three analyzed PCA components (https://ics.hutton.ac.uk/curlywhirly/, accessed on 19 November 2021).

2.6. Genomic Predictions

The phenotypic traits BLUEs were used for the GS analysis. Ridge-regression BLUP (RR-BLUP) with five-fold cross-validation was applied. From the GBS data, a subset of 6745 SNPs distributed uniformly across the genome, with no missing values, and minor allele frequency >0.10 were used for GS in GWAS panel under different management conditions. Details of the implementation of the RR-BLUP model are described in Zhao et al. [36]. We applied a five-fold cross-validations ‘within population’ approach, where both training and estimation sets were derived from within the association panel under different management conditions. The prediction accuracy was calculated as the correlation between genomic estimated breeding values (GEBVs) and the observed phenotypes. A sampling of the training and validation sets was repeated 100 times for each approach.

3. Results

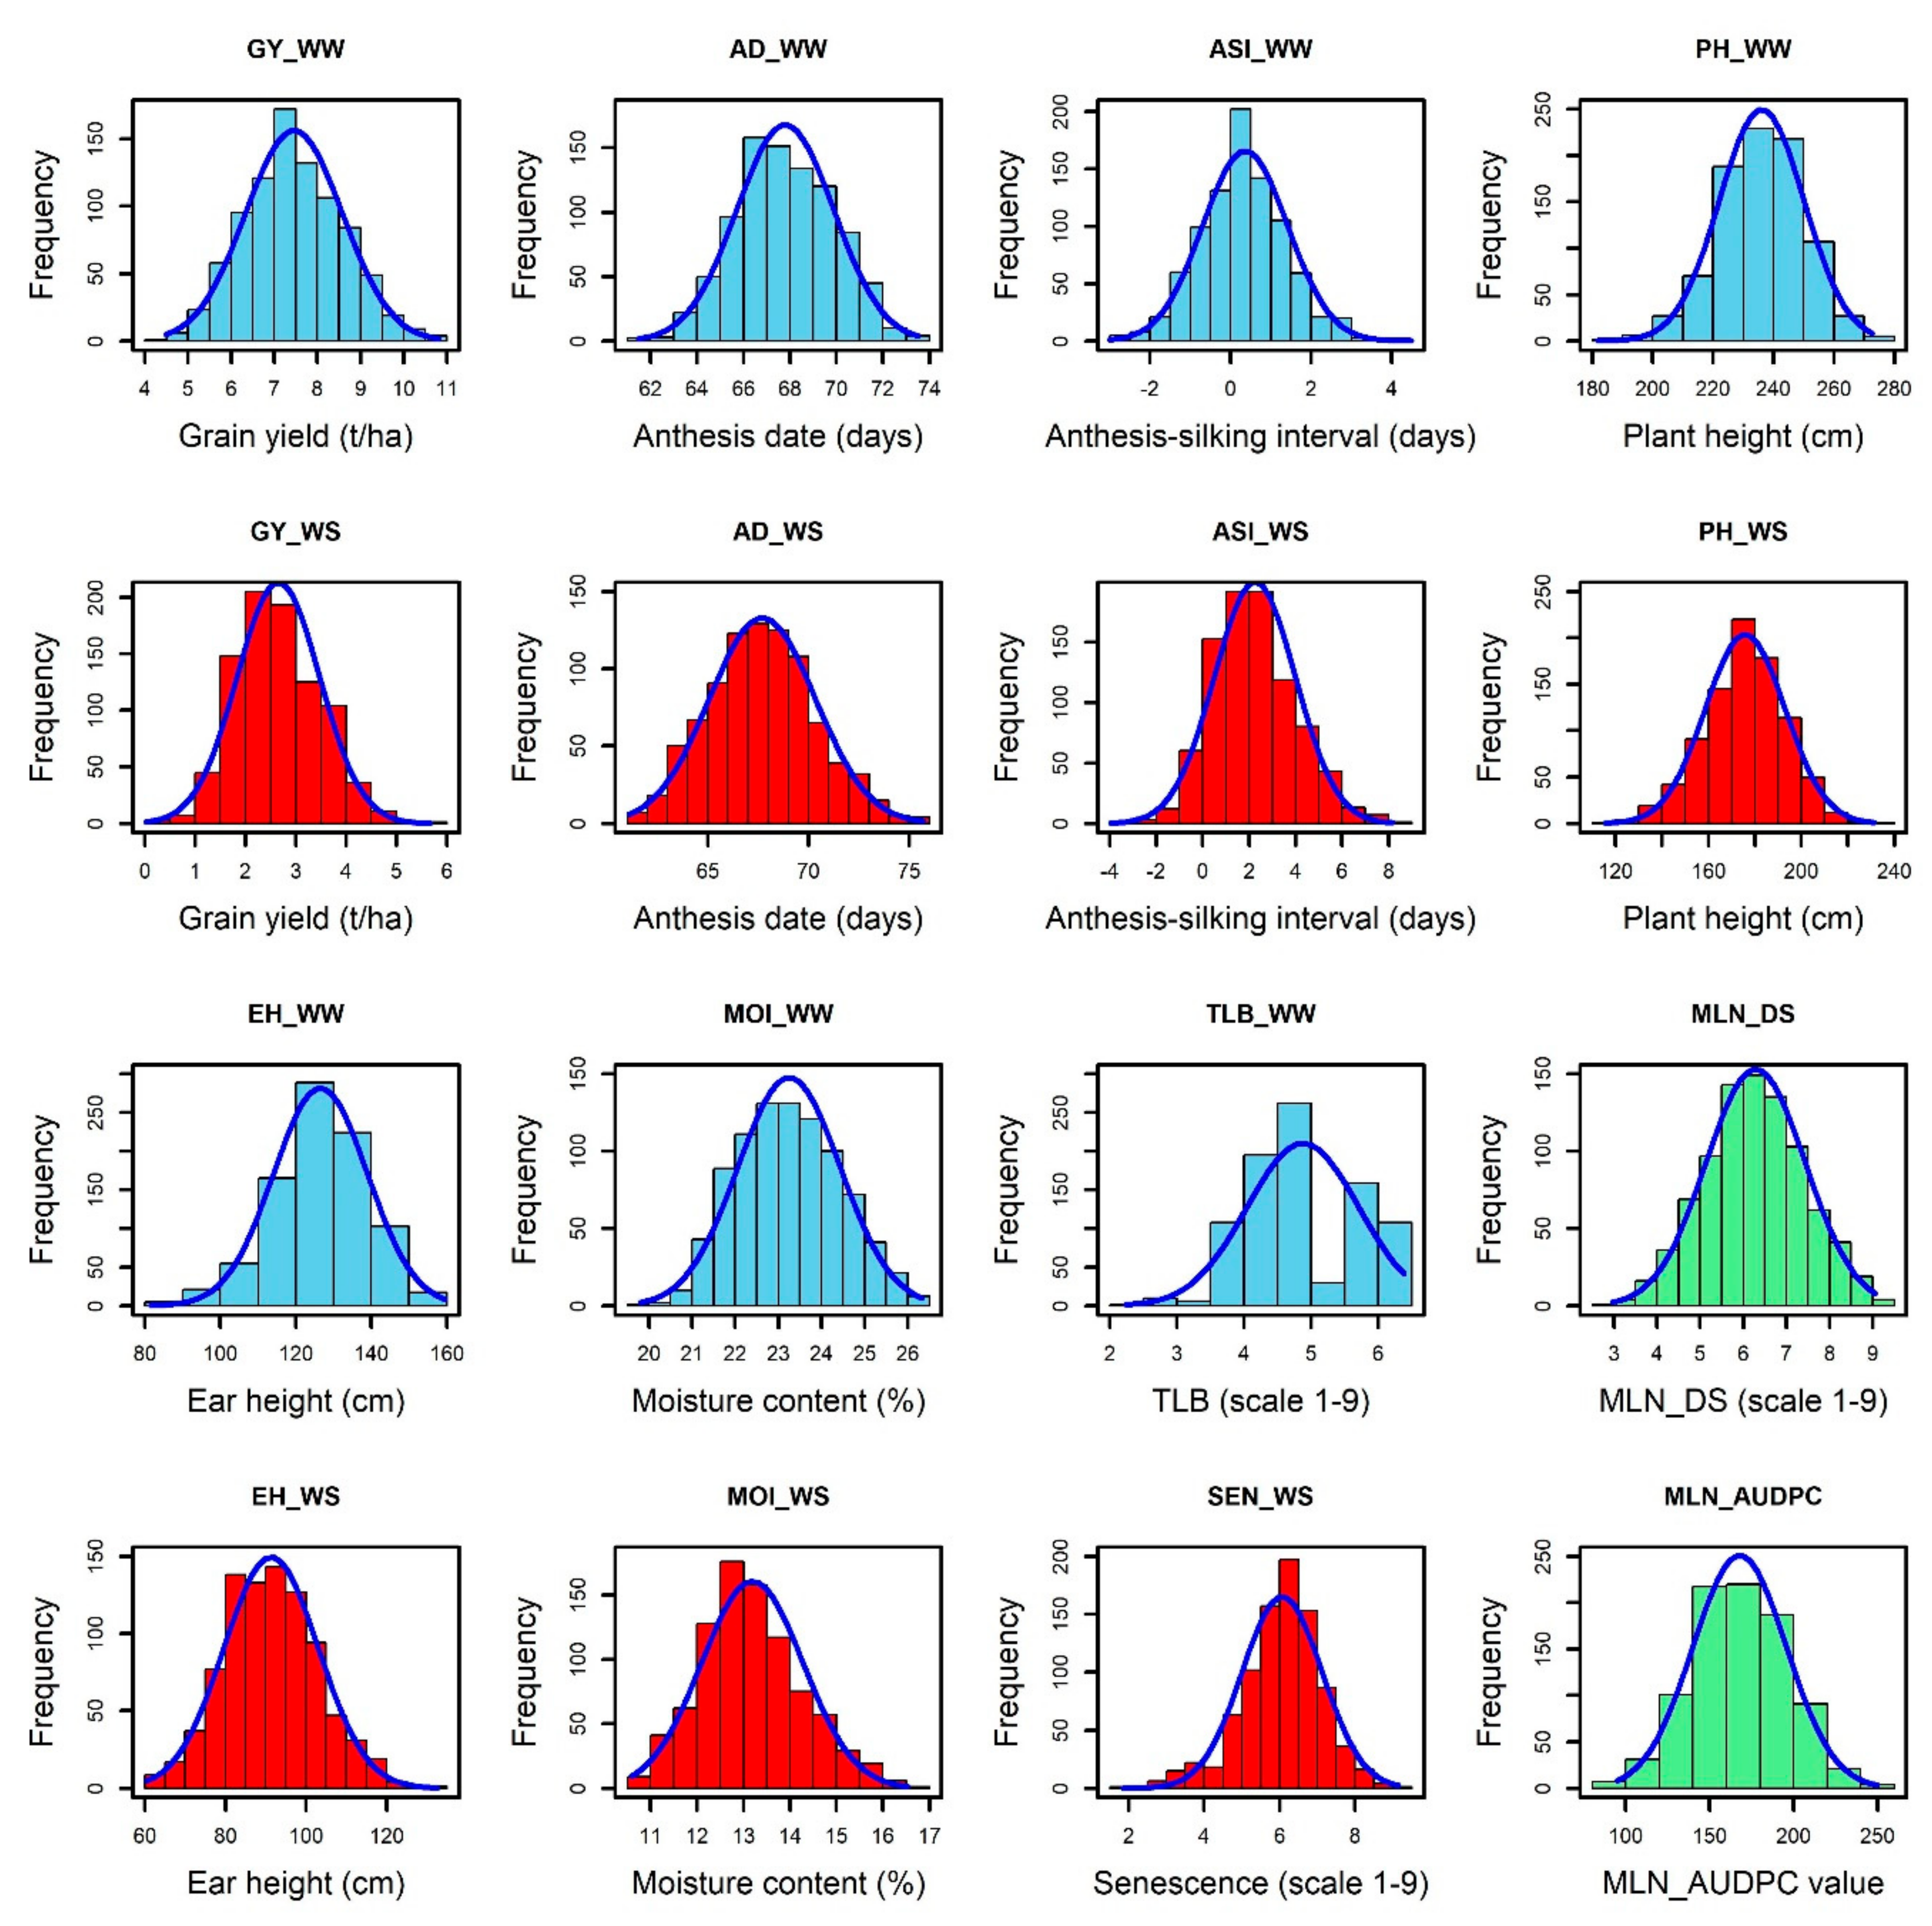
3.1. Phenotypic Variations and Correlations

The normal distribution was observed for each trait under WW and WS conditions (Figure 1). The analysis of variance revealed significant genotypic variance (Table 1) for the studied traits: MLN-DS and AUDPC under MLN management and GY, AD, ASI, PH, EH, TLB, MOI, CR, SEN, and GLS traits measured under WW and/or WS management. The variation for GY ranged from 4.35 to 11.66 tons/ha (mean = 7.54 t/ha) under WW condition and from 0.03 to 5.67 tons/ha (mean = 2.7 t/ha) under WS conditions (Table 1). The mean performance for AD showed 0.41 days earliness under WS compared to WW conditions. The range is higher for ASI under WS (−3.95 to 8.17 days) compared to WW (−3 to 4.5 days) conditions. The mean of PH and EH were reduced significantly under WS compared to WW conditions. Further, the range of distribution reduced drastically for SEN under WS. The META R combined analyses result revealed that the studied genotypes had a wide range of responses against the MLN-DS ranging from 2 to 9 (Figure 2, Table 1). GY had moderate broad-sense heritability (H2) under both WW and WS conditions, while MLN-DS and TLB had relatively high H2 with 0.67 and 0.80, respectively.
Under WS management, the genotypes CKDHL140940, CKDHL142056, CKDHL142091, CKDHL141377, and CKDHL142061 had produced the highest GY values of 5.67, 4.91, 4.85, 4.81, and 4.77 t/ha, respectively. The genotype CKDHL140037 had a lesser AD (62.11 days) than the grand mean (67.55 days) and the best check Duma43 (62.68 days). Genotype CKDHL140091 has shown 0.38 days less than the best check (0.74 days) and grand mean (2.28 days). Comparatively, plant height (185.55 cm), which is not too tall or short, was obtained in the genotype CKDHL140125, even though it was slightly higher than the best check KD8031 (183.88 cm) and grand mean (176.40 cm). Under WW management, the genotype CKDHL141097 was performed better than the best check CML444 and overall mean, which had the GY values of 9.17, 7.20, and 8.28 t/ha, respectively. An AD (65.93 days) was recorded in the CKDHL140933 genotype, which was earlier than the overall mean (67.78 days) and comparable to the best check Duma43 (64.47 days) under WW management. Similarly, the genotype CKDHL140876 had a good ASI of 0.37 days lesser than the grand mean (0.42 days) but not better than the check CZL04003 (0.35 days). About 52 DH lines were rated from two to four and have depicted the resistance reactions against the MLN-DS, while 735 DH lines rated from four to seven were grouped as moderately resistant, and the remaining 92 DH lines had seven to nine values and were grouped as susceptible genotypes (Figure 2).
The phenotypic traits correlation analysis was performed independently for genotypes evaluated under both WW and WS management conditions. Significant strong positive correlations were observed between PH and EH both under WW and WS management, which was 0.71 and 0.80, respectively (Figure 3). EH and PH traits have revealed a positive correlation with GY that had the correlation values of 0.17 and 0.38 under WW management and 0.27 and 0.49 under WS management, respectively (Figure 3A,B). This positive correlation has indicated that an increase in EH and PH increased the GY to certain extent. AD had significant positive correlations with ER under WW (0.56) and MOI under WS (0.34) managements. Both AD and ASI were negatively correlated both under WW (−0.32) and (−0.23) WS environments. TLB under WW and SEN under WS management had slight negative correlations of −0.29 and −0.40, respectively, with GY that may have played a vital role in proportional yield reduction. Similarly, SEN had negative correlation (−0.29) with PH under the WS environment. MOI has depicted a negative correlation (−0.23) under WW with GY (Figure 3A,B).

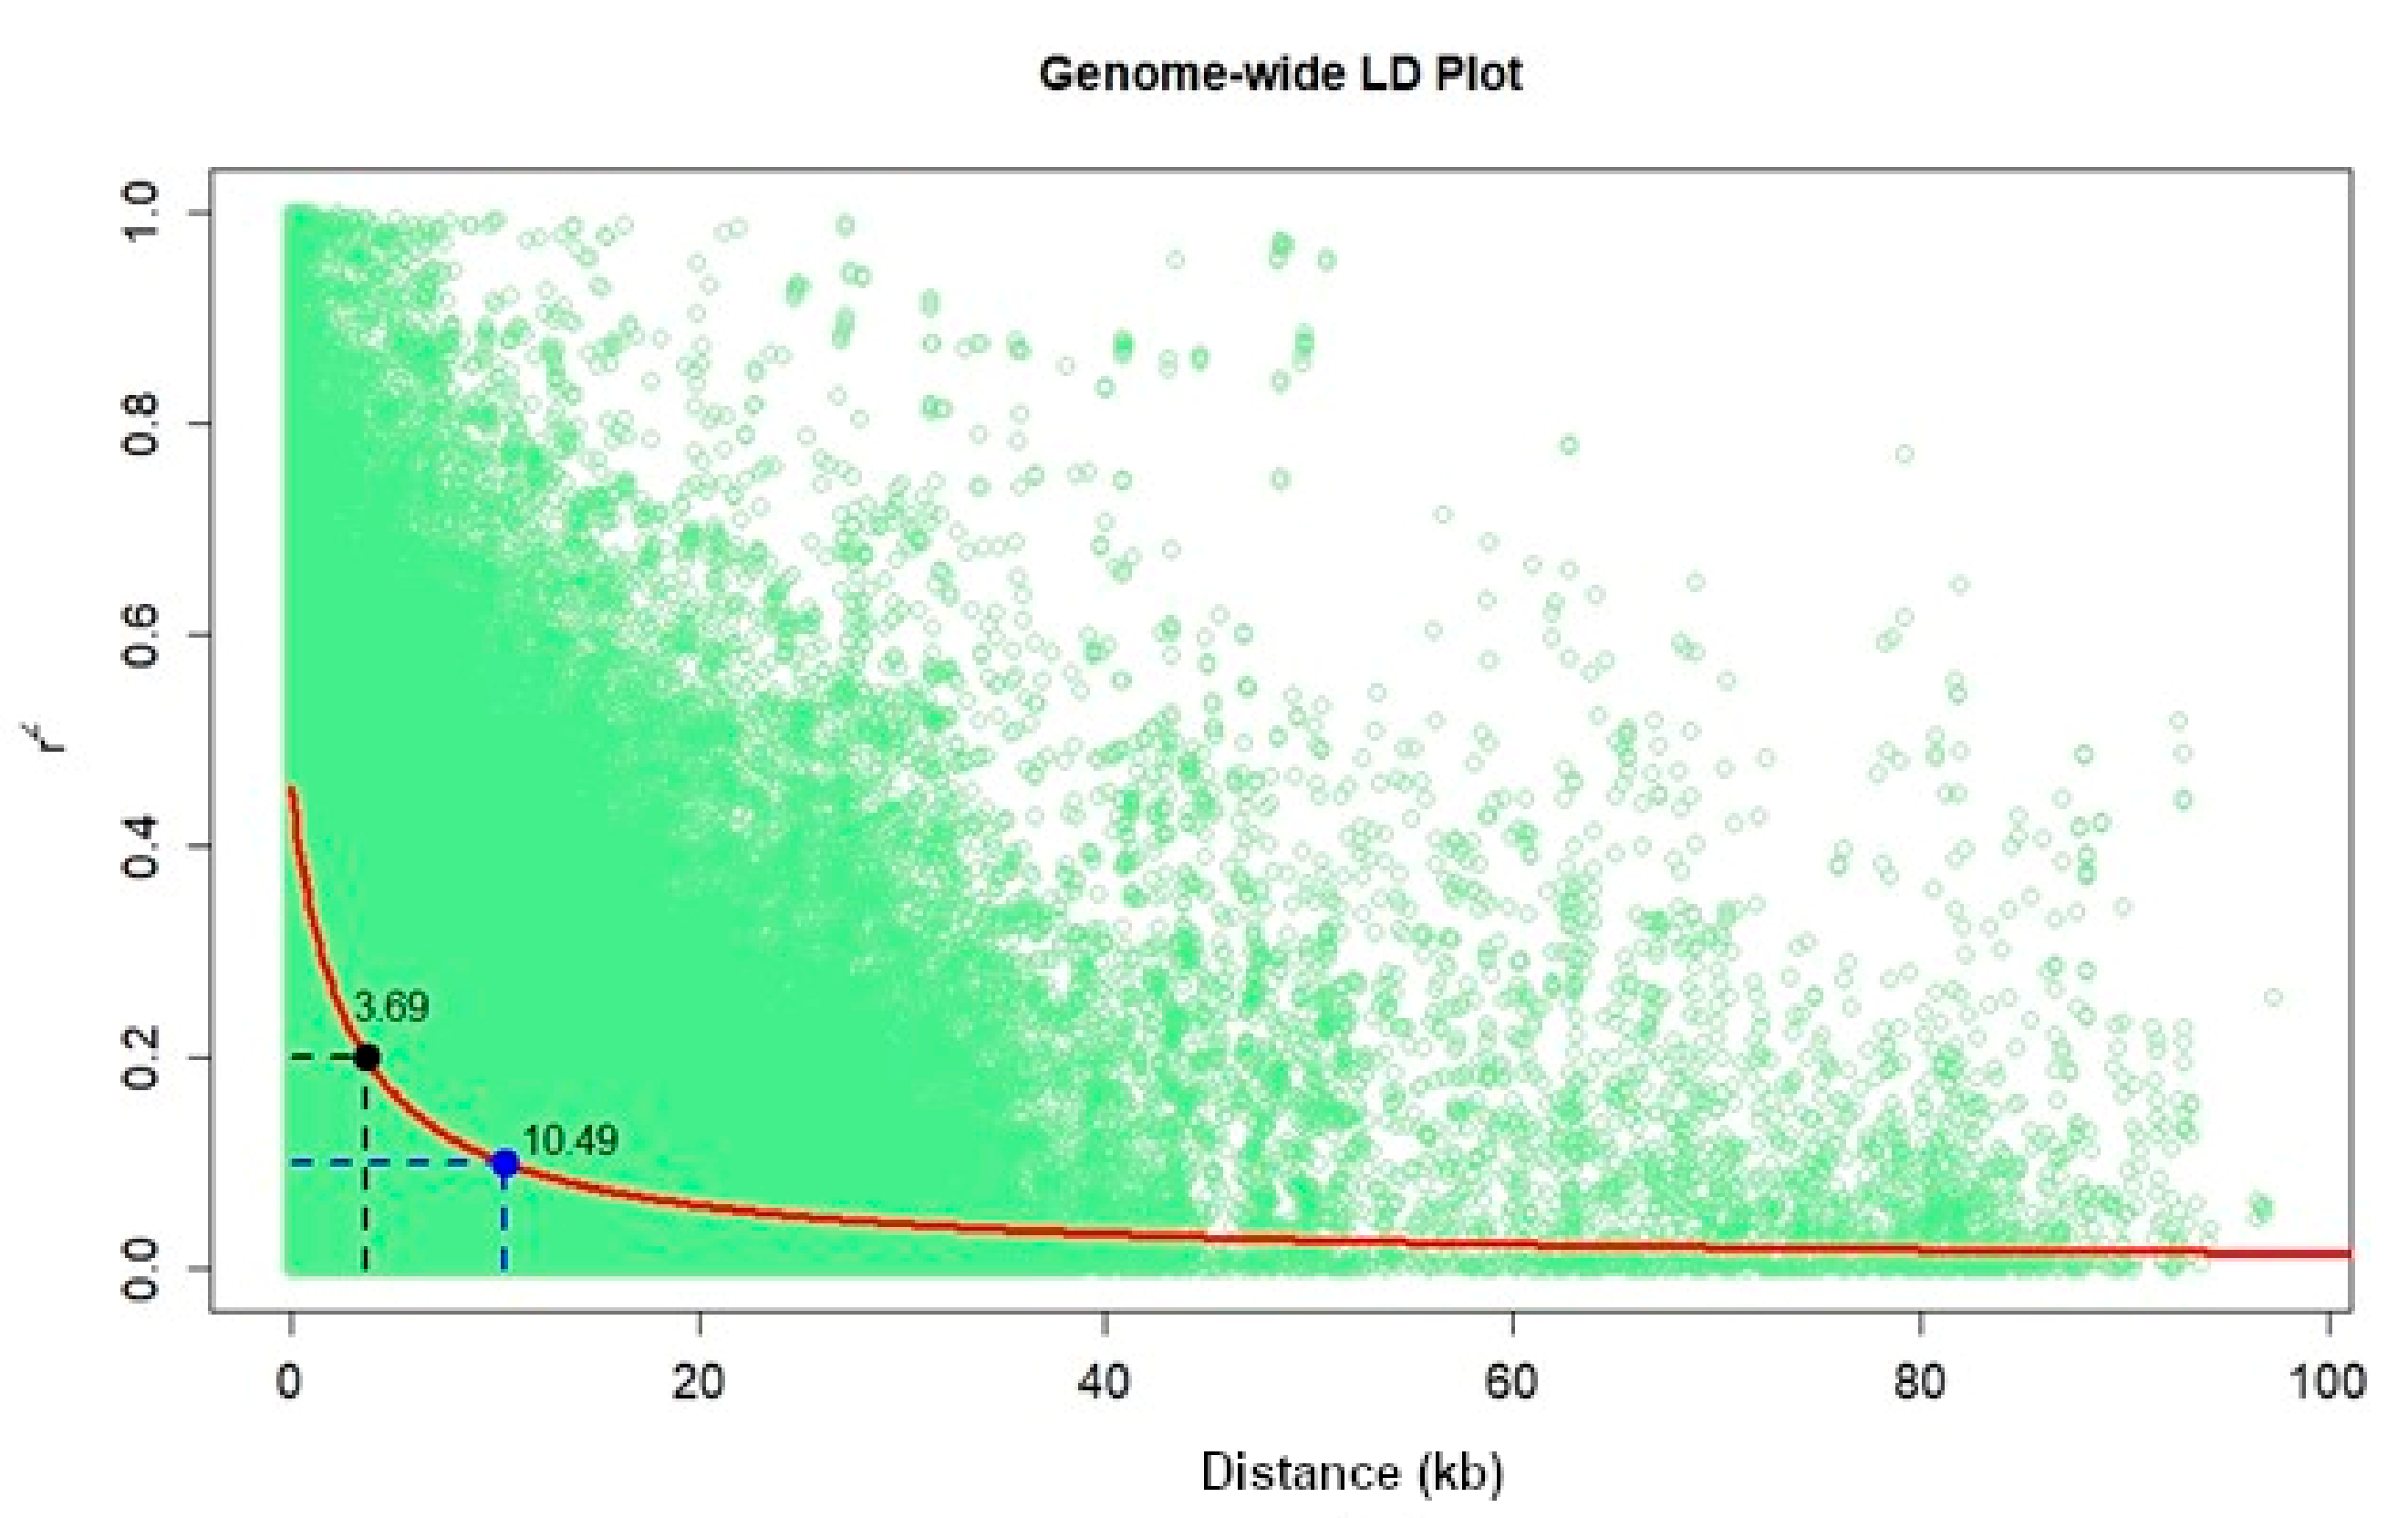
3.2. Genetic Relationship, Population Structure, and Linkage Disequilibrium
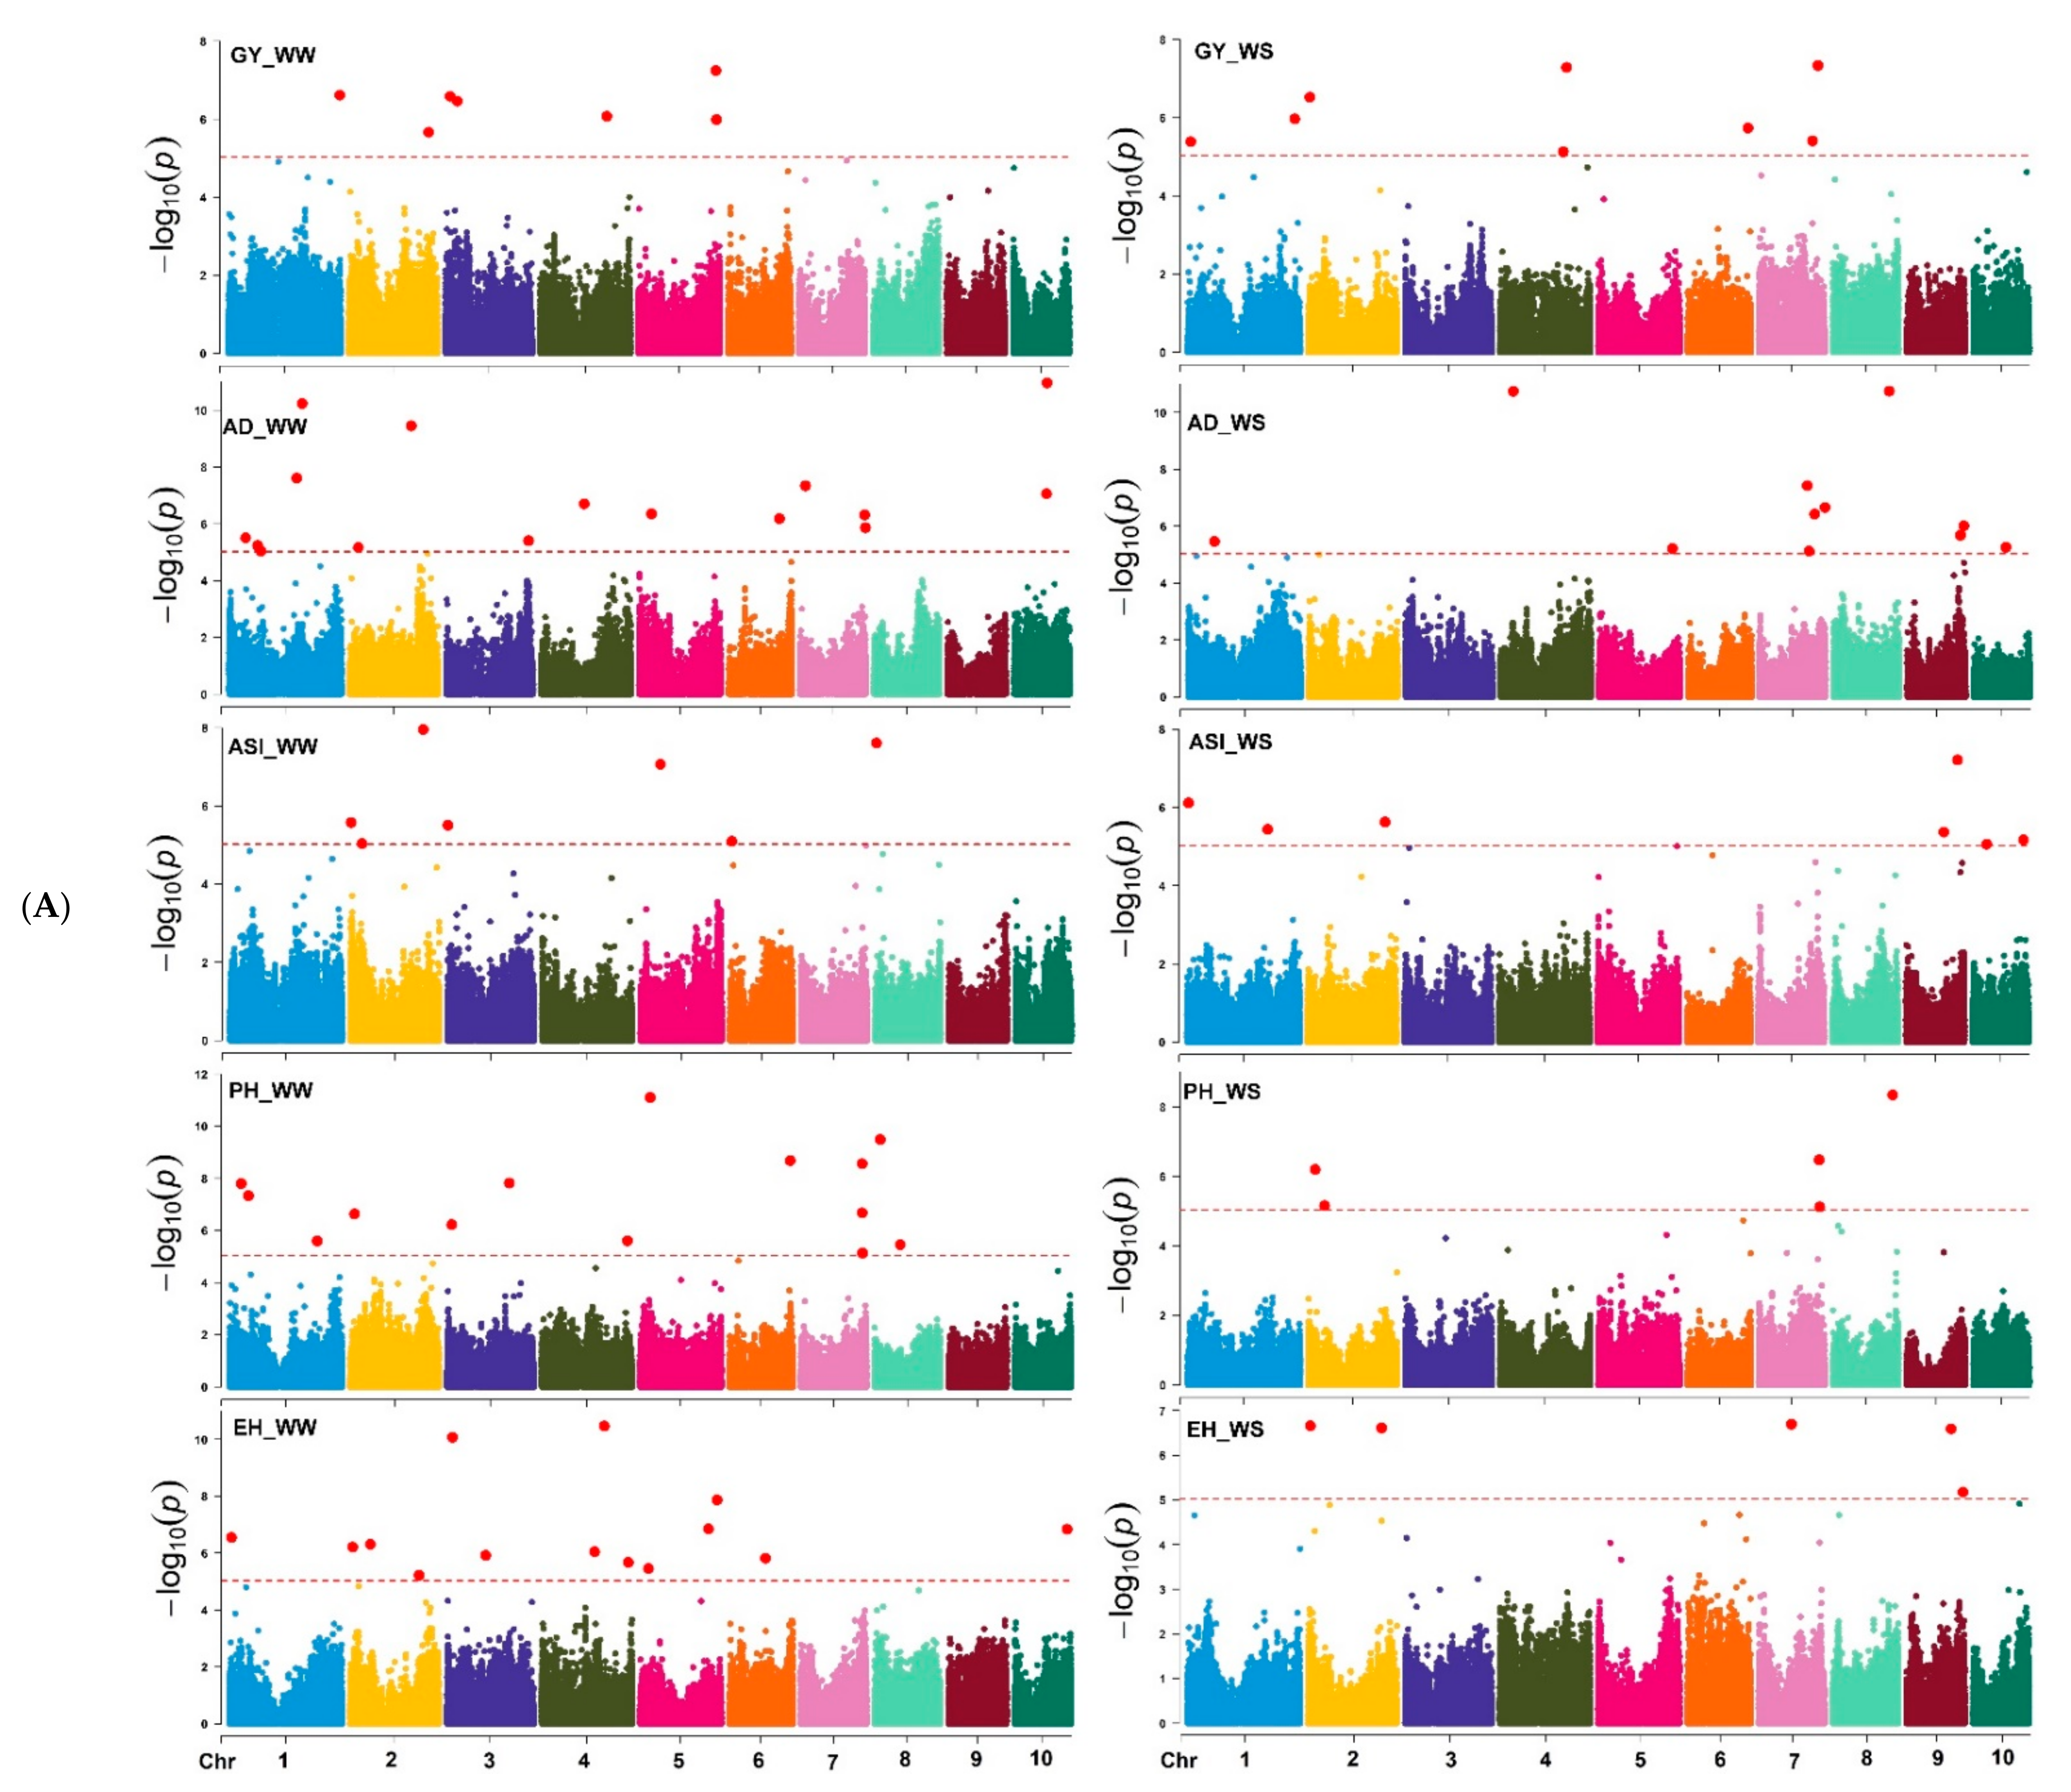
The selected markers distribution was graphically presented in Supplementary Figure S1. A kinship matrix was developed that depicts the relatedness among the used DH lines (Supplementary Figure S2). Population relationship analyses in Darwin’s software had displayed the neighbor-joining of 879 DH lines dissimilarity tree, which was constructed based on the genetic distance matrix of 0.01 calculated by the Euclidean method. The total populations were clustered into three main diverse groups with many subtrees (Supplementary Figure S3). The first population diversity group had DH lines derived from CML395/CML505, which has contained about 440 individuals represented by red, the second group had LaPostaSeq C7-F64 as a common parent with 174 individuals represented by blue, and the third group had DH lines having one of either LaPostaSeq C7-F86 or LaPostaSeq C7-F18 as common parent with 265 DH lines represented by a purple color (Supplementary Figure S3).
Population structure analyses revealed delta K probability value with three to four clusters of 879 DH lines based on the highest ln P(D) values (Figure 4). An Evanno table was constructed in the structure harvester with the highest values of 204,444.45 ln P(K), 156.41 standard deviations ln P(K), and 1307.01 delta K. The delta K value-based line plot had suggested that the population could be structured into two to four groups (Figure 4). Pair-wise markers LD decay was measured as the r2 and plotted against their distance. LD sliding window type with 11,225 comparisons were obtained from adjacent markers, while each dot represented a pair of distances between two markers on the window and their squared correlation coefficient. The LD decay cut-off point (r2) at 0.2 and 0.1 had 3.69 and 10.49 Kbs average physical distance, respectively (Figure 5).
Based on principal component analyses all the DH lines were broadly categorized into three groups: Category One (215), Category Two (223), and Category Three (441) based on the displayed plot (Supplementary Figure S4). The populations CML444/LaPostaSeqC7-F64, CML395/CML505, CML538/LaPostaSeq C7-F18, CML442/ LaPostaSeqC7-F86, CML537/LaPostaSeqC7-F18, CML539/LaPostaSeqC7-F64, CML442/INTA-F2-192, and CML539/INTA-F2-192 were grouped into Category One, while CZL04003/LaPostaSeqC7-F18, CML538/ LaPostaSeqC7-F64, INTA-F2-192/LaPostaSeqC7-F18, CML537/LaPostaSeqC7-F86, CML536/LaPostaSeqC7-F18, CML539/LaPostaSeqC7-F64, CZL04003/LaPostaSeqC7-F86, CML445/LaPostaSeqC7-F64, CML536/LaPostaSeqC7-F64, CML444/LaPostaSeqC7-F86, CML312/LaPostaSeqC7-F64, and CML538/ CL-G1628 G16BNSeqC0F118 populations were grouped under Category Two; similarly, LPSC7-F180/ Katumani, Ry x CML395, WL429-40/[CML444/DRB-F2//DTPWC8F3], CML395/CML505, WL429-40/ [CML444/DRB-F2//DTPWC8F3], L118 6/[CML312/CML444//[DTP2WC4H255/LATA-F2], and I-38 x CML442 populations were grouped into Category Three (Supplementary Figure S4 and Supplementary Table S1). The first four principle components explained 10.51%, 7.63%, 6.16% and 3.19% of the total variation (Supplementary Figure S4).

3.3. GWAS Results

Based on the marker p-value at the significance threshold cut-off (p = 9 × 10⁻⁶), the marker positions, putative candidate gene, and its biological function were annotated for each trait. The GWAS results for all traits are summarized using Manhattan plots (Figure 6A,B) and QQ plots (Supplementary Figure S5). The GWAS analyses identified SNPs associated with the studied traits, i.e., 7 and 8 SNPs were associated with GY; 16 and 12 SNPs with AD; 7 and 8 SNPs with ASI; 14 and 5 SNPs with EH; 14 and 5 SNPs with PH; and 15 and 5 with MOI under WW and WS management, respectively (Table 2 and Supplementary Table S2). Similarly, 14 and 11 SNPs were associated with GLS and TLB resistance under WW environments, respectively. Under the WS environment, 11 SNPs were associated with SEN, whereas 12 and 10 SNPs associated with MLN-DS and AUDPC traits, respectively, under MLN artificial inoculation (Table 2 and Table 3). Some of the SNPs that had the highest significance value were closely associated with the putative genes governing the studied target traits (Supplementary Table S2).
The most closely associated and identified SNPs to the studied traits on different chromosomes and their position on the chromosomes are the SNPs S5_206615806 and S7_157468954 on chromosomes 5 and 7 linked to GY (Table 4), S8_148392640 and S10_88394535 on chromosomes 8 and 10 linked to AD; S2_194040196 and S9_136924349 on chromosomes 2 and 9 to ASI (Table 5), S5_27226539 and S8_158986117 on chromosomes 5 and 8 to PH, S4_166924899 and S7_87194068 on chromosomes 4 and 7 to EH (Table 6), and S8_162561752 and S5_200299111 on chromosomes 8 and 5 to MOI (Supplementary Table S2) under WW and WS environments. The SNPs S1_87301408 and S1_92348483 on chromosome 1 were associated with the GLS and TLB resistance, whereas S3_205474517 SNP was associated with the SEN trait under the WS environment. Under MLN artificial inoculation, the SNPs S3_184235364 and S1_22259426 were among the best marker associated with MLN-DS and AUDPC values, respectively (Table 3, Table 4, Table 5 and Table 6 and Supplementary Table S2).

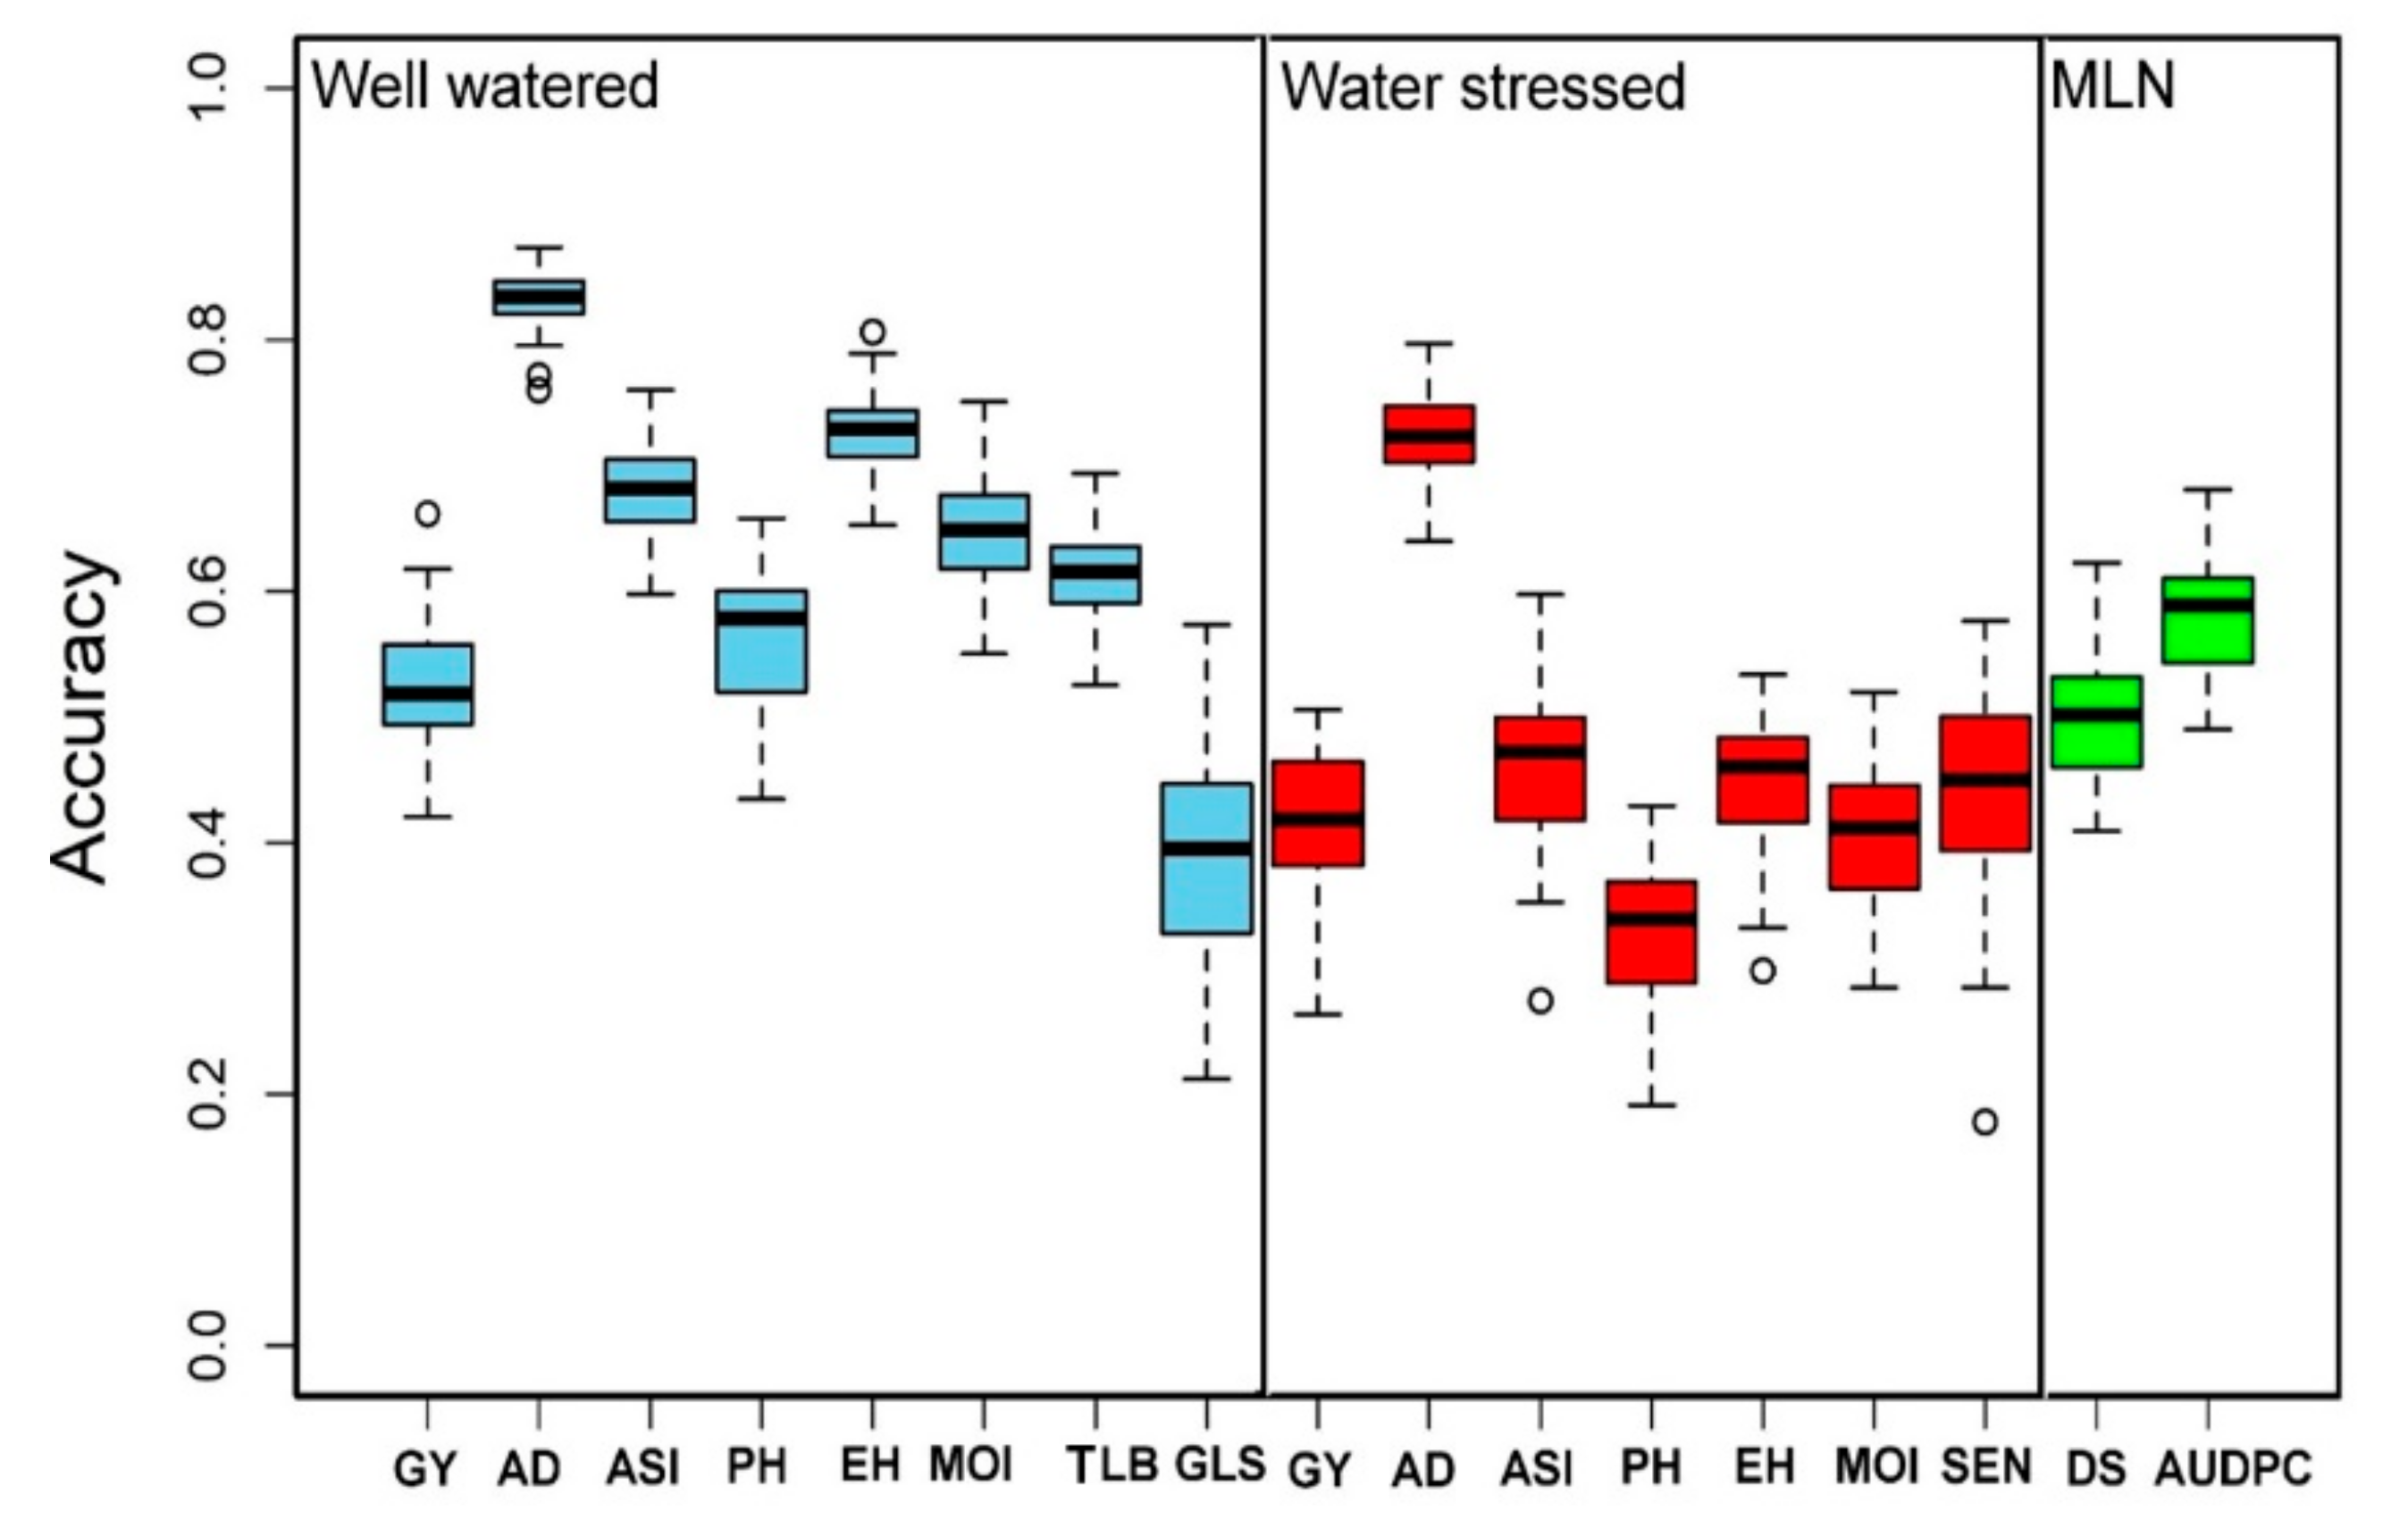
3.4. Genomic Prediction

The selected and measured traits under WW, i.e., GY, AD, ASI, EH, PH, MOI, GLS, and TLB, had the genomic prediction accuracy values of about 0.53, 0.83, 0.68, 0.73, 0.56, 0.65, 0.39, and 0.61, respectively; while the phenotypic traits measured under WS, i.e., GY, AD, ASI, PH, EH, MOI, and SEN, had a genomic prediction accuracy values of about 0.42, 0.72, 0.46, 0.33, 0.45, 0.41, and 0.45, respectively (Figure 7). Similarly, under MLN artificial inoculation, both MLN-DS and AUDPC had 0.50 and 0.58 of genomic region prediction accuracy, respectively (Figure 7). AD depicted the highest genomic prediction accuracy under both WW and WS conditions, whereas the genomic prediction accuracy for the GY under both WW and WS environments was moderate at 0.50.

4. Discussion

MLN is the major challenge to maize production in SSA, specifically in east African countries. CIMMYT in collaboration with national research institutions has developed resistance breeding strategies against MLN. A large number of maize genotypes were screened, and MLN disease-resistant source materials and resistance QTLs were identified to develop resistant varieties by integrating both conventional and molecular breeding techniques [12,31,37,38]. Nevertheless, searching additional MLN disease-resistant lines, evaluation of the genotype’s performance, identification and validation of QTLs associated with the target disease, GY, and other related traits play a vital role in the development of MLN disease-resistant varieties. In this study, 879 maize DH lines derived from 26 different populations were genotyped, and the performance of genotypes were evaluated under WW, WS, and MLN artificial inoculation management conditions. Among these 879 lines, 440 DH lines shared LapostaSeqC7 background lines as one of the parent, and the line LapostaSeqC7-F64 alone used as one of the parent to develop >250 DH lines, so, data was analyzed combinedly rather making it into subgroups based analyses.
A significant genotype, genotype by environment interaction variances, and moderate to high broad-sense heritability were observed for GY and other related traits AD, ASI, PH, EH, TLB, MOI, and GLS measured under WW and WS conditions similar with the results reported by Yuan et al. [24]. MLN-DS and AUDPC were highly heritable with 0.67 and 0.74, respectively, which is consistent with earlier reported studies [31,37,53,54]. Several genotypes have been evaluated by CIMMYT against MLN disease in search for resistant materials [12,24,31,32,38,55]; with the current study, we identified about 52 MLN disease resistant/tolerant genotypes while most of other genotypes were susceptible. Some of the maize genotypes with a score from 2 to 3 against MLN-DS were CKLMLN145667, CKLMLN145667, CKLMLN144135, CKLMLN145119, CKLMLN145173, CKLMLN143806, and CKLMLN143351, which could be selected as resistant materials to MLN disease. The mean performance of lines for GY was 7.54 t/ha and 2.7 t/ha under WW and WS environments, respectively, which has revealed a similar result in earlier study [56]. The GY had positive correlations with both EH and PH and negative correlations with ASI and MOI under WW and WS management, respectively, which could help in an indirect selection for the GY under WW and WS conditions [24].
The number of SNPs required to achieve maximum mapping resolution depends on the magnitude of LD and LD decay with genetic distance [57]. For GWAS, a large population is required since the LD or correlation between alleles in different genomic locations is generally based on the historical recombination between polymorphisms. In this study, we observed that the LD decay at r2 = 0.1 and 0.2 cut-offs were 10.49 and 3.69 kb, respectively. Similarly, [54] in the IMAS association panel also reported the genome-wide average LD decay of 14.97 kb at r2 = 0.1 and 5.23 kb at r2 = 0.2 [54], and a similar range of LD decay was also reported by Rashid et al. [58] in their association panel. LD decay in tropical maize germplasm was rapid compared to the temperate germplasm; possibly due to a broader genetic base, resulting from high recombination events [59]. This provides an opportunity for breeders to select germplasm that integrates high GY with disease resistance and abiotic stress tolerance.
For population structure analyses, the Delta K line plot, principal component analyses, and population genetic distance relationship analyses suggested that the utilized DH populations are structured into three to four groups. In STRUCTURE, the optimum number of subgroups was determined based on the output log-likelihood of data (LnP (D. The peaks of the line plot (Figure 4) suggest that the population could be divided into three or four distinct groups in order of possibility, with the K = 4 of delta K intersecting with LnP (D) showing a higher possibility. When K = 4, all lines were grouped as a mixed group and were further divided into three groups. The DH populations used in this study were grouped into CML395/CML505 derived DH lines, LaPostaSeq C7-F64 derived DH lines (174 individuals), and LaPostaSeq C7-F86 and LaPostaSeq F18 derived DH lines (265 individuals) (Figure 4). Due to the inclusion of DH lines derive from crosses of selected inbred lines in the panel, we observed moderate structure in the present study. Several researchers also been reported moderate structure in the tropical maize germplasm [29,31,37,53,54,60].
In this study, we identified the significant SNPs associated with target traits under WW, WS, and MLN artificial inoculations (Table 3, Table 4, Table 5 and Table 6). The results of this study for MLN-DS and AUDPC are similar to the reports in the biparental and DH population studied for the MLN-DS, AUDPC, and other traits genetic architecture [12,31,38,53,54,60]. Several putative candidate genes associated with the significant markers were identified for each of the studied traits (Table 3, Table 4, Table 5 and Table 6). For GY under WW, two putative candidate genes, GRMZM2G017470 and GRMZM2G030713, were identified, both located on chromosome 1 and, respectively, described as Dof zinc finger protein DOF3.6-like and O-fucosyltransferase 36 synthesis biological functions; whereas the candidate genes, GRMZM2G472167 on chromosome 1 and GRMZM2G019404 on chromosome 2, identified under WS were functionally described as peptide transporter PTR2 mha2 that involved in seed germination maternal control and plasma-membrane H+ATPase 2 that aid in activating secondary transport, respectively [61,62,63]. These genes are more relevant to plants’ response to drought stress.
Putative candidate genes GRMZM2G142383 and GRMZM2G124136 detected for AD under WW and WS are functionally designated as Uridine kinase-like protein 2 chloroplastic involved in the pyrimidine salvage pathway [64] and putative glycerol-3-phosphate transporter 4 involved in molecular function of transmembrane transporter activity [65]. The SNPs S8_3482389 and S2_205904889 on chromosomes 8 and 2 were closely linked to ASI under both WW and WS associated with the putative candidate genes, GRMZM2G136158 and GRMZM2G105869, respectively. These candidate genes are involved in Peroxidase 24 that aid in responding to environmental stresses such as wounding, pathogen attack, and oxidative stress [66], and histone-lysine N-methyltransferase SUVR3 known to be involved in the development of pollen and female gametophyte, flowering, plant morphology, and the responses to stresses [67], respectively.
The two important SNPs linked to PH S6_161804186 under WW have shown a candidate gene GRMZM2G170625, and S2_43203188 under WS, which is located with the candidate gene, GRMZM2G114523. Both designated candidate genes have been described as Jacalin-related lectin 3 and lysine histidine transporter-like 6 functions, respectively. Jacalin-related lectin 3 are proteins that bind carbohydrates and play an important role in plant development and resistance development to fungal pathogens [68]. Lysine histidine transporter-like 6 helps to transport amino acid within or between the cells and is involved in plant uptake of amino acids [69]. SNP, S2_184012021 linked to EH under WW management was associated with the putative candidate gene, GRMZM2G116196, that was described as AUGMIN subunit 5 (AUG5) essential for the development of gametophyte and sporophyte [70] reproductions; another annotated gene GRMZM2G365374 encoded as heat shock 70 kDa protein (HSPA1A) under WS was known to respond to heat-shock stress [71].
The SNPs S1_188031152 and S8_11662494 associated with the MOI were detected with well-described putative candidate genes, GRMZM2G419436 and GRMZM2G700386, respectively. The gene GRMZM2G419436 is characterized as well-associated receptor kinase 5 (WAK5), which significantly controls cell expansion, morphogenesis, and development [72], while the GRMZM2G700386 gene characterized as β-1,2-xylosyltransferase XYXT1 is involved in the xylosylation of xylan, the primary and secondary walls or major hemicellulose of angiosperms [73]. The SNP, S1_204865984, linked to SEN under WS environment was the annotated putative candidate gene, GRMZM2G328309, explained as ribonuclease E/G-like protein, chloroplastic, which is a family of proteins that plays a pivotal function to metabolize RNA [74].
The putative genes, GRMZM2G009591 and GRMZM2G101117, annotated from the SNPs S1_246469847 and S7_82649117 linked to GLS disease resistance had been characterized as pyrophosphate fructose 6-phosphate 1-phosphotransferase and GDSL esterase/lipase, respectively. The first gene, GRMZM2G009591, is known to catalyze D-fructose 6-phosphate phosphorylation [75]; the second gene, GRMZM2G101117, is known for the molecular function hydrolytic activities of GDSL esterases and lipases enzymes [76]. Under WW management, putative candidate genes, GRMZM2G039173, GRMZM2G071023, and GRMZM2G106119 were identified based on the associated SNPs S6_157820129 and S4_212595942 with the TLB resistance. Rédei [77] has described the GRMZM2G039173 gene as the major facilitator superfamily protein that aided in transporting small solutes based on the chemiosmotic ion gradients, while the second putative gene characterized by Chai et al. [78] has functioned as a probable NAD kinase 2 chloroplast, which is actively involved in the protection of chloroplast against oxidative damage and synthesis of chlorophyll.
MLN-DS trait-associated SNPs S3_184235364 and S6_38115747 are annotated with GRMZM2G429982 and GRMZM5G818106 candidate genes that have osmotin-like protein and phospholipase A1-II 7 functions, respectively [79,80]. Kumar et al. [80] characterized the candidate gene GRMZM2G429982 as being involved in biotic and abiotic stresses tolerance in plants, whereas the candidate gene GRMZM5G818106 has been described as protective of high temperature, cold, salt, and drought [79]. Wu et al. [81] reported that the function of the putative candidate gene GRMZM2G003752, which was characterized as fasciclin-like arabinogalactan protein 10, was to respond to abiotic stress and mediate the growth and development of the plant. This candidate gene was annotated from the S2_16652265 marker associated with AUDPC values. Similarly, the S10_125845596 marker was linked to the AUDPC value and then the putative candidate gene, GRMZM2G003917, was identified. This gene has been described by Wu et al. [81] as a fasciclin-like arabinogalactan protein 7 (FLA7) gene responsible for the development of microspores and, under salt stress environment, maintaining proper plant cell expansion.
In the present study, a total of 98, 54, and 22 SNPs associated with various agronomic traits under WW, WS, and MLN conditions, respectively, were identified. Among these SNPs, some existed within different gene models whose genetic role is associated with either biotic or abiotic stress mechanisms. The favorable alleles can be identified by resequencing the detected candidate genes from contrasting, and these SNPs could be potentially converted to simple PCR-based markers to follow MAS in molecular breeding [82]. Similarly, several GWAS studies reported large numbers of SNPs associated with important traits in maize [83,84].
High genetic gain can be achieved for complex traits by integrating modern tools into maize breeding [85,86]. With several genotyping service providers available with a lower cost per sample and availability of advanced statistical models, genomic prediction is routinely applied in maize for several quantitative traits [24,85,86]. In the present study, we compared the prediction accuracies under WW and WS conditions (Figure 7). As expected for all the common traits measured in both WW and WS conditions, the prediction accuracies were slightly higher under WW conditions compared to WS conditions. The observed accuracy for all traits under WW, WS, and MLN conditions reveals the effect of heritability as the traits with higher heritability generally had higher prediction accuracy. The main factors affecting genomic prediction accuracy are the relationship between the training and testing populations, training population sizes, the population structure of training and testing sets, marker densities, genetic architecture and heritability of target traits, genotype by environment interactions, and statistical methods [36,62,87,88]. Knowing the genetic architecture of the target traits, it is possible to improve prediction accuracy while implementing GS [35,89]. Moderate-to-high accuracies observed in this study for the association panel offer promise in breeding for MLN and drought tolerance. The prediction accuracy of the association panel for MLN-DS and AUDPC is in agreement with earlier studies on MLN [31] and MCMV [38]. The prediction correlations observed for GY and other agronomic traits are equivalent to earlier studies reported in maize under different stresses [24,62,85]. In GS, AD and ASI had higher accuracy compared to GY, which is expected, as these traits are less complex compared to GY [24,61,62]. GWAS results revealed GY, and other agronomic traits evaluated under WW and WS conditions are complex in nature, controlled by many loci with minor effects, influenced by environmental factors. Therefore, they are difficult to track effectively in conventional breeding alone. Increase in prediction accuracy as well as increase in accumulation of favorable alleles with both minor and major effects is possible by integration of GS with GWAS results leads.

5. Conclusions

Phenotypic evaluation of 879 DH lines under artificially inoculated MLN has identified about 52 genotypes resistant/tolerant to MLN-DS, while seven of the selected genotypes (CKLMLN145667, CKLMLN145667, CKLMLN144135, CKLMLN145119, CKLMLN145173, CKLMLN143806, and CKLMLN143351) can be used as sources of resistance to MLN. GWAS identified SNPs associated with the studied traits i.e., about seven and eight SNPs for the GY; 17 and 31 for anthesis date; 10 and 22 for anthesis silking interval; 14 and 6 for ear height; and 15 and 5 for moisture content under WW and WS environments, respectively. Similarly, about 13 and 11 SNPs associated with GLS and TLB, respectively, were detected. Eleven SNPs were significantly associated with senescence were identified under WS management. Under MLN artificial inoculation, a total of 12 and 10 SNPs were associated with MLN-DS and AUDPC traits, respectively; these SNPs and the identified candidate genes for each trait can be used in the trait improvement program in maize breeding. GS under WW, WS, and MLN disease artificial inoculation environments revealed moderate-to-high prediction accuracies. All the detected SNPs in this study need further validation before introducing to breeding pipelines, and it will be a great help for the understanding of complex genetic architecture traits under WW and WS. Overall, the present study identified several significant SNPs associated with GY and other agronomic traits that help in the selection of donor lines with favorable alleles for multiple traits. These results provide insights into the genetics of MLN resistance and other agronomic traits under optimum and drought stress conditions.

Supplementary Materials

The following supporting information can be downloaded at: https://www.mdpi.com/article/10.3390/genes13020351/s1, Figure S1: Distribution of GBS markers in the maize genome. The color key with marker densities indicates the number of markers within a window size of 1 Mb; Figure S2: Kinship heatmap generated for 879 inbred lines from 182,600 GBS SNP markers; Figure S3: Genetic relationship of 879 DH maize lines neighbor-joining tree constructed based on the population’s genetic distance matrix; Figure S4: Principal component analysis for 879 individuals with 182,600 GBS SNP markers.; Figure S5: Quantile-quantile (QQ) plot of P-values with uniform distributions. The Y-axis is the observed negative base 10 logarithms of the P-values, and the X-axis is the expected observed negative base 10 logarithms of the P-values.; Table S1: List of different DH populations and their pedigrees used in the current study; Table S2: GWAS results for Moisture content, Senescence, GLS, and TLB under well-watered and water stressed conditions.

Author Contributions

Conceptualization, K.S., M.G., Y.B., M.S.O. and L.M.S.; methodology, M.G., K.S., Y.B., M.S.O., D.W. and B.E.I.; software, M.G. and K.S.; validation, K.S., M.G., Y.B., M.S.O., D.W., Y.B. and P.T.; formal analysis, M.G., K.S. and V.O.; investigation, M.G. and K.S.; resources, B.M.P., M.G., Y.B. and M.S.O.; data curation, K.S., M.G. and V.O.; writing—original draft preparation, K.S. and M.G.; writing—review and editing, K.S., M.G., Y.B., M.S.O., B.M.P., D.W., B.E.I., P.T. and L.M.S.; visualization, M.G. and Y.B.; supervision, M.G., D.W., M.S.O., B.E.I., P.T., S.K.O., L.M.S., E.D. and B.M.P.; project administration, M.G. and Y.B.; funding acquisition, E.D., B.M.P. and M.S.O. All authors have read and agreed to the published version of the manuscript.

Funding

The research work was carried out with funding supported by the Bill and Melinda Gates Foundation (B&MGF), and the United States Agency for International Development (USAID) through the Stress Tolerant Maize for Africa (STMA, B&MGF Grant # OPP1134248) Project, AGGMW (Accelerating Genetic Gains in Maize and Wheat for Improved Livelihoods, B&MGF Investment ID INV-003439) project, Improved Maize for African Soils (IMAS) Project, and the CGIAR Research Program on Maize (MAIZE). MAIZE receives W1&W2 support from the Governments of Australia, Belgium, Canada, China, France, India, Japan, Korea, Mexico, Netherlands, New Zealand, Norway, Sweden, Switzerland, U.K., U.S., and the World Bank Africa Centre of Excellence at WACCI and DAAD also supported the student.

Institutional Review Board Statement

Not applicable.

Informed Consent Statement

Not applicable.

Data Availability Statement

All datasets generated for this study are included in the article. The GBS marker data are available at https://data.cimmyt.org (accessed on 2 November 2021).

Acknowledgments

The study was managed by The Global Maize Program, CIMMYT. We thank CIMMYT technicians for data collection at experimental sites. Our sincere thanks to CIMMYT technicians in Kenya; and we also thank Edward S Buckler and the Institute of Genomic Diversity, Cornell University, for the high-density genotyping (GBS) and imputation service.

Conflicts of Interest

The authors declare no potential conflict of interest.

References

  1. Santpoort, R. THE drivers of maize area expansion in sub-Saharan Africa. How policies to boost maize production overlook the interests of smallholder farmers. Land 2020, 9, 68. [Google Scholar] [CrossRef] [Green Version]
  2. Semagn, K.; Beyene, Y.; Warburton, M.L. Meta-analyses of QTL for grain yield and anthesis silking interval in 18 maize populations evaluated under water-stressed and well-watered environments. BMC Genom. 2013, 14, 313. [Google Scholar] [CrossRef] [PubMed] [Green Version]
  3. Wangai, A.W.; Reibaugh, M.G.; Kiyua, Z.M. Maize Lethal Necrosis in Kenya. Plant Dis. 2012, 96, 1582. [Google Scholar] [CrossRef]
  4. Adams, I.P.; Harju, V.; Hodges, T. First report of maize lethal necrosis disease in Rwanda. New Dis. Rep. 2014, 29, 22. [Google Scholar] [CrossRef] [Green Version]
  5. Mahuku, G.; Lockhart, B.E.; Wanjala, B.; Jones, M.W.; Kimunye, J.N.; Stewart, L.R.; Cassone, B.J.; Sevgan, S.; Nyasani, J.O.; Kusia, E.; et al. Maize lethal necrosis (MLN), an emerging threat to maize-based food security in sub-Saharan Africa. Phytopathology 2015, 105, 956–965. [Google Scholar] [CrossRef] [PubMed] [Green Version]
  6. Xie, L.; Zhang, J.; Wang, Q.; Meng, C.; Hong, J.; Zhou, X. Characterization of Maize Chlorotic Mottle Virus Associated with Maize Lethal Necrosis Disease in China. J. Phytopathol. 2011, 159, 191–193. [Google Scholar] [CrossRef]
  7. Redinbaugh, M.G.; Stewart, L.R. Maize lethal necrosis: An emerging, synergistic viral disease. Annu. Rev. Virol. 2018, 5, 301–322. [Google Scholar] [CrossRef]
  8. Nyasani, J.O.; Meyhöfer, R.; Subramanian, S.; Poehling, H.M. Effect of intercrops on thrips species composition and population abundance on French beans in Kenya. Entomol. Exp. Appl. 2012, 142, 236–246. [Google Scholar] [CrossRef]
  9. Jensen, S.G.; Wysong, D.; Ball, E.; Higley, P. Seed transmission of MCMV. Plant Dis. 1991, 75, 497–498. [Google Scholar] [CrossRef]
  10. Niblett, C.L.; Claflin, L.E. Corn lethal necrosis a new virus disease of corn in Kansas. Plant Dis. Rep. 1978, 62, 15–19. [Google Scholar]
  11. Zhao, M.; Ho, H.; Wu, Y.; He, Y.; Li, M. Western Flower Thrips (Frankliniella occidentalis) Transmits Maize Chlorotic Mottle Virus. J. Phytopathol. 2014, 162, 532–536. [Google Scholar] [CrossRef]
  12. Gowda, M.; Beyene, Y.; Makumbi, D.; Semagn, K.; Olsen, M.S.; Bright, J.M.; Das, B.; Mugo, S.; Suresh, L.M.; Prasanna, B.M. Discovery and validation of genomic regions associated with resistance to maize lethal necrosis in four biparental populations. Mol. Breed. 2018, 38, 66. [Google Scholar] [CrossRef] [PubMed] [Green Version]
  13. Awata, O.L.; Ifei, B.E.; Tongoona, P.; Danquah, E.; Jumbo, M.B.; Gowda, M.; Marchelo-D’ragga, P.W.; Sitonik, C.A.; Suresh, L.M. Maize lethal necrosis and the molecular basis of variability in concentrations of the causal viruses in co-infected maize plant. J. Gen. Mol. Virol. 2019, 9, 1–19. [Google Scholar] [CrossRef]
  14. Yan, G.; Liu, H.; Wang, H.; Lu, Z.; Wang, Y.; Mullan, D.; Hamblin, J.; Liu, C. Accelerated generation of selfed pure line plants for gene identification and crop breeding. Front. Plant Sci. 2017, 8, 1786. [Google Scholar] [CrossRef] [Green Version]
  15. Mayor, P.J.; Bernardo, R. Genomewide selection and marker-assisted recurrent selection in doubled haploid versus F2 populations. Crop Sci. 2009, 49, 1719–1725. [Google Scholar] [CrossRef]
  16. Bänziger, M.; Betrán, F.J.; Lafitte, H.R. Efficiency of high-nitroGen. selection environments for improving maize for low-nitroGen. target environments. Crop Sci. 1997, 37, 1103–1109. [Google Scholar] [CrossRef]
  17. Bänziger, M.; Setimela, P.S.; Hodson, D.; Vivek, B. Breeding for improved abiotic stress tolerance in maize adapted to southern Africa. Agric. Water Manag. 2006, 80, 212–224. [Google Scholar] [CrossRef]
  18. Xiao, Y.; Liu, H.; Wu, L.; Warburton, M.; Yan, J. Genome-wide Association Studies in Maize: Praise and Stargaze. Mol. Plant. 2017, 10, 359–374. [Google Scholar] [CrossRef] [Green Version]
  19. Buckler, E.; Ersoz, E.S.; Yu, J.; Buckler, E.S. Applications of Linkage Disequilibrium and Association Mapping in Maize Ap-plications of Linkage Disequilibrium and Association Mapping in Maize. In Molecular Genetic Approaches to Maize Improvement; Springer: Dordrecht, The Netherlands, 2009; Volume 63, pp. 173–195. [Google Scholar] [CrossRef]
  20. Ching, A.; Caldwell, K.S.; Jung, M.; Dolan, M.; Smith, O.S.; Tingey, S.; Morgante, M.; Rafalski, A.J. SNP frequency, haplotype structure and linkage disequilibrium in elite maize inbred lines. BMC Genet. 2002, 3, 19. [Google Scholar] [CrossRef] [Green Version]
  21. Collard, B.Y.; Jahufer, M.Z.; Brouwer, J.B.; Pang, E.C. An introduction to markers, quantitative trait loci (QTL) mapping and marker-assisted selection for crop improvement: The basic concepts. Euphytica 2005, 142, 169–196. [Google Scholar] [CrossRef]
  22. Soller, M.; Beckmann, J.S. Genetic polymorphism in varietal identification and genetic improvement. Theor. Appl. Genet. 1983, 67, 25–33. [Google Scholar] [CrossRef] [PubMed]
  23. Goddard, M.E.; Kemper, K.E.; MacLeod, I.M.; Chamberlain, A.J.; Hayes, B.J. Genetics of complex traits: Prediction of phenotype, identification of causal polymorphisms and genetic architecture. Proc. R. Soc. B 2016, 283, 20160569. [Google Scholar] [CrossRef] [PubMed] [Green Version]
  24. Yuan, Y.; Cairns, J.E.; Babu, R.; Gowda, M.; Makumbi, D.; Magorokosho, C.; Zhang, A.; Liu, Y.; Wang, N.; Hao, Z.; et al. Genome-wide association mapping and genomic prediction analyses reveal the genetic architecture of grain yield and flowering time under drought and heat stress conditions in maize. Front. Plant Sci. 2019, 9, 1919. [Google Scholar] [CrossRef] [PubMed] [Green Version]
  25. Hao, Z.; Li, X.; Liu, X. Meta-analysis of constitutive and adaptive QTL for drought tolerance in maize. Euphytica 2010, 174, 165–177. [Google Scholar] [CrossRef]
  26. Xu, J.; Yuan, Y.; Xu, Y.; Zhang, G.; Guo, X.; Wu, F.; Wang, Q.; Rong, T.; Pan, G.; Cao, M.; et al. Identification of candidate genes for drought tolerance by whole-genome resequencing in maize. BMC Plant Biol. 2014, 14, 83. [Google Scholar] [CrossRef] [Green Version]
  27. Agrama, H.; Moussa, M.E. Mapping QTLs in breeding for drought tolerance in maize (Zea mays L.). Euphytica 1996, 91, 89–97. [Google Scholar] [CrossRef]
  28. Yan, W.; Jackson, A.; Jia, M.; Zhou, W.; Xiong, H.; Bryant, R. Association Mapping of Four Important Traits Using the USDA Rice Mini-Core Collection. In Rice-Germplasm Genetics Improvement; Intech Open: London, UK, 2014; pp. 105–142. [Google Scholar] [CrossRef] [Green Version]
  29. Barbosa, P.A.M.; Fritsche-Neto, R.; Andrade, M.C.; Petroli, C.D.; Burgueño, J.; Galli, G.; Willcox, M.C.; Sonder, K.; Vidal-Martínez, V.A.; Sifuentes-Ibarra, E.; et al. Introgression of maize diversity for drought tolerance subtropical maize landraces as source of new positive variants. In Front. Plant Sci.; 2021; Volume 12, p. 691211. [Google Scholar] [CrossRef]
  30. Olsen, M.; Yao, N.; Tadesse, B.; Das, B.; Gowda, M.; Semagn, K.; Jumbo, M.; Killian, A. Mapping Genomic Regions Associated with Maize Lethal Necrosis (MLN) Using QTL-Seq; Divers Arrays Technol Pty Ltd. International Livestock Research Institute: Nairobi, Kenya, 2016; pp. 1–4. [Google Scholar] [CrossRef]
  31. Gowda, M.; Das, B.; Makumbi, D.; Babu, R.; Semagn, K.; Mahuku, G.; Olsen, M.S.; Bright, J.M.; Beyene, Y.; Prasanna, B.M. Genome-wide association and genomic prediction of resistance to maize lethal necrosis disease in tropical maize germplasm. Theor. Appl. Genet. 2015, 128, 1957–1968. [Google Scholar] [CrossRef] [Green Version]
  32. Boddupalli, P.; Suresh, L.; Mwatuni, F.; Beyene, Y.; Makumbi, D.; Gowda, M.; Olsen, M.; Hodson, D.; Worku, M.; Mezzalama, M.; et al. Maize lethal necrosis (MLN): Efforts toward containing the spread and impact of a devastating transboundary disease in sub-Saharan Africa. Virus Res. 2020, 282, 197943. [Google Scholar] [CrossRef]
  33. Meuwissen, T.H.E.; Hayes, B.J.; Goddard, M.E. Prediction of total genetic value using genome-wide dense marker maps. Genetics 2001, 157, 1819–1829. [Google Scholar] [CrossRef]
  34. Poland, J.A.; Rife, T.W. Genotyping-by-Sequencing for Plant Breeding and Genetics. Plant Genome 2012, 5, 92–102. [Google Scholar] [CrossRef] [Green Version]
  35. Spindel, J.; Begum, H.; Akdemir, D.; Virk, P.; Collard, B.; Redoña, E.; Atlin, G.; Jannink, J.-L.; McCouch, S.R. Genomic Selection and Association Mapping in Rice (Oryza sativa): Effect of Trait Genetic Architecture, Training Population Composition, Marker Number and Statistical Model on Accuracy of Rice Genomic Selection in Elite, Tropical Rice Breeding Lines. PLoS Genet. 2015, 11, e1004982. [Google Scholar] [CrossRef] [Green Version]
  36. Zhao, Y.; Gowda, M.; Liu, W.; Würschum, T.; Maurer, H.P.; Longin, F.H.; Ranc, N.; Reif, J.C. Accuracy of genomic selection in European maize elite breeding populations. Theor. Appl. Genet. 2012, 124, 769–776. [Google Scholar] [CrossRef] [PubMed]
  37. Nyaga, C.; Gowda, M.; Beyene, Y.; Murithi, W.T.; Burgueno, J.; Toledo, F.; Makumbi, D.; Olsen, M.S.; Das, B.; LM, S.; et al. Hybrid breeding for MLN resistance: Heterosis, combining ability, and hybrid prediction. Plants 2020, 9, 468. [Google Scholar] [CrossRef] [PubMed] [Green Version]
  38. Sitonik, C.; Suresh, L.M.; Beyene, Y.; Olsen, M.S.; Makumbi, D.; Oliver, K.; Das, B.; Bright, J.M.; Mugo, S.; Crossa, J.; et al. Genetic architecture of maize chlorotic mottle virus and maize lethal necrosis through GWAS, linkage analysis and genomic prediction in tropical maize germplasm. Theor. Appl. Genet. 2019, 132, 2381–2399. [Google Scholar] [CrossRef] [PubMed] [Green Version]
  39. Alvarado, G.; López, M.; Vargas, M.; Pacheco, A.; Rodríguez, F. USER’S MANUAL META-R (Multi-Environment Trial Analysis with R); CIMMYT: El Batan, Mexico, 2015; pp. 1–34. [Google Scholar]
  40. Elshire, R.J.; Glaubitz, J.C.; Sun, Q.; Poland, J.A.; Kawamoto, K.; Buckler, E.S.; Mitchell, S.E. A Robust, Simple Genotyping-by-Sequencing (GBS) Approach for High Diversity Species. PLoS ONE 2011, 6, e19379. [Google Scholar] [CrossRef] [PubMed] [Green Version]
  41. CIMMYT. Laboratory Protocols: CIMMYT Applied Molecular Genetics Laboratory; CIMMYT: El Batan, Mexico, 2005; Available online: http://repository.cimmyt.org/xmlui/bitstream/handle/10883/1333/91195.pdf (accessed on 11 November 2020).
  42. Cao, S.; Loladze, A.; Yuan, Y.; Wu, Y.; Zhang, A.; Chen, J.; Huestis, G.; Cao, J.; Chaikam, V.; Olsen, M.; et al. Genome-Wide Analysis of Tar Spot Complex Resistance in Maize Using Genotyping-by-Sequencing SNPs and Whole-Genome Prediction. Plant Genome 2017, 10, 1–14. [Google Scholar] [CrossRef] [Green Version]
  43. Bradbury, P.J.; Zhang, Z.; Kroon, D.E.; Casstevens, T.M.; Ramdoss, Y.; Buckler, E.S. TASSEL: Software for association mapping of complex traits in diverse samples. Bioinformatics 2007, 23, 2633–2635. [Google Scholar] [CrossRef]
  44. Yu, J.; Buckler, E.S. Genetic association mapping and genome organization of maize. Curr. Opin. Biotechnol. 2006, 17, 155–160. [Google Scholar] [CrossRef]
  45. Hill, W.G.; Weir, B.S. Variances and covariances of squared linkage disequilibria in finite populations. Theor. Popul. Biol. 1988, 33, 54–78. [Google Scholar] [CrossRef]
  46. Remington, D.L.; Thornsberry, J.M.; Matsuoka, Y.; Wilson, L.M.; Whitt, S.R.; Doebley, J.; Kresovich, S.; Goodman, M.M.; Buckler, E.S. Structure of linkage disequilibrium and phenotypic associations in the maize genome. Proc. Natl. Acad. Sci. USA 2001, 98, 11479–11484. [Google Scholar] [CrossRef] [Green Version]
  47. R Core Team. R: A Language and Environment for Statistical Computing; R Core Team: Vienna, Austria, 2016. [Google Scholar]
  48. Evanno, G.; Regnaut, S.; Goudet, J. Detecting the number of clusters of individuals using the software STRUCTURE: A simulation study. Mol. Ecol. 2005, 14, 2611–2620. [Google Scholar] [CrossRef] [PubMed] [Green Version]
  49. Earl, D.A.; Von Holdt, B.M. STRUCTURE HARVESTER: A website and program for visualizing STRUCTURE output and implementing the Evanno method. Conserv. Genet. Resour. 2012, 4, 359–361. [Google Scholar] [CrossRef]
  50. Liu, X.; Huang, M.; Fan, B.; Buckler, E.S.; Zhang, Z. Iterative Usage of Fixed and Random Effect Models for Powerful and Efficient Genome-Wide Association Studies. PLoS Genet. 2016, 12, e1005767. [Google Scholar] [CrossRef] [PubMed]
  51. Lipka, A.E.; Tian, F.; Wang, Q.; Peiffer, J.; Li, M.; Bradbury, P.J.; Gore, M.A.; Buckler, E.S.; Zhang, Z. GAPIT: Genome association and prediction integrated tool. Bioinformatics 2012, 28, 2397–2399. [Google Scholar] [CrossRef] [PubMed] [Green Version]
  52. Cui, Z.; Luo, J.; Qi, C.; Ruan, Y.; Li, J.; Zhang, A.; Yang, X.; He, Y. Genome-wide association study (GWAS) reveals the genetic architecture of four husk traits in maize. BMC Genom. 2016, 17, 946. [Google Scholar] [CrossRef] [PubMed] [Green Version]
  53. Nyaga, C.; Gowda, M.; Beyene, Y.; Muriithi, W.T. Genome-Wide Analyses and Prediction of Resistance to MLN in Large Tropical Maize Germplasm. Genes 2020, 11, 16. [Google Scholar] [CrossRef] [Green Version]
  54. Kibe, M.; Nyaga, C.; Nair, S.K.; Beyene, Y.; Das, B.; LM, S.L.; Bright, J.M.; Makumbi, D.; Kinyua, J.; Olsen, M.S.; et al. Combination of linkage mapping, gwas, and gp to dissect the genetic basis of common rust resistance in tropical maize germplasm. Int. J. Mol. Sci. 2020, 21, 6518. [Google Scholar] [CrossRef]
  55. De Groote, H.; Oloo, F.; Tongruksawattana, S.; Das, B. Community-survey based assessment of the geographic distribution and impact of maize lethal necrosis (MLN) disease in Kenya. Crop Prot. 2016, 82, 30–35. [Google Scholar] [CrossRef]
  56. Beyene, Y.; Gowda, M.; Suresh, L.M.; Mugo, S.; Olsen, M.; Oikeh, S.O.; Juma, C.; Tarekegne, A.; Prasanna, B.M. Genetic analysis of tropical maize inbred lines for resistance to maize lethal necrosis disease. Euphytica 2017, 213, 224. [Google Scholar] [CrossRef] [Green Version]
  57. Myles, S.; Peiffer, J.; Brown, P.J.; Ersoz, E.S.; Zhang, Z.; Costich, D.E.; Buckler, E. Association mapping: Critical considerations shift from genotyping to experimental design. Plant Cell. 2009, 21, 2194–2202. [Google Scholar] [CrossRef] [Green Version]
  58. Rashid, Z.; Singh, P.K.; Vemuri, H.; Zaidi, P.H.; Prasanna, B.M.; Nair, S.K. Genome-wide association study in Asia-adapted tropical maize reveals novel and explored genomic regions for sorghum downy mildew resistance. Sci. Rep. 2018, 8, 366. [Google Scholar] [CrossRef] [PubMed]
  59. Lu, Y.; Yan, J.; Guimarães, C.T.; Taba, S.; Hao, Z.; Gao, S.; Chen, S.; Li, J.; Zhang, S.; Vivek, B.S.; et al. Molecular characterization of global maize breeding germplasm based on genome-wide single nucleotide polymorphisms. Theor. Appl. Genet. 2009, 120, 93–115. [Google Scholar] [CrossRef] [PubMed]
  60. Ertiro, B.T.; Labuschagne, M.; Olsen, M.; Das, B.; Prasanna, B.M.; Gowda, M. Genetic Dissection of NitroGen. Use Efficiency in Tropical Maize Through Genome-Wide Association and Genomic Prediction. Plant Sci. 2020, 11, 474. [Google Scholar] [CrossRef] [PubMed]
  61. Zhang, A.; Wang, H.; Beyene, Y.; Semagn, K.; Liu, Y.; Cao, S.; Cui, Z.; Ruan, Y.; Burgueño, J.; Vicente, F.S.; et al. Effect of trait heritability, training population size and marker density on genomic prediction accuracy estimation in 22 bi-parental tropical maize populations. Front. Plant Sci. 2017, 8, 1916. [Google Scholar] [CrossRef]
  62. Zhang, X.; Pérez-Rodríguez, P.; Semagn, K.; Beyene, Y.; Babu, R.; A López-Cruz, M.; Vicente, F.S.; Olsen, M.; Buckler, E.; Jannink, J.-L.; et al. Genomic prediction in biparental tropical maize populations in water-stressed and well-watered environments using low-density and GBS SNPs. Heredity 2015, 114, 291–299. [Google Scholar] [CrossRef] [Green Version]
  63. Sani, H.M.; Hamzeh-Mivehroud, M.; Silva, A.P.; Walshe, J.L.; Mohammadi, S.A.; Rahbar-Shahrouziasl, M.; Abbasi, M.; Jamshidi, O.; Low, J.K.; Dastmalchi, S.; et al. Expression, purification and DNA-binding properties of zinc finger domains of DOF proteins from Arabidopsis thaliana. BioImpacts 2018, 8, 167–176. [Google Scholar] [CrossRef]
  64. Islam, M.R.; Kim, H.; Kang, S.-W.; Kim, J.-S.; Jeong, Y.-M.; Hwang, H.-J.; Lee, S.-Y.; Woo, J.-C.; Kim, S.-G. Functional characterization of a gene encoding a dual domain for uridine kinase and uracil phosphoribosyltransferase in Arabidopsis thaliana. Plant Mol. Biol. 2007, 63, 465–477. [Google Scholar] [CrossRef]
  65. Huang, Y.; Lemieux, M.J.; Song, J.; Auer, M.; Wang, D.N. Structure and mechanism of the glycerol-3-phosphate transporter from Escherichia coli. Science 2003, 301, 616–620. [Google Scholar] [CrossRef] [Green Version]
  66. Cosio, C.; Dunand, C. Specific functions of individual class III peroxdase genes. J. Exp. Bot. 2009, 60, 391–408. [Google Scholar] [CrossRef]
  67. Zhou, H.; Liu, Y.; Liang, Y.; Zhou, D.; Li, S.; Lin, S.; Dong, H.; Huang, L. The function of histone lysine methylation related SET domain group proteins in plants. Protein Sci. 2020, 29, 1120–1137. [Google Scholar] [CrossRef]
  68. Esch, L.; Schaffrath, U. An update on jacalin-like lectins and their role in plant defense. Int. J. Mol. Sci. 2017, 18, 1592. [Google Scholar] [CrossRef] [PubMed] [Green Version]
  69. Svennerstam, H.; Ganeteg, U.; Bellini, C.; Näsholm, T. Comprehensive screening of Arabidopsis mutants suggests the lysine histidine transporter 1 to be involved in plant uptake of amino acids. Plant Physiol. 2007, 143, 1853–1860. [Google Scholar] [CrossRef] [PubMed] [Green Version]
  70. Hotta, T.; Kong, Z.; Ho, C.-M.K.; Zeng, C.J.T.; Horio, T.; Fong, S.; Vuong, T.; Lee, Y.-R.J.; Liu, B. Characterization of the Arabidopsis augmin complex uncovers its critical function in the assembly of the acentrosomal spindle and phragmoplast microtubule arrays. Plant Cell. 2012, 24, 1494–1509. [Google Scholar] [CrossRef] [PubMed] [Green Version]
  71. McCallister, C.; Siracusa, M.C.; Shirazi, F.; Chalkia, D.; Nikolaidis, N. Functional diversification and specialization of cytosolic 70-kDa heat shock proteins. Sci. Rep. 2015, 5, srep09363. [Google Scholar] [CrossRef] [PubMed] [Green Version]
  72. Kohorn, B.D.; Kohorn, S.L. The cell wall-associated kinases, WAKs, as pectin receptors. Front. Plant Sci. 2012, 3, 88. [Google Scholar] [CrossRef] [Green Version]
  73. Zhong, R.; Cui, D.; Phillips, D.R.; Ye, Z.H. A Novel Rice Xylosyltransferase Catalyzes the Addition of 2-O-Xylosyl Side Chains onto the Xylan Backbone. Plant Cell Physiol. 2018, 59, 554–565. [Google Scholar] [CrossRef]
  74. Mudd, E.A.; Sullivan, S.; Gisby, M.F.; Mironov, A.; Kwon, C.S.; Chung, W.-I.; Day, A. A 125 kDa RNase E/G-like protein is present in plastids and is essential for chloroplast development and autotrophic growth in Arabidopsis. J. Exp. Bot. 2008, 59, 2597–2610. [Google Scholar] [CrossRef] [Green Version]
  75. Chen, C.; He, B.; Liu, X.; Ma, X.; Liu, Y.; Yao, H.; Zhang, P.; Yin, J.; Wei, X.; Koh, H.; et al. Pyrophosphate-fructose 6-phosphate 1-phosphotransferase (PFP1) regulates starch biosynthesis and seed development via heterotetramer formation in rice (Oryza sativa L.). Plant Biotechnol. J. 2020, 18, 83–95. [Google Scholar] [CrossRef] [Green Version]
  76. Akoh, C.C.; Lee, G.C.; Liaw, Y.C.; Huang, T.H.; Shaw, J.F. GDSL family of serine esterases/lipases. Prog. Lipid Res. 2004, 43, 534–552. [Google Scholar] [CrossRef]
  77. Rédei, G.P. Major Facilitator Superfamily (MFS). In Encyclopedia of Genetics, Genomics, Proteomics, and Informatics; Springer: Dordrecht, The Netherlands, 2008; Volume 62, p. 1142. [Google Scholar] [CrossRef]
  78. Chai, M.F.; Chen, Q.J.; An, R.; Chen, Y.M.; Chen, J.; Wang, X.C. NADK2, an Arabidopsis chloroplastic NAD kinase, plays a vital role in both chlorophyll synthesis and chloroplast protection. Plant Mol. Biol. 2005, 59, 553–564. [Google Scholar] [CrossRef]
  79. Richmond, G.S.; Smith, T.K. Phospholipases A 1. Int. J. Mol. Sci. 2011, 12, 588–612. [Google Scholar] [CrossRef] [PubMed] [Green Version]
  80. Anil, K.S.; Hima, K.P.; Shravan, K.G.; Mohanalatha, C.; Kavi, K.P. Osmotin: A plant sentinel and a possible agonist of mammalian adiponectin. Front. Plant Sci. 2015, 6, 163. [Google Scholar] [CrossRef] [Green Version]
  81. Wu, X.; Lai, Y.; Lv, L.; Ji, M.; Han, K.; Yan, D.; Lu, Y.; Peng, J.; Rao, S.; Yan, F.; et al. Fasciclin-like arabinogalactan gene family in Nicotiana benthamiana: Genome-wide identification, classification and expression in response to pathogens. BMC Plant Biol. 2020, 20, 305. [Google Scholar] [CrossRef] [PubMed]
  82. Yan, J.; Kandianis, C.B.; E Harjes, C.; Bai, L.; Kim, E.-H.; Yang, X.; Skinner, D.J.; Fu, Z.; Mitchell, S.; Li, Q.; et al. Rare genetic variation at Zea mays crtRB1 increases Β-carotene in maize grain. Nat. Genet. 2010, 42, 322–327. [Google Scholar] [CrossRef] [PubMed] [Green Version]
  83. Thirunavukkarasu, N.; Hossain, F.; Arora, K.; Sharma, R.; Shiriga, K.; Mittal, S.; Mohan, S.; Namratha, P.M.; Dogga, S.; Rani, T.S.; et al. Functional mechanisms of drought tolerance in subtropical maize (Zea mays L.) identified using genome-wide association mapping. BMC Genom. 2014, 15, 1182. [Google Scholar] [CrossRef] [Green Version]
  84. Wang, N.; Wang, Z.; Liang, X.; Weng, J.; Lv, X.; Zhang, D.; Yang, J.; Yong, H.; Li, M.; Li, F.; et al. Identification of loci contributing to maize drought tolerance in a genome-wide association study. Euphytica 2016, 210, 165–179. [Google Scholar] [CrossRef]
  85. Suwarno, W.B.; Pixley, K.V.; Palacios-Rojas, N.; Kaeppler, S.M.; Babu, R. Genome-wide association analysis reveals new targets for carotenoid biofortification in maize. Theor. Appl. Genet. 2015, 128, 851–864. [Google Scholar] [CrossRef] [Green Version]
  86. Beyene, Y.; Gowda, M.; Pérez-Rodríguez, P.; Olsen, M.; Robbins, K.R.; Burgueño, J.; Prasanna, B.M.; Crossa, J. Application of Genomic Selection at the Early Stage of Breeding Pipeline in Tropical Maize. Front. Plant Sci. 2021, 12, 685488. [Google Scholar] [CrossRef]
  87. Crossa, J.; Pérez-Rodríguez, P.; Hickey, J.; Burgueño, J.; Ornella, L.; Cerón-Rojas, J.J.; Zhang, X.; Dreisigacker, S.; Babu, R.; Li, Y.; et al. Genomic prediction in CIMMYT maize and wheat breeding programs. Heredity 2014, 112, 48–60. [Google Scholar] [CrossRef] [Green Version]
  88. Combs, E.; Bernardo, R. Accuracy of Genomewide Selection for Different Traits with Constant Population Size, Heritability, and Number of Markers. Plant Genome 2013, 6, 1–7. [Google Scholar] [CrossRef] [Green Version]
  89. Bernardo, R. Genome-wide selection when major genes are known. Crop Sci. 2014, 54, 68–75. [Google Scholar] [CrossRef]
Figure 1. Phenotypic distributions of MLN_DS, MLN_AUDPC, AD, ASI, EH, PH, and MOI and TLB, SEN, and GY traits were measured under WW (blue), WS (red), and MLN (green) management. AD—anthesis date; ASI—anthesis silking interval; AUDPC—area under disease progress curve; EH—ear height; GY—grain yield; MLN_DS—maiz lethal necrosis disease severity; MOI—moisture content; PH—plant height; SEN—senescence; and TLB—turcicum leaf blight; WW—well watered; WS—water stressed.
Genes 13 00351 g001
Figure 2. The reaction responses of 879 DH lines to MLN disease under artificial inoculation. MLN-DS rating scale (1–9) has been converted to a percentage.
Genes 13 00351 g002
Figure 3. Pearson’s correlation of the phenotypic traits measured under WW (A) and WS (B) managements. The correlation level is color-coded according to the color key plotted in the center. Correlations with >0.10 and >0.15 were significant at 0.05 and 0.01 levels, respectively. AD-anthesis date; ASI-anthesis silking interval; CR-common rust; EH-ear height; ER-ear rot; GLS-gray leaf spot; GY-grain yield; MOI-grain moisture; PH-plant height; SEN-senescence; and TLB-turcicum leaf blight.
Genes 13 00351 g003
Figure 4. The four sub-populations of the 879 DH lines using GBS markers. (A) Best delta K estimation by Evanno method. (B) Estimated population structure of 879 tropical maize DH lines as revealed by GBS SNP markers for K = 2 and (C) for K=4. Blue, green red and yellow color represents sub-population 1, 2, 3, and 4, respectively.
Genes 13 00351 g004
Figure 5. Genome-wide markers linkage disequilibrium (LD) plot representing the average pairwise distances genome-wide LD decay at r2 = 0.2 and r2 = 0.1 in set of DH populations with 879 lines.
Genes 13 00351 g005
Figure 6. (A) Manhattan plots for GY and other related traits measured under WW, and WS managements. The X-axis shows the SNPs position on the chromosome, and the Y-axis shows the negative log base 10 of the p-values; for ease of discrimination, each chromosome was colored differently. The horizontal line portrays the significance threshold (marker p-value < 9 × 10⁻⁶). AD-anthesis date, ASIanthesis silking interval, EHear height, GYgrain yield, PHplant height, WWwell-watered, WSwater-stressed. (B) Manhattan plots for MOI, TLB, SEN, MLN-GS and AUDPC measured under WW, WS, and MLN managements. The X-axis shows the SNPs position on the chromosome, and the Y-axis shows the negative log base 10 of the p-values; for ease of discrimination, each chromosome was colored differently. The horizontal line portrays the significance threshold (marker p-value < 9 × 10⁻⁶). AUDPCarea under disease progress curve, MLN-DSmaize lethal necrosis disease severity, MOIgrain moisture, TLBturcicum leaf blight, SEN—senescence, WWwell-watered, WSwater-stressed.
Genes 13 00351 g006aGenes 13 00351 g006b
Figure 7. Genomic prediction accuracy results for the GY and other related traits evaluated under WW (light blue), WS (red), and MLN (green) managements. AD: anthesis date, ASI: anthesis silking interval, AUDPC: area under disease progress curve, EH: ear height, GLS: grey leaf spot, GY: grain yield, MLN-DS: maize lethal necrosis disease severity, MOI: grain moisture, TLB: turcicum leaf blight, PH: plant height, SEN: senescence, WW: well-watered, WS: water-stressed.
Genes 13 00351 g007
Table 1. Estimation of mean, range, and variance components and broad-sense heritability of phenotypic traits evaluated under WW, WS, and MLN managements.
TraitMean (Range)σ2Gσ2GxEσ2eH2LSD0.05
Well-watered management
GY7.54 (4.35–11.66)0.54 **1.19 **2.020.331.12
AD67.72 (61.5–73.5)2.88 **4.14 **2.830.513.83
ASI0.39 (−3.0–4.5)0.48 **0.17 **1.070.581.36
PH236.21 (155.4–292.1)73.02 **62.05 **191.620.4818.02
EH126.12 (79.9–169.9)63.32 **67.05 **82.880.5417.32
TLB2.9 (1.0–4.9)0.29 **-0.273820.811.03
MOI23.41 (19.8–26.92)3.00 **0.017.122680.635.3
CR1.08 (0.99–3.01)0.02 **-0.057270.580.47
GLS1.27 (0.91–2.92)0.05 **-0.152610.570.77
Water stress management
GY2.7 (0.03–5.67)0.21 **-0.640.400.78
AD67.31 (61.1–75.5)2.05 **-3.050.572.45
ASI2.26 (−3.95–8.17)1.61 **-3.020.521.84
PH176.54 (115.5–231.8)91.88 **-231.910.4416.34
EH91.26 (55.6–131.7)28.17 **-82.630.4112.71
MOI12.97 (7.8–16.5)1.02 *-1.550.571.1
SEN5.96 (1.91–9.14)0.52 **-1.330.440.9
ER1.86 (0.02–51.1)12.03 **-42.710.363.78
MLN management
MLN-DS6.02 (2.1–9.0)1.01 **-0.990.670.79
AUDPC166.47 (75.2–264.8)642.8 **-453.90.7420.11
H2: broad-sense heritability; LSD: least significant difference; *, ** significance at p < 0.05 and p < 0.01, respectively. σ2G, σ2GxE and σ2e, represents genotypic, genotype x environment interactions and error variance, respectively. AD—anthesis date; ASI—anthesis silking interval; AUDPC—area under disease progress curve; CR—corn rust; EH—ear height; ER—ear rot; GLS—Gray leaf spot; GY—grain yield; MLN_DS—Maize lethal necrosis disease severity; MOI—moisture content; PH—plant height; SEN—senescence; and TLB—turcicum leaf blight.
Table 2. Number of SNPs significantly associated with grain yield and other traits at 5% false discovery rate (FDR) threshold level under well-watered (WW), water stress (WS), and MLN management.
TraitWWWSMLN
GY78-
AD1612-
ASI78-
EH145-
PH145-
MOI155-
GLS14--
TLB11--
SEN-11
MLNDS--12
AUDPC--10
Total985422
AD—anthesis date; ASI—anthesis silking interval; AUDPC—area under disease progress curve; CR—corn rust; EH—ear height; ER—ear rot; GLS—Gray leaf spot; GY—grain yield; MLN_DS—Maize lethal necrosis disease severity; MOI—moisture content; PH—plant height; SEN—senescence; and TLB—turcicum leaf blight.
Table 3. Details of the GWAS results for MLN disease severity and AUDPC values associated SNP markers and their closest candidate genes identified in the large set of association mapping panel.
TraitSNP aChrp ValueMAFEffectPutative Candidate GenePredicted Function of Candidate Gene
MLN-DSS3_18423536434.74 × 10−80.21−0.25GRMZM2G429982Osmotin-like protein
S9_13951708196.93 × 10−70.36−0.15GRMZM2G007514Protein SCAR2
S7_13111164379.35 × 10−70.15−0.23GRMZM2G467907uncharacterized LOC100278143
S8_16053126289.51 × 10−70.31−0.15GRMZM2G151614SUPPRESSOR OF ABI3-5
S6_13962054261.52 × 10−60.150.22GRMZM2G061912uncharacterized LOC100282310
S9_356164291.79 × 10−60.180.19GRMZM2G110832uncharacterized LOC100282577
S4_16692485141.94 × 10−60.29−0.15GRMZM2G141036Aspartyl protease family protein At5g10770
S3_14474246031.98 × 10−60.28−0.13GRMZM2G062587Protein NETWORKED 2D
S10_127441666103.63 × 10−60.46−0.12GRMZM2G047370uncharacterized LOC100280076
S6_3589570564.45 × 10−60.110.34GRMZM2G035502Glutathione dehydroascorbate reductase3
S6_3811574764.50 × 10−60.09−0.37GRMZM5G818106phospholipase A1-II 7
S3_21890342436.12 × 10−60.150.19GRMZM2G032244Adenine C2 methyltransferase pseudogene
AUDPCS1_2225942613.70 × 10−90.244.81GRMZM2G388915DNA repair protein UVH3
S9_13951708197.48 × 10−90.36−5.08GRMZM2G007590Spliceosomal protein
S7_13112727173.26 × 10−70.155.14GRMZM2G467907uncharacterized LOC100278143
S10_125845596103.56 × 10−70.28−4.61GRMZM2G003917fasciclin-like arabinogalactan protein 7
S4_23439858643.77 × 10-70.13−5.64GRMZM2G111886uncharacterized LOC100383387
S6_13962054264.23 × 10−70.155.86GRMZM2G061912uncharacterized LOC100282310
S8_16527577887.81 × 10−70.38−3.59GRMZM2G300375ATP-dependent RNA helicase DHX8
S6_3811574762.25 × 10−60.09−9.84GRMZM5G818106phospholipase A1-II 7
S2_1665226525.07 × 10−60.125.50GRMZM2G003752fasciclin-like arabinogalactan protein 10
S2_379534327.82 × 10−60.276.20GRMZM2G321394protein trichome birefringence-like 8
MAF-minor allele frequency, Effect-allele effect, p-value probability value for the mixed linear model, MLN-DS-MLN disease severity, and AUDPC-area under disease progress curve values under artificial inoculation of MLN conditions; a The exact physical position of the SNP can be inferred from marker’s name, for example, S9_3561642: chromosome 9; 3,561,642 bp (Ref Gen_v2 of B73).
Table 4. Details of the associated SNP markers and their closest candidate genes identified in the large set of association mapping panel for GY under WW and WS conditions.
TraitSNP aChrp ValueMAFEffectPutative Candidate GenePredicted Function of Candidate Gene
GY_WWS1_29882405512.46 × 10−70.46−0.15GRMZM2G017470Dof zinc finger protein DOF3.6
S2_21320544522.17 × 10−60.240.16GRMZM2G030713O-fucosyltransferase 36
S3_1327792632.62 × 10−70.41−0.15GRMZM2G026783uncharacterized
S3_3212825533.49 × 10−70.26−0.21GRMZM2G401294uncharacterized
S4_17758510848.53 × 10−70.200.20GRMZM2G422190uncharacterized
S5_20661580655.79 × 10−80.34−0.21GRMZM2G050734uncharacterized
S5_20806945251.03 × 10−60.39−0.15GRMZM2G421899uncharacterized
GY_WSS1_863546414.07 × 10−60.090.23GRMZM2G072814uncharacterized
S1_28592887911.07 × 10−60.090.23GRMZM2G472167peptide transporter PTR2
S2_426920622.99 × 10−70.130.18GRMZM2G019404plasma-membrane H+ATPase 2
S4_16874484147.33 × 10−60.130.17GRMZM2G422190uncharacterized
S4_17758505945.13 × 10−80.210.18GRMZM2G021339uncharacterized
S6_16060580961.83 × 10−60.14−0.19GRMZM2G701221uncharacterized
S7_14290788273.87 × 10−60.270.17GRMZM2G108133β-glucosidase 11
S7_15746895474.61 × 10−80.21−0.20GRMZM2G134545dof zinc finger protein 2
MAF-minor allele frequency, Effect: allele effect, p-value: probability for the mixed linear model, GY-grain yield under optimum (WW) and drought stress (WS) conditions; a The exact physical position of the SNP can be inferred from marker’s name, for example, S9_3561642: chromosome 9; 3,561,642 bp (Ref Gen_v2 of B73).
Table 5. Details of the associated SNP markers and their closest candidate genes identified in the large set of association mapping panel for AD and ASI under WW and WS conditions.
TraitSNP aChrp ValueMAFEffectPutative Candidate GenePredicted Function of Candidate Gene
AD_WWS1_19605298615.80 × 10−110.47−0.3GRMZM2G142383Uridine kinase-like protein 2 chloroplastic
S1_18133899812.47 × 10−80.27−0.36GRMZM2G131254uncharacterized LOC100191530
S1_4551397813.15 × 10−60.080.37-uncharacterized LOC100383423
S1_7714131515.83 × 10−60.140.37GRMZM2G425736uncharacterized LOC100283616
S1_8599184819.18 × 10−60.44−0.22GRMZM2G040743putative calcium-dependent protein kinase family protein
S2_16488899923.56 × 10−1060.06−0.51GRMZM2G151549eukaryotic translation initiation factor 3 subunit 6
S2_2403316226.81 × 10−60.08−0.39GRMZM2G178998uncharacterized LOC100273446
S3_21969776733.91 × 10−60.09−0.29GRMZM2G180815rae1-like protein
S4_11525406141.97 × 10−70.160.28GRMZM2G127690U-box domain-containing protein 27
S5_3284799854.48 × 10−70.120.31GRMZM2G130580uncharacterized LOC100216815
S6_13570294766.59 × 10−70.13−0.29GRMZM2G441565Mediator of RNA polymerase II transcription subunit 32
S7_1545711474.55 × 10−80.180.3GRMZM2G028129uncharacterized LOC100191940
S7_17297518874.84 × 10−70.12−0.35GRMZM2G158130uncharacterized LOC100272539
S7_17478892571.37 × 10−60.47−0.22GRMZM2G006119corticosteroid 11-β-dehydrogenase isozyme 1
S10_88394535101.09 × 10−110.3−0.3GRMZM5G848692uncharacterized LOC100191174
S10_87090061108.84 × 10−80.060.37GRMZM2G0281043-N-debenzoyl-2-deoxytaxol N-benzoyltransferase
AD_WSS1_7057792113.41 × 10−60.28−0.42GRMZM2G049070E3 ubiquitin-protein ligase EL5
S2_2804401429.88 × 10−60.460.31GRMZM2G113990coiled-coil-helix-coiled-coil-helix domain-protein 4
S4_3388518641.79 × 10−110.08−0.69GRMZM5G814904catechol-O-methyltransferase
S5_19625054356.05 × 10−60.17−0.33GRMZM2G124136Putative glycerol-3-phosphate transporter 4
S7_12727071473.75 × 10−80.31−0.54GRMZM2G096092uncharacterized LOC101027214
S7_13207604277.51 × 10−60.170.41GRMZM2G070375FIP1
S7_14705199873.71 × 10−70.46−0.32GRMZM2G325238putative cysteine-rich receptor-like protein kinase 35
S7_17475236472.16 × 10−70.140.44GRMZM2G139870uncharacterized LOC103633488
S8_14839264081.76 × 10−110.06−1.01GRMZM2G439168E3 ubiquitin-protein ligase AIRP2
S9_14179021992.08 × 10−60.21−0.34GRMZM2G165357uncharacterized LOC100193447
S9_15080990099.68 × 10−70.16−0.45GRMZM2G305027D-type cyclin
S10_85581257105.47 × 10−60.490.3GRMZM2G060798uncharacterized LOC100279979
ASI_WWS2_19404019621.11 × 10−80.24−0.2GRMZM2G137541uncharacterized LOC100286191
S2_205564222.63 × 10−60.350.1GRMZM2G343317uncharacterized LOC100274748
S2_3084090929.16 × 10−60.080.3GRMZM2G048366uncharacterized LOC100194081
S3_221865233.10 × 10−60.150.16GRMZM2G026868uncharacterized LOC100276559
S5_5352296558.54 × 10−80.22−0.2GRMZM2G113349uncharacterized LOC100191684
S6_550642267.96 × 10−60.34−0.12GRMZM2G450546expansin-A19
S8_348238982.45 × 10−80.30.24GRMZM2G136158Peroxidase 24
ASI_WSS1_21520396613.62 × 10−60.1−0.43GRMZM2G067235uncharacterized LOC100275190
S1_474861417.55 × 10−70.46−0.26GRMZM2G040762uncharacterized LOC100381417
S2_20590488922.34 x 10−60.26−0.28GRMZM2G105869histone-lysine N-methyltransferase SUVR3
S5_21176488259.75 × 10−60.14−0.38GRMZM2G415327uncharacterized LOC100216930
S9_10048529494.21 × 10−60.21−0.31GRMZM2G104866uncharacterized LOC100193380
S9_13692434995.99 × 10−80.20.38GRMZM2G051896nuclear poly(A) polymerase 3
S10_135678936106.72 × 10−60.440.3GRMZM2G016819Ubiquitin carboxyl-terminal hydrolase family protein
S10_37346033108.63 × 10−60.480.24GRMZM2G472703receptor kinase pseudogene
MAF-minor allele frequency, Effect-allele effect, p-value: probability for the mixed linear model, AD-anthesis date and ASI- anthesis silking interval under optimum (WW) and drought stress (WS) conditions; a The exact physical position of the SNP can be inferred from marker’s name, for example, S9_3561642: chromosome 9; 3,561,642 bp (Ref Gen_v2 of B73).
Table 6. Details of the associated SNPs and their closest candidate genes identified in the large set of association mapping panel for PH and EH under WW and WS management.
TraitSNP aChrp ValueMAFEffectPutative Candidate GenePredicted Function of Candidate Gene
PH_WWS1_23426337112.52 × 10−60.391.63GRMZM2G153233uncharacterized LOC100304210
S1_3208763711.57 × 10−80.5−2.04GRMZM2G100629uncharacterized LOC100277213
S1_5139930114.64 × 10−80.27−2.60GRMZM5G851485uncharacterized LOC100274900
S2_1235263722.32 × 10−70.262.29GRMZM2G156356maltose excess protein 1-like
S3_1326483735.95 × 10−70.242.00GRMZM2G026783uncharacterized LOC100278056
S3_16680765931.52 × 10−80.392.30GRMZM2G366142uncharacterized LOC100193554
S4_22862351742.49 × 10−60.35−1.73GRMZM2G016923uncharacterized LOC100502389
S5_2722653957.78 × 10−120.243.31GRMZM2G428356uncharacterized LOC100277327
S6_16180418662.08 × 10−90.25−2.64GRMZM2G170625Jacalin-related lectin 3
S7_16379093272.10 × 10−70.08−3.81GRMZM2G106548scarecrow-like protein 23
S7_16396776472.75 × 10−90.36−2.32GRMZM2G006942exocyst complex component EXO84C
S7_16465625777.38 × 10−60.23−1.78GRMZM2G037545uncharacterized LOC100217043
S8_1484435783.24 × 10−100.153.67GRMZM2G052869metallothionein-like protein 2A
S8_6785649783.49 × 10−60.09−3.04GRMZM2G416216uncharacterized LOC100384078
PH_WSS2_1800135226.22 × 10−70.213.52GRMZM2G318956uncharacterized LOC100381487
S2_4320318826.87 × 10−60.153.09GRMZM2G114523lysine histidine transporter-like 6
S7_16031336873.28 × 10−70.36−2.85GRMZM2G431039glucan endo-1,3-β-glucosidase 13
S7_16200371977.44 × 10−60.25−3.11GRMZM2G153162eukaryotic translation initiation factor 4G
S8_15898611784.46 × 10−90.234.22GRMZM2G057416uncharacterized LOC100216812
EH_WWS1_574489812.81 × 10−70.132.23GRMZM2G025642uncharacterized LOC100383060
S2_18401202125.92 × 10−60.221.4GRMZM2G116196AUGMIN subunit 5
S2_5420457524.86 × 10−70.22−1.84GRMZM2G13572760S ribosomal protein L3
S2_682184926.13 × 10−70.48−1.37GRMZM2G063519putative galacturonosyltransferase 10
S3_10357455231.20 × 10−60.111.75GRMZM2G147811serine/threonine-protein kinase prpf4B-like
S3_1543390538.42 × 10−110.18−2.5GRMZM2G162182uncharacterized LOC103651780
S4_14109147148.91 × 10−70.28−1.56GRMZM2G179810Adenine phosphoribosyltransferase 2
S4_16692489943.39 × 10−110.372.48GRMZM2G141036aspartyl protease family protein At5g10770
S4_23093233442.10 × 10−60.26−1.77GRMZM2G004835uncharacterized LOC100273059
S5_18254204751.39 × 10−70.491.69GRMZM2G121236umecyanin
S5_20533250751.33 × 10−80.162.47-uncharacterized LOC100502221
S5_2254439553.48 × 10−60.491.29GRMZM2G059013fringe-related protein
S6_9612676661.51 × 10−60.29−1.41GRMZM2G088086uncharacterized LOC100286007
S10_138873729101.43 × 10−70.25−1.64GRMZM2G155776uncharacterized LOC100276813
EH_WSS2_19591961022.45 × 10−70.44−2.06GRMZM2G365374heat shock 70 kDa protein
S2_590428622.19 × 10−70.37−1.84GRMZM2G37210236.4 kDa proline-rich protein
S7_8719406872.01 × 10−70.4−1.69GRMZM2G157953NAD(P)H dehydrogenase subunit CRR3 chloroplast
S9_11882563492.55 × 10−70.17−2.24GRMZM2G108619uncharacterized LOC100275618
S9_15086877796.71 × 10−60.39−1.31GRMZM2G006721D-type cyclin
MAF- minor allele frequency, Effect- allele effect, p-value probability for the mixed linear model, PH-plant height and EH-ear height under optimum (WW) and drought stress (WS) conditions; a The exact physical position of the SNP can be inferred from marker’s name, for example, S9_3561642: chromosome 9; 3,561,642 bp (Ref Gen_v2 of B73).
Publisher’s Note: MDPI stays neutral with regard to jurisdictional claims in published maps and institutional affiliations.

