Abstract
Vitamin D (VD) deficiency is more frequent in systemic lupus erythematosus (SLE) patients than in control subjects (CS); genetic variants in the VD receptor (VDR) could contribute to the clinical disease activity. This study was aimed to determine the association of the VDR variants FokI (rs2228570), BsmI (rs1544410), ApaI (rs7975232), and TaqI (rs731236) with susceptibility to the disease, VD status, VDR mRNA expression, and clinical disease activity in SLE patients. A cross-sectional study was conducted in 194 SLE and 196 CS Mexican women. Immunoassays quantified serum calcidiol and calcitriol. Genotyping was performed by allelic discrimination assays and mRNA VDR expression by qPCR. The FokI variant was not in linkage disequilibrium with BsmI, ApaI, and TaqI VDR variants. SLE patient carriers of the TT FokI genotype showed higher clinical disease activity scores. Notably, the mRNA VDR expression was higher in SLE patients vs. CS, in active vs. inactive SLE patients, and in participants of both study groups with vitamin D deficiency, higher calcitriol levels, and TT FokI genotype carriers. In conclusion, the TT FokI VDR genotype was related to high VDR expression and clinical disease activity in systemic lupus erythematosus patients.
1. Introduction
Systemic lupus erythematosus (SLE) is a multisystem autoimmune disease characterized by immune regulation disrupted, leading to the production of antibodies against nuclear, cytoplasmic, or cell surface self-antigens, chronic inflammation, tissue, and organ damage [1,2,3]. Genetics, epigenetics, hormones, and environmental factors have been associated with SLE pathogenesis [4,5], and the association between specific phenotypes and variants of genetic loci has been identified [6]. SLE susceptibility can be influenced by the individual accumulation of risk alleles triggered by environmental factors, which could explain the discrepancies in SLE susceptibility between different populations [7]. The rate of SLE concordance in monozygotic twins is from 24 to 35%, compared between 2% and 5% in dizygotic twin pairs [8]. The genetic variability so far identified accounts for less than half of the SLE heritability, with modest overall effect sizes (OR~1.2 to 1.5) [6], and familial aggregation studies reported that between 10% and 12% of SLE patients have first- or second-degree family members with the disease, compared to <1% of controls [8].
Among the environmental risk factors for SLE is vitamin D deficiency, which is more frequent in SLE patients compared to the general population. It has been associated with susceptibility to several autoimmune diseases [3,5]. Moreover, it is related with clinical disease activity and organ damage [3,9]. The active form of vitamin D, calcitriol, is an immunomodulatory nutrient that participates in the control of self-tolerance, the production of cytokines, and the differentiation of immune system cells by its genomic pathway through the vitamin D receptor (VDR) [10,11,12,13].
VDR is a transcription factor regulated by ligand binding; it is located mainly in the cell nucleus and cytoplasm, where it is translocated into the nucleus after interaction with calcitriol. It is expressed in various organs involved in calcium metabolism and the immune and nervous system cells [12,14,15]. VDR can mediate the inhibition or induction of the transcription of vitamin D target genes by binding to vitamin D response elements (VDRE) in the DNA [12,16].
The VDR gene is located on 12q13.11 Crh. and it comprises 14 exons. Exon 1 is in the promoter region and has six variants (a–f), and exons 2–9 are in the coding region [1,14,17,18]. Four single nucleotide variants (SNVs) have been described in the VDR gene that may influence receptor structure and modulation of the response to vitamin D. These are named after the restriction endonuclease that were identified as FokI [rs2228570, 12:47879112 (GRCh38), C > T or also called F > f] located in exon 2; BsmI [rs1544410, 12:47846052 (GRCh38), A > G or B > b] and ApaI [rs7975232, 12:47845054 (GRCh38), A > C or A > a] both located in intron 8, and TaqI [rs731236, 12:47844974 (GRCh38), C > T or T > t] found in exon 9 [1,14,17,19].
According to their location, the VDR genetic variants can affect both the mRNA stability and the VDR gene transcription rate. These SNVs could change the expression, length, and activity of the protein associated with the susceptibility or severity of the SLE [1,20]. The presence of the C allele of the FokI variant has been described as being associated with a shorter VDR protein isoform of 424 amino acids, which is more transcriptionally active [21] since it interacts more efficiently with the transcription factor TFIIB [22], compared to the more extended variant of 427 amino acids (T allele). The possible effect of the BsmI and ApaI variants, due to their location in the same intron, may be an alteration in the splice sites for mRNA transcription or a change in the regulatory elements of the VDR intron. TaqI, on the other hand, does not change the length of the protein and results in a silent mutation [1,14,17,19].
VDR expression, apart from genetic factors, is also regulated at the transcriptional level by various hormones, including the parathyroid hormone (PTH), all trans-retinoic acid (atRA), and also by its ligand, calcitriol [23], since multiple enhancers in the VDR gene locus that can contribute to the VDR expression induced by calcitriol has been described [24]. Despite this evidence, mechanisms responsible for VDR expression still must be clarified [23], as well as their influence on the course of SLE. This study aimed to determine the association of the VDR variants FokI (rs2228570), BsmI (rs1544410), ApaI (rs7975232), and TaqI (rs731236) with susceptibility to the disease, vitamin D serum status, VDR mRNA expression, and clinical disease activity in SLE patients.
2. Materials and Methods
2.1. Subjects
A comparative cross-sectional study was conducted in a population of 390 unrelated Mexican-Mestizo women to form two groups. The first group consisted of 194 SLE patients classified according to the 1997 American College of Rheumatology (ACR) criteria for SLE [25] recruited from 2017–2020 from the Rheumatology Department of the Hospital Civil Fray Antonio Alcalde, Guadalajara, Jalisco, Mexico. All SLE patients included in the present study had no recent infections, trauma, surgery, pregnancy, or other autoimmune systemic conditions unrelated to the SLE.
The second study group was formed with 196 women control subjects (CS). This CS population did not suffer from recent infections, trauma, surgery, pregnancy, or autoimmune conditions; additionally, they were asked about the presence of autoimmune diseases in their families, and they did not disclose that their close relatives, such as siblings, parents, and grandparents, had autoimmune diseases.
All SLE and CS participants were classified as a Mexican-Mestizo population with a family history of ancestors, at least back to the third generation, in the same geographical area from Mexico [26].
2.2. Ethical Considerations
Informed written consent was obtained from all patients and subjects before enrollment in the study. The study was conducted in agreement with the International Ethical Guidelines for Health-related Research Involving Humans of the Council for International Organizations of Medical Sciences (CIOMS). The Research Ethical Committee of the Centro Universitario de Ciencias de la Salud, Universidad de Guadalajara (C.I. 03419 CUCS-UdG) and the Research Ethical Committee of the Hospital Civil Fray Antonio Alcalde (No. 280/19) approved the protocol.
2.3. Clinical Measurements
Demographic and clinical characteristics of participants were recorded, including age, gender, disease duration, pharmacotherapy received, clinical disease activity, and disease damage. The clinical disease activity was assessed by the Mexican Systemic Lupus Erythematosus Disease Activity Index (Mex-SLEDAI) [27] and the disease organ damage by the Systemic Lupus International Collaborating Clinics/American College of Rheumatology damage index (SLICC/ACR-DI) [28].
Additionally, the glomerular filtration rate (GFR) was estimated with the Chronic Kidney Disease Epidemiology Collaboration (CKD-EPI) equation based on serum creatinine (mg/dL) and using the parameters of sex, race, and age, expressed in mL/min/1.73 m2 of the body surface area [28], and was classified by the Kidney Disease: Improving Global Outcomes 2012 Clinical Practice Guideline (KDIGO 2012) categories, similar to that used in a previous study by the research group [3].
2.4. Quantification of Vitamin D Metabolites
A blood sample was obtained from each patient from antecubital venipuncture after an overnight fast (12 h) and then centrifuged for 10 min to attain the serum. Calcidiol and calcitriol serum levels were determined using an ELISA plate reader (Multiskan GO, Thermo Scientific™ 51119000, Walthman, MA, USA) with commercial competitive ELISA assays. For the quantification of calcidiol (25-hydroxy-vitamin D), the human soluble 25-OH Vitamin D ELISA Kit (detection limit of 1.6 ng/mL, Eagle Biosciences®, VID31-K01, Amherst, NH, USA) was used, and for calcitriol (1,25α-dihydroxy-vitamin D3), the human soluble 1,25α(OH)2D3 ELISA kit (sensitivity < 0.10 pg/mL, Cusabio®, CSB-E0512h, Wuhan, P.R., China) was used, all according to the manufacturer’s instructions.
2.5. Classification Criteria and Definitions
The reference cut-off values for interpreting serum calcidiol levels were the same as those used in our previous study of SLE patients, according to the cut-off values reported [3].
For calcitriol, we stratified its levels into tertiles: (a) low calcitriol serum levels = T1st (0.33 to ≤33.9 pg/mL), (b) average calcitriol serum levels = T2nd (>33.9 to ≤48.1 pg/mL), and (c) high calcitriol serum levels = T3rd (>48.1 to 157.3 pg/mL).
To estimate the vitamin D hydroxylation efficiency, we calculated the calcitriol/calcidiol ratio based on values of calcitriol (pg/mL) and calcidiol (ng/mL), which resulted in arbitrary units (pg/ng) that should indicate how many pg of calcitriol is produced per ng of circulating calcidiol [3]. The calcitriol/calcidiol ratio score was also stratified into tertiles: (a) low conversion rate of calcidiol to calcitriol = T1st (0.01 to ≤1.39 pg/ng), (b) average conversion rate of calcidiol to calcitriol = T2nd (>1.39 to ≤2.26 pg/ng), and (c) high conversion rate of calcidiol to calcitriol = T3rd (>2.26 to 23.6 pg/ng).
2.6. Genotyping of the VDR Genetic Variants
Total genomic DNA (gDNA) was isolated from peripheral blood leukocytes by the salting-out method [29]. Allelic discrimination assays carried out genotyping. The polymerase chain reaction (PCR) experiments were carried out in Light Cycler 8-Tube Strips (white) set for 96 reactions (Roche Diagnostics, Indianapolis, IN, USA) on the LightCycler® 96 real-time PCR system (Roche Diagnostics, Indianapolis, IN, USA) as follows: 95 °C for 10 min, followed by 40 cycles of 95 °C for 15 s and 60 °C for 1 min. The FokI (C > T, rs2228570, C__12060045_20), BsmI (A > G, rs1544410, C___8716062_20), ApaI (A > C, rs7975232, C__28977635_10), and TaqI (C > T, rs731236, C___2404008_10) were identified using TaqManTM pre-designed genotyping assays (Applied Biosystems; Foster City, CA, USA). We randomly selected the samples in the subset for duplicate genotyping to confirm the genotypes of the four VDR genetic variants. We also used reference controls for each genotype assessed (VIC homozygous, FAM homozygous, and VIC/FAM heterozygous).
2.7. mRNA Expression of the VDR Gene
Total leukocytes were extracted from peripheral blood using density gradients (Lymphoprep™ H1077, 1077 g/mL, and Histopaque® H1119, 1119 g/mL). Total RNA was obtained from peripheral blood leukocytes of SLE patients and CS by using the Chomczynski and Sacchi method [30], and 1 μg was used for the cDNA synthesis. The cDNA synthesis was performed with oligo (dT) primers (Oligo (dT)15 Primer, C1101, PROMEGA Corporation, Fitchburg, WI, USA). The mRNA expression of VDR was determined by the TaqmanTM qPCR method (Hs00172113_m1, Applied Biosystems; Foster City, CA, USA). The PCR reaction was performed on a LightCycler Nano System (Roche Applied Science, Penzberg, Germany) using the conditions indicated in the TaqmanTM Gene Expression Assay protocol. All samples were run in triplicate. The mRNA relative analysis expression was performed through the 2−ΔΔCq method [31], and the glyceraldehyde 3-phosphate dehydrogenase (GAPDH) was used as a reference gene (Hs9999905_m1, Applied Biosystems).
2.8. Statistical Analysis
The statistical analyses were performed using STATA v 15 (College Station, TX, USA) and GraphPad Prism v 8.0 (San Diego, CA, USA). We evaluated the statistical power according to the calculation of sample size using the Fleiss formula for proportions in case-control studies [32]. According to the polymorphic frequencies of the VDR variants described in the González-Mercado study carried out in postmenopausal women from Western Mexico [33], we obtained a necessary sample size of at least 180 participants in each group to detect in the same number of alleles and risk genotypes described in the previous article in the Mexican population.
The Shapiro–Wilk test was used to determine the non-parametric and parametric distribution of the continuous variables. For the descriptive analysis, nominal variables were expressed as frequencies, continuous variables with parametric distribution were expressed as mean and standard deviation, and variables with non-parametric distribution were expressed as medians and percentiles from the 5th–95th. We determined the genotype and allele frequencies for the VDR gene variants by direct counting and performed the χ2 test to compare proportions between groups and to evaluate the Hardy–Weinberg equilibrium. To compare two groups, for parametric quantitative variables, we used the Student’s t-test, for non-parametric quantitative variables, we used the U Mann–Whitney test, and for more than two groups, we used the Kruskal–Wallis test.
We calculated the odds ratios (OR) with 95% confidence intervals (CI) to analyze the potential risk for SLE associated with the VDR gene variants. The linkage disequilibrium (LD) between VDR variants was expressed as Lewontin’s D’ corrected coefficient (D’) [34], and the haplotype frequencies were estimated using the expectation-maximization (EM) algorithm by Excoffier and Slatkin, both calculated with the SHEsis web tool [35,36].
We used logistic and linear regression models to evaluate the association between genotypes and haplogenotypes. For all analyses, the reference haplotype and haplogenotype were the most frequent. Differences were considered statistically significant at p < 0.05.
3. Results
3.1. Clinical Characteristics and Vitamin D Status in SLE and CS
In the present study, the SLE patients evaluated showed a median disease evolution time of 7 years, with 44% of clinical activity (Mex-SLEDAI ≥2), 34% of renal activity, 80% positivity to ANAs, and 43% to anti-dsDNA. The most administered drugs were prednisone (52%) and chloroquine (45%), while 20% reported the use of vitamin D supplements (8% cholecalciferol and 12% calcitriol) (Table 1).

Table 1.
Clinical characteristics in SLE patients.
Regarding the vitamin D status of the study groups, the median calcidiol was lower in SLE with 20.9 ng/mL (6.03 to 39.3) vs. CS with 23.1 ng/mL (10.9 to 39.4) (p = 0.03) with a frequency of calcidiol deficiency (<20 ng/mL) of 36% in SLE vs. 46% in CS without significant differences (p = 0.15). With respect to the calcitriol/calcidiol ratio, we observed a higher conversion of calcidiol to calcitriol in SLE with 2.16 pg/ng (0.73 to 10.5) vs. CS with 1.47 (0.33 to 4.31) (p < 0.001), reflected in higher calcitriol levels with 46.8 pg/mL (22.1 to 103) compared to CS with 36.8 pg/mL (9.64 to 82.6) (p < 0.001).
3.2. Genotypic and Allelic Frequencies of the VDR Variants in SLE vs. CS
The Hardy–Weinberg equilibrium of the VDR genetic variants was evaluated in the CS group and were observed in equilibrium in FokI (rs2228570) p = 0.77; BsmI (rs1544410) p = 0.68; ApaI (rs7975232) p = 0.85; TaqI (rs731236) p = 0.35.
We did not observe significant differences in the genotypic frequencies of the VDR variants between SLE patients vs. CS, and when determining different Ors, we also found no association with susceptibility to the disease. The most frequent genotypes for each VDR variants were the CT FokI genotype (SLE = 48% vs. CS = 51%; p = 0.32), GG BsmI genotype (SLE = 59% vs. CS = 59%; p = 0.99), AC ApaI genotype (SLE = 51% vs. CS = 48%; p = 0.77), and TT TaqI genotype (SLE = 56% vs. CS = 54%; p = 0.92) (Table 2).
Table 2.
Genotypic and allelic frequencies of VDR genetic variants in SLE patients and CS.
Regarding allelic frequencies, we did not observe significant differences between the study groups. The most frequent alleles were the C FokI allele (SLE = 50% vs. CS = 55%; p = 0.20), G BsmI allele (SLE = 77% vs. CS = 77%; p = 0.99), C ApaI allele (SLE = 58% vs. CS = 57%; p = 0.98), and T TaqI allele (SLE = 75% vs. 75%; p = 0.77) (Table 2).
3.3. Linkage Disequilibrium, Haplotypes, and Haplogenotypes of the VDR Variants in SLE and CS
We evaluated the linkage disequilibrium (LD) expressed as Lewontin’s D’ coefficient (D’) between the VDR variants. FokI was not in LD with the BsmI (D’ = 0.16), ApaI (D’ = 0.17), and TaqI (D’ = 0.13) genetic variants. In contrast, high LD was observed between the BsmI and ApaI (D’ = 0.93), BsmI and TaqI (D’ = 0.92), as well as in ApaI and TaqI (D’ = 0.78) variants, which is indicative that BsmI, ApaI, and TaqI are segregating in blocks or haplotypes in this population studied (Figure 1).
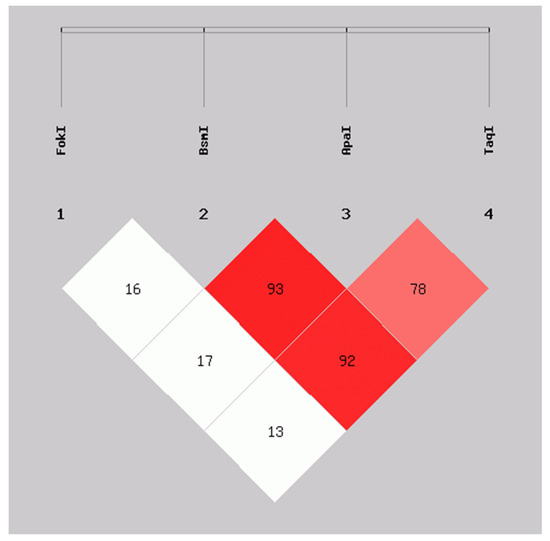
Figure 1.
Linkage disequilibrium between FokI, BsmI, ApaI, and TaqI variants in VDR in SLE patients and CS. D’ values: FokI:BsmI = 0.16, FokI:ApaI = 0.17, FokI:TaqI = 0.13, BsmI:ApaI = 0.93, BsmI:TaqI = 0.92, ApaI:TaqI = 0.78. Calculated with SHEsis online software. SLE: systemic lupus erythematosus; CS: control subjects.
Based on the previous findings, seven haplotypes of the VDR variants with high LD (BsmI, ApaI, and TaqI) present in the sample were inferred. From these, five haplogenotypes with a frequency greater than 5% were identified in the sample assessed, which were GCT/GCT, AAC/GAT, AAC/GCT, GAT/GCT, and GAT/GAT; as well as ten haplogenotypes with a frequency of less than 5%, which were grouped as “other haplogenotypes”, consisting of AAC/AAC, GAC/GCT, AAC/GCC, AAC/ACT, AAT/GCT, AAC/AAT, ACT/GCT, AAC/GAC, GCC/GCT, and GCC/GCC (Table 3).
Table 3.
Haplotypes and haplogenotypes of the BsmI, ApaI, and TaqI variants in VDR in SLE patients and CS.
We did not observe significant differences in the frequencies of the haplotypes (p = 0.94) and haplogenotypes (p = 0.71) between SLE and CS. The most frequent haplotypes were the GCT, with 53% in both groups, followed by the AAC (SLE = 22% vs. CS = 21%) and GAT (SLE = 21% vs. CS = 19%). The most frequent haplogenotypes were the GCT/GCT (SLE = 28% vs. CS = 30%) and the AAC/GCT (SLE = 24% vs. CS = 27%) (Table 3).
3.4. Vitamin D Status by FokI Genotypes and VDR Haplogenotypes in SLE Patients vs. CS
We compared the vitamin D serum levels to the FokI genotypes and VDR haplogenotypes in SLE patients vs. CS. Lower calcidiol levels were observed in SLE patients carrying the CT genotype (SLE = 19.2 ng/mL vs. CS = 23.6 ng/mL; p = 0.02) (Figure 2a), the GCT/GCT (SLE = 20.2 ng/mL vs. CS = 25.1 ng/mL, p = 0.02), and AAC/GAT haplogenotypes (SLE = 16.1 ng/mL vs. CS = 23.9 ng/mL, p = 0.01) (Figure 2b), while there was no difference in the presence of the TT, CC FokI genotypes, and other VDR haplogenotypes (Figure 2a,b, Table S1).
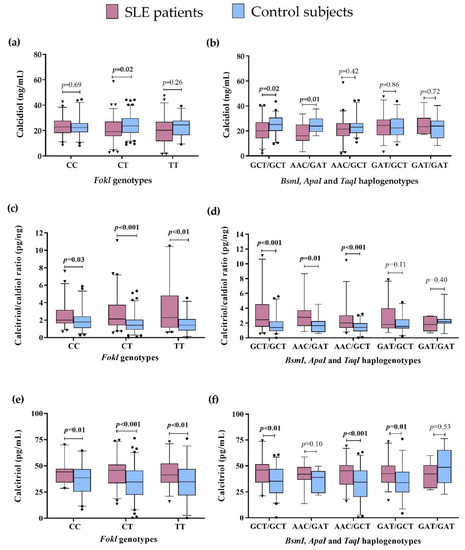
Figure 2.
Vitamin D metabolism variables by VDR genotypes and haplogenotypes in SLE patients vs. CS. (a) Calcidiol serum levels by FokI genotypes in SLE vs. CS; (b) Calcidiol serum levels by BsmI, ApaI, and TaqI haplogenotypes in SLE vs. CS; (c) Calcitriol/calcidiol ratio by FokI genotypes in SLE vs. CS; (d) Calcitriol/calcidiol ratio by BsmI, ApaI, and TaqI haplogenotypes in SLE vs. CS, I Calcitriol serum levels by FokI genotypes in SLE vs. CS; (f) Calcitriol serum levels by BsmI, ApaI, and TaqI haplogenotypes in SLE vs. CS. Data provided in medians (p05th–p95th), Mann–Whitney test. Bold numbers mean significant differences (p < 0.05). SLE: systemic lupus erythematosus.
We observed a higher calcitriol/calcidiol ratio in SLE patients compared to CS, regardless of the FokI genotype they carried: CC (SLE = 2.01 pg/ng vs. CS = 1.78 pg/ng, p = 0.03), CT (SLE = 2.24 pg/ng vs. CS = 1.41 pg/ng, p < 0.001), and TT (SLE = 2.64 pg/ng vs. CS = 1.42 pg/ng, p < 0.01) (Figure 2c), and also independently of the VDR haplogenotypes: GCT/GCT (SLE = 2.43 pg/ng vs. CS = 1.39 pg/ng, p<0.001), AAC/GAT (SLE = 2.80 pg/ng vs. CS = 1.65 pg/ng, p = 0.01), and AAC/GCT haplogenotypes (SLE = 2.09 pg/ng vs. CS = 1.41 pg/ng, p < 0.001) (Figure 2d), with no significant differences in the other haplogenotypes evaluated (Figure 2d, Table S1).
Regarding the above, we also observed higher calcitriol serum levels in SLE compared to CS, independently of the FokI genotypes in the carriers of CC (SLE = 46.10 pg/mL vs. CS = 39.82 pg/mL; p = 0.001), CT (SLE = 47.9 pg/mL vs. CS = 35.2 pg/mL, p < 0.001), and TT (SLE = 50.8 pg/mL vs. CS = 34.92 pg/mL, p < 0.01) genotypes (Figure 2e). Moreover, carriers of the GCT/GCT (SLE = 48.6 pg/mL vs. CS = 38.1, p < 0.01), AAC/GCT (SLE = 46.1 pg/mL vs. 34.4 pg/mL, p < 0.001), and GAT/GCT (SLE = 47.1 pg/mL vs. CS = 36.5 pg/mL, p = 0.01) haplogenotypes showed higher calcitriol serum levels in SLE compared to CS (Figure 2f). No differences in the other haplogenotype carriers were observed (Figure 2f, Table S1).
These results highlight that the differences observed in the vitamin D serum status are not influenced by the VDR haplogenotype presence in SLE patients and CS.
Additionally, we performed the analysis of these variables intra group. In SLE patients, we observed lower calcidiol serum levels in the presence of the AAC/GAT haplogenotype vs. GAT/GCT (p = 0.04). Concerning the CS, the AAC/GCT haplogenotype carriers vs. GAT/GAT showed a lower calcitriol/calcidiol ratio (p = 0.03) and lower calcitriol levels (p < 0.01) (Tables S1 and S2).
3.5. Association of the FokI Genotypes with the Vitamin D Status and Clinical Variables in SLE
In addition, we compared serum vitamin D status according to the FokI genotype within each study group. In the CS group, we did not observe significant findings, so in this section, the focus is on SLE. We observed lower calcidiol levels (19.1 ng/mL) and a higher frequency of calcidiol deficiency (53%) in the SLE patients carrying the CT FokI genotype, compared to other FokI genotypes, with non-significant differences. Concerning the calcitriol/calcidiol ratio, the SLE patients carrying the TT FokI genotype showed a significantly higher frequency in the 3rd tertile (53%; p < 0.01) compared to other genotypes (CT = 48% and CC = 38%; p < 0.01), while we did not observe a significant difference in the calcitriol tertiles (Table 4).
Table 4.
Vitamin D metabolism and clinical variables according to FokI genotypes in SLE patients.
Regarding the clinical characteristics, we observed a lower Mex-SLEDAI score in the SLE patients carrying the CT FokI genotype compared to patients with the other FokI genotypes (Mex-SLEDAI: CC = 1.5 vs. CT = 0 vs. TT = 2; p = 0.03) (Table 4). Moreover, the group of the CT FokI genotype showed higher values of weight (CC = 62.8 kg vs. CT = 68.4 kg vs. TT = 67.5 kg; p = 0.04) and BMI (CC = 25.4 kg/m2 vs. CT = 28.4 kg/m2 vs. TT = 27.3 kg/m2, p = 0.02), compared to other genotypes (Table 4).
Further, we compared the vitamin D status in SLE patients considering both the presence of clinical activity by the Mex-SLEDAI index and the VDR genotypes and haplogenotypes. Concerning calcidiol, we did not observe differences by FokI genotypes (Figure 3a). At the same time, by the VDR haplogenotypes, the SLE group with the AAC/GAT haplogenotype and clinical activity showed lower serum calcidiol (12.3 ng/mL, p = 0.03) compared to the SLE in remission carriers of the same haplogenotype (21.4 ng/mL) (Figure 3b). No differences were observed in the calcitriol/calcidiol ratio or serum calcitriol levels for VDR genotypes and haplotypes (Figure 3c–f, Table S3).
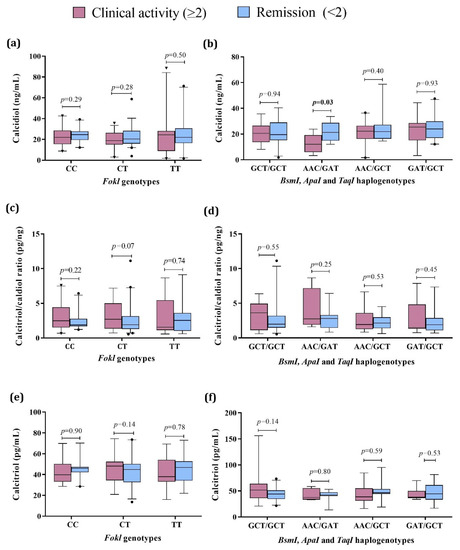
Figure 3.
Vitamin D metabolism variables by VDR genotypes and haplogenotypes in active vs. remission SLE patients. (a) Calcidiol serum levels by FokI genotypes in SLE by clinical activity; (b) Calcidiol serum levels by BsmI, ApaI, and TaqI haplogenotypes in SLE by clinical activity; (c) Calcitriol/calcidiol ratio by FokI genotypes in SLE by clinical activity; (d) Calcitriol/calcidiol ratio by BsmI, ApaI, and TaqI haplogenotypes in SLE by clinical activity; (e) Calcitriol serum levels by FokI genotypes in SLE by clinical activity; (f) Calcitriol serum levels by BsmI, ApaI, and TaqI haplogenotypes in SLE by clinical activity. Data provided in medians (p05th–p95th), Mann–Whitney test. Bold numbers mean significant differences (p < 0.05). SLE: systemic lupus erythematosus Clinical activity (Mex-SLEDAI ≥ 2), Remission (Mex-SLEDAI < 2).
In addition, we made the comparison according to renal activity. We did not observe significant differences in the calcidiol and calcitriol levels by the FokI genotypes and VDR haplogenotypes; regarding the calcitriol/calcidiol ratio, it was higher in patients with renal activity who were carriers of the CT FokI genotype, compared to those who did not present renal activity and were carriers of the same genotype (Table S4 and Figure S1).
3.6. VDR mRNA Expression in SLE Patients and CS by Vitamin D Status, Clinical Activity, and VDR Variants
Because the VDR expression can be influenced by genetic factors, such as the VDR variants, as well as by its ligand, we evaluated the mRNA VDR expression in peripheral blood leukocytes according to serum vitamin D status, FokI genotypes, VDR haplogenotypes, as well as according to clinical activity in the SLE group. In the comparison by study group, SLE patients showed a 9.56-fold higher VDR expression compared to CS (Figure 4a). In contrast, in SLE patients by clinical activity, the active patients showed 4.90-fold higher VDR expression compared to the remission group (Figure 4b).
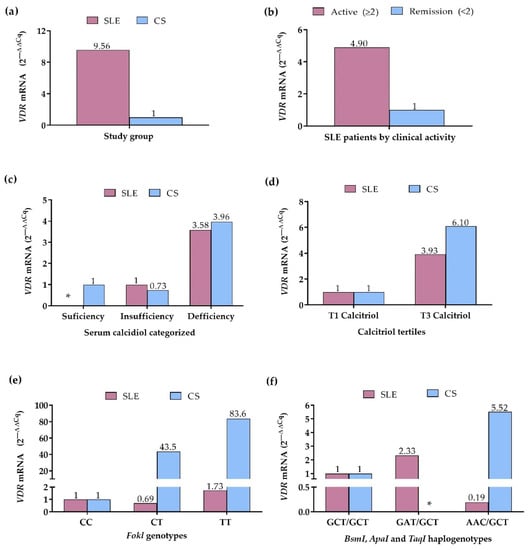
Figure 4.
VDR mRNA expression in SLE patients and CS. (a) VDR expression in SLE patients vs. CS (CS: reference group); (b) VDR expression in SLE patients by clinical activity (Remission: reference group); (c) VDR expression in SLE patients and CS by calcidiol categorized (Sufficiency: reference group); (d) VDR expression in SLE patients and CS by calcitriol tertiles (T1: reference grI); (e) VDR expression in SLE patients and CS by FokI genotypes (CC genotype: reference group); (f) VDR expression in SLE patients and CS by BsmI, ApaI, and TaqI haplogenotypes (GCT/GCT haplogenotype: reference group. mRNA expression. Reference group = 1. 2 −∆∆Cq Method. SLE: systemic lupus erythematosus. CS: control subjects. *: without data.
According to the categorized calcidiol levels, SLE patients with calcidiol deficiency showed 3.58-fold higher VDR expression compared to SLE patients with insufficiency; in the CS with calcidiol insufficiency, 1.36-fold lower VDR expression was observed (2ΔΔCq = 0.73), whereas CS with deficiency showed 3.96-fold higher VDR expression, compared to CS with calcidiol sufficiency (Figure 4c). Complementary to the above, in the comparison by the calcitriol tertiles, 3.93-fold higher VDR expression was observed in SLE patients within the 3rd tertile, and in CS within the 3rd tertile, a 6.10-fold higher VDR expression was observed, compared to 1st tertile groups (Figure 4d).
In the analysis by the FokI variant, the CC genotype group of SLE and CS was considered the reference to assess the change in expression of the CT and TT genotypes. In SLE patients, VDR expression was 1.44-fold lower (2ΔΔCq = 0.69) in CT carriers and 1.73-fold higher in TT carriers, while in CS, the expression was 43.5-fold higher in CT and 83.6-fold higher in TT genotype carriers, compared to the CC genotype group (Figure 4e).
By the VDR haplogenotypes, the most frequent haplogenotype in SLE and CS, GCT/GCT, was taken as the reference and compared with the GAT/GCT and AAC/GCT haplogenotypes, which also presented high frequencies in both groups. In SLE, the GAT/GCT haplogenotype carriers showed a 2.33-fold higher VDR expression, while the AAC/GCT carriers exhibited a 5.26-fold lower VDR expression compared to the GCT/GCT group; in the CS, the AAC/GCT haplogenotype carriers presented 5.52-fold higher VDR expression than the CS with the reference haplogenotype (Figure 4f).
4. Discussion
In this case-control study, we explored the associations of VDR gene variants (FokI, BsmI, ApaI, and TaqI) with susceptibility to SLE, vitamin D serum status, and VDR mRNA expression in Mexican-Mestizo women. Before performing the association analysis, we verified that the Hardy–Weinberg equilibrium principle was fulfilled in the control group, as representatives of the general population [37]. In our study, the VDR variants evaluated were in Hardy–Weinberg equilibrium in both study groups, which is indicative that the alleles of all variants evaluated were randomly segregated from one generation to another and the sample was representative of the population assessed. [37].
We did not observe significant differences in the genotypic and allelic frequencies of the four VDR variants evaluated between SLE patients and CS, nor association with genetic risk for SLE. The frequencies observed were similar to those reported in postmenopausal women with and without osteoporosis from Western Mexico [33]. In contrast, previous SLE studies have reported various inconsistent association results with the VDR variants. In Egypt, a case-control study showed that the CC (FF) FokI genotype (OR = 4.9) and C (F) allele (OR = 1.9); AG (Bb) BsmI genotype (OR = 2.5), AA (BB) genotype (OR = 5.9), and A (B) allele (OR = 2.3); AA (AA) ApaI genotype (OR = 2.8) were associated with genetic risk to SLE [38]. In another study in Bulgaria, the risk genotypes and alleles for SLE were the CT (Ff) and TT (ff) FokI genotypes (OR = 2.6) and T (f) allele (OR = 2.14); AG (Bb) and GG (bb) BsmI genotypes (OR = 2.7) and G (b) allele (OR = 2.0) [39]. Similarly in India, the CT (Ff) (OR = 2.80) and TT (ff) FokI genotypes (OR = 2.57) and T (f) allele (OR = 1.96); CT (Tt) TaqI genotype (OR = 2.07) and T (t) TaqI allele (OR = 1.60) were associated with SLE [21].
These differences observed between populations of different populations highlight the role of racial influence and genetic factors in the susceptibility to autoimmunity diseases such as SLE [40]. In the Mexican-Mestizo population, there is a more significant Amerindian component on the coasts and south of Mexico, while a more important Caucasian component is in western and northern Mexico [41]. Our population assessed has a genetic background of Amerindian (21–25%), Caucasian (60–64%), and African (15%) ancestry, which gave origin to the Mexican-Mestizo population [41]. These results are evidence that the genetic structure of our Mexican-Mestizo population could mark differences in the frequency distribution of the VDR variants and its potential association with SLE or SLE clinical manifestations compared to other SLE populations.
Linkage disequilibrium is a valuable analysis that allows the location of disease-related genetic variants [37]. In the Mexican-Mestizo population evaluated in the present study, the BsmI, ApaI, and TaqI genetic variants in VDR presented a strong linkage disequilibrium (LD > 0.78), while the FokI variant was not in LD with these VDR variants. A strong LD indicates that their alleles are segregated in a block (called a haplotype) from one generation to another and may confer a similar risk [40]. Similar to our study, in various populations, such as Caucasian subjects with liver cirrhosis [42], children with lupus nephritis from Colombia [43], and postmenopausal women from western Mexico [33], the Bsml, Apal, and Taql have been described with strong linkage disequilibrium. In contrast, Fokl is on a low DL with the other VDR variants [33,42,43].
A haplotype is a group of genetic variants within an organism inherited from a single parent [44]. A diploid individual inherits a copy from each parent, so the combinations between genotypes would be called haplogenotype. Therefore, we decided to analyze haplotypic and haplogenotypic frequencies in the evaluated population. Regarding this, we did not observe significant differences between the SLE and CS groups, with a higher frequency of GCT/GCT, AAC/GCT, and GAT/GCT in both. Although many studies have addressed the relationship between VDR gene individual variants and the vitamin D status and SLE risk, few have analyzed this in terms of haplotypes or haplogenotypes. In previous studies in Egypt, the cAC (or FBa, in its reported form with the initial letter of the FokI, BsmI, and ApaI variants; OR = 2.5) and also CAA (or FBA; OR = 6.5) haplotypes were associated with SLE [38], while in another study the fb haplotype showed a higher frequency in SLE patients [45]. Furthermore, there is no consensus on the nomenclature to refer to the alleles of the VDR genetic variants. In some studies, authors used the first letter of the variant’s name in uppercase (ancestral allele) or lowercase polymorphic allele), while in others, such as in our study, the authors used the initial of the nucleotides involved in the change in the nucleotide sequence.
Concerning other studies, in Egyptian [17,46] and Brazilian SLE patients [47] the FF FokI genotype compared to the ff genotype was associated with lower calcidiol levels. Our study observed an association of the CT FokI genotype with lower calcidiol levels in SLE patients compared to CS. In contrast, higher calcitriol/calcidiol ratio and higher calcitriol levels were observed in SLE compared to CS, independently of the FokI genotypes. This phenomenon indicates that the presence of genetic variants may influence the presence of low calcidiol levels in SLE, while the high conversion of calcidiol to calcitriol, as well as the higher calcitriol levels observed in SLE, could be due to other factors, such as the inflammatory process and exacerbation of the autoimmune response that patients experience. Various extrarenal cells, such as activated immune system cells, can produce calcitriol [48]. The activation of B cells induces the expression of the 1α-hydroxylases enzyme (CYP27B1), which leads to the synthesis and increase in calcitriol levels [12,48]. In other inflammatory diseases, such as asthma and chronic obstructive pulmonary disease (COPD), vitamin D metabolism may be deregulated by inflammatory processes. In these situations, there is an increase in cytokines, such as TNF-α, IL-1β, and TGF-β, which can induce the expression of the CYP27B; additionally, higher values of the calcitriol/calcidiol ratio and calcitriol levels have been observed in patients with these diseases compared to healthy subjects [49], similar to the pattern observed in our study where patients with SLE also have an inflammatory process.
We observed that SLE patients carrying the GCT/GCT haplogenotype presented lower calcidiol levels and a higher conversion of calcidiol to calcitriol, reflected in high calcitriol levels, compared to CS. In addition, we observed a lower serum calcidiol in the presence of the AAC/GAT haplogenotype, a higher calcitriol/calcidiol ratio in the presence of AAC/GAT and AAC/GCT, as well as higher calcitriol levels in the presence of AAC/GCT and GAT/GCT haplogenotypes in SLE patients vs. CS. No previous studies report similar results regarding analyzing serum vitamin D by the VDR haplogenotypes.
In the comparison within the SLE group, we did not observe significant differences between the calcidiol and calcitriol levels by the FokI genotypes. However, a higher frequency in the tertile 3 of the calcitriol/calcidiol ratio was observed in patients carrying the TT FokI genotype. In previous studies, in Egyptian SLE patients, higher SLEDAI scores were observed in carriers of the CC (FF) FokI and AA (BB) BsmI genotypes (p < 0.05) of the CAA (FBA) haplotype ( p< 0.001) [38], as well as in carriers of the CC (FF) FokI genotype in other Egyptian SLE populations [17,46]. Interestingly, the present study observed the CT FokI genotype associated with lower clinical activity in SLE patients. The CC and TT genotypes were associated with higher clinical activity assessed by the Mex-SLEDAI, while for BsmI, ApaI, and TaqI genetic variants we did not find significant differences. Subsequently, based on this finding, we analyzed serum vitamin D status according to clinical activity together with the VDR genotypes and haplogenotypes, and we did not observe an association.
The relationship observed in our study and others regarding the CC (FF) FokI genotype with the clinical disease activity in SLE, may be because of functionality. This genetic variant (the presence of the C or F allele) generates a new start codon (ATG) 9 bases pairs after the common starting site, which translates to a shorter VDRA protein of 424 amino acids instead of the wild-type full-length VDRA isoform of 427 amino acids [4,35]. The short VDRA isoform is somewhat more active than the long VDRA isoform in terms of its transactivation capacity as a transcription factor [4,36,37]. This greater transactivation capacity of the VDR in SLE patients could be causing this transcription factor to favor more polarization of the Th2 cell phenotype, which has been reported to be favored by calcitriol by inducing upregulation of GATA3 and STAT6 [12,50], and this cell profile plays a crucial role in the pathophysiology of SLE [51,52].
Additionally, we observed a higher BMI and weight in SLE patients carrying the CT FokI genotype. In this same group, we observed lower calcidiol levels than CS, and also a higher frequency of calcidiol deficiency, although not significant, whereby the excess weight present in those patients could influence this. Due to its fat-soluble characteristic, vitamin D can be stored in adipose tissue [53,54]. Subjects with normal weight and obesity can have similar vitamin D levels; however, in the presence of obesity, the compartments where calcidiol can be distributed, such as serum, muscle, fat, and liver, are increased [55].
When evaluating the VDR mRNA expression considering different categorical variables, we observed a higher VDR expression in SLE patients compared with CS. The VDR is expressed in different immune system cells, such as activated T and B lymphocytes, neutrophils, macrophages, and dendritic cells [12,56,57]; thus, its increased expression in SLE patients could be a reflection of hyperactivation of the immune system, as well as the presence of high levels of calcitriol observed in these patients since the VDR is a ligand-dependent receptor [12]. It has been described that the existence of multiple enhancers in the VDR gene locus may contribute to calcitriol-induced VDR expression [24].
To confirm those mentioned above, we made the comparison according to the calcidiol and calcitriol levels. In SLE and CS, we also observed a higher VDR expression in the presence of calcidiol deficiency and when we identified higher calcitriol levels represented by the tertile 3. The association between serum vitamin D status and VDR expression has not been described in the literature; however, other studies have evaluated VDR protein by immunoassays and flow cytometry. In a female BALB/c mouse model, others observed that the group with pristane-induced lupus that received 2 mg./kg/day of calcitriol showed a positive correlation between the VDR protein expression with the IgG infiltrates in the hippocampus detected by immunoassay. This increase in the infiltrate indicates an inflammatory process stimulated by the VDR protein expression [58]. In the presence of high calcitriol levels, a greater uptake and processing of autoantigens could favor the autoreactive immune response; hence, the beneficial effect of vitamin D can be obtained in moderate doses [59].
Another remarkable finding is the higher VDR mRNA expression in SLE patients with clinical activity compared with in remission, which could be related to an inflammatory process in the disease. In China, other authors who determined VDR expression by flow cytometry found a similar result to our finding in SLE patients and healthy subjects. They reported that VDR protein expression on CD4+ T helper (Th) cells and their subsets, especially Th1, T regulatory (Treg), and T follicular helper cells (Tfh), was increased in SLE; additionally, VDR expression was positively associated with clinical disease activity and cell apoptosis in SLE patients [60].
We also observed higher VDR mRNA expression in SLE patients and CS carriers of the TT FokI genotype compared to those carrying the CC genotype. We hypothesize that this could be due to a compensatory mechanism since the CC FokI genotype contains the C (or F) allele associated with generating the short isoform of 424 amino acids of VDR. This isoform has a greater capacity for transactivation since it interacts more efficiently with the transcription factor TFIIB [22] compared to the 427 amino acid-long VDR isoform associated with the T (or f) allele or TT FokI genotype, which would be expressing the VDR mRNA in greater quantity to compensate its low transactivation activity. However, no study previously supports this hypothesis regarding the VDR expression by the FokI VDR genotypes in autoimmune or healthy conditions; therefore, this hypothesis must be taken with caution or as a perspective for future studies.
According to our results, the strength of the present study was that the sample of SLE patients and CS evaluated was homogeneous in the following characteristics: all participants were female, from the same geographic area, classified as the Mexican-Mestizo population with three ancestors in the same geographic region, and of similar age, which reduces the bias regarding environmental and genetic factors of ancestry that could influence the results.
With the present study, we do not suggest causality between the variables evaluated; due to its cross-sectional design, it only provides information on a specific time point. Another limitation is that we only provided information about the global clinical disease activity and renal activity in our population; however, we were unable to assess the clinical activity of other specific organs. We have the prospect of conducting future studies where we evaluate the serum levels of VDR by ELISA and the different VDR isoforms by Western Blot to determine their possible association with the VDR variants and clinical variables and, furthermore, to evaluate the expression of immune system cells that express VDR and that play a key role in the pathophysiology of SLE. Therefore, further studies in SLE focused on these points will be necessary. These will help to support the clinical and translational nutrigenetic interventions with vitamin D supplementation according to the VDR genetic variants in subsequent studies conducted on patients with autoimmune diseases.
5. Conclusions
The FokI variant was not in linkage disequilibrium with BsmI, ApaI, and TaqI VDR variants in the Mexican-Mestizo population. SLE patient carriers of the TT FokI genotype showed higher clinical disease activity scores. Notably, the VDR mRNA expression was higher in SLE patients vs. CS, in active vs. inactive SLE patients, and in participants of both study groups with vitamin D deficiency, higher calcitriol levels, and TT FokI VDR genotype carriers.
Supplementary Materials
The following supporting information can be downloaded at: https://www.mdpi.com/article/10.3390/genes13112016/s1, Figure S1: Calcitriol/calcidiol ratio by VDR genotypes and haplogenotypes in SLE patients by clinical activity; Table S1: Vitamin D serum status between SLE patients vs. CS according the FokI genotypes and VDR haplogenotypes; Table S2: Vitamin D serum status analysis intra each group (SLE patients and CS) by the FokI genotypes and VDR haplogenotypes; Table S3: Vitamin D serum status in SLE patients by clinical activity according the FokI genotypes and VDR haplogenotypes; Table S4: Vitamin D metabolism variables and VDR variants in SLE patients stratified by renal activity.
Author Contributions
Conceptualization, U.D.l.C.-M.; Methodology, I.P.-R., B.V., M.M.-B., S.L. and U.D.l.C.-M.; Formal analysis, M.R.M.-M., M.R.-E., A.I.R.-B. and U.D.l.C.-M.; Investigation, M.R.M.-M., M.R.-E., A.I.R.-B., K.P.-C., B.C.-L. and P.E.M.-G.; Funding acquisition, U.D.l.C.-M.; Writing—original draft, M.R.M.-M.; Writing—review and editing, M.R.M.-M., U.D.l.C.-M., I.P.-R., B.V., M.M.-B., S.L. and S.C.-C.; Visualization, U.D.l.C.-M.; Supervision, U.D.l.C.-M.; Project administration, U.D.l.C.-M. All authors have read and agreed to the published version of the manuscript.
Funding
This study was supported by Grant “Programa de Apoyo a la Mejora en las Condiciones de Producción de los Miembros del SNI y SNCA 2019-2022” (U.d.l.C.M. and B.V.) and, in part, by the Grant “Programa de Impulso a la Investigación (PIN) 2020” (U.d.l.C.M.) from the Universidad de Guadalajara for Ulises de la Cruz-Mosso, (U.d.l.C.M.).
Institutional Review Board Statement
Informed written consent was obtained from all patients and subjects before enrollment in the study. The study was conducted in agreement with the International Ethical Guidelines for Health-related Research Involving Humans of the Council for International Organizations of Medical Sciences (CIOMS). The Research Ethical Committee of the Centro Universitario de Ciencias de la Salud, Universidad de Guadalajara (C.I. 03419 CUCS-UdG) and the Research Ethical Committee of the Hospital Civil Fray Antonio Alcalde (No. 280/19) approved the protocol.
Informed Consent Statement
Informed consent was obtained from all subjects involved in the study.
Data Availability Statement
Data used to support the findings of this study are available from the corresponding author upon reasonable request.
Acknowledgments
We thank all the participants, SLE patients, and healthy subjects. We acknowledge the clinical and logistic support for the recruitment of the SLE patients given by the rheumatologists from the Departamento de Reumatología, O.P.D. Hospital Civil de Guadalajara Fray Antonio Alcalde, Guadalajara, Jalisco, Mexico. As part of our social commitment, patients and volunteers are provided with useful information of their calcidiol serum levels, and recommendations to improve the presence of hypovitaminosis D and their daily dietary vitamin D intake.
Conflicts of Interest
The authors declare no conflict of interest and the funders had no role in the design of the study; in the collection, analyses, or interpretation of data; in the writing of the manuscript, or in the decision to publish the results.
References
- Mahto, H.; Tripathy, R.; Das, B.K.; Panda, A.K. Association between vitamin D receptor polymorphisms and systemic lupus erythematosus in an Indian cohort. Int. J. Rheum. Dis. 2018, 21, 468–476. [Google Scholar] [CrossRef] [PubMed]
- Bae, S.C.; Lee, Y.H. Vitamin D receptor FokI, TaqI, and ApaI polymorphisms and susceptibility to systemic lupus erythematosus: An updated meta-analysis. Clin. Rheumatol. 2018, 37, 1529–1537. [Google Scholar] [CrossRef] [PubMed]
- Meza-Meza, M.R.; Muñoz-Valle, J.F.; Ruiz-Ballesteros, A.I.; Vizmanos-Lamotte, B.; Parra-Rojas, I.; Martínez-López, E. Association of High Calcitriol Serum Levels and Its Hydroxylation Efficiency Ratio with Disease Risk in SLE Patients with Vitamin D Deficiency. J. Immunol. Res. 2021, 2021, 2808613. [Google Scholar] [CrossRef]
- Ruiz-Ballesteros, A.I.; Meza-Meza, M.R.; Vizmanos-Lamotte, B.; Parra-Rojas, I.; de la Cruz-Mosso, U. Association of Vitamin D Metabolism Gene Polymorphisms with Autoimmunity: Evidence in Population Genetic Studies. Int. J. Mol. Sci. 2020, 21, 9626. [Google Scholar] [CrossRef] [PubMed]
- Eloi, M.; Horvath, D.V.; Ortega, J.C.; Prado, M.S.; Andrade, L.E.C.; Szejnfeld, V.L. 25-Hydroxivitamin D Serum Concentration, Not Free and Bioavailable Vitamin D, Is Associated with Disease Activity in Systemic Lupus Erythematosus Patients. PLoS One 2017, 12, e0170323. [Google Scholar] [CrossRef]
- Ceccarelli, F.; Perricone, C.; Borgiani, P.; Ciccacci, C.; Rufini, S.; Cipriano, E. Genetic Factors in Systemic Lupus Erythematosus: Contribution to Disease Phenotype. J. Immunol. Res. 2015, 2015, 1–11. [Google Scholar] [CrossRef]
- Relle, M.; Weinmann-Menke, J.; Scorletti, E.; Cavagna, L.; Schwarting, A. Genetics and novel aspects of therapies in systemic lupus erythematosus. Autoimmun. Rev. 2015, 14, 1005–1018. [Google Scholar] [CrossRef]
- Ramos, P.S.; Brown, E.E.; Kimberly, R.P.; Langefeld, C.D. Genetic Factors Predisposing to Systemic Lupus Erythematosus and Lupus Nephritis. Semin. Nephrol. 2010, 30, 164–176. [Google Scholar] [CrossRef]
- Ong, S.G.; Ding, H.J. Vitamin D status in a monocentric cohort of systemic lupus erythematosus (SLE) patients and correlations with clinical and immunological profile. Med. J. Malaysia 2019, 74, 492–498. [Google Scholar] [PubMed]
- Yap, K.S.; Northcott, M.; Hoi, A.B.Y.; Morand, E.F.; Nikpour, M. Association of low vitamin D with high disease activity in an Australian systemic lupus erythematosus cohort. Lupus Sci. Med. 2015, 2, e000064. [Google Scholar] [CrossRef]
- Zheng, Z.H.; Gao, C.C.; Wu, Z.Z.; Liu, S.Y.; Li, T.F.; Gao, G.M. High prevalence of hypovitaminosis D of patients with autoimmune rheumatic diseases in China. Am. J. Clin. Exp. Immunol. 2016, 5, 48–54. [Google Scholar] [PubMed]
- Dankers, W.; Colin, E.M.; van Hamburg, J.P.; Lubberts, E. Vitamin D in Autoimmunity: Molecular Mechanisms and Therapeutic Potential. Front. Immunol. 2017, 7, 697. [Google Scholar] [CrossRef] [PubMed]
- Mak, A. The Impact of Vitamin D on the Immunopathophysiology, Disease Activity, and Extra-Musculoskeletal Manifestations of Systemic Lupus Erythematosus. Int. J. Mol. Sci. 2018, 19, 2355. [Google Scholar] [CrossRef] [PubMed]
- Álvarez-Hernández, D.; Naves-Díaz, M.; Gómez-Alonso, C.; Cannata-Andía, J.B. Los polomorfismos del gen del receptor de la vitamina D (VDR) modulan la respuesta a la vitamina D de forma tejido específica. Rev. Esp. Enferm. Metab. Óseas 2007, 16, 20–27. [Google Scholar] [CrossRef]
- Bover, J.; Egido, J.; Fernández-Giráldez, E.; Praga, M.; Solozábal-Campos, C.; Torregrosa, J.V. Vitamina D, receptor de la vitamina D e importancia de su activación en el paciente con enfermedad renal crónica. Nefrología (Madr.) 2015, 35, 28–41. [Google Scholar] [CrossRef]
- Boonstra, A.; Barrat, F.J.; Crain, C.; Heath, V.L.; Savelkoul, H.F.; O’Garra, A. 1alpha,25-Dihydroxyvitamin d3 has a direct effect on naive CD4(+) T cells to enhance the development of Th2 cells. J. Immunol. 2001, 167, 4974–4980. [Google Scholar] [CrossRef]
- Gado, K.H.; Gado, T.H.; Samie, R.M.A.; Khalil, N.M.; Emam, S.L.; Fouad, H.H. Clinical significance of vitamin D deficiency and receptor gene polymorphism in systemic lupus erythematosus patients. Egypt Rheumatol. 2017, 39, 159–164. [Google Scholar] [CrossRef]
- Zenata, O.; Vrzal, R. Fine tuning of vitamin D receptor (VDR) activity by post-transcriptional and post-translational modifications. Oncotarget 2017, 8, 35390–35402. [Google Scholar] [CrossRef]
- Cieślińska, A.; Kostyra, E.; Fiedorowicz, E.; Snarska, J.; Kordulewska, N.; Kiper, K. Single Nucleotide Polymorphisms in the Vitamin D Receptor Gene (VDR) May Have an Impact on Acute Pancreatitis (AP) Development: A Prospective Study in Populations of AP Patients and Alcohol-Abuse Controls. Int. J. Mol. Sci. 2018, 19, 1919. [Google Scholar] [CrossRef]
- Hasan, H.A.; AbuOdeh, R.O.; Muda, W.A.M.B.W.; Mohamed, H.J.B.J.; Samsudin, A.R. Association of Vitamin D receptor gene polymorphisms with metabolic syndrome and its components among adult Arabs from the United Arab Emirates. Diabetes Metab. Syndr. 2017, 11, S531–S537. [Google Scholar] [CrossRef]
- Yiallourou, A.I.; Ekonomou, E.; Tsamadias, V.; Nastos, K.; Karapanos, K.; Papaconstantinou, I. Association of FokI and PvuII polymorphisms with breast cancer staging and survival among Caucasian women: A prospective study. J. BUON 2014, 19, 633–642. [Google Scholar] [PubMed]
- Uitterlinden, A.G.; Fang, Y.; Van Meurs, J.B.J.; Pols, H.A.P.; Van Leeuwen, J.P.T.M. Genetics and biology of vitamin D receptor polymorphisms. Gene 2004, 338, 143–156. [Google Scholar] [CrossRef] [PubMed]
- Lee, S.M.; Meyer, M.B.; Benkusky, N.A.; O’Brien, C.A.; Pike, J.W. The impact of VDR expression and regulation in vivo. J. Steroid. Biochem. Mol. Biol. 2018, 177, 36–45. [Google Scholar] [CrossRef]
- Kongsbak, M.; Levring, T.B.; Geisler, C.; von Essen, M.R. The vitamin d receptor and T cell function. Front. Immunol. 2013, 4, 148. [Google Scholar] [CrossRef]
- Hochberg, M.C. Updating the American College of Rheumatology revised criteria for the classification of systemic lupus erythematosus. Arthritis Rheum. 1997, 40, 1725. [Google Scholar] [CrossRef] [PubMed]
- Ruiz-Quezada, S.; Vázquez-Del Mercado, M.; Parra-Rojas, I.; Rangel-Villalobos, H.; Best-Aguilera, C.; Sánchez-Orozco, L.V. Genotype and allele frequency of PAI-1 promoter polymorphism in healthy subjects from the west of Mexico. Association with biochemical and hematological parameters. Ann. Genet. 2004, 47, 155–162. [Google Scholar] [CrossRef]
- Uribe, A.G.; Vilá, L.M.; McGwin, G.; Sanchez, M.L.; Reveille, J.D.; Alarcón, G.S. The Systemic Lupus Activity Measure-revised, the Mexican Systemic Lupus Erythematosus Disease Activity Index (SLEDAI), and a modified SLEDAI-2K are adequate instruments to measure disease activity in systemic lupus erythematosus. J. Rheumatol. 2004, 31, 1934–1940. [Google Scholar] [PubMed]
- Gladman, D.; Ginzler, E.; Goldsmith, C.; Fortin, P.; Liang, M.; Urowitz, M. The development and initial validation of the Systemic Lupus International Collaborating Clinics/American College of Rheumatology damage index for systemic lupus erythematosus. Arthritis Rheum. 1996, 39, 363–369. [Google Scholar] [CrossRef]
- Miller, S.A.; Dykes, D.D.; Polesky, H.F. A simple salting out procedure for extracting DNA from human nucleated cells. Nucleic Acids Res. 1988, 16, 1215. [Google Scholar] [CrossRef]
- Chomczynski, P.; Sacchi, N. Single-step method of RNA isolation by acid guanidinium thiocyanate-phenol-chloroform extraction. Anal. Biochem. 1987, 162, 156–159. [Google Scholar] [CrossRef]
- Livak, K.J.; Schmittgen, T.D. Analysis of relative gene expression data using real-time quantitative PCR and the 2(-Delta Delta C(T)) Method. Methods 2001, 25, 402–408. [Google Scholar] [CrossRef] [PubMed]
- OpenEpi: Open Source Epidemiologic Statistics for Public Health, Version 2.3.1 – ScienceOpen. Available online: https://www.scienceopen.com/document?vid=61cdd360-9883-4330-8c18-3f0341b0f715 (accessed on 21 September 2022).
- González-Mercado, A.; Sánchez-López, J.Y.; Regla-Nava, J.A.; Gámez-Nava, J.I.; González-López, L.; Duran-Gonzalez, J. Association analysis of vitamin D receptor gene polymorphisms and bone mineral density in postmenopausal Mexican-Mestizo women. Genet. Mol. Res. 2013, 12, 2755–2763. [Google Scholar] [CrossRef] [PubMed]
- Lewontin, R.C. The Interaction of Selection and Linkage. I. General Considerations; Heterotic Models. Genetics 1964, 49, 49–67. [Google Scholar] [CrossRef] [PubMed]
- Excoffier, L.; Slatkin, M. Maximum-likelihood estimation of molecular haplotype frequencies in a diploid population. Mol. Biol. Evol. 1995, 12, 921–927. [Google Scholar] [CrossRef]
- Shi, Y.Y.; He, L. SHEsis, a powerful software platform for analyses of linkage disequilibrium, haplotype construction, and genetic association at polymorphism loci. Cell Res. 2005, 15, 97–98. [Google Scholar] [CrossRef]
- Iniesta, R.; Guinó, E.; Moreno, V. Análisis estadístico de polimorfismos genéticos en estudios epidemiológicos. Gac. Sanit. 2005, 19, 333–341. [Google Scholar] [CrossRef]
- Emerah, A.A.; El-Shal, A.S. Role of vitamin D receptor gene polymorphisms and serum 25-hydroxyvitamin D level in Egyptian female patients with systemic lupus erythematosus. Mol. Biol. Rep. 2013, 40, 6151–6162. [Google Scholar] [CrossRef]
- Dzhebir, G.; Kamenarska, Z.; Hristova, M.; Savov, A.; Vinkov, A.; Kaneva, R. Association of vitamin D receptor gene BsmI B/b and FokI F/f polymorphisms with adult dermatomyositis and systemic lupus erythematosus. Int. J. Dermatol. 2016, 55, e465–e468. [Google Scholar] [CrossRef]
- De la Cruz-Mosso, U.; Bucala, R.; Palafox-Sánchez, C.A.; Parra-Rojas, I.; Padilla-Gutiérrez, J.R.; Pereira-Suárez, A.L. Macrophage migration inhibitory factor: Association of -794 CATT5-8 and -173 G>C polymorphisms with TNF-α in systemic lupus erythematosus. Hum. Immunol. 2014, 75, 433–439. [Google Scholar] [CrossRef]
- Rangel-Villalobos, H.; Muñoz-Valle, J.F.; González-Martín, A.; Gorostiza, A.; Magaña, M.T.; Páez-Riberos, L.A. Genetic admixture, relatedness, and structure patterns among Mexican populations revealed by the Y-chromosome. Am. J. Phys. Anthropol. 2008, 135, 448–461. [Google Scholar] [CrossRef]
- Triantos, C.; Aggeletopoulou, I.; Kalafateli, M.; Spantidea, P.I.; Vourli, G.; Diamantopoulou, G. Prognostic significance of vitamin D receptor (VDR) gene polymorphisms in liver cirrhosis. Sci. Rep. 2018, 8, 14065. [Google Scholar] [CrossRef] [PubMed]
- Garavito, G.; Egea, E.; Fang, L.; Malagón, C.; Olmos, C.; González, L. Association of polymorphic variants of PTPN22, TNF and VDR genes in children with lupus nephritis: A study in Colombian family triads. Biomédica 2017, 37, 260–266. [Google Scholar] [CrossRef] [PubMed]
- Thakkinstian, A.; D’Este, C.; Attia, J. Haplotype analysis of VDR gene polymorphisms: A meta-analysis. Osteoporos. Int. 2004, 15, 729–734. [Google Scholar] [CrossRef] [PubMed]
- Zhou, T.B.; Jiang, Z.P.; Lin, Z.J.; Su, N. Association of vitamin D receptor gene polymorphism with the risk of systemic lupus erythematosus. J. Recept. Signal Transduct. Res. 2015, 35, 8–14. [Google Scholar] [CrossRef] [PubMed]
- Mao, S.; Huang, S. Association between vitamin D receptor gene BsmI, FokI, ApaI and TaqI polymorphisms and the risk of systemic lupus erythematosus: A meta-analysis. Rheumatol. Int. 2014, 34, 381–388. [Google Scholar] [CrossRef]
- Carvalho, C.; Marinho, A.; Leal, B.; Bettencourt, A.; Boleixa, D.; Almeida, I. Association between vitamin D receptor (VDR) gene polymorphisms and systemic lupus erythematosus in Portuguese patients. Lupus 2015, 24, 846–853. [Google Scholar] [CrossRef]
- Zittermann, A.; Tenderich, G.; Koerfer, R. Vitamin D and the adaptive immune system with special emphasis to allergic reactions and allograft rejection. Inflamm. Allergy Drug Targets 2009, 8, 161–168. [Google Scholar] [CrossRef] [PubMed]
- Jolliffe, D.A.; Stefanidis, C.; Wang, Z.; Kermani, N.Z.; Dimitrov, V.; White, J.H. Vitamin D Metabolism Is Dysregulated in Asthma and Chronic Obstructive Pulmonary Disease. Am. J. Respir. Crit. Care Med. 2020, 202, 371–382. [Google Scholar] [CrossRef] [PubMed]
- Wittke, A.; Weaver, V.; Mahon, B.D.; August, A.; Cantorna, M.T. Vitamin D receptor-deficient mice fail to develop experimental allergic asthma. J. Immunol. 2004, 173, 3432–3436. [Google Scholar] [CrossRef]
- Selvaraja, M.; Abdullah, M.; Arip, M.; Chin, V.K.; Shah, A.; Amin-Nordin, S. Elevated interleukin-25 and its association to Th2 cytokines in systemic lupus erythematosus with lupus nephritis. PLoS One 2019, 14, e0224707. [Google Scholar] [CrossRef]
- Miyake, K.; Akahoshi, M.; Nakashima, H. Th subset balance in lupus nephritis. J. Biomed. Biotechnol. 2011, 2011, 980286. [Google Scholar] [CrossRef] [PubMed]
- Wortsman, J.; Matsuoka, L.Y.; Chen, T.C.; Lu, Z.; Holick, M.F. Decreased bioavailability of vitamin D in obesity. Am. J. Clin. Nutr. 2000, 72, 690–693. [Google Scholar] [CrossRef] [PubMed]
- Ruiz-Ojeda, F.J.; Anguita-Ruiz, A.; Leis, R.; Aguilera, C.M. Genetic Factors and Molecular Mechanisms of Vitamin D and Obesity Relationship. Ann. Nutr. Metab. 2018, 73, 89–99. [Google Scholar] [CrossRef] [PubMed]
- Vranić, L.; Mikolašević, I.; Milić, S. Vitamin D Deficiency: Consequence or Cause of Obesity? Medicina (Kaunas) 2019, 55, 541. [Google Scholar] [CrossRef] [PubMed]
- Shoenfeld, Y.; Giacomelli, R.; Azrielant, S.; Berardicurti, O.; Reynolds, J.A.; Bruce, I.N. Vitamin D and systemic lupus erythematosus - The hype and the hope. Autoimmun. Rev. 2018, 17, 19–23. [Google Scholar] [CrossRef]
- Chang, S.W.; Lee, H.C. Vitamin D and health - The missing vitamin in humans. Pediatr. Neonatol. 2019, 60, 237–244. [Google Scholar] [CrossRef]
- Karnopp, T.E.; Freitas, E.C.; Rieger, A.; Chapacais, G.F.; Monticielo, O.A. Higher IgG level correlated with vitamin D receptor in the hippocampus of a pristane-induced lupus model. Clin. Rheumatol. 2022, 41, 1859–1866. [Google Scholar] [CrossRef]
- Häusler, D.; Torke, S.; Peelen, E.; Bertsch, T.; Djukic, M.; Nau, R. High dose vitamin D exacerbates central nervous system autoimmunity by raising T-cell excitatory calcium. Brain 2019, 142, 2737–2755. [Google Scholar] [CrossRef]
- Zhang, Y.; Niu, L.; Wang, F.; Tang, X.; Wang, C.; Zhu, Y. Vitamin D receptor expression in SLE peripheral blood CD4+T cells is associated with disease activity and cell apoptosis. Mod. Rheumatol. 2022, 32, 577–583. [Google Scholar] [CrossRef]


Publisher’s Note: MDPI stays neutral with regard to jurisdictional claims in published maps and institutional affiliations. |
© 2022 by the authors. Licensee MDPI, Basel, Switzerland. This article is an open access article distributed under the terms and conditions of the Creative Commons Attribution (CC BY) license (https://creativecommons.org/licenses/by/4.0/).