
The Interplay of Epigenetic, Genetic, and Traditional Risk Factors on Blood Pressure: Findings from the Health and Retirement Study

 , , , , ,
Abstract
1. Introduction
2. Materials and Methods
2.1. Study Sample
2.2. Blood Pressure
2.3. Covariates
2.4. DNA Methylation Data and Methylation Risk Scores
2.5. Genotype Data and Genetic Risk Scores
2.6. Statistical Analysis
3. Results
3.1. Characteristics of Study Participants
3.2. Associations between the 13 Previously Identified CpGs and Blood Pressure
3.3. Associations between the Methylation and Genetic Risk Scores and Blood Pressure
3.4. Interaction between Traditional Risk Factors and Methylation Risk Scores on Blood Pressure
3.5. Sensitivity Analysis Using HRS Sampling Weights
4. Discussion
Supplementary Materials
Author Contributions
Funding
Institutional Review Board Statement
Informed Consent Statement
Data Availability Statement
Acknowledgments
Conflicts of Interest
Abbreviations
References
- Murray, C.J.; Aravkin, A.Y.; Zheng, P.; Abbafati, C.; Abbas, K.M.; Abbasi-Kangevari, M.; Abd-Allah, F.; Abdelalim, A.; Abdollahi, M.; Abdollahpour, I. Global burden of 87 risk factors in 204 countries and territories, 1990–2019: A systematic analysis for the Global Burden of Disease Study 2019. Lancet 2020, 396, 1223–1249. [Google Scholar] [CrossRef]
- Fuchs, F.D.; Whelton, P.K. High Blood Pressure and Cardiovascular Disease. Hypertension 2020, 75, 285–292. [Google Scholar] [CrossRef] [PubMed]
- Ostchega, Y.; Fryar, C.D.; Nwankwo, T.; Nguyen, D.T. Hypertension Prevalence among adults aged 18 and over: United States, 2017–2018. NCHS Data Brief 2020, 1–8. Available online: https://stacks.cdc.gov/view/cdc/87559 (accessed on 15 April 2022).
- Virani, S.S.; Alonso, A.; Benjamin, E.J.; Bittencourt, M.S.; Callaway, C.W.; Carson, A.P.; Chamberlain, A.M.; Chang, A.R.; Cheng, S.; Delling, F.N.; et al. Heart Disease and Stroke Statistics-2020 Update: A Report from the American Heart Association. Circulation 2020, 141, e139–e596. [Google Scholar] [CrossRef]
- Whelton, P.K.; Carey, R.M.; Aronow, W.S.; Casey, D.E., Jr.; Collins, K.J.; Dennison Himmelfarb, C.; DePalma, S.M.; Gidding, S.; Jamerson, K.A.; Jones, D.W.; et al. 2017 ACC/AHA/AAPA/ABC/ACPM/AGS/APhA/ASH/ASPC/NMA/PCNA Guideline for the Prevention, Detection, Evaluation, and Management of High Blood Pressure in Adults: A Report of the American College of Cardiology/American Heart Association Task Force on Clinical Practice Guidelines. J. Am. Coll. Cardiol. 2018, 71, e127–e248. [Google Scholar] [CrossRef] [PubMed]
- Richard, M.A.; Huan, T.; Ligthart, S.; Gondalia, R.; Jhun, M.A.; Brody, J.A.; Irvin, M.R.; Marioni, R.; Shen, J.; Tsai, P.C.; et al. DNA Methylation Analysis Identifies Loci for Blood Pressure Regulation. Am. J. Hum. Genet. 2017, 101, 888–902. [Google Scholar] [CrossRef]
- Huang, Y.; Ollikainen, M.; Muniandy, M.; Zhang, T.; van Dongen, J.; Hao, G.; van der Most, P.J.; Pan, Y.; Pervjakova, N.; Sun, Y.V.; et al. Identification, Heritability, and Relation with Gene Expression of Novel DNA Methylation Loci for Blood Pressure. Hypertension 2020, 76, 195–205. [Google Scholar] [CrossRef]
- Sayols-Baixeras, S.; Subirana, I.; Fernandez-Sanles, A.; Senti, M.; Lluis-Ganella, C.; Marrugat, J.; Elosua, R. DNA methylation and obesity traits: An epigenome-wide association study. The REGICOR study. Epigenetics 2017, 12, 909–916. [Google Scholar] [CrossRef]
- Geurts, Y.M.; Dugue, P.A.; Joo, J.E.; Makalic, E.; Jung, C.H.; Guan, W.; Nguyen, S.; Grove, M.L.; Wong, E.M.; Hodge, A.M.; et al. Novel associations between blood DNA methylation and body mass index in middle-aged and older adults. Int. J. Obes. 2018, 42, 887–896. [Google Scholar] [CrossRef] [PubMed]
- Juvinao-Quintero, D.L.; Marioni, R.E.; Ochoa-Rosales, C.; Russ, T.C.; Deary, I.J.; van Meurs, J.B.J.; Voortman, T.; Hivert, M.F.; Sharp, G.C.; Relton, C.L.; et al. DNA methylation of blood cells is associated with prevalent type 2 diabetes in a meta-analysis of four European cohorts. Clin. Epigenetics 2021, 13, 40. [Google Scholar] [CrossRef]
- Meeks, K.A.C.; Henneman, P.; Venema, A.; Addo, J.; Bahendeka, S.; Burr, T.; Danquah, I.; Galbete, C.; Mannens, M.; Mockenhaupt, F.P.; et al. Epigenome-wide association study in whole blood on type 2 diabetes among sub-Saharan African individuals: Findings from the RODAM study. Int. J. Epidemiol. 2019, 48, 58–70. [Google Scholar] [CrossRef]
- Cardona, A.; Day, F.R.; Perry, J.R.B.; Loh, M.; Chu, A.Y.; Lehne, B.; Paul, D.S.; Lotta, L.A.; Stewart, I.D.; Kerrison, N.D.; et al. Epigenome-Wide Association Study of Incident Type 2 Diabetes in a British Population: EPIC-Norfolk Study. Diabetes 2019, 68, 2315–2326. [Google Scholar] [CrossRef] [PubMed]
- Dugue, P.A.; Jung, C.H.; Joo, J.E.; Wang, X.; Wong, E.M.; Makalic, E.; Schmidt, D.F.; Baglietto, L.; Severi, G.; Southey, M.C.; et al. Smoking and blood DNA methylation: An epigenome-wide association study and assessment of reversibility. Epigenetics 2020, 15, 358–368. [Google Scholar] [CrossRef] [PubMed]
- Joehanes, R.; Just, A.C.; Marioni, R.E.; Pilling, L.C.; Reynolds, L.M.; Mandaviya, P.R.; Guan, W.; Xu, T.; Elks, C.E.; Aslibekyan, S.; et al. Epigenetic Signatures of Cigarette Smoking. Circ. Cardiovasc. Genet. 2016, 9, 436–447. [Google Scholar] [CrossRef]
- Liu, J.; Zhao, W.; Ammous, F.; Turner, S.T.; Mosley, T.H.; Zhou, X.; Smith, J.A. Longitudinal analysis of epigenome-wide DNA methylation reveals novel smoking-related loci in African Americans. Epigenetics 2019, 14, 171–184. [Google Scholar] [CrossRef] [PubMed]
- Maas, S.C.E.; Mens, M.M.J.; Kuhnel, B.; van Meurs, J.B.J.; Uitterlinden, A.G.; Peters, A.; Prokisch, H.; Herder, C.; Grallert, H.; Kunze, S.; et al. Smoking-related changes in DNA methylation and gene expression are associated with cardio-metabolic traits. Clin. Epigenetics 2020, 12, 157. [Google Scholar] [CrossRef]
- Sailani, M.R.; Halling, J.F.; Moller, H.D.; Lee, H.; Plomgaard, P.; Pilegaard, H.; Snyder, M.P.; Regenberg, B. Lifelong physical activity is associated with promoter hypomethylation of genes involved in metabolism, myogenesis, contractile properties and oxidative stress resistance in aged human skeletal muscle. Sci. Rep. 2019, 9, 3272. [Google Scholar] [CrossRef]
- Czamara, D.; Neufang, A.; Dieterle, R.; Iurato, S.; Arloth, J.; Martins, J.; Ising, M.; Binder, E.E.; Erhardt, A. Effects of stressful life-events on DNA methylation in panic disorder and major depressive disorder. Clin. Epigenetics 2022, 14, 55. [Google Scholar] [CrossRef]
- Uddin, M.; Ratanatharathorn, A.; Armstrong, D.; Kuan, P.F.; Aiello, A.E.; Bromet, E.J.; Galea, S.; Koenen, K.C.; Luft, B.; Ressler, K.J.; et al. Epigenetic meta-analysis across three civilian cohorts identifies NRG1 and HGS as blood-based biomarkers for post-traumatic stress disorder. Epigenomics 2018, 10, 1585–1601. [Google Scholar] [CrossRef]
- Wang, Y.Z.; Zhao, W.; Ammous, F.; Song, Y.; Du, J.; Shang, L.; Ratliff, S.M.; Moore, K.; Kelly, K.M.; Needham, B.L.; et al. DNA Methylation Mediates the Association Between Individual and Neighborhood Social Disadvantage and Cardiovascular Risk Factors. Front. Cardiovasc. Med. 2022, 9, 848768. [Google Scholar] [CrossRef]
- Needham, B.L.; Smith, J.A.; Zhao, W.; Wang, X.; Mukherjee, B.; Kardia, S.L.; Shively, C.A.; Seeman, T.E.; Liu, Y.; Diez Roux, A.V. Life course socioeconomic status and DNA methylation in genes related to stress reactivity and inflammation: The multi-ethnic study of atherosclerosis. Epigenetics 2015, 10, 958–969. [Google Scholar] [CrossRef]
- Bush, N.R.; Edgar, R.D.; Park, M.; MacIsaac, J.L.; McEwen, L.M.; Adler, N.E.; Essex, M.J.; Kobor, M.S.; Boyce, W.T. The biological embedding of early-life socioeconomic status and family adversity in children’s genome-wide DNA methylation. Epigenomics 2018, 10, 1445–1461. [Google Scholar] [CrossRef] [PubMed]
- Karlsson Linner, R.; Marioni, R.E.; Rietveld, C.A.; Simpkin, A.J.; Davies, N.M.; Watanabe, K.; Armstrong, N.J.; Auro, K.; Baumbach, C.; Bonder, M.J.; et al. An epigenome-wide association study meta-analysis of educational attainment. Mol. Psychiatry 2017, 22, 1680–1690. [Google Scholar] [CrossRef] [PubMed]
- van Dongen, J.; Bonder, M.J.; Dekkers, K.F.; Nivard, M.G.; van Iterson, M.; Willemsen, G.; Beekman, M.; van der Spek, A.; van Meurs, J.B.J.; Franke, L.; et al. DNA methylation signatures of educational attainment. NPJ Sci. Learn. 2018, 3, 7. [Google Scholar] [CrossRef]
- Smith, J.A.; Zhao, W.; Wang, X.; Ratliff, S.M.; Mukherjee, B.; Kardia, S.L.R.; Liu, Y.; Roux, A.V.D.; Needham, B.L. Neighborhood characteristics influence DNA methylation of genes involved in stress response and inflammation: The Multi-Ethnic Study of Atherosclerosis. Epigenetics 2017, 12, 662–673. [Google Scholar] [CrossRef]
- Reuben, A.; Sugden, K.; Arseneault, L.; Corcoran, D.L.; Danese, A.; Fisher, H.L.; Moffitt, T.E.; Newbury, J.B.; Odgers, C.; Prinz, J.; et al. Association of Neighborhood Disadvantage in Childhood with DNA Methylation in Young Adulthood. JAMA Netw. Open 2020, 3, e206095. [Google Scholar] [CrossRef]
- Barcelona de Mendoza, V.; Huang, Y.; Crusto, C.A.; Sun, Y.V.; Taylor, J.Y. Perceived Racial Discrimination and DNA Methylation Among African American Women in the InterGEN Study. Biol. Res. Nurs. 2018, 20, 145–152. [Google Scholar] [CrossRef]
- van der Laan, L.C.; Meeks, K.A.C.; Chilunga, F.P.; Agyemang, C.; Venema, A.; Mannens, M.M.A.M.; Zafarmand, M.H.; Klipstein-Grobusch, K.; Smeeth, L.; Adeyemo, A.; et al. Epigenome-wide association study for perceived discrimination among sub-Saharan African migrants in Europe-the RODAM study. Sci. Rep. 2020, 10, 4919. [Google Scholar] [CrossRef]
- Sonnega, A.; Faul, J.D.; Ofstedal, M.B.; Langa, K.M.; Phillips, J.W.; Weir, D.R. Cohort Profile: The Health and Retirement Study (HRS). Int. J. Epidemiol. 2014, 43, 576–585. [Google Scholar] [CrossRef]
- Health and Retirement Study. Quality Control Report for Genotypic Data; University of Michigan: Ann Arbor, MI, USA, 2021; Available online: https://hrs.isr.umich.edu/sites/default/files/genetic/HRS-QC-Report-Phase-4_Nov2021_FINAL.pdf (accessed on 15 March 2022).
- Crimmins, E.; Guyer, H.; Langa, K.; Ofstedal, M.B.; Wallace, R.; Weir, D. Documentation of physical measures, anthropometrics and blood pressure in the Health and Retirement Study. HRS Doc. Rep. DR-011 2008, 14, 47–59. [Google Scholar]
- Bugliari, D.; Campbell, N.; Chan, C.; Hayden, O.; Hurd, M.; Main, R.; Mallett, J.; McCullough, C.; Meijer, E.; Moldoff, M. RAND HRS data documentation, version P. RAND Cent. Study Aging 2016. Available online: https://hrsonline.isr.umich.edu/modules/meta/rand/randhrsp/randhrs_P.pdf (accessed on 15 March 2022).
- Crimmins, E.; Kim, K.K.; Fisher, J.; Faul, J. HRS Epigenetic Clocks; Survey Research Center, University of Michigan: Ann Arbor, MI, USA, 2020; Available online: https://hrsdata.isr.umich.edu/sites/default/files/documentation/data-descriptions/EPICLOCKS_DD.pdf (accessed on 15 March 2022).
- Houseman, E.A.; Accomando, W.P.; Koestler, D.C.; Christensen, B.C.; Marsit, C.J.; Nelson, H.H.; Wiencke, J.K.; Kelsey, K.T. DNA methylation arrays as surrogate measures of cell mixture distribution. BMC Bioinform. 2012, 13, 86. [Google Scholar] [CrossRef] [PubMed]
- Salas, L.A.; Koestler, D.C.; Butler, R.A.; Hansen, H.M.; Wiencke, J.K.; Kelsey, K.T.; Christensen, B.C. An optimized library for reference-based deconvolution of whole-blood biospecimens assayed using the Illumina HumanMethylationEPIC BeadArray. Genome Biol. 2018, 19, 64. [Google Scholar] [CrossRef] [PubMed]
- Liang, J.; Le, T.H.; Edwards, D.R.V.; Tayo, B.O.; Gaulton, K.J.; Smith, J.A.; Lu, Y.; Jensen, R.A.; Chen, G.; Yanek, L.R.; et al. Single-trait and multi-trait genome-wide association analyses identify novel loci for blood pressure in African-ancestry populations. PLoS Genet. 2017, 13, e1006728. [Google Scholar] [CrossRef]
- Evangelou, E.; Warren, H.R.; Mosen-Ansorena, D.; Mifsud, B.; Pazoki, R.; Gao, H.; Ntritsos, G.; Dimou, N.; Cabrera, C.P.; Karaman, I.; et al. Genetic analysis of over 1 million people identifies 535 new loci associated with blood pressure traits. Nat. Genet. 2018, 50, 1412–1425. [Google Scholar] [CrossRef]
- Ware, E.; Schmitz, L.; Gard, A.; Faul, J. HRS Polygenic Scores—Release 3: 2006–2012 Genetic Data; Survey Research Center, University of Michigan: Ann Arbor, MI, USA, 2018; Available online: https://hrsdata.isr.umich.edu/sites/default/files/documentation/data-descriptions/PGNSCORES4_3DD_0.pdf (accessed on 15 March 2022).
- Lumley, T. Analysis of Complex Survey Samples. J. Stat. Soft. 2004, 9, 1–19. [Google Scholar] [CrossRef]
- Kho, M.; Zhao, W.; Ratliff, S.M.; Ammous, F.; Mosley, T.H.; Shang, L.; Kardia, S.L.R.; Zhou, X.; Smith, J.A. Epigenetic loci for blood pressure are associated with hypertensive target organ damage in older African Americans from the genetic epidemiology network of Arteriopathy (GENOA) study. BMC Med. Genom. 2020, 13, 131. [Google Scholar] [CrossRef]
- Braun, K.V.E.; Dhana, K.; de Vries, P.S.; Voortman, T.; van Meurs, J.B.J.; Uitterlinden, A.G.; Consortium, B.; Hofman, A.; Hu, F.B.; Franco, O.H.; et al. Epigenome-wide association study (EWAS) on lipids: The Rotterdam Study. Clin. Epigenet. 2017, 9, 15. [Google Scholar] [CrossRef]
- Sayols-Baixeras, S.; Subirana, I.; Lluis-Ganella, C.; Civeira, F.; Roquer, J.; Do, A.N.; Absher, D.; Cenarro, A.; Munoz, D.; Soriano-Tarraga, C.; et al. Identification and validation of seven new loci showing differential DNA methylation related to serum lipid profile: An epigenome-wide approach. The REGICOR study. Hum. Mol. Genet. 2016, 25, 4556–4565. [Google Scholar] [CrossRef]
- Wahl, S.; Drong, A.; Lehne, B.; Loh, M.; Scott, W.R.; Kunze, S.; Tsai, P.C.; Ried, J.S.; Zhang, W.; Yang, Y.; et al. Epigenome-wide association study of body mass index, and the adverse outcomes of adiposity. Nature 2017, 541, 81–86. [Google Scholar] [CrossRef]
- Mendelson, M.M.; Marioni, R.E.; Joehanes, R.; Liu, C.; Hedman, A.K.; Aslibekyan, S.; Demerath, E.W.; Guan, W.; Zhi, D.; Yao, C.; et al. Association of Body Mass Index with DNA Methylation and Gene Expression in Blood Cells and Relations to Cardiometabolic Disease: A Mendelian Randomization Approach. PLoS Med. 2017, 14, e1002215. [Google Scholar] [CrossRef]
- Dugue, P.A.; Wilson, R.; Lehne, B.; Jayasekara, H.; Wang, X.; Jung, C.H.; Joo, J.E.; Makalic, E.; Schmidt, D.F.; Baglietto, L.; et al. Alcohol consumption is associated with widespread changes in blood DNA methylation: Analysis of cross-sectional and longitudinal data. Addict. Biol. 2021, 26, e12855. [Google Scholar] [CrossRef] [PubMed]
- Jyotsana, N.; Ta, K.T.; DelGiorno, K.E. The Role of Cystine/Glutamate Antiporter SLC7A11/xCT in the Pathophysiology of Cancer. Front. Oncol. 2022, 12, 858462. [Google Scholar] [CrossRef]
- Lohoff, F.W.; Clarke, T.K.; Kaminsky, Z.A.; Walker, R.M.; Bermingham, M.L.; Jung, J.; Morris, S.W.; Rosoff, D.; Campbell, A.; Barbu, M.; et al. Epigenome-wide association study of alcohol consumption in N = 8161 individuals and relevance to alcohol use disorder pathophysiology: Identification of the cystine/glutamate transporter SLC7A11 as a top target. Mol. Psychiatry 2022, 27, 1754–1764. [Google Scholar] [CrossRef] [PubMed]
- Das, M.; Sha, J.; Hidalgo, B.; Aslibekyan, S.; Do, A.N.; Zhi, D.; Sun, D.; Zhang, T.; Li, S.; Chen, W.; et al. Association of DNA Methylation at CPT1A Locus with Metabolic Syndrome in the Genetics of Lipid Lowering Drugs and Diet Network (GOLDN) Study. PLoS ONE 2016, 11, e0145789. [Google Scholar] [CrossRef]
- Irvin, M.R.; Zhi, D.; Joehanes, R.; Mendelson, M.; Aslibekyan, S.; Claas, S.A.; Thibeault, K.S.; Patel, N.; Day, K.; Jones, L.W.; et al. Epigenome-wide association study of fasting blood lipids in the Genetics of Lipid-lowering Drugs and Diet Network study. Circulation 2014, 130, 565–572. [Google Scholar] [CrossRef]
- Frazier-Wood, A.C.; Aslibekyan, S.; Absher, D.M.; Hopkins, P.N.; Sha, J.; Tsai, M.Y.; Tiwari, H.K.; Waite, L.L.; Zhi, D.; Arnett, D.K. Methylation at CPT1A locus is associated with lipoprotein subfraction profiles. J. Lipid Res. 2014, 55, 1324–1330. [Google Scholar] [CrossRef]
- Aslibekyan, S.; Demerath, E.W.; Mendelson, M.; Zhi, D.; Guan, W.; Liang, L.; Sha, J.; Pankow, J.S.; Liu, C.; Irvin, M.R.; et al. Epigenome-wide study identifies novel methylation loci associated with body mass index and waist circumference. Obesity 2015, 23, 1493–1501. [Google Scholar] [CrossRef]
- Roberts, M.L.; Kotchen, T.A.; Pan, X.; Li, Y.; Yang, C.; Liu, P.; Wang, T.; Laud, P.W.; Chelius, T.H.; Munyura, Y.; et al. Unique Associations of DNA Methylation Regions With 24-Hour Blood Pressure Phenotypes in Black Participants. Hypertension 2022, 79, 761–772. [Google Scholar] [CrossRef]
- Ammous, F.; Zhao, W.; Lin, L.; Ratliff, S.M.; Mosley, T.H.; Bielak, L.F.; Zhou, X.; Peyser, P.A.; Kardia, S.L.R.; Smith, J.A. Epigenetics of single-site and multi-site atherosclerosis in African Americans from the Genetic Epidemiology Network of Arteriopathy (GENOA). Clin. Epigenet. 2022, 14, 10. [Google Scholar] [CrossRef]
- McCartney, D.L.; Hillary, R.F.; Stevenson, A.J.; Ritchie, S.J.; Walker, R.M.; Zhang, Q.; Morris, S.W.; Bermingham, M.L.; Campbell, A.; Murray, A.D.; et al. Epigenetic prediction of complex traits and death. Genome Biol. 2018, 19, 136. [Google Scholar] [CrossRef]
- Kamiza, A.B.; Toure, S.M.; Vujkovic, M.; Machipisa, T.; Soremekun, O.S.; Kintu, C.; Corpas, M.; Pirie, F.; Young, E.; Gill, D.; et al. Transferability of genetic risk scores in African populations. Nat. Med. 2022, 28, 1163–1166. [Google Scholar] [CrossRef]
- Hannum, G.; Guinney, J.; Zhao, L.; Zhang, L.; Hughes, G.; Sadda, S.; Klotzle, B.; Bibikova, M.; Fan, J.B.; Gao, Y.; et al. Genome-wide methylation profiles reveal quantitative views of human aging rates. Mol. Cell 2013, 49, 359–367. [Google Scholar] [CrossRef]
- Horvath, S. DNA methylation age of human tissues and cell types. Genome Biol. 2013, 14, R115. [Google Scholar] [CrossRef]
- Lu, A.T.; Quach, A.; Wilson, J.G.; Reiner, A.P.; Aviv, A.; Raj, K.; Hou, L.; Baccarelli, A.A.; Li, Y.; Stewart, J.D.; et al. DNA methylation GrimAge strongly predicts lifespan and healthspan. Aging 2019, 11, 303–327. [Google Scholar] [CrossRef]
- Fernandez-Sanles, A.; Sayols-Baixeras, S.; Subirana, I.; Degano, I.R.; Elosua, R. Association between DNA methylation and coronary heart disease or other atherosclerotic events: A systematic review. Atherosclerosis 2017, 263, 325–333. [Google Scholar] [CrossRef]
- Dogan, M.V.; Grumbach, I.M.; Michaelson, J.J.; Philibert, R.A. Integrated genetic and epigenetic prediction of coronary heart disease in the Framingham Heart Study. PLoS ONE 2018, 13, e0190549. [Google Scholar] [CrossRef]
- Westerman, K.; Fernandez-Sanles, A.; Patil, P.; Sebastiani, P.; Jacques, P.; Starr, J.M.; Ian, J.D.; Liu, Q.; Liu, S.; Elosua, R.; et al. Epigenomic Assessment of Cardiovascular Disease Risk and Interactions with Traditional Risk Metrics. J. Am. Heart. Assoc. 2020, 9, e015299. [Google Scholar] [CrossRef]
- Chambers, J.C.; Loh, M.; Lehne, B.; Drong, A.; Kriebel, J.; Motta, V.; Wahl, S.; Elliott, H.R.; Rota, F.; Scott, W.R.; et al. Epigenome-wide association of DNA methylation markers in peripheral blood from Indian Asians and Europeans with incident type 2 diabetes: A nested case-control study. Lancet Diabetes Endocrinol. 2015, 3, 526–534. [Google Scholar] [CrossRef]
- Sorel, J.E.; Ragland, D.R.; Syme, S.L.; Davis, W.B. Educational status and blood pressure: The Second National Health and Nutrition Examination Survey, 1976-1980, and the Hispanic Health and Nutrition Examination Survey, 1982-1984. Am. J. Epidemiol. 1992, 135, 1339–1348. [Google Scholar] [CrossRef]
- Stamler, R.; Shipley, M.; Elliott, P.; Dyer, A.; Sans, S.; Stamler, J. Higher blood pressure in adults with less education. Some explanations from INTERSALT. Hypertension 1992, 19, 237–241. [Google Scholar] [CrossRef]
- Liu, S.Y.; Buka, S.L.; Linkletter, C.D.; Kawachi, I.; Kubzansky, L.; Loucks, E.B. The association between blood pressure and years of schooling versus educational credentials: Test of the sheepskin effect. Ann. Epidemiol. 2011, 21, 128–138. [Google Scholar] [CrossRef]


| Full Sample a n = 3070 Mean (SD) or N (%) | African Ancestry n = 437 Mean (SD) or N (%) | European Ancestry n = 2021 Mean (SD) or N (%) | p b | |
|---|---|---|---|---|
| Age at blood pressure measurement (years) | 70.5 (9.5) | 67.3 (8.6) | 72.3 (9.5) | <2.2 × 10⁻¹⁶ |
| Male sex | 1274 (41.5) | 149 (34.1) | 877 (43.4) | 4.3 × 10⁻⁴ |
| Educational attainment | <2.2 × 10⁻¹⁶ | |||
| Less than high school | 475 (15.5) | 90 (20.6) | 159 (7.9) | |
| High school degree or equivalent | 1013 (33.0) | 160 (36.6) | 699 (34.6) | |
| At least some college | 1582 (51.5) | 187 (42.8) | 1163 (57.5) | |
| Highest parental education < 12 years | 1130 (36.8) | 210 (48.1) | 568 (28.1) | <2.2 × 10⁻¹⁶ |
| Missing | 190 (6.2) | 49 (11.2) | 81 (4.0) | |
| BMI (kg/m2) | 29.9 (6.2) | 31.1 (6.6) | 29.5 (6.1) | <2.2 × 10⁻¹⁶ |
| Systolic blood pressure (mmHg) | 136.6 (21.1) | 142.9 (21.3) | 135.3 (20.6) | 2.0 × 10⁻¹¹ |
| Diastolic blood pressure (mmHg) | 82.1 (11.9) | 86.8 (12.3) | 81.1 (11.6) | <2.20 × 10⁻¹⁶ |
| Anti-hypertensive medication use | 1770 (57.7) | 323 (73.9) | 1111 (55.0) | 4.9 × 10⁻¹³ |
| Has Type 2 diabetes | 865 (28.2) | 159 (36.4) | 477 (23.6) | 6.0 × 10⁻⁸ |
| Missing | 9 (0.3) | 0 | 9 (0.5) | |
| Alcohol consumption | 2.0 × 10⁻³ | |||
| Nondrinker | 1869 (60.9) | 288 (65.9) | 1161 (57.4) | |
| Occasional drinker | 995 (32.4) | 124 (28.4) | 699 (34.6) | |
| Heavy drinker | 196 (6.4) | 21 (4.8) | 156 (7.7) | |
| Missing | 10 (0.3) | 4 (0.9) | 5 (0.2) | |
| Smoking status | 2.1 × 10⁻⁷ | |||
| Never smoker | 1376 (44.8) | 186 (42.6) | 895 (44.3) | |
| Former smoker | 1365 (44.5) | 173 (39.6) | 943 (46.7) | |
| Current smoker | 328 (10.7) | 78 (17.8) | 182 (9.0) | |
| Missing | 1 (0.03) | 0 | 1 (0.05) | |
| Reported weekly physical exercise | 1712 (55.8) | 210 (48.1) | 1184 (58.6) | 2.9 × 10⁻⁴ |
| Missing | 16 (0.5) | 2 (0.5) | 9 (0.5) |
| Systolic Blood Pressure | Diastolic Blood Pressure | ||||||||||||
|---|---|---|---|---|---|---|---|---|---|---|---|---|---|
| Model 1 (n = 3070) | Model 2 (n = 2694) | Model 1 (n = 3070) | Model 2 (n = 2694) | ||||||||||
| CpG Site | UCSC Gene and Location b | β | SE | p | β | SE | p | β | SE | p | β | SE | p |
| cg23999170 | TSPAN2 (Body) | −0.04 | 0.06 | 0.49 | −0.04 | 0.07 | 0.51 | −0.04 | 0.04 | 0.25 | −0.05 | 0.04 | 0.15 |
| cg16246545 | PHGDH (Body) | −0.18 | 0.06 | 5.0 × 10⁻³ | −0.14 | 0.07 | 0.04 | −0.10 | 0.04 | 0.01 | −0.07 | 0.04 | 0.08 |
| cg14476101 | PHGDH (Body) | −0.15 | 0.05 | 3.3 × 10⁻³ a | −0.10 | 0.05 | 0.06 | −0.10 | 0.03 | 7.3 × 10⁻⁴ a | −0.06 | 0.03 | 0.05 |
| cg19693031 | TXNIP (3′UTR) | −0.24 | 0.06 | 4.6 × 10⁻⁵ a | −0.14 | 0.06 | 0.03 | −0.08 | 0.03 | 0.02 | −0.03 | 0.04 | 0.42 |
| cg08035323 | – | −0.05 | 0.05 | 0.33 | −0.08 | 0.06 | 0.15 | −0.03 | 0.03 | 0.25 | −0.04 | 0.03 | 0.19 |
| cg06690548 | SLC7A11 (Body) | −0.27 | 0.07 | 5.6 × 10⁻⁵ a | −0.18 | 0.07 | 0.01 | −0.17 | 0.04 | 6.4 × 10⁻⁶ a | −0.11 | 0.04 | 0.01 |
| cg18120259 | LOC100132354 (Body) | −0.26 | 0.09 | 0.01 | −0.12 | 0.1 | 0.22 | −0.18 | 0.05 | 4.6 × 10⁻⁴ a | −0.12 | 0.05 | 0.03 |
| cg00533891 | ZMIZ1 (5′UTR) | −0.16 | 0.06 | 0.01 | −0.18 | 0.07 | 0.01 | −0.13 | 0.04 | 4.3 × 10⁻⁴ a | −0.13 | 0.04 | 4.7 × 10⁻⁴ a |
| cg17061862 | – | −0.15 | 0.06 | 0.01 | −0.11 | 0.06 | 0.05 | −0.10 | 0.03 | 1.6 × 10⁻³ a | −0.07 | 0.03 | 0.03 |
| cg00574958 | CPT1A (5′UTR) | −0.86 | 0.22 | 7.3 × 10⁻⁵ a | −0.40 | 0.23 | 0.09 | −0.51 | 0.12 | 3.9 × 10⁻⁵ a | −0.17 | 0.13 | 0.21 |
| cg10601624 | – | −0.10 | 0.09 | 0.28 | −0.12 | 0.10 | 0.23 | −0.08 | 0.05 | 0.15 | −0.07 | 0.06 | 0.19 |
| cg22304262 | SLC1A5 (5′UTR; Body) | −0.24 | 0.07 | 1.2 × 10⁻³ | −0.10 | 0.08 | 0.20 | −0.16 | 0.04 | 8.3 × 10⁻⁵ a | −0.11 | 0.04 | 0.01 |
| cg02711608 | SLC1A5 (1st Exon; 5′UTR; Body) | −0.53 | 0.11 | 2.5 × 10⁻⁶ a | −0.32 | 0.12 | 0.01 | −0.34 | 0.06 | 1.2 × 10⁻⁷ a | −0.23 | 0.07 | 6.9 × 10⁻⁴ a |
| Systolic Blood Pressure | Diastolic Blood Pressure | |||||||||||||||
|---|---|---|---|---|---|---|---|---|---|---|---|---|---|---|---|---|
| Model 1 | Model 2 | Model 1 | Model 2 | |||||||||||||
| β | SE | p | n | β | SE | p | n | β | SE | p | N | β | SE | p | n | |
| Full sample | 2.22 | 0.38 | 6.6 × 10⁻⁹ | 3067 | 1.71 | 0.40 | 2.68 × 10⁻⁵ | 2691 | 1.48 | 0.22 | 9.3 × 10⁻¹² | 3067 | 1.12 | 0.23 | 1.8 × 10⁻⁶ | 2691 |
| African ancestry | 2.44 | 1.05 | 0.02 | 437 | 1.64 | 1.14 | 0.15 | 355 | 1.93 | 0.59 | 1.0 × 10⁻³ | 437 | 1.42 | 0.66 | 0.03 | 355 |
| European ancestry | 2.11 | 0.45 | 3.8 × 10⁻⁶ | 2019 | 1.64 | 0.48 | 1.0 × 10⁻³ | 1811 | 1.48 | 0.26 | 1.4 × 10⁻⁸ | 2018 | 1.11 | 0.28 | 7.2 × 10⁻⁵ | 1810 |
| Systolic Blood Pressure | Diastolic Blood Pressure | |||||
|---|---|---|---|---|---|---|
| Sample/Predictor | β | SE | p | β | SE | p |
| African ancestry (n = 355) | ||||||
| MRS | 1.59 | 1.14 | 0.17 | 1.41 | 0.66 | 0.03 |
| GRS | −3.42 | 2.63 | 0.20 | −0.80 | 1.31 | 0.54 |
| European ancestry (n = 1811 for SBP and 1810 for DBP) | ||||||
| MRS | 1.49 | 0.47 | 2.0 × 10⁻³ | 1.01 | 0.27 | 2.4 × 10⁻⁴ |
| GRS | 4.83 | 0.60 | 8.8 × 10⁻¹⁶ | 2.80 | 0.34 | 5.3 × 10⁻¹⁶ |
| Model | Systolic Blood Pressure | Diastolic Blood Pressure |
|---|---|---|
| African ancestry | ||
| Covariates only (age, sex, 10 PCs, smoking status, alcohol consumption, BMI, exercise, type 2 diabetes, educational attainment, parental education) | 2.9% | 9.3% |
| Covariates + MRS | 3.2% | 8.9% |
| Covariates + GRS | 3.1% | 9.2% |
| Covariates + MRS + GRS | 3.4% | 10.1% |
| European ancestry | ||
| Covariates (age, sex, 10 PCs, smoking status, alcohol consumption, BMI, exercise, type 2 diabetes, educational attainment, parental education) | 8.5% | 5.5% |
| Covariates + MRS | 10.3% | 6.2% |
| Covariates + GRS | 11.7% | 8.9% |
| Covariates + MRS + GRS | 12.1% | 9.5% |
| Systolic Blood Pressure | Diastolic Blood Pressure | ||||||||||||||
|---|---|---|---|---|---|---|---|---|---|---|---|---|---|---|---|
| Multiplicative Interaction Term Evaluated | Sample | n | βMRS | PMRS | βRF | pRF | βinteraction | pinteraction | n | βMRS | pMRS | βRF | pRF | βInteraction | pinteraction |
| MRS × GRS | AA | 355 | 2.06 | 0.08 | −3.77 | 0.15 | −2.18 | 0.06 | 355 | 1.67 | 0.01 | −1.06 | 0.42 | −1.19 | 0.09 |
| EA | 1811 | 1.49 | 2.0 × 10⁻³ | 4.83 | 9.0 × 10⁻¹⁶ | −0.03 | 0.94 | 1810 | 1.04 | 1.7 × 10⁻⁴ | 2.80 | 4.4 × 10⁻¹⁶ | −0.50 | 0.07 | |
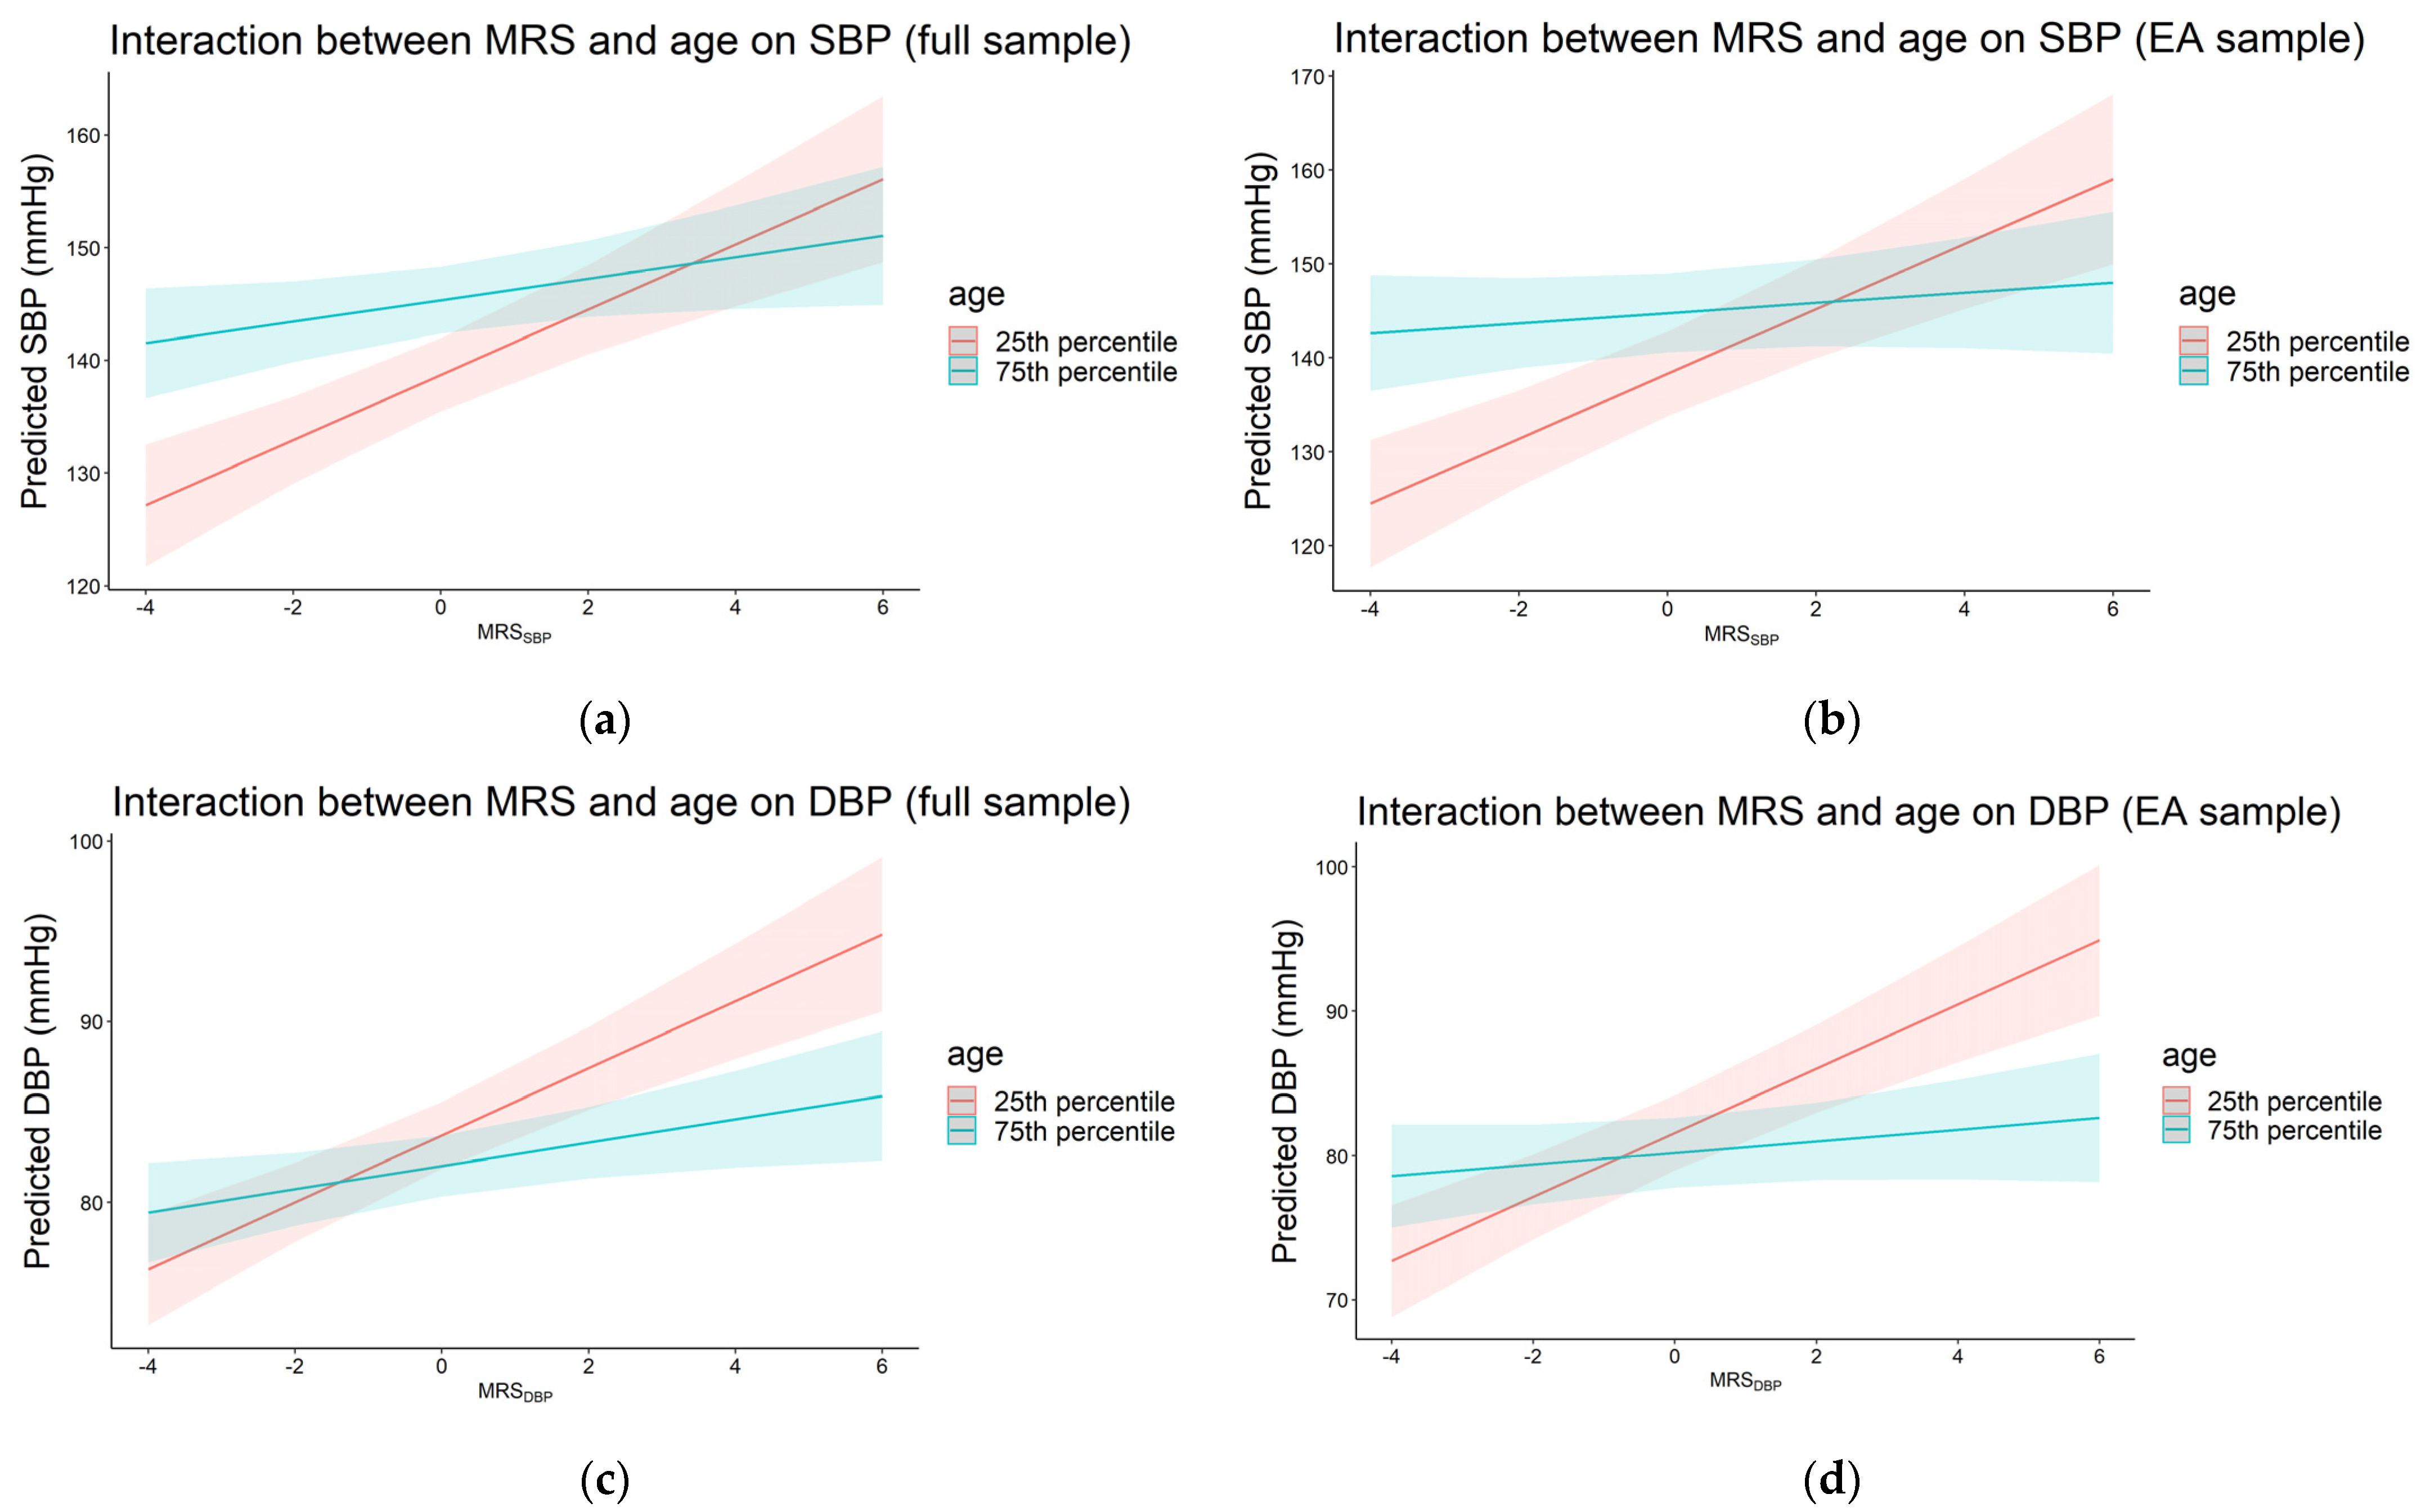
| MRS × age a | Full sample | 2691 | 1.83 | 6.9 × 10⁻⁶ | 4.07 | 1.1 × 10⁻¹⁹ | −1.19 | 2.0 × 10⁻³ | 2691 | 1.19 | 3.6 × 10⁻⁷ | −1.04 | 4.2 × 10⁻⁵ | −0.74 | 1.0 × 10⁻³ |
| AA | 355 | 1.52 | 0.20 | 1.06 | 0.46 | −0.46 | 0.70 | 355 | 1.29 | 0.06 | −2.30 | 6.0 × 10⁻³ | −0.48 | 0.50 | |
| EA | 1811 | 2.19 | 1.1 × 10⁻⁵ | 4.11 | 9.5 × 10⁻¹⁵ | −1.85 | 7.0 × 10⁻⁵ | 1810 | 1.43 | 7.1 × 10⁻⁷ | −0.88 | 4.0 × 10⁻³ | −1.16 | 1.9 × 10⁻⁵ | |
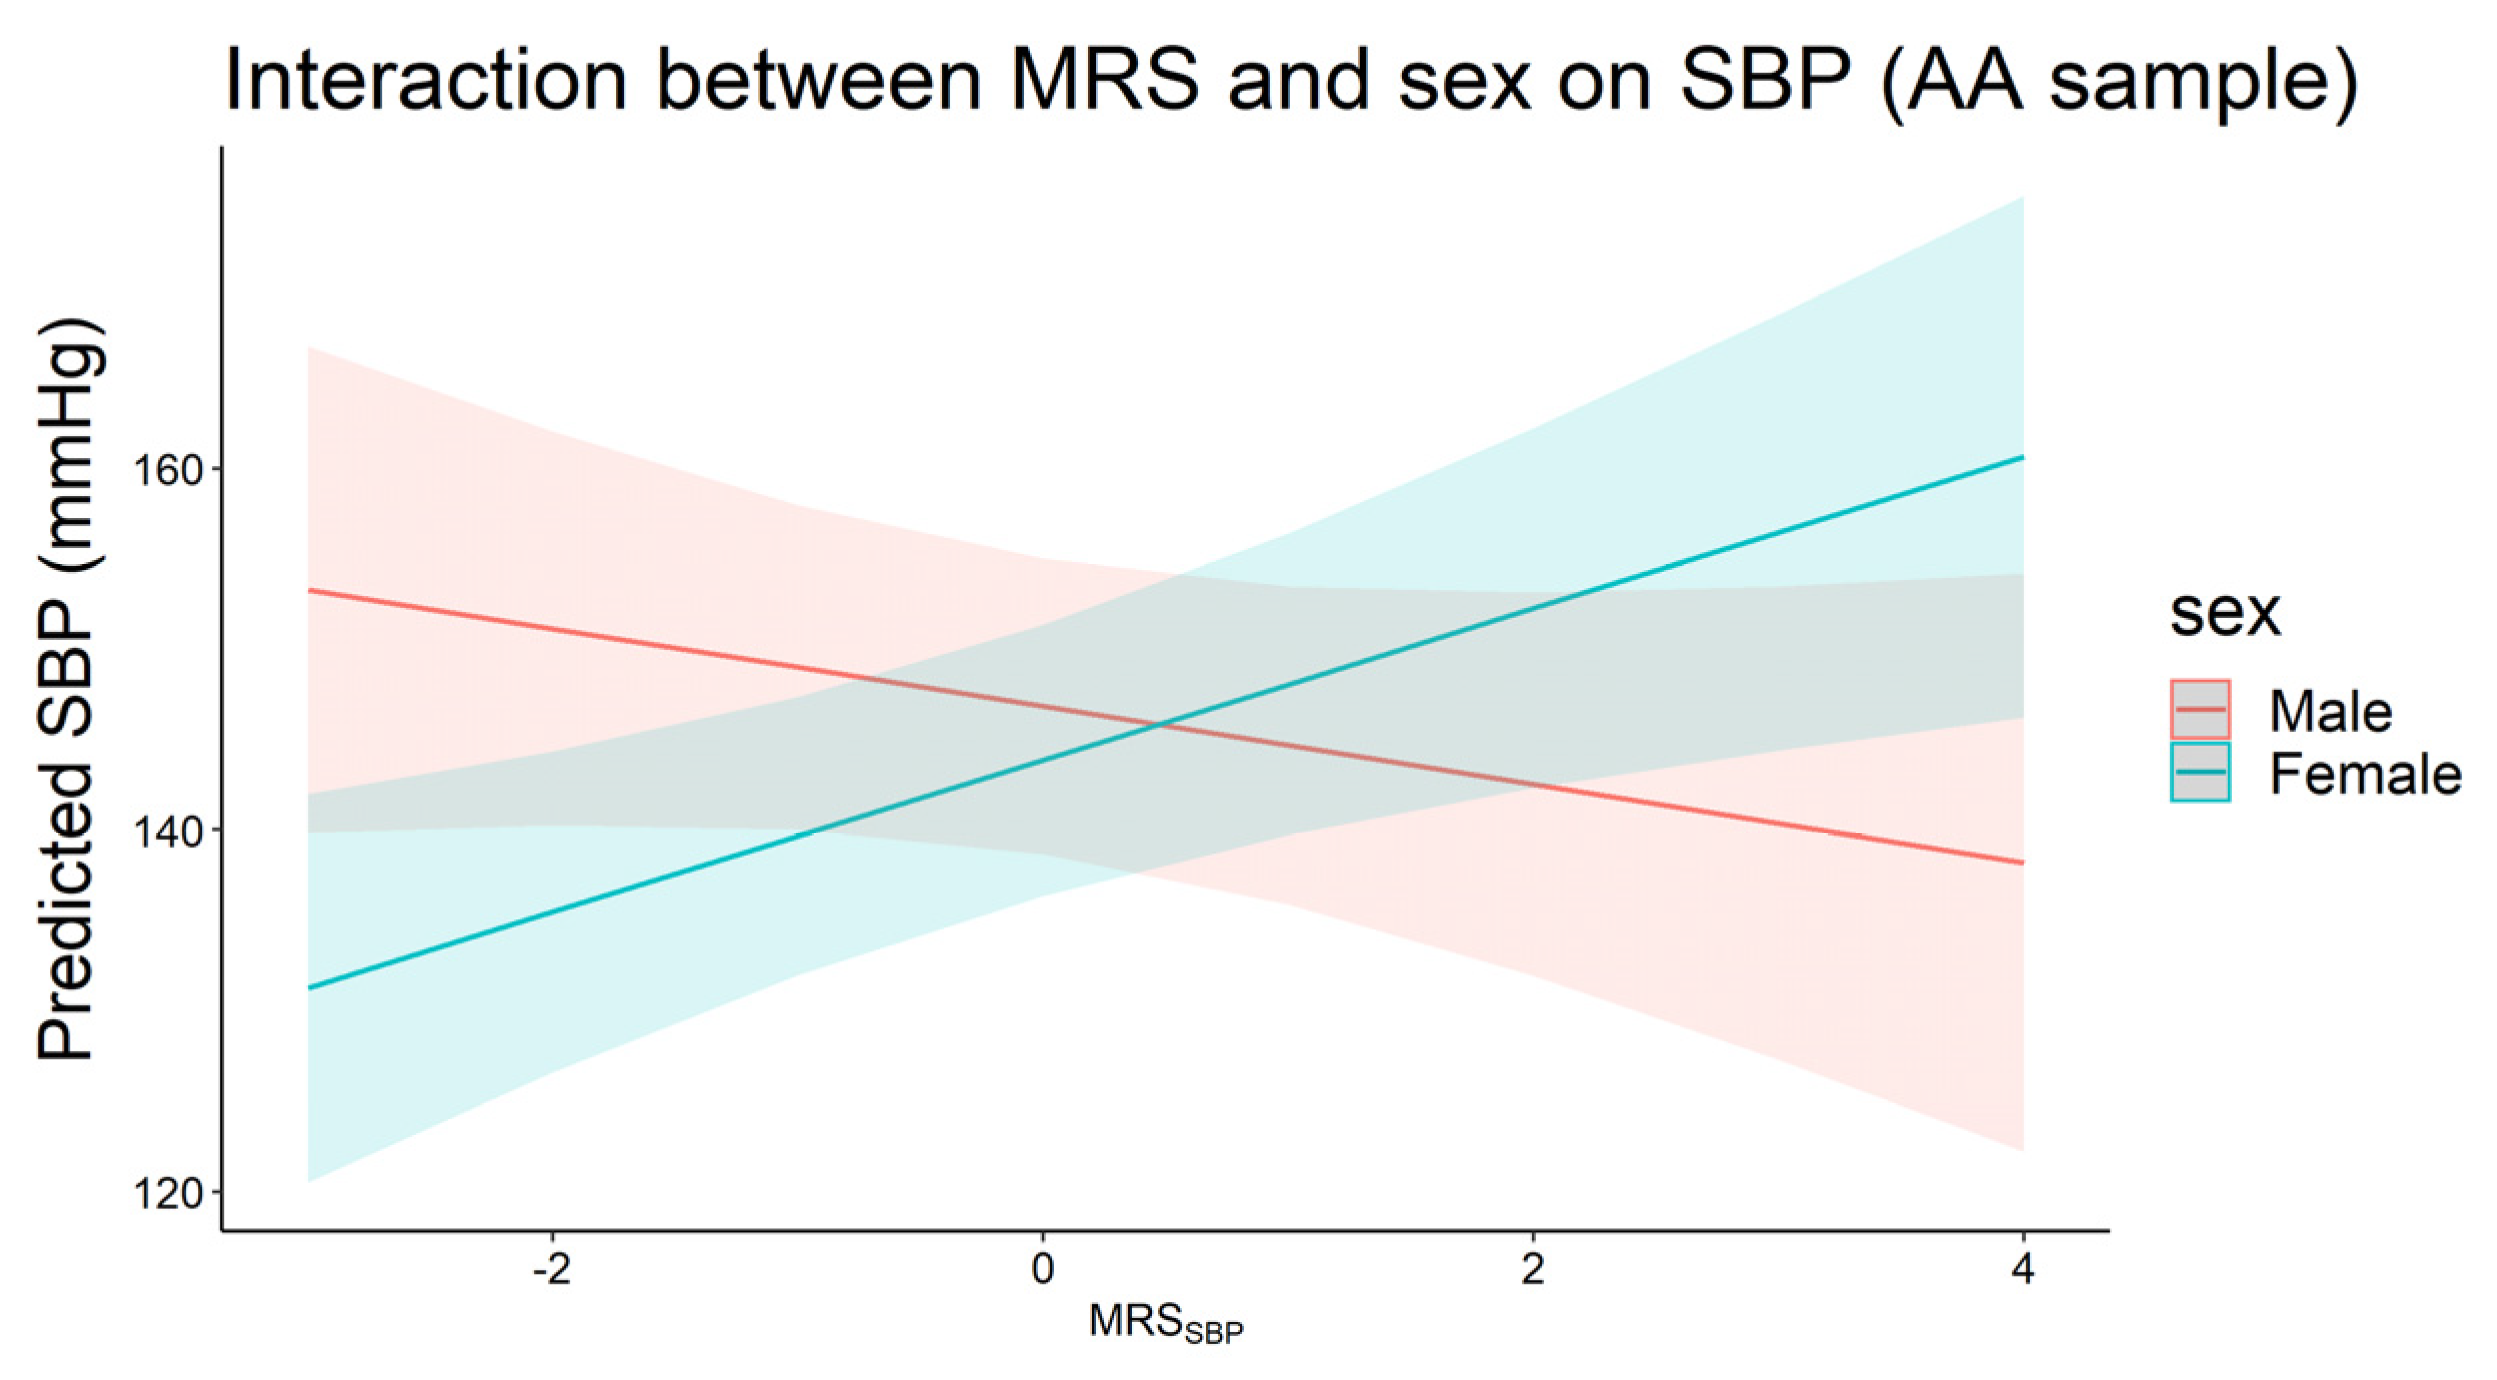
| MRS × sex b | Full sample | 2691 | 1.33 | 0.03 | −3.23 | 7.4 × 10⁻⁵ | 0.68 | 0.39 | 2691 | 0.78 | 0.02 | −0.13 | 0.78 | 0.61 | 0.18 |
| AA | 355 | −2.16 | 0.23 | −2.96 | 0.23 | 6.36 | 6.0 × 10⁻³ | 355 | −0.01 | 0.99 | −1.11 | 0.42 | 2.40 | 0.07 | |
| EA | 1811 | 1.61 | 0.02 | −2.44 | 0.01 | 0.06 | 0.95 | 1810 | 0.77 | 0.05 | 0.94 | 0.09 | 0.65 | 0.23 | |
| MRS × high school degree or equivalent c | Full sample | 2691 | 0.57 | 0.61 | −3.36 | 0.01 | 1.29 | 0.28 | 2691 | 0.81 | 0.21 | −0.65 | 0.37 | 0.34 | 0.62 |
| AA | 355 | −0.53 | 0.85 | −0.48 | 0.88 | 2.63 | 0.39 | 355 | 0.83 | 0.63 | 0.18 | 0.92 | 0.76 | 0.68 | |
| EA | 1811 | −0.78 | 0.65 | −5.35 | 4.0 × 10⁻³ | 2.59 | 0.15 | 1810 | 1.15 | 0.24 | −1.20 | 0.26 | −0.05 | 0.96 | |
| MRS × at least some college d | Full sample | 2691 | 1.00 | 0.09 | −1.85 | 0.03 | 1.31 | 0.09 | 2691 | 0.53 | 0.11 | −0.70 | 0.15 | 1.08 | 0.02 |
| AA | 355 | 0.57 | 0.73 | −2.43 | 0.31 | 1.97 | 0.37 | 355 | 0.51 | 0.59 | −1.18 | 0.39 | 1.71 | 0.18 | |
| EA | 1811 | 1.06 | 0.13 | −1.84 | 0.07 | 1.01 | 0.28 | 1810 | 0.74 | 0.07 | −0.61 | 0.30 | 0.66 | 0.22 | |
Publisher’s Note: MDPI stays neutral with regard to jurisdictional claims in published maps and institutional affiliations. |
© 2022 by the authors. Licensee MDPI, Basel, Switzerland. This article is an open access article distributed under the terms and conditions of the Creative Commons Attribution (CC BY) license (https://creativecommons.org/licenses/by/4.0/).
Share and Cite
Zhang, X.; Ammous, F.; Lin, L.; Ratliff, S.M.; Ware, E.B.; Faul, J.D.; Zhao, W.; Kardia, S.L.R.; Smith, J.A. The Interplay of Epigenetic, Genetic, and Traditional Risk Factors on Blood Pressure: Findings from the Health and Retirement Study. Genes 2022, 13, 1959. https://doi.org/10.3390/genes13111959
Zhang X, Ammous F, Lin L, Ratliff SM, Ware EB, Faul JD, Zhao W, Kardia SLR, Smith JA. The Interplay of Epigenetic, Genetic, and Traditional Risk Factors on Blood Pressure: Findings from the Health and Retirement Study. Genes. 2022; 13(11):1959. https://doi.org/10.3390/genes13111959
Chicago/Turabian StyleZhang, Xinman, Farah Ammous, Lisha Lin, Scott M. Ratliff, Erin B. Ware, Jessica D. Faul, Wei Zhao, Sharon L. R. Kardia, and Jennifer A. Smith. 2022. "The Interplay of Epigenetic, Genetic, and Traditional Risk Factors on Blood Pressure: Findings from the Health and Retirement Study" Genes 13, no. 11: 1959. https://doi.org/10.3390/genes13111959
APA StyleZhang, X., Ammous, F., Lin, L., Ratliff, S. M., Ware, E. B., Faul, J. D., Zhao, W., Kardia, S. L. R., & Smith, J. A. (2022). The Interplay of Epigenetic, Genetic, and Traditional Risk Factors on Blood Pressure: Findings from the Health and Retirement Study. Genes, 13(11), 1959. https://doi.org/10.3390/genes13111959