
Expression Analysis and the Roles of the Sec1 Gene in Regulating the Composition of Mouse Gut Microbiota


 ,
, 
 and
and 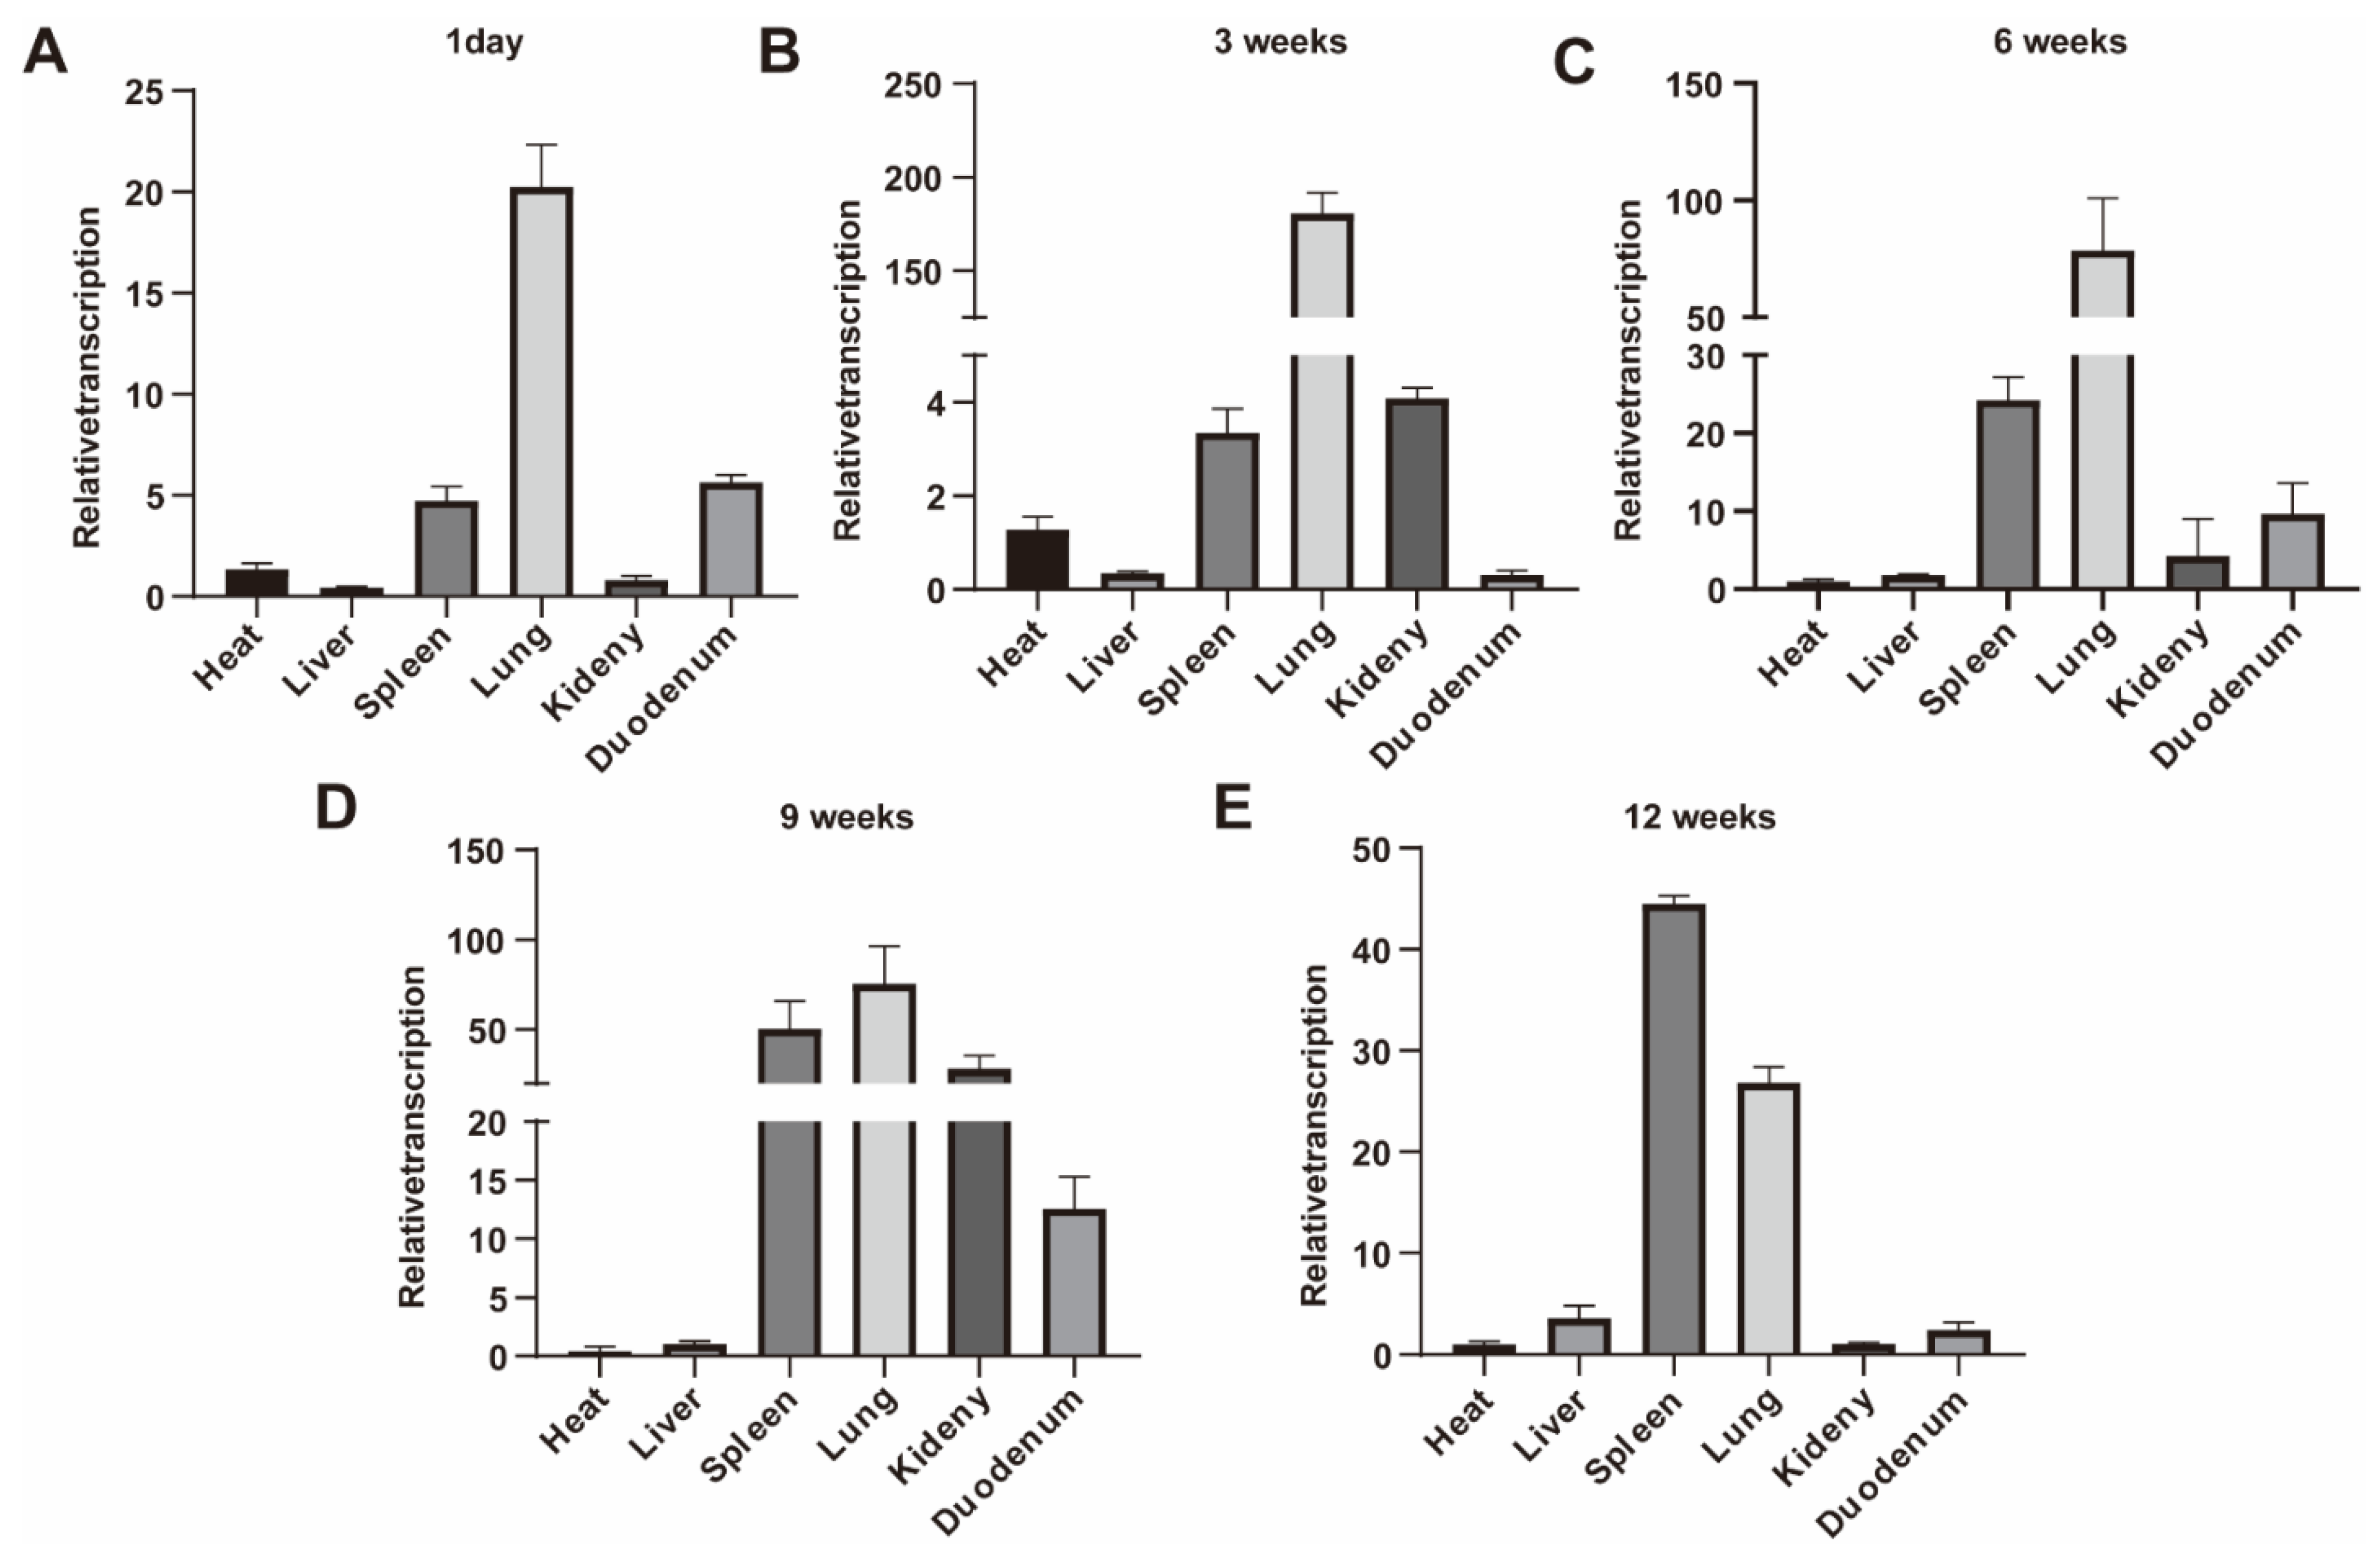
Abstract
1. Introduction
2. Materials and Methods
2.1. Establishment of Knockout Mouse Model
2.2. Collection of Feces Samples
2.3. Fecal DNA Extraction and PCR Amplification in Sec1−/− versus Sec1+/+ Mouse
2.4. Library Cconstruction and on-Board Sequencing
2.5. DNA Extraction and PCR Amplification
2.6. Illumina Hiseq 2500 Sequencing
2.7. Sequencing Data Processing
2.8. Alpha and Beta Diversity Analysis
2.9. RT-qPCR
3. Results
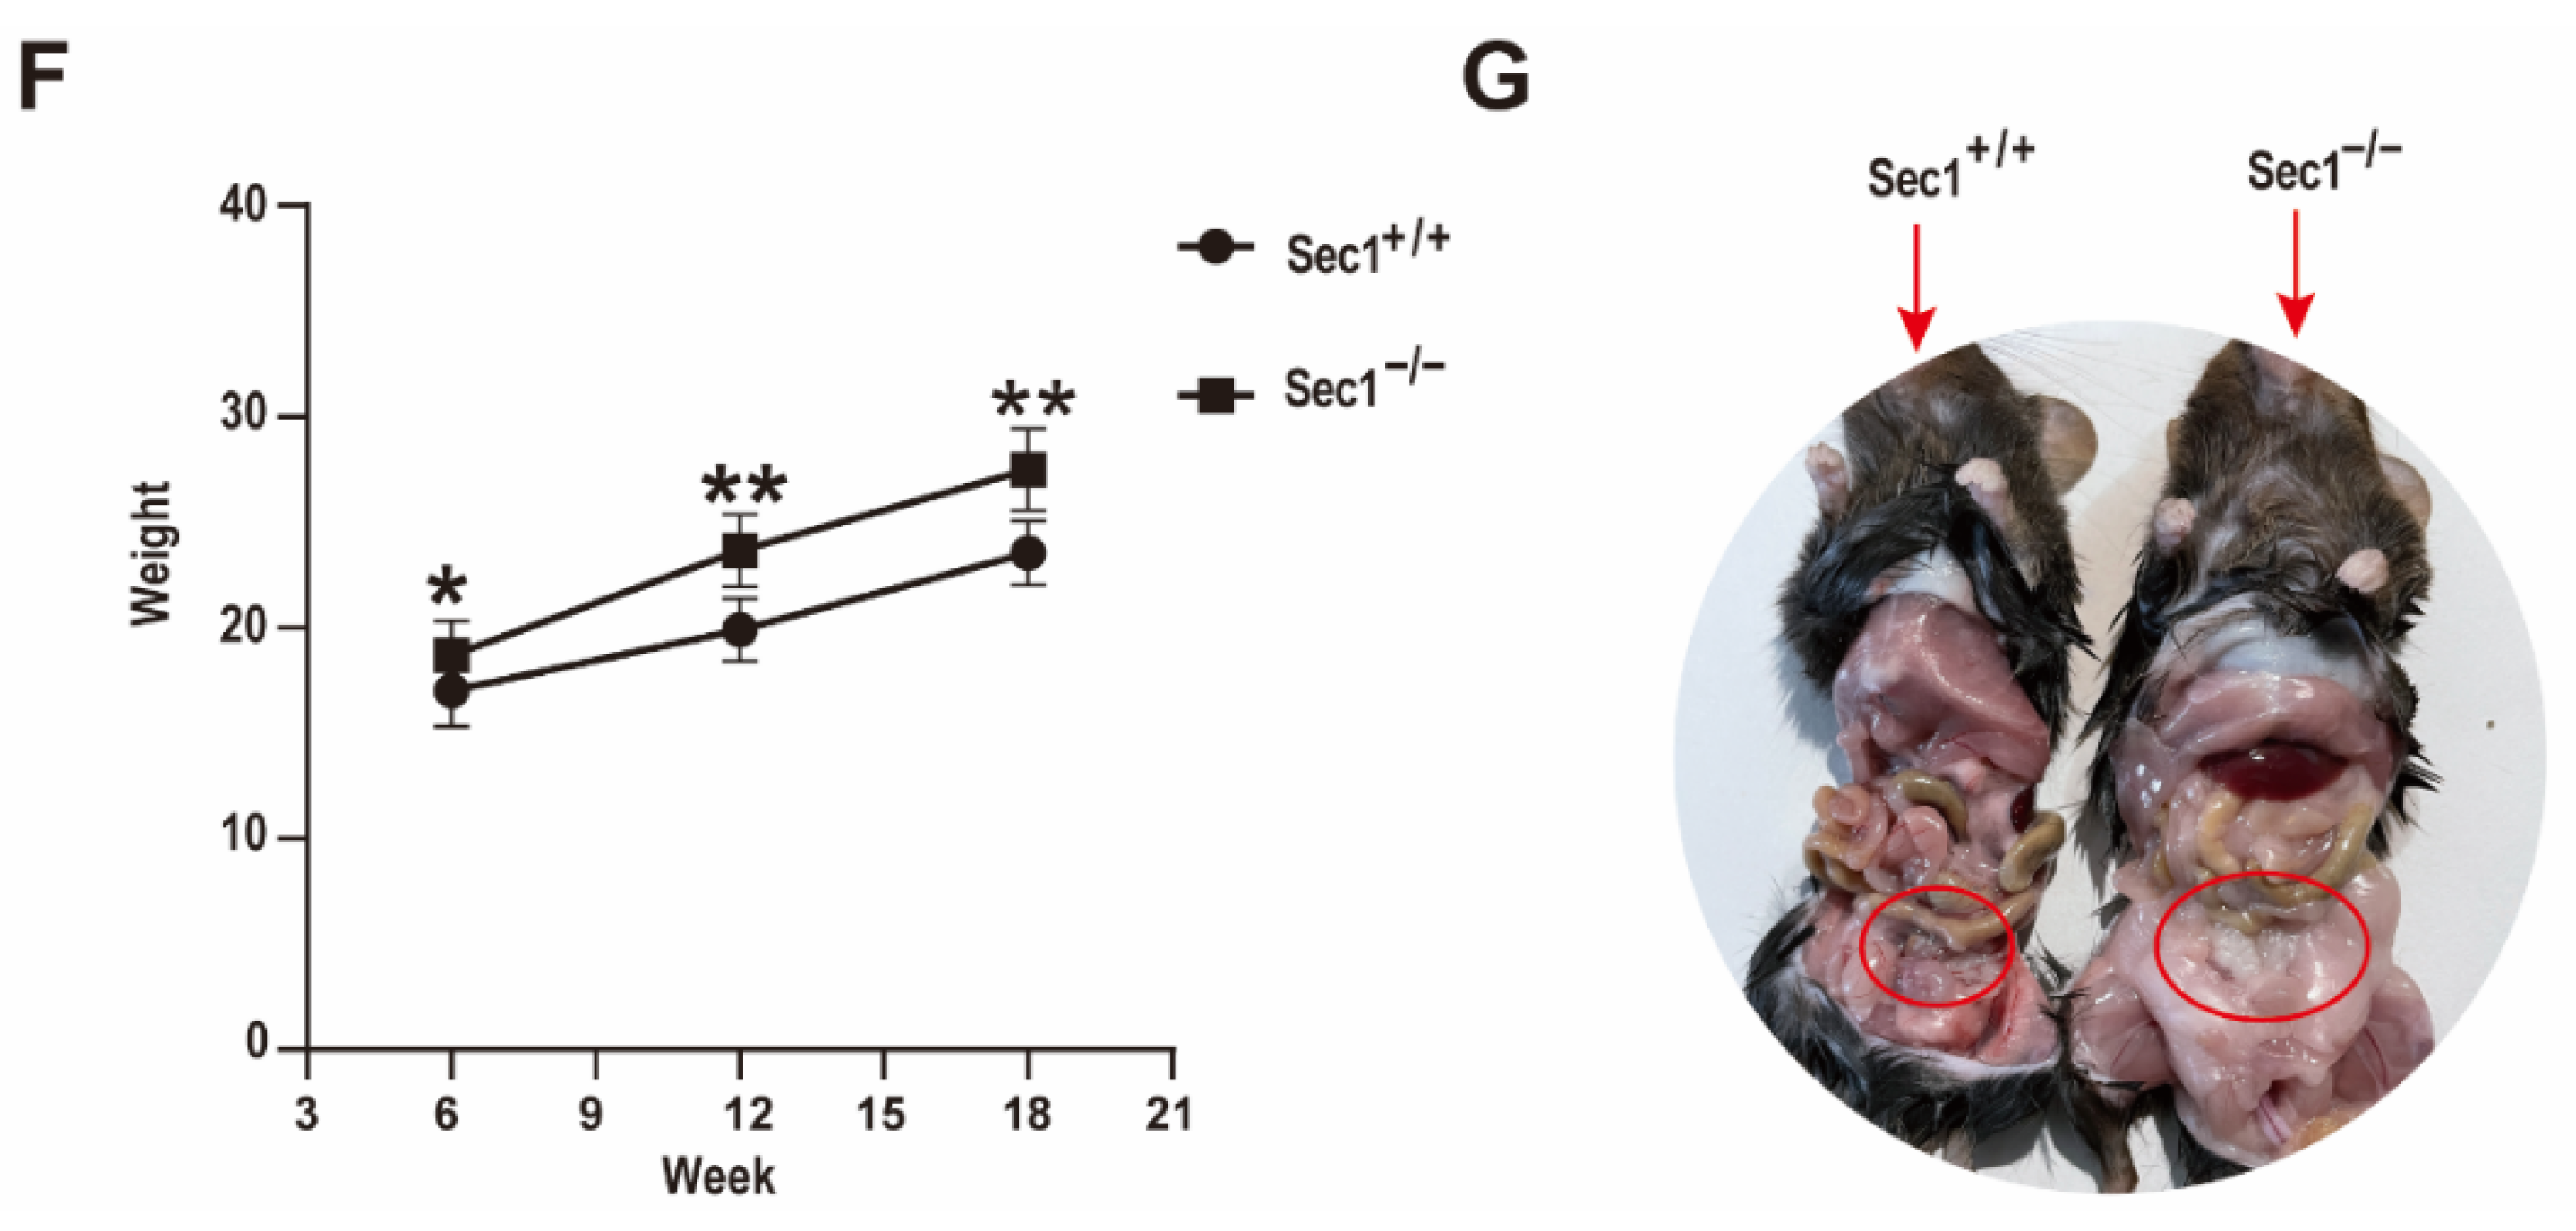
3.1. Sec1 Expression in Mouse Tissues at Different Time Periods and Phenotypic Differences of Wild Type and Knockout Type Mouse
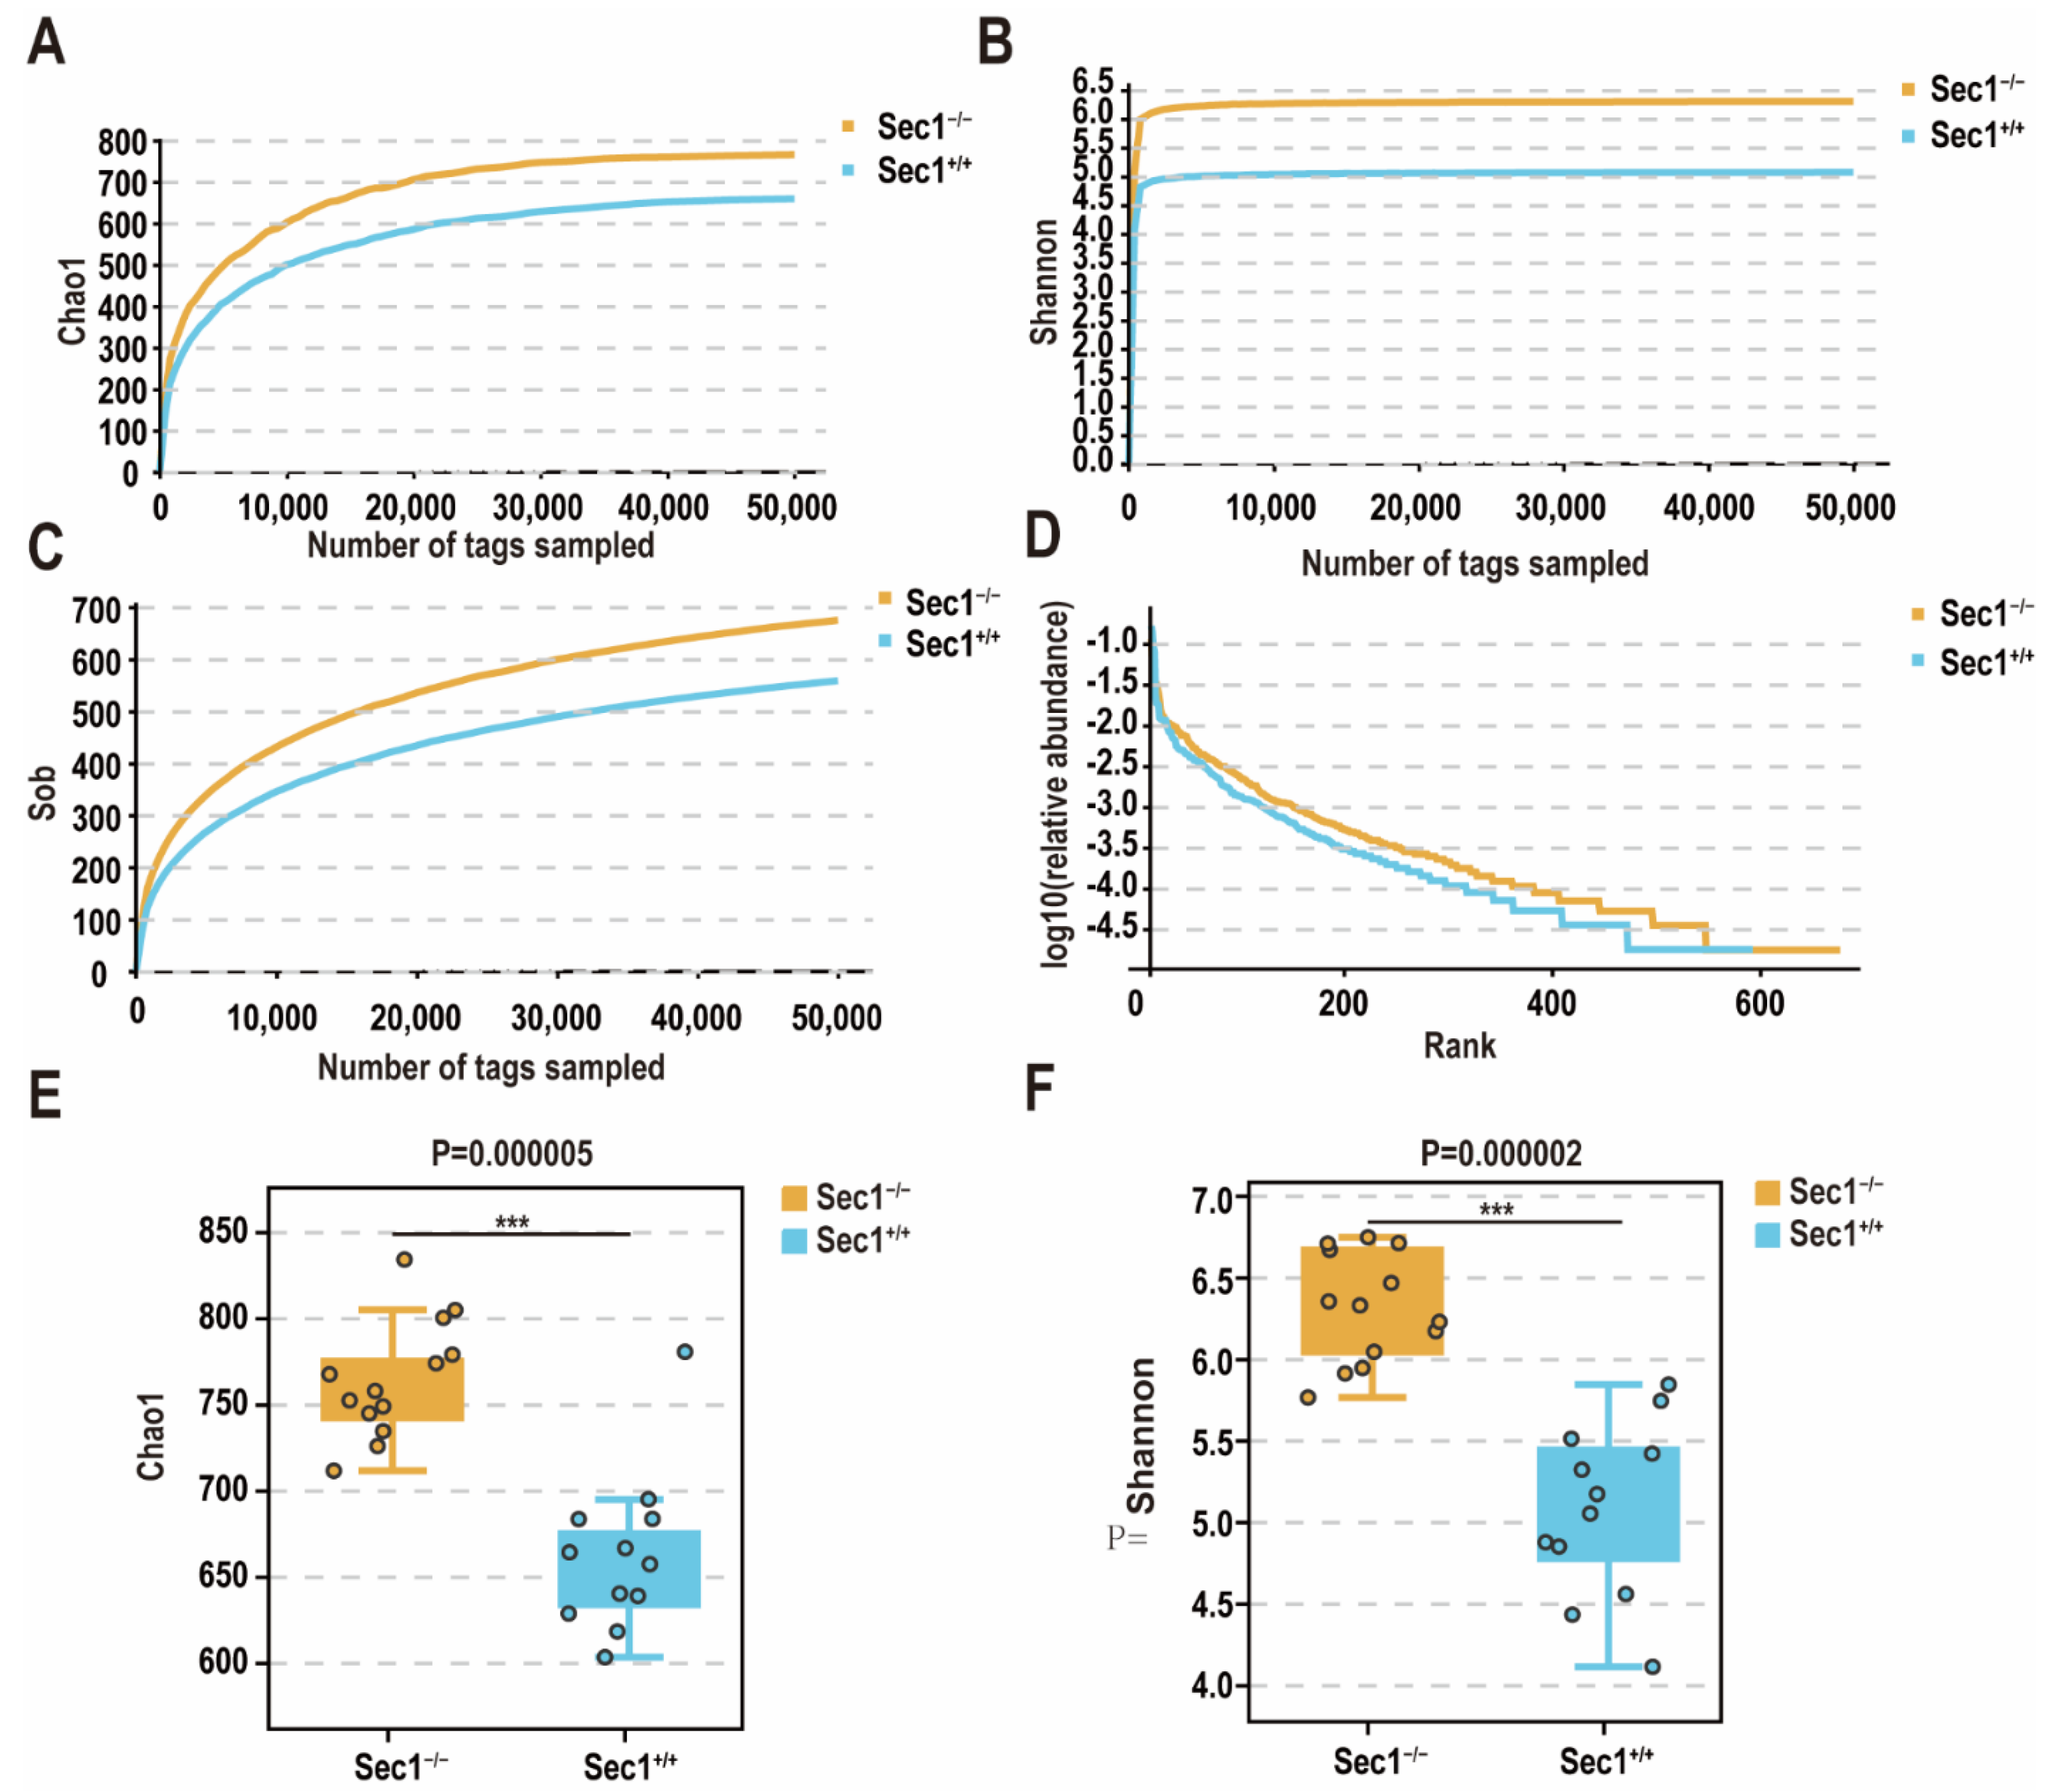
3.2. Effect of Sec1 Knockout on Microbial Species Richness in the Mouse Intestine
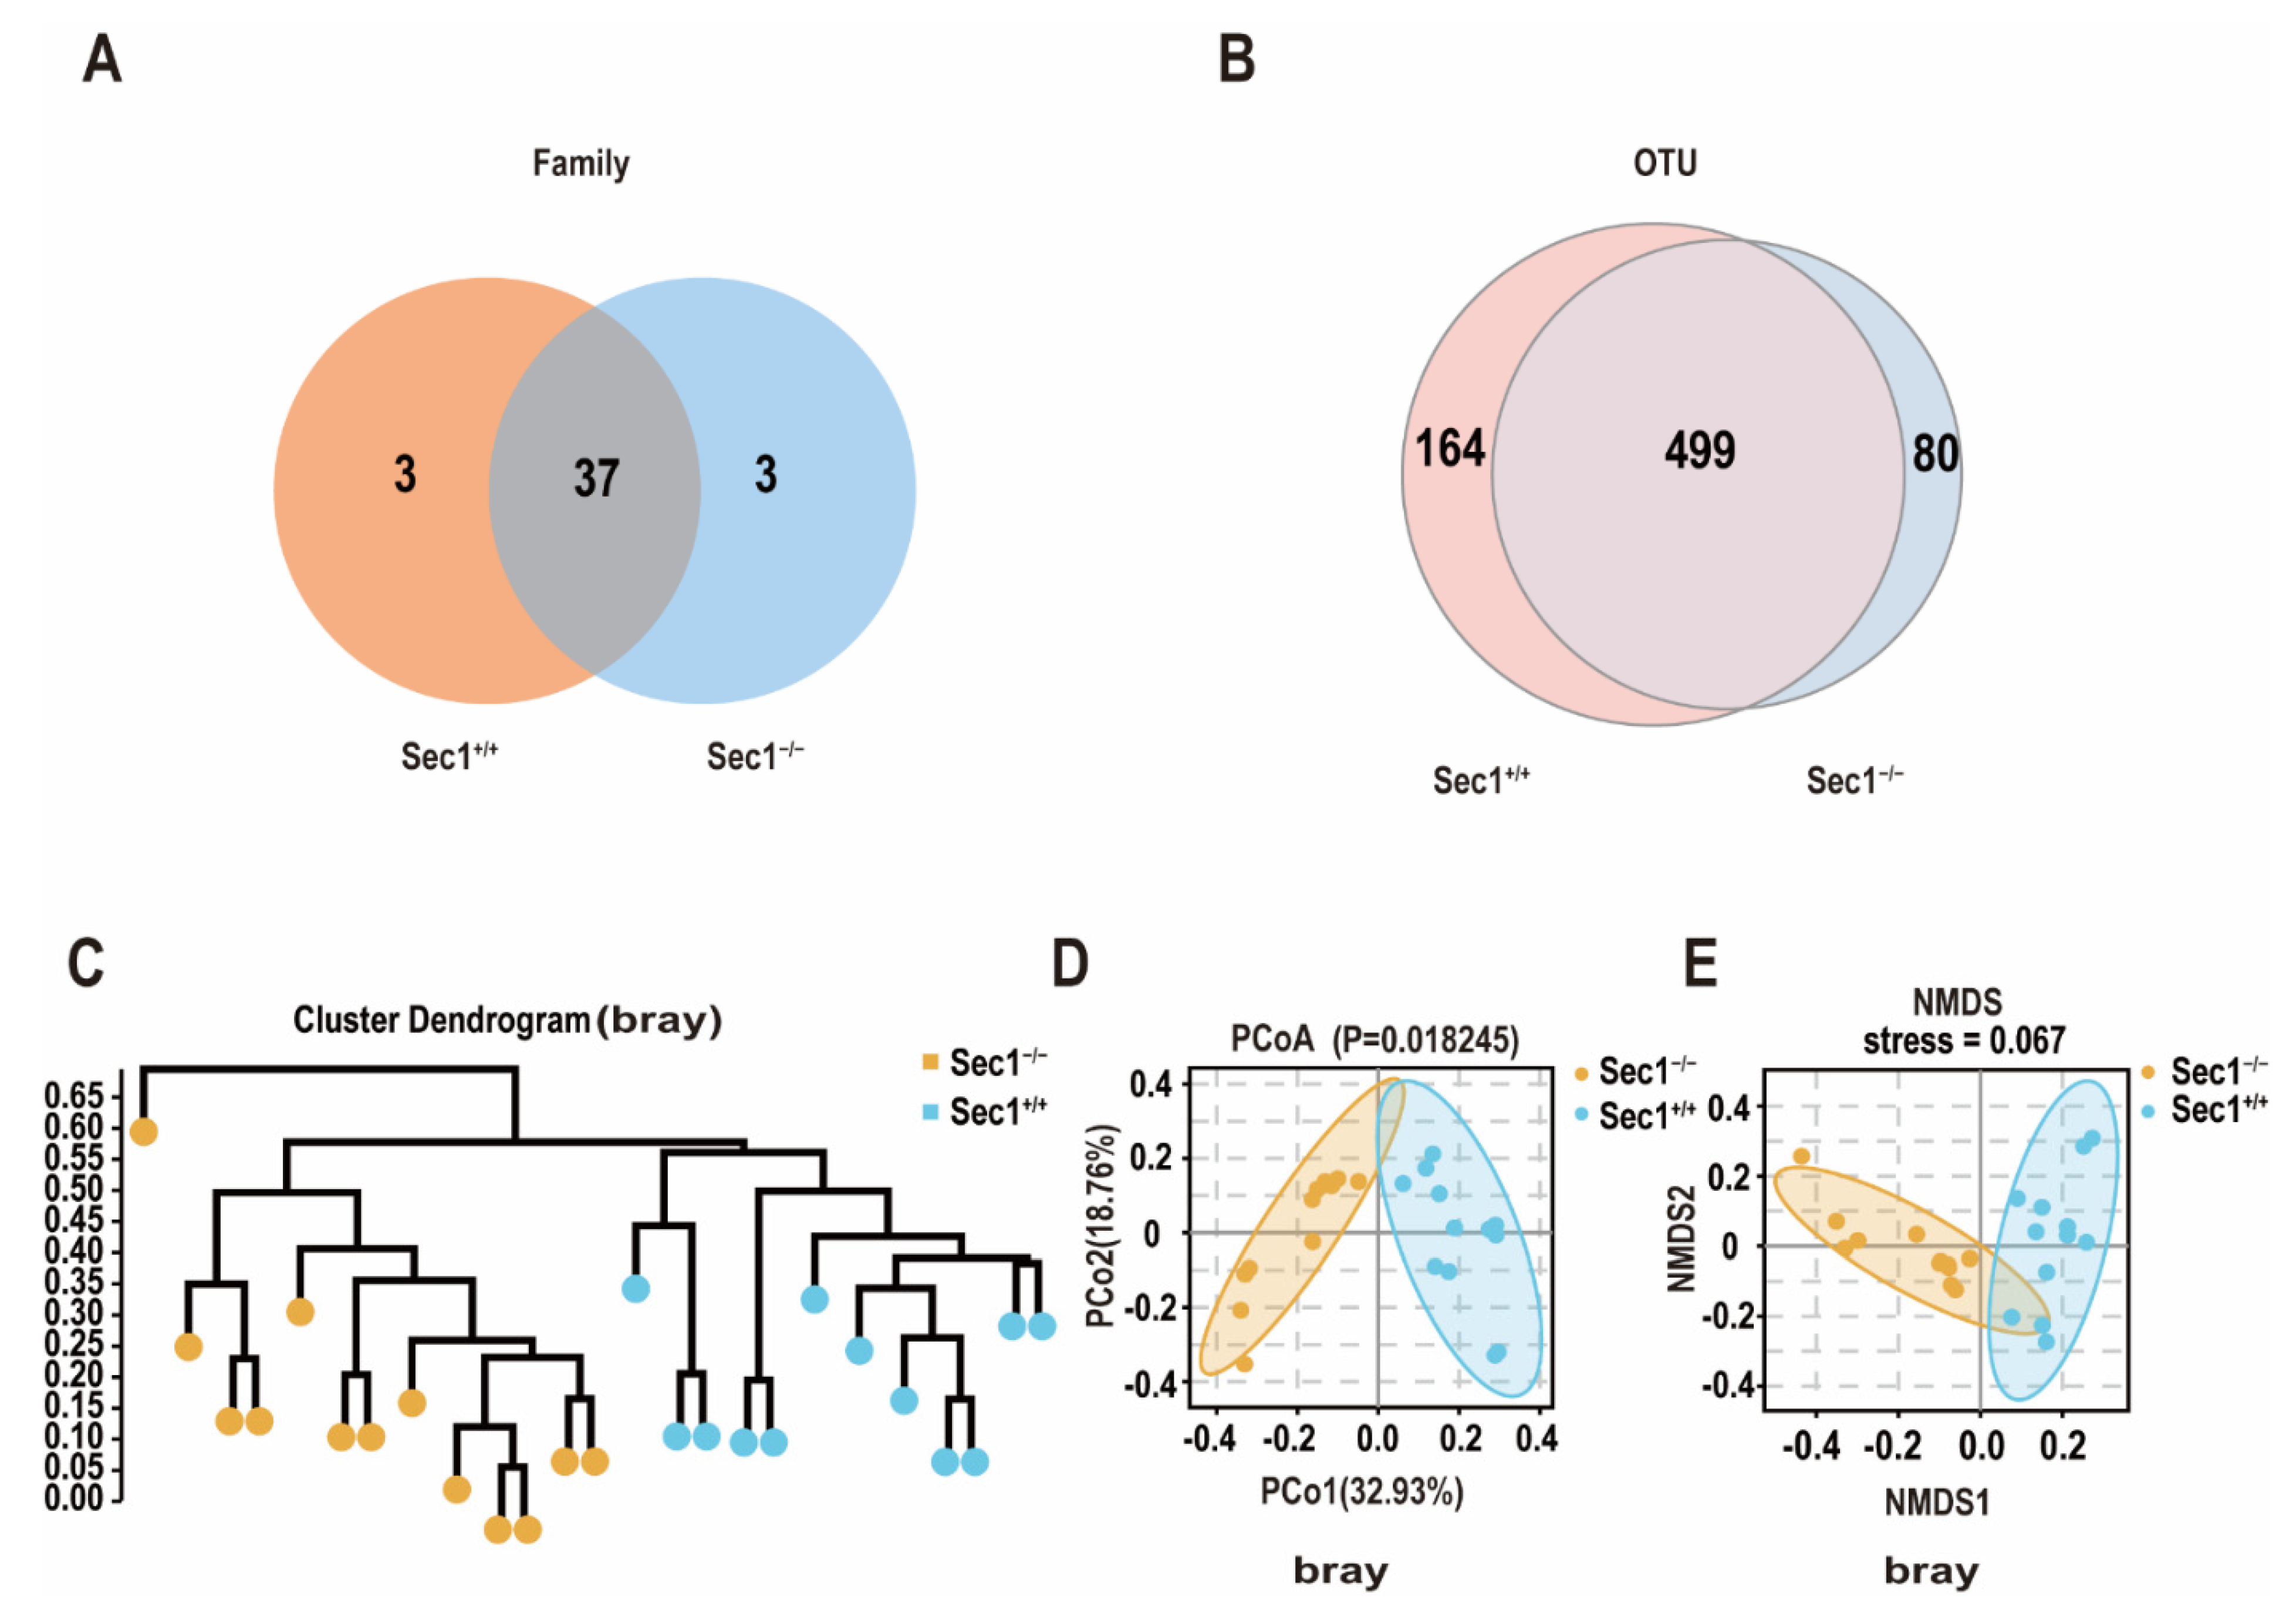
3.3. Effect of Sec1 Knockout on the Structure of Microbial Bacteria in the Intestine of Mouse
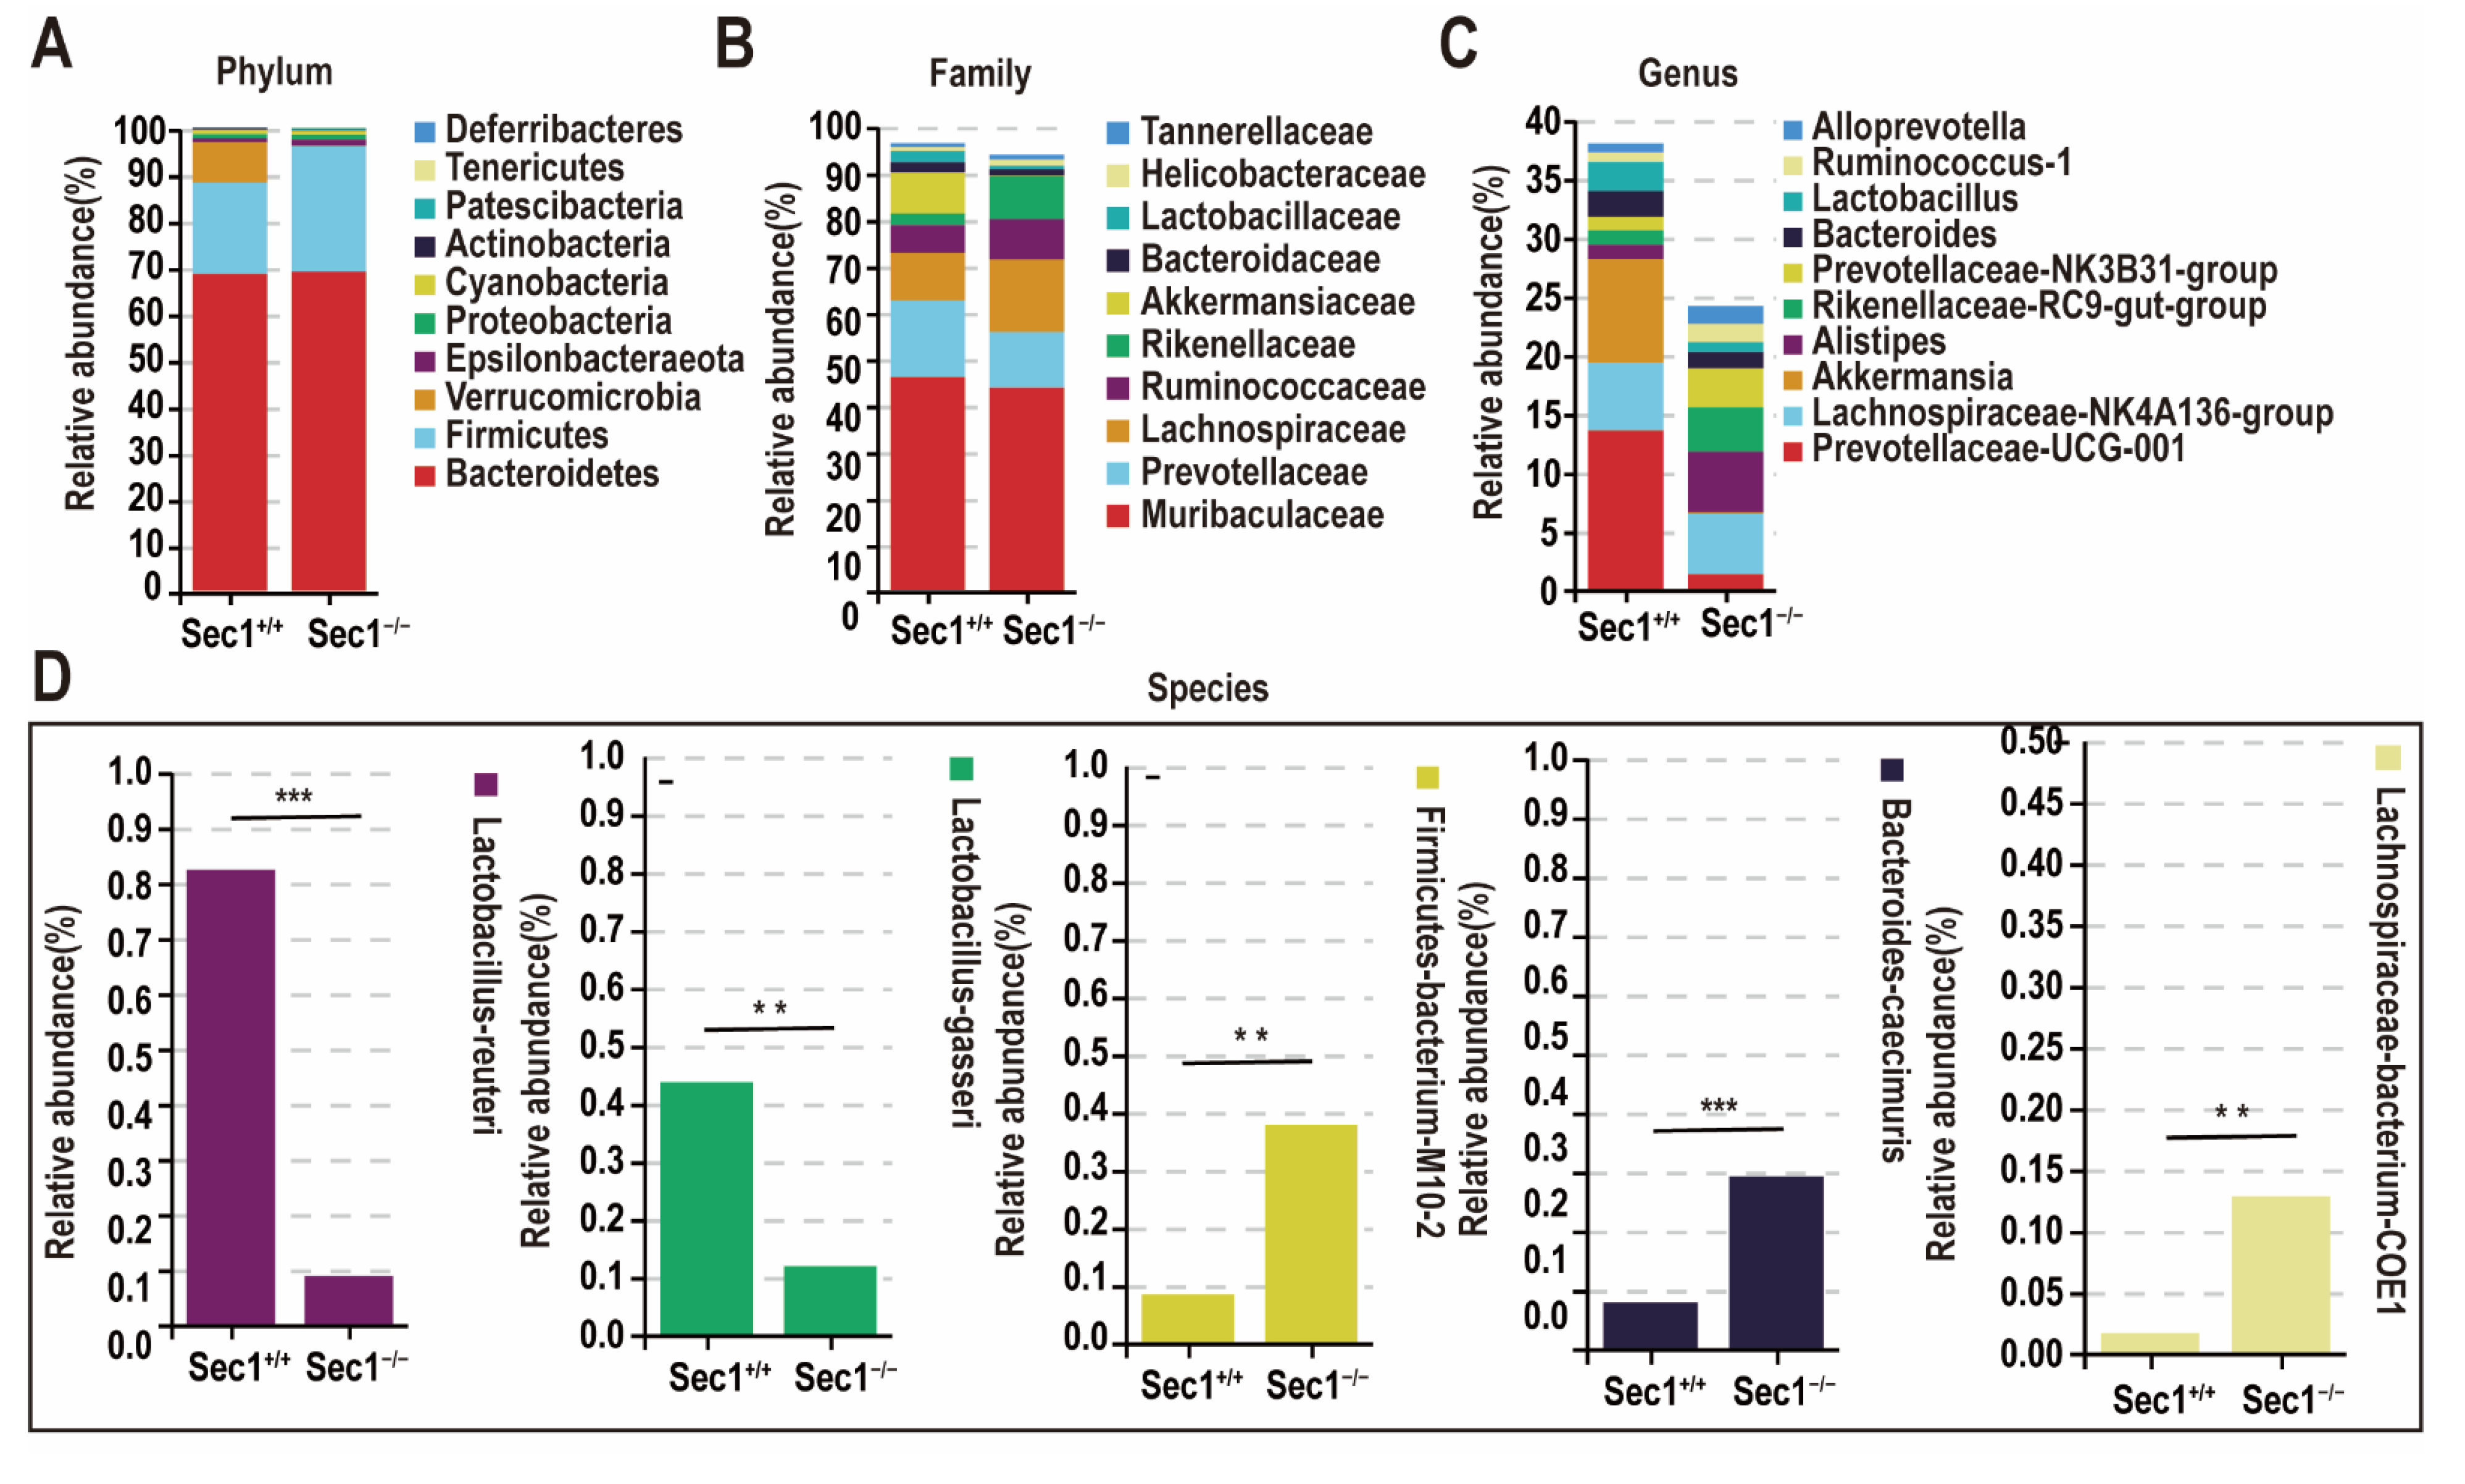
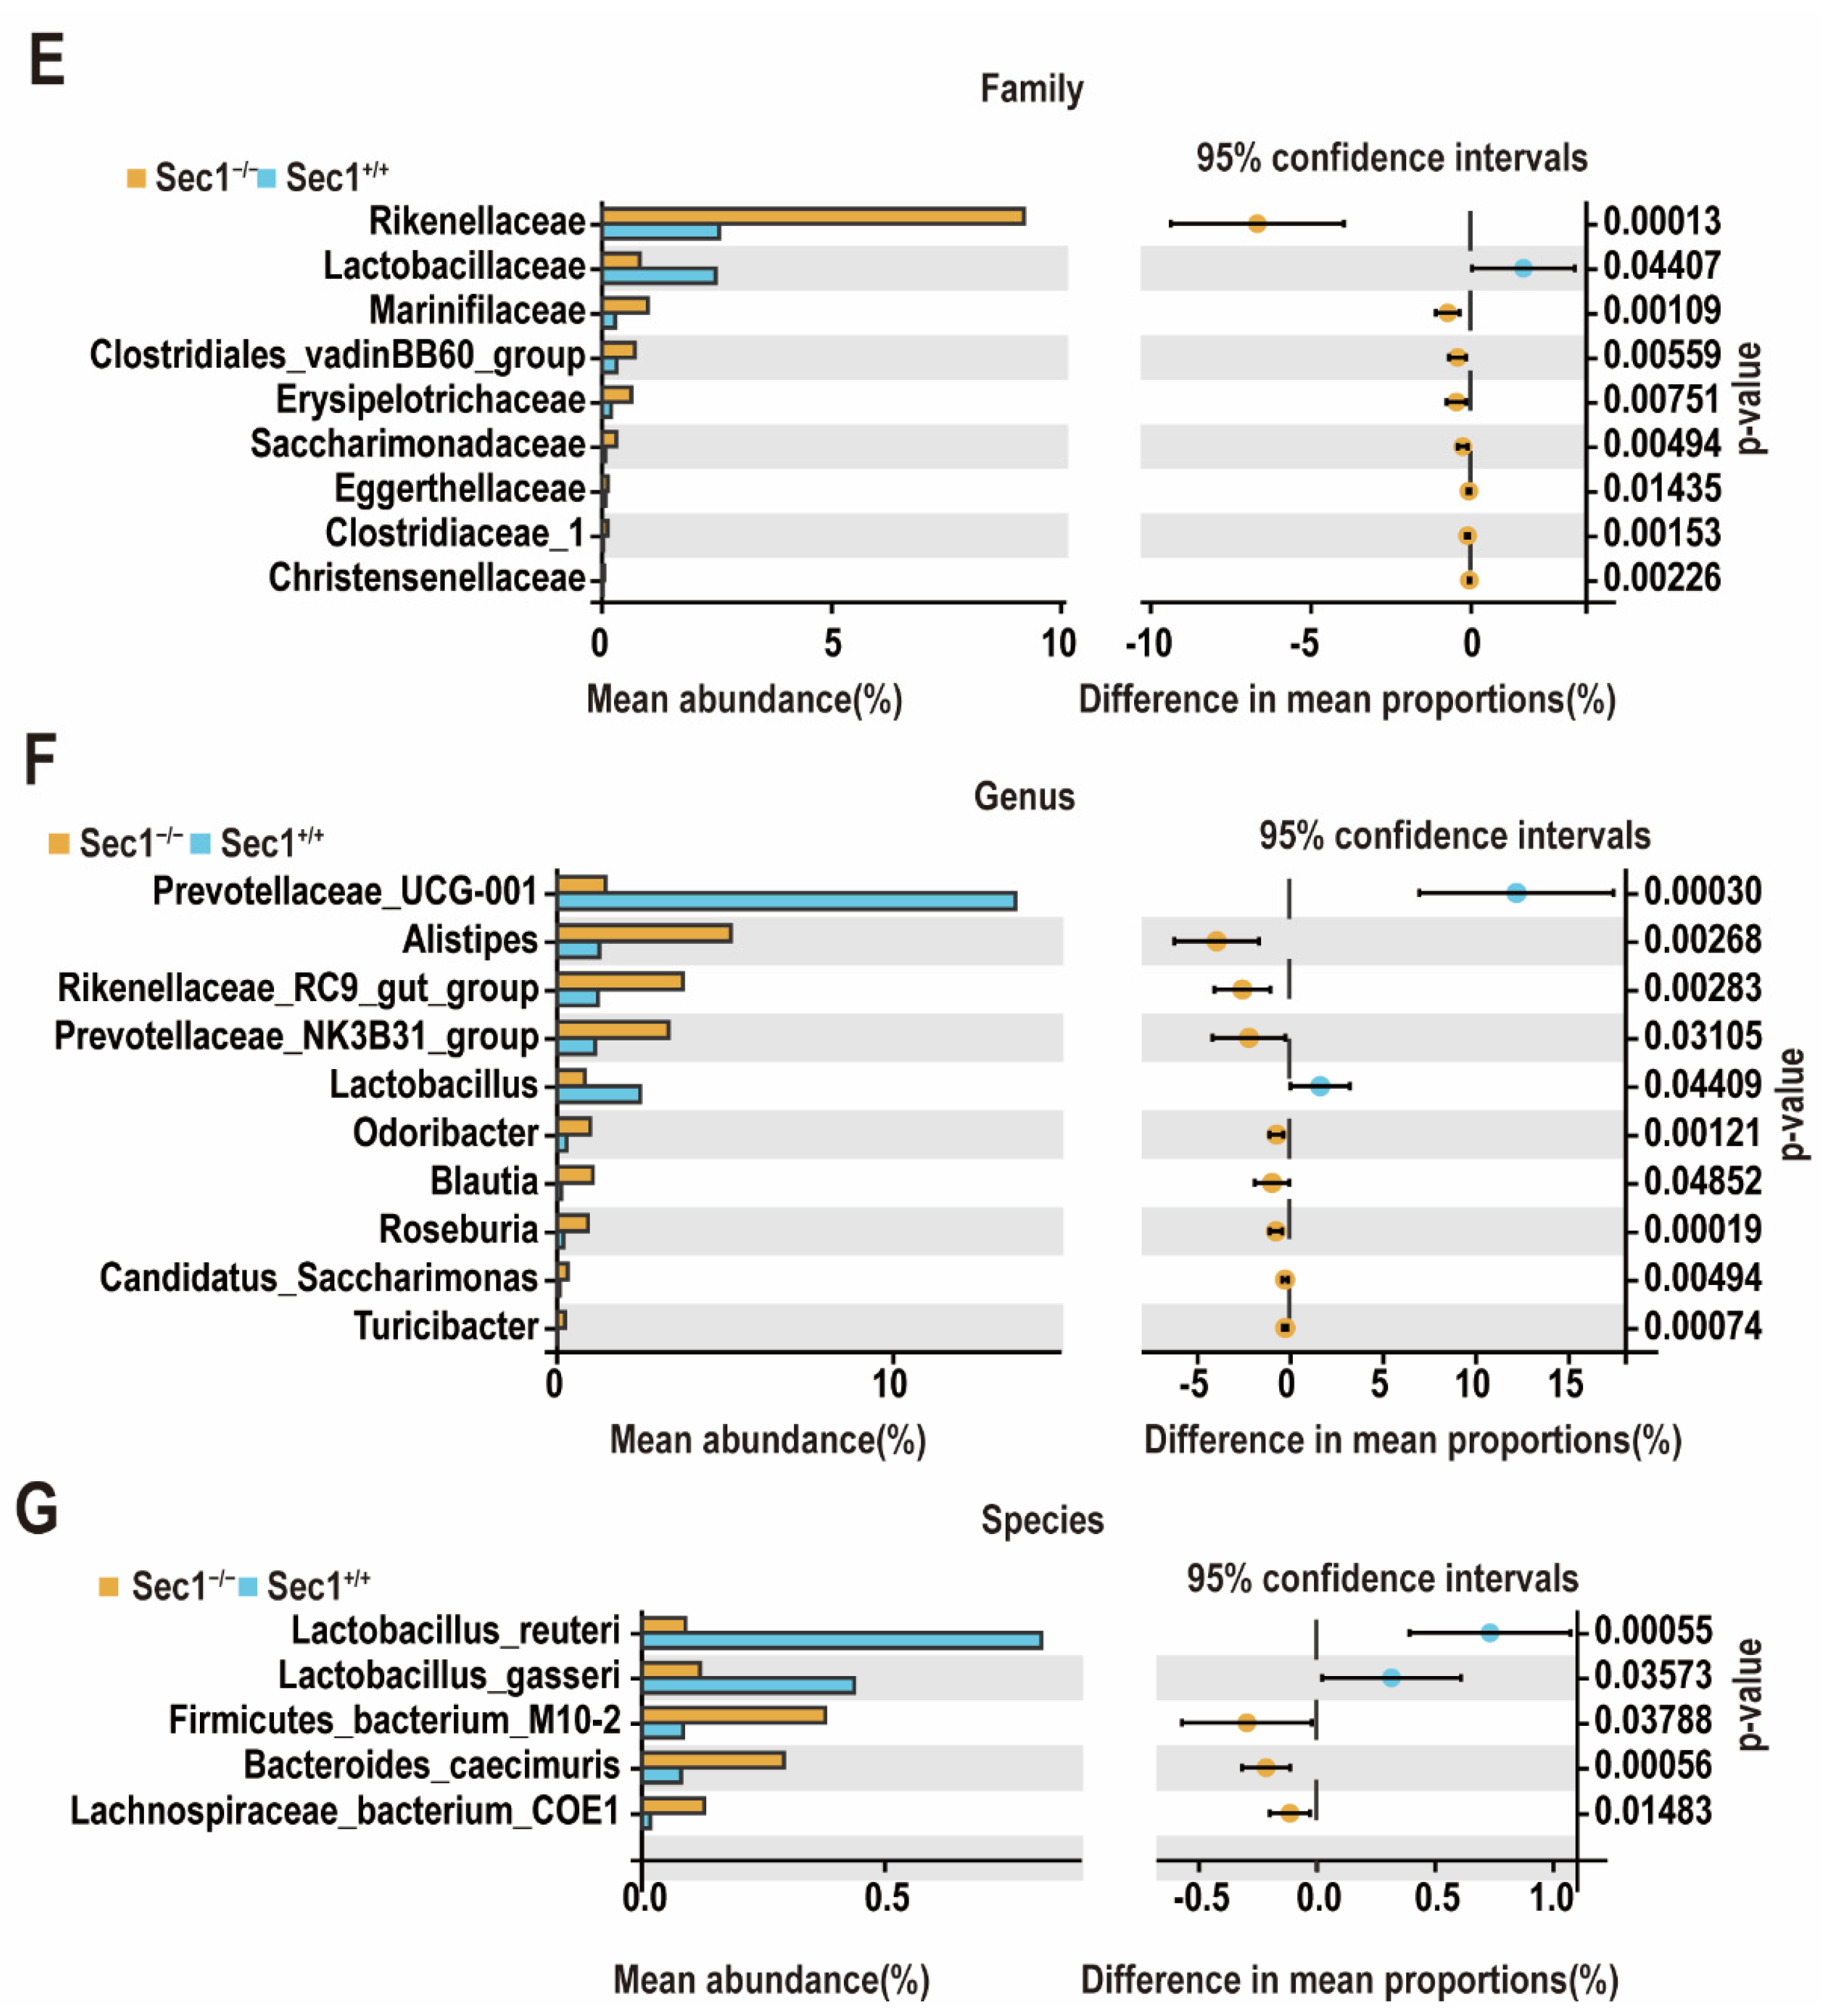
3.4. Effect of Sec1 Knockout on the Composition of Microbial Bacteria in the Mouse Intestine
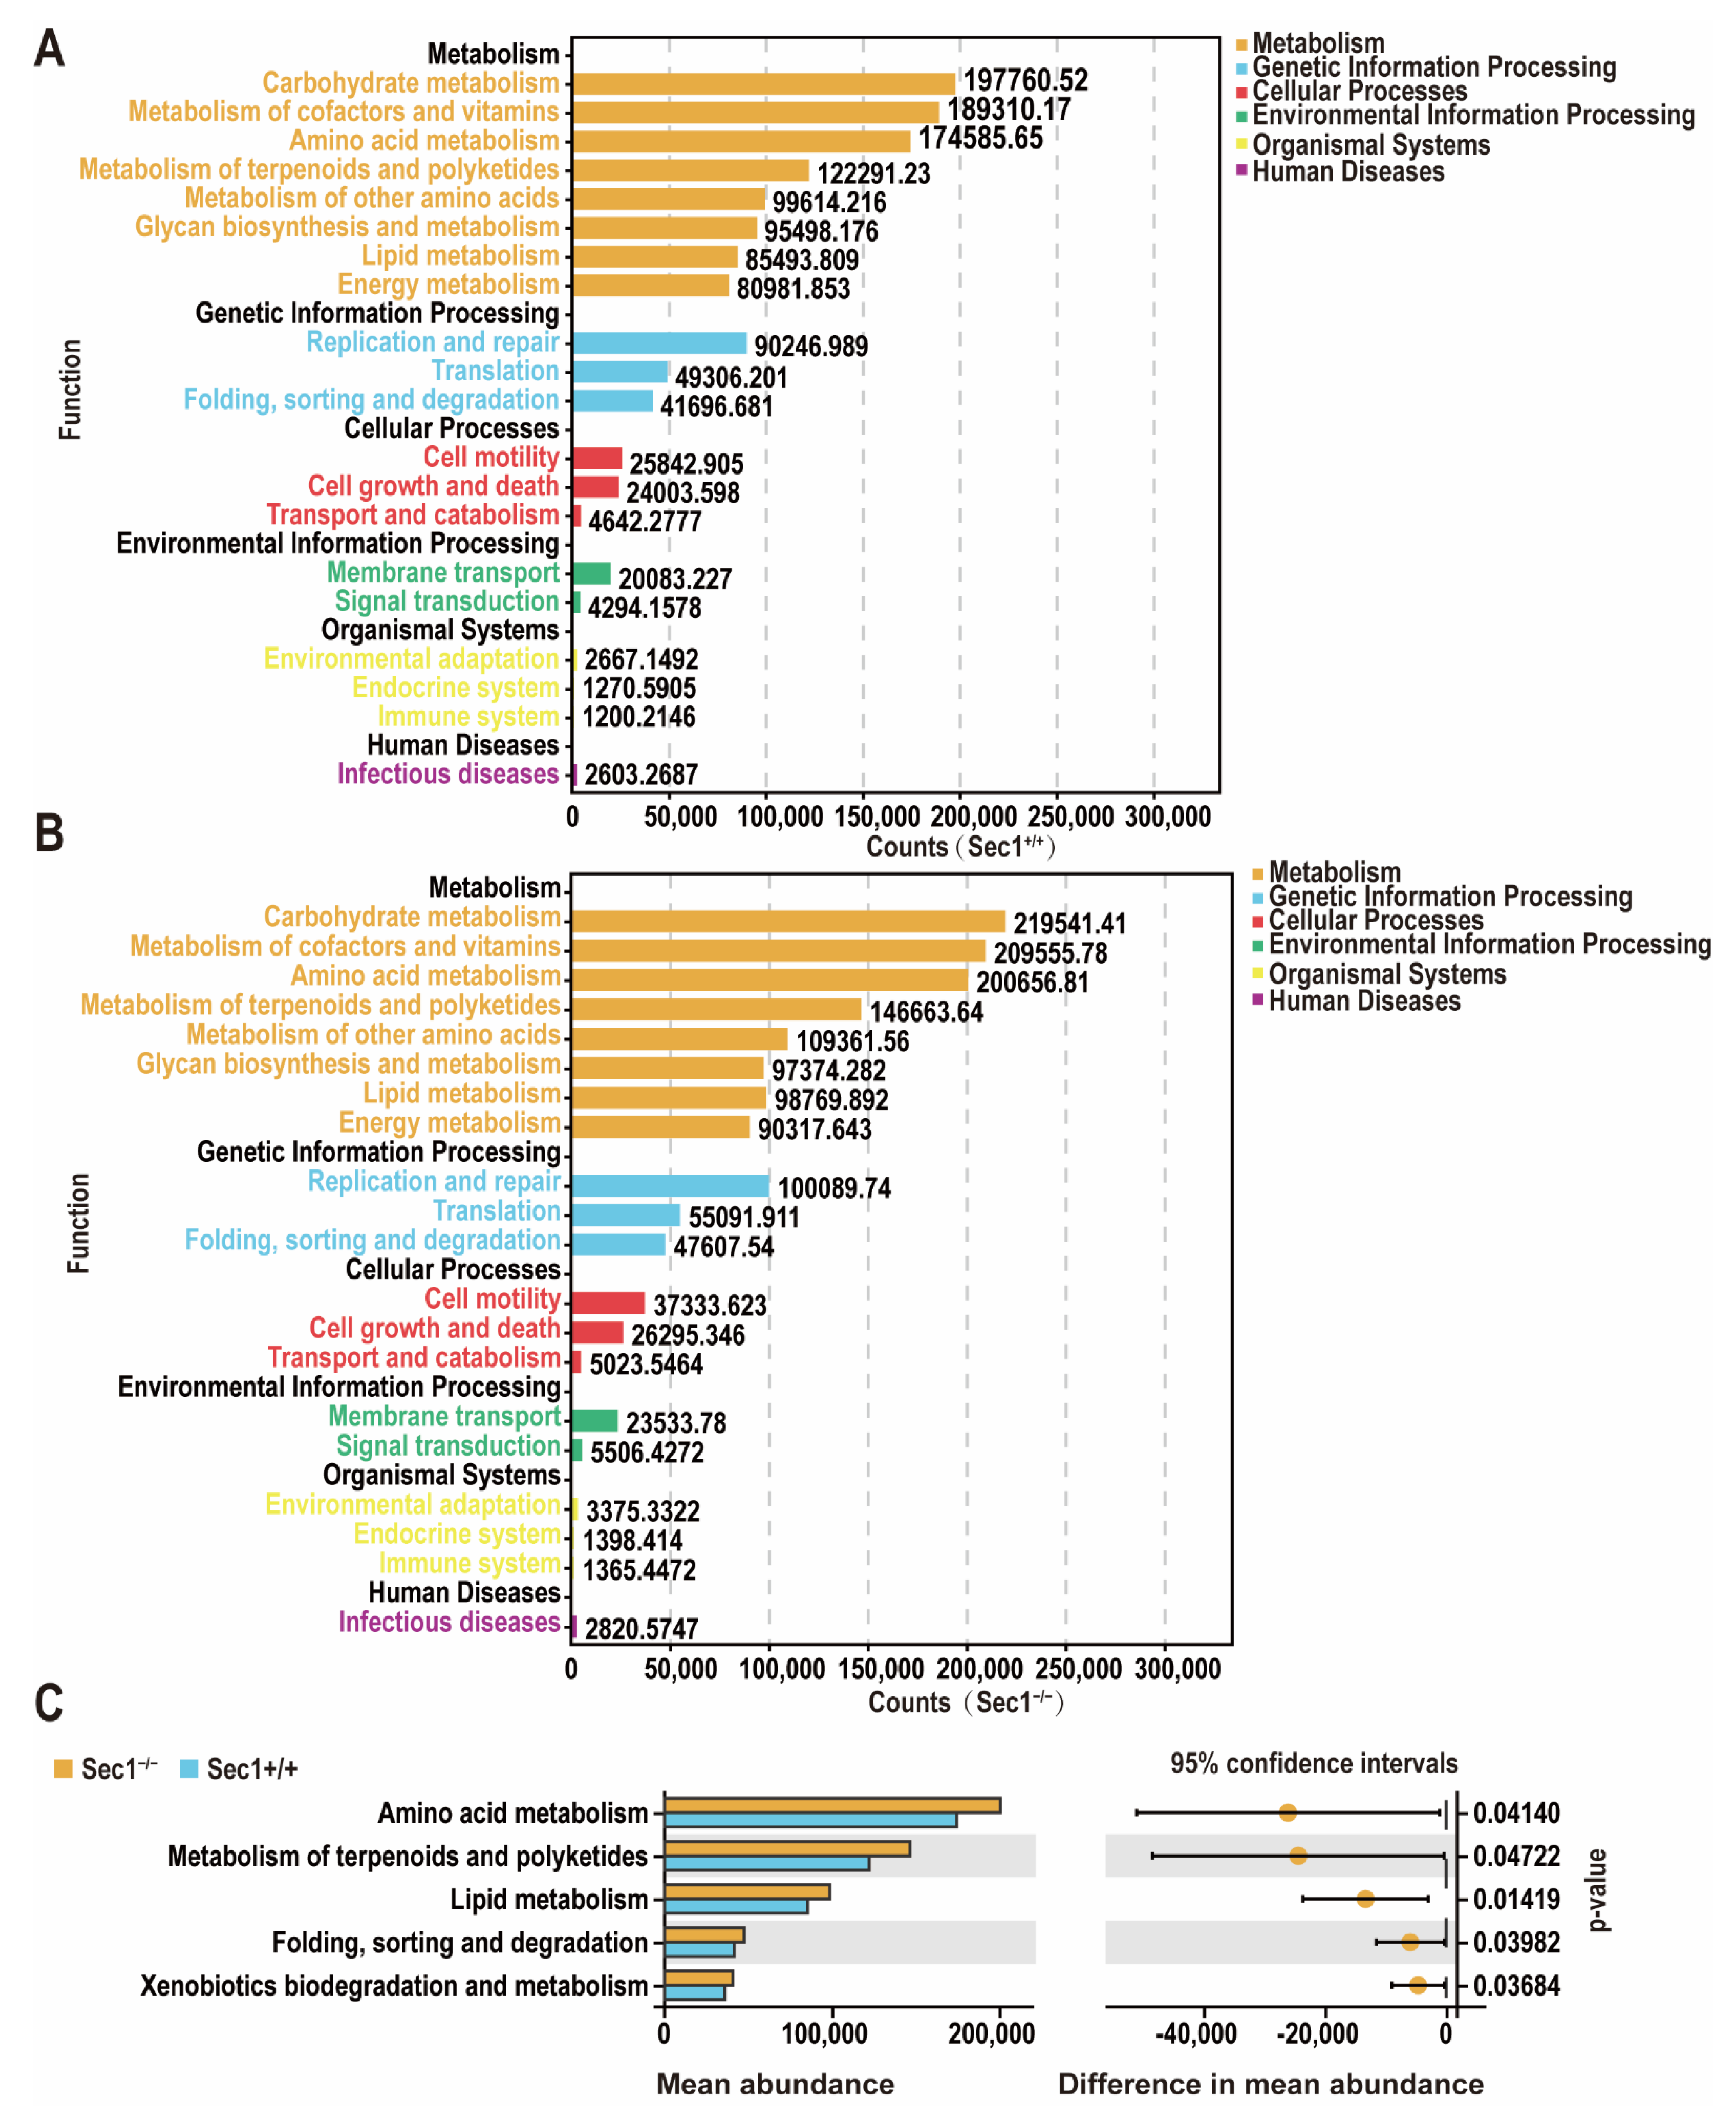
3.5. Changes in Gut Microbiota Function in Sec1 Knockout Mouse
4. Discussion
5. Conclusions
Author Contributions
Funding
Institutional Review Board Statement
Informed Consent Statement
Data Availability Statement
Acknowledgments
Conflicts of Interest
References
- Kononova, S.V. How Fucose of Blood Group Glycotopes Programs Human Gut Microbiota. Biochemistry 2017, 82, 973–989. [Google Scholar] [CrossRef] [PubMed]
- Bäckhed, F.; Ding, H.; Wang, T.; Hooper, L.V.; Koh, G.Y.; Nagy, A.; Semenkovich, C.F.; Gordon, J.I. The gut microbiota as an environmental factor that regulates fat storage. Proc. Natl. Acad. Sci. USA 2004, 101, 15718–15723. [Google Scholar] [CrossRef] [PubMed]
- Chaturvedi, P.; Warren, C.D.; Altaye, M.; Morrow, A.L.; Ruiz-Palacios, G.; Pickering, L.K.; Newburg, D.S. Fucosylated human milk oligosaccharides vary between individuals and over the course of lactation. Glycobiology 2001, 11, 365–372. [Google Scholar] [CrossRef]
- Biol-N’garagba, M.-C.; Louisot, P. Regulation of the intestinal glycoprotein glycosylation during postnatal development: Role of hormonal and nutritional factors. Biochimie 2003, 85, 331–352. [Google Scholar] [CrossRef]
- Newburg, D.S.; Morelli, L. Human milk and infant intestinal mucosal glycans guide succession of the neonatal intestinal microbiota. Pediatr. Res. 2015, 77, 115–120. [Google Scholar] [CrossRef]
- Zhang, X.; Shen, D.; Fang, Z.; Jie, Z.; Qiu, X.; Zhang, C.; Chen, Y.; Ji, L. Human gut microbiota changes reveal the progression of glucose intolerance. PLoS ONE 2013, 8, e71108. [Google Scholar] [CrossRef]
- Larsen, N.; Vogensen, F.K.; van den Berg, F.W.; Nielsen, D.S.; Andreasen, A.S.; Pedersen, B.K.; Al-Soud, W.A.; Sorensen, S.J.; Hansen, L.H.; Jakobsen, M. Gut microbiota in human adults with type 2 diabetes differs from non-diabetic adults. PLoS ONE 2010, 5, e9085. [Google Scholar] [CrossRef]
- Gill, S.R.; Pop, M.; Deboy, R.T.; Eckburg, P.B.; Turnbaugh, P.J.; Samuel, B.S.; Gordon, J.I.; Relman, D.A.; Fraser-Liggett, C.M.; Nelson, K.E. Metagenomic Analysis of the Human Distal Gut Microbiome. Science 2011, 312, 1355–1359. [Google Scholar] [CrossRef]
- Steinhoff, U. Who controls the crowd? New findings and old questions about the intestinal microflora. Immunol. Lett. 2005, 99, 12–16. [Google Scholar] [CrossRef]
- Kelly, R.J.; Rouquier, S.; Giorgi, D.; Lennon, G.G.; Lowe, J.B. Sequence and expression of a candidate for the human Secretor blood group α(1,2)fucosyltransferase gene (FUT2). Homozygosity for an enzyme-inactivating nonsense mutation commonly correlates with the non-secretor phenotype. J. Biol. Chem. 1995, 270, 4640–4649. [Google Scholar] [CrossRef]
- Larsen, R.D.; Ernst, L.K.; Nair, R.P.; Lowe, J.B. Molecular cloning, sequence, and expression of a human GDP-L-fucose:β-D-galactoside 2-α-L-fucosyltransferase cDNA that can form the H blood group antigen. Proc. Natl. Acad. Sci. USA 1990, 87, 6674–6678. [Google Scholar] [CrossRef] [PubMed]
- Abrantes, J.; Posada, D.; Guillon, P.; Esteves, P.J.; Le Pendu, J. Widespread gene conversion of α-2-fucosyltransferase genes in mammals. J. Mol. Evol. 2009, 69, 22–31. [Google Scholar] [CrossRef] [PubMed]
- Franks, I. Gut microbiota: FUT2 genotype influences the gut microbiota in patients with Crohn’s disease and healthy individuals. Nat. Rev. Gastroenterol. Hepatol. 2011, 9, 2. [Google Scholar] [CrossRef] [PubMed]
- Campbell, B.J.; Yu, L.G.; Rhodes, J.M. Altered glycosylation in inflammatory bowel disease: A possible role in cancer development. Glycoconj. J. 2001, 18, 851–858. [Google Scholar] [CrossRef]
- Wacklin, P.; Makivuokko, H.; Alakulppi, N.; Nikkila, J.; Tenkanen, H.; Rabina, J.; Partanen, J.; Aranko, K.; Matto, J. Secretor genotype (FUT2 gene) is strongly associated with the composition of Bifidobacteria in the human intestine. PLoS ONE 2011, 6, e20113. [Google Scholar] [CrossRef]
- Nishida, A.; Lau, C.W.; Zhang, M.; Andoh, A.; Shi, H.N.; Mizoguchi, E.; Mizoguchi, A. The membrane-bound mucin Muc1 regulates T helper 17-cell responses and colitis in mice. Gastroenterology 2012, 142, 865–874.e2. [Google Scholar] [CrossRef]
- Hirakawa, M.; Takimoto, R.; Tamura, F.; Yoshida, M.; Ono, M.; Murase, K.; Sato, Y.; Osuga, T.; Sato, T.; Iyama, S.; et al. Fucosylated TGF-β receptors transduces a signal for epithelial-mesenchymal transition in colorectal cancer cells. Br. J. Cancer 2014, 110, 156–163. [Google Scholar] [CrossRef]
- Padro, M.; Cobler, L.; Garrido, M.; de Bolos, C. Down-regulation of FUT3 and FUT5 by shRNA alters Lewis antigens expression and reduces the adhesion capacities of gastric cancer cells. Biochim. Biophys. Acta 2011, 1810, 1141–1149. [Google Scholar] [CrossRef]
- Breiman, A.; López Robles, M.D.; de Carné Trécesson, S.; Echasserieau, K.; Bernardeau, K.; Drickamer, K.; Imberty, A.; Barillé-Nion, S.; Altare, F.; Le Pendu, J. Carcinoma-associated fucosylated antigens are markers of the epithelial state and can contribute to cell adhesion through CLEC17A (Prolectin). Oncotarget. 2016, 7, 14064–14082. [Google Scholar] [CrossRef]
- Magalhaes, A.; Reis, C.A. Helicobacter pylori adhesion to gastric epithelial cells is mediated by glycan receptors. Braz. J. Med. Biol. Res. 2010, 43, 611–618. [Google Scholar] [CrossRef]
- Hu, D.Y.; Shao, X.X.; Xu, C.L.; Xia, S.L.; Yu, L.Q.; Jiang, L.J.; Jin, J.; Lin, X.Q.; Jiang, Y. Associations of FUT2 and FUT3 gene polymorphisms with Crohn’s disease in Chinese patients. J. Gastroenterol. Hepatol. 2014, 29, 1778–1785. [Google Scholar] [CrossRef] [PubMed]
- Wiederschain, G.Y.; Newburg, D.S. Compartmentalization of fucosyltransferase and α-L-fucosidase in human milk. Biochem. Mol. Med. 1996, 58, 211–220. [Google Scholar] [CrossRef] [PubMed]
- Duell, E.J.; Bonet, C.; Munoz, X.; Lujan-Barroso, L.; Weiderpass, E.; Boutron-Ruault, M.C.; Racine, A.; Severi, G.; Canzian, F.; Rizzato, C.; et al. Variation at ABO histo-blood group and FUT loci and diffuse and intestinal gastric cancer risk in a European population. Int. J. Cancer 2015, 136, 880–893. [Google Scholar] [CrossRef] [PubMed]
- Esposito, M.; Mondal, N.; Greco, T.M.; Wei, Y.; Spadazzi, C.; Lin, S.C.; Zheng, H.; Cheung, C.; Magnani, J.L.; Lin, S.H.; et al. Bone vascular niche E-selectin induces mesenchymal-epithelial transition and Wnt activation in cancer cells to promote bone metastasis. Nat. Cell Biol. 2019, 21, 627–639. [Google Scholar] [CrossRef]
- Pi, Y.; Gao, K.; Zhu, W. Advances in host-microbe metabolic axis. Wei Sheng Wu Xue Bao 2017, 57, 161–169. [Google Scholar] [PubMed]
- Petti, C.A. Detection and identification of microorganisms by gene amplification and sequencing. Clin. Infect. Dis. Off. Publ. Infect. Dis. Soc. Am. 2007, 44, 1108–1114. [Google Scholar]
- Jiang, X.T.; Peng, X.; Deng, G.H.; Sheng, H.F.; Wang, Y.; Zhou, H.W.; Tam, N.F. Illumina sequencing of 16S rRNA tag revealed spatial variations of bacterial communities in a mangrove wetland. Microb. Ecol. 2013, 66, 96–104. [Google Scholar] [CrossRef]
- Wu, Z.; Fan, H.; Jin, J.; Gao, S.; Huang, R.; Wu, S.; Bao, W. Insight into mechanisms of pig lncRNA FUT3-AS1 regulating E. coli F18-bacterial diarrhea. PLoS Pathog. 2022, 18, e1010584. [Google Scholar] [CrossRef]
- Magoc, T.; Salzberg, S.L. FLASH: Fast length adjustment of short reads to improve genome assemblies. Bioinformatics 2011, 27, 2957–2963. [Google Scholar] [CrossRef]
- Caporaso, J.G.; Kuczynski, J.; Stombaugh, J.; Bittinger, K.; Bushman, F.D.; Costello, E.K.; Fierer, N.; Peña, A.G.; Goodrich, J.K.; Gordon, J.I.; et al. QIIME allows analysis of high-throughput community sequencing data. Nat. Methods 2010, 7, 335–336. [Google Scholar] [CrossRef]
- Langille, M.G.; Zaneveld, J.; Caporaso, J.G.; McDonald, D.; Knights, D.; Reyes, J.A.; Clemente, J.C.; Burkepile, D.E.; Vega Thurber, R.L.; Knight, R.; et al. Predictive functional profiling of microbial communities using 16S rRNA marker gene sequences. Nat. Biotechnol. 2013, 31, 814–821. [Google Scholar] [CrossRef] [PubMed]
- Lin, B.; Saito, M.; Iwamori, M. Comparison of the Three Murine GDP-fucose: β-galactoside α1,2-fucosytransferase MFUT-I, MFUT-II and MFUT-III. Chin. J. Coll. Biol. 2005, 27, 761–766. [Google Scholar]
- Eckburg, P.B.; Bik, E.M.; Bernstein, C.N.; Purdom, E.; Dethlefsen, L.; Sargent, M.; Gill, S.R.; Nelson, K.E.; Relman, D.A. Diversity of the human intestinal microbial flora. Science 2005, 308, 1635–1638. [Google Scholar] [CrossRef] [PubMed]
- Bäckhed, F.; Ley, R.E.; Sonnenburg, J.L.; Peterson, D.A.; Gordon, J.I. Host-bacterial mutualism in the human intestine. Science 2005, 307, 1915–1920. [Google Scholar] [CrossRef] [PubMed]
- Ridaura, V.K.; Faith, J.J.; Rey, F.E.; Cheng, J.; Duncan, A.E.; Kau, A.L.; Griffin, N.W.; Lombard, V.; Henrissat, B.; Bain, J.R.; et al. Gut microbiota from twins discordant for obesity modulate metabolism in mice. Science 2013, 341, 1241214. [Google Scholar] [CrossRef]
- Turnbaugh, P.J.; Ley, R.E.; Mahowald, M.A.; Magrini, V.; Mardis, E.R.; Gordon, J.I. An obesity-associated gut microbiome with increased capacity for energy harvest. Nature 2006, 444, 1027–1031. [Google Scholar] [CrossRef]
- Ley, R.E.; Turnbaugh, P.J.; Klein, S.; Gordon, J.I. Microbial ecology: Human gut microbes associated with obesity. Nature 2006, 444, 1022–1023. [Google Scholar] [CrossRef]
- Cuevas-Sierra, A.; Ramos-Lopez, O.; Riezu-Boj, J.I.; Milagro, F.I.; Martinez, J.A. Diet, Gut Microbiota, and Obesity: Links with Host Genetics and Epigenetics and Potential Applications. Adv. Nutr. 2019, 10, S17–S30. [Google Scholar] [CrossRef]
- Zhao, L. The gut microbiota and obesity: From correlation to causality. Nat. Rev. Microbiol. 2013, 11, 639–647. [Google Scholar] [CrossRef]
- Zhang, T.; Ji, X.; Lu, G.; Zhang, F. The potential of Akkermansia muciniphila in inflammatory bowel disease. Appl. Microbiol. Biotechnol. 2021, 105, 5785–5794. [Google Scholar] [CrossRef]
- Gurung, M.; Li, Z.; You, H.; Rodrigues, R.; Jump, D.B.; Morgun, A.; Shulzhenko, N. Role of gut microbiota in type 2 diabetes pathophysiology. EBioMedicine 2020, 51, 102590. [Google Scholar] [CrossRef]
- Hansen, C.H.; Krych, L.; Buschard, K.; Metzdorff, S.B.; Nellemann, C.; Hansen, L.H.; Nielsen, D.S.; Frokiaer, H.; Skov, S.; Hansen, A.K. A maternal gluten-free diet reduces inflammation and diabetes incidence in the offspring of NOD mice. Diabetes 2014, 63, 2821–2832. [Google Scholar] [CrossRef] [PubMed]
- Roopchand, D.E.; Carmody, R.N.; Kuhn, P.; Moskal, K.; Rojas-Silva, P.; Turnbaugh, P.J.; Raskin, I. Dietary Polyphenols Promote Growth of the Gut Bacterium Akkermansia muciniphila and Attenuate High-Fat Diet-Induced Metabolic Syndrome. Diabetes 2015, 64, 2847–2858. [Google Scholar] [CrossRef] [PubMed]
- Shin, N.R.; Lee, J.C.; Lee, H.Y.; Kim, M.S.; Whon, T.W.; Lee, M.S.; Bae, J.W. An increase in the Akkermansia spp. population induced by metformin treatment improves glucose homeostasis in diet-induced obese mice. Gut 2014, 63, 727–735. [Google Scholar] [CrossRef] [PubMed]
- Bian, X.; Wu, W.; Yang, L.; Lv, L.; Wang, Q.; Li, Y.; Ye, J.; Fang, D.; Wu, J.; Jiang, X.; et al. Administration of Akkermansia muciniphila Ameliorates Dextran Sulfate Sodium-Induced Ulcerative Colitis in Mice. Front. Microbiol. 2019, 10, 2259. [Google Scholar] [CrossRef]
- Derrien, M.; Vaughan, E.E.; Plugge, C.M.; de Vos, W.M. Akkermansia muciniphila gen. nov., sp. nov., a human intestinal mucin-degrading bacterium. Int. J. Syst. Evol. Microbiol. 2004, 54, 1469–1476. [Google Scholar] [CrossRef]
- Yan, W.; Sun, C.; Yuan, J.; Yang, N. Gut metagenomic analysis reveals prominent roles of Lactobacillus and cecal microbiota in chicken feed efficiency. Sci. Rep. 2017, 7, 45308. [Google Scholar] [CrossRef]
- Stojanov, S.; Berlec, A.; Strukelj, B. The Influence of Probiotics on the Firmicutes/Bacteroidetes Ratio in the Treatment of Obesity and Inflammatory Bowel disease. Microorganisms 2020, 8, 1715. [Google Scholar] [CrossRef]
- Koh, A.; De Vadder, F.; Kovatcheva-Datchary, P.; Backhed, F. From Dietary Fiber to Host Physiology: Short-Chain Fatty Acids as Key Bacterial Metabolites. Cell 2016, 165, 1332–1345. [Google Scholar] [CrossRef]
- Madsen, K.L.; Doyle, J.S.; Jewell, L.D.; Tavernini, M.M.; Fedorak, R.N. Lactobacillus species prevents colitis in interleukin 10 gene-deficient mice. Gastroenterology 1999, 116, 1107–1114. [Google Scholar] [CrossRef]
- Herrmann, E.; Young, W.; Rosendale, D.; Conrad, R.; Riedel, C.U.; Egert, M. Determination of Resistant Starch Assimilating Bacteria in Fecal Samples of Mice by In vitro RNA-Based Stable Isotope Probing. Front. Microbiol. 2017, 8, 1331. [Google Scholar] [CrossRef] [PubMed]
- Endo, H.; Niioka, M.; Kobayashi, N.; Tanaka, M.; Watanabe, T. Butyrate-producing probiotics reduce nonalcoholic fatty liver disease progression in rats: New insight into the probiotics for the gut-liver axis. PLoS ONE 2013, 8, e63388. [Google Scholar] [CrossRef] [PubMed]


Publisher’s Note: MDPI stays neutral with regard to jurisdictional claims in published maps and institutional affiliations. |
© 2022 by the authors. Licensee MDPI, Basel, Switzerland. This article is an open access article distributed under the terms and conditions of the Creative Commons Attribution (CC BY) license (https://creativecommons.org/licenses/by/4.0/).
Share and Cite
Ren, Z.; Fan, H.; Gu, S.; Liu, H.; Wu, Z.; Wang, H.; Bao, W.; Wu, S. Expression Analysis and the Roles of the Sec1 Gene in Regulating the Composition of Mouse Gut Microbiota. Genes 2022, 13, 1858. https://doi.org/10.3390/genes13101858
Ren Z, Fan H, Gu S, Liu H, Wu Z, Wang H, Bao W, Wu S. Expression Analysis and the Roles of the Sec1 Gene in Regulating the Composition of Mouse Gut Microbiota. Genes. 2022; 13(10):1858. https://doi.org/10.3390/genes13101858
Chicago/Turabian StyleRen, Zhanshi, Hairui Fan, Shanshen Gu, Haoyu Liu, Zhengchang Wu, Haifei Wang, Wenbin Bao, and Shenglong Wu. 2022. "Expression Analysis and the Roles of the Sec1 Gene in Regulating the Composition of Mouse Gut Microbiota" Genes 13, no. 10: 1858. https://doi.org/10.3390/genes13101858
APA StyleRen, Z., Fan, H., Gu, S., Liu, H., Wu, Z., Wang, H., Bao, W., & Wu, S. (2022). Expression Analysis and the Roles of the Sec1 Gene in Regulating the Composition of Mouse Gut Microbiota. Genes, 13(10), 1858. https://doi.org/10.3390/genes13101858