Article

Metformin Triggers Apoptosis and Induction of the G0/G1 Switch 2 Gene in Macrophages

1
Institute of Epigenetics and Epigenomics, College of Animal Science and Technology, Yangzhou University, Yangzhou 225009, China
2
Department of Animal Science, McGill University, Montréal, QC H3A 0G4, Canada
3
Department of Pharmacy, Suzhou Vocational Health College, Suzhou 215009, China
4
Joint International Research Laboratory of Agricultural & Agri-Product Safety, Ministry of Education of China, Yangzhou University, Yangzhou 225009, China
5
Jiangsu Co-Innovation Center for Prevention & Control of Important Animal Infectious Diseases & Zoonoses, Yangzhou 225009, China
*
Authors to whom correspondence should be addressed.
Genes 2021, 12(9), 1437; https://doi.org/10.3390/genes12091437
Submission received: 17 August 2021 / Revised: 14 September 2021 / Accepted: 16 September 2021 / Published: 17 September 2021
(This article belongs to the Section Animal Genetics and Genomics)

Abstract

:
Metformin is a widely used antidiabetic drug for the treatment of type 2 diabetes and has been recently demonstrated to possess anti-inflammatory properties via AMPK-mediated modulation of M2 macrophage activation. However, the anti-inflammatory mechanisms of metformin on inflammatory macrophages are still not fully elucidated. In this study, we found that metformin induced apoptosis in macrophages. In particular, metformin induced apoptosis of M1 macrophages, based on M1 marker genes in apoptotic macrophages. Next, we comprehensively screened metformin-responsive genes in macrophages by RNA-seq and focused on the extrinsic apoptotic signaling pathway. The G0/G1 switch 2 gene (G0S2) was robustly up-regulated by metformin in macrophages. Overexpression of G0S2 significantly induced apoptosis of macrophages in a dose-dependent manner and blunted the function of the crucial anti-apoptotic gene Bcl-2, which was significantly reduced by metformin. These findings show that metformin promoted apoptosis of macrophages, especially M1 macrophages, via G0S2 induction and provides a novel anti-inflammatory mechanism of metformin through induction of macrophage apoptosis.

1. Introduction

Macrophages have a defensive function against pathogens such as microbes and play an important role in homeostatic maintenance of the body through disposal of internal waste materials and tissue repair [1,2]. To perform these functions, macrophages modify their own metabolism and phenotypes. Phenotypically polarized macrophages are now generally recognized as pro-inflammatory “classically” activated M1 macrophages and “alternatively” activated M2 macrophages [3]. M1 macrophages exhibit a pro-inflammatory response, with high production of pro-inflammatory cytokines (IL-1β, IL-6 and TNF-α), and are implicated in initiating and sustaining inflammation. On the other hand, M2 macrophages possess anti-inflammatory properties and are involved in tissue homoeostasis.
Metformin has anticancer [4,5] and pro-longevity [6,7,8] effects in addition to its antidiabetic effect. However, its antidiabetic mechanism remains elusive. Metformin is thought to exert its primary antidiabetic action through suppression of hepatic glucose production. Subsequently, the primary mechanism of action has been suggested to be the inhibition of mitochondrial complex I [9,10]. Metformin is also reported to activate AMP-activated protein kinase (AMPK) through inhibition of mitochondrial complex I [10]. However, several studies have refuted the hypothesis of a direct action of metformin on complex I [11,12,13].
Emerging evidence suggests that metformin could modulate the functions of immune cells, especially macrophages. It has been recently demonstrated that metformin enhanced the anti-inflammatory properties of macrophages via AMPK-mediated modulation of M2 macrophage activation [14,15,16,17,18]. Alternatively, the anti-inflammatory mechanisms of metformin could be achieved by reducing the pro-inflammatory macrophages. Recently, several studies suggested that several anti-inflammatory drugs (such as curcumin and luteolin) were involved in regulation of macrophage activation via apoptosis of pro-inflammatory macrophages [19,20,21]. Apoptosis of pro-inflammatory macrophages promoted macrophage clearance and resolved inflammation [22]. Thus, we hypothesized that metformin could attenuate inflammatory responses by inducing apoptosis of pro-inflammatory macrophages.
The purpose of this study was to investigate the effect of metformin treatment on macrophage apoptosis and explore its underlying mechanism. Our results show that metformin promoted apoptosis of macrophages via G0S2 induction. In particular, metformin induced apoptosis of M1 macrophages, based on M1 marker genes in apoptotic macrophages. The results from this study have revealed the anti-inflammatory properties of metformin by possibly inducing apoptosis of inflammatory M1 macrophages, and provide a novel anti-inflammatory mechanism of metformin on M1 macrophages via induction of apoptosis.

2. Materials and Methods

2.1. Cell Culture and Metformin Treatment

The chicken HD11 macrophage cell line and mouse macrophage RAW264.7 cells were used for this study. HD11 cells were seeded into 6-well plates in Dulbecco’s modified Eagle’s medium (DMEM; Gibco, Waltham, MA, USA) with 10% fetal bovine serum (FBS) and cultured at 41 °C in 5% CO2 and 95% humidity, then treated with 1 mM, 5 mM and 25 mM metformin for 48 h. RAW264.7 cells were seeded into 6-well plates in DMEM with 10% FBS and cultured at 37 °C in 5% CO2 and 95% humidity, then treated with 1 mM and 5 mM metformin for 48 h.

2.2. Plasmids and Constructs

Full-length sequences of G0S2 were amplified from HD11 cDNAs with the following primers: forward primer 5′-CCCAAGCTTATGGAAACCATGCACG AGC-3′ and reverse primer 5′-CGCGGATCCTTAGGATGCATGCTGCCTG-3′, and then cloned into the eukaryotic expression vector pcDNA3.1.

2.3. DNA Transfection

HD11 cells and mouse macrophage RAW264.7 cells were plated on 6-well plates and transfected with pcDNA3.1-G0S2 or pcDNA3.1-EGFP expression plasmids using the Xfect™ Transfection Reagent (Takara, Japan) according to the manufacturer’s instructions. After 48 h transfection, cells were collected for RNA and protein analysis.

2.4. Cell Proliferation Assay

Cell viability was determined using the MTT assay following the manufacturer’s instructions (Beyotime, Shanghai, China). Briefly, 20 µL (50 mg/mL) MTT was added, and cells were incubated for an additional 2 h. The purple-blue MTT formazan precipitate was dissolved in DMSO. The activity of the mitochondria was evaluated by measuring the optical density at 570 nm. All MTT assays were performed in sextuplets and repeated in 3 independent experiments. CCK-8 assay was performed using the Cell Counting Kit-8 (Beyotime, China), following the manufacturer’s instructions.

2.5. Apoptotic DNA Ladder Detection

During apoptosis, activated nucleases degrade the higher order chromatin structure of DNA into fragments of 50 to 300 kilobases and subsequently into small DNA pieces of about 200 base pairs in length. These DNA fragments can be extracted from cells and easily visualized by agarose gel electrophoresis followed by ethidium bromide staining. Briefly, following treatment with metformin or DMSO for 48 h, cells were washed and the chromosomal DNA was extracted by the DNA Kit (AXYGEN, Union City, CA, USA). DNA fragmentation in apoptotic cells was detected by agarose gel electrophoresis.

2.6. Flow Cytometry

Apoptosis was analyzed by Annexin V Apoptosis Detection kit according to the manufacturer’s recommendations (BD Bioscience, East Rutherford, NJ, USA). FlowJo software (v. 10 TreeStar) was used for data analysis and graphic representation.

2.7. Library Construction for RNA-Seq

Total RNA was isolated from 1 mM metformin-treated chicken HD11 macrophages using the RNeasy mini kit (Qiagen, Hilden, Germany). Paired-end libraries were synthesized by using the TruSeq® RNA Sample Preparation Kit (Illumina, San Diego, CA, USA) following the TruSeq® RNA Sample Preparation Guide. Briefly, the poly-A containing mRNA molecules were purified using poly-T oligo-attached magnetic beads. Purified libraries were quantified by Qubit® 2.0 Fluorometer (Life Technologies, Carlsbad, CA, USA) and validated by Agilent 2100 bioanalyzer (Agilent Technologies, USA) to confirm the insert size and calculate the mole concentration. Clusters were generated by cBot with the library diluted to 10 pM and then were sequenced on the Illumina HiSeq X-ten (Illumina, USA). The library construction and sequencing were performed at Shanghai Biotechnology Corporation.

2.8. Data Analysis for Gene Expression

Sequencing raw reads were pre-processed by filtering out rRNA reads, sequencing adapters, short-fragment reads and other low-quality reads. We used Hisat2 (version 2.0.4) [23] to map the cleaned reads to the chicken reference genome with 2 mismatches. After genome mapping, Stringtie (version 1.3.0) [24,25] was run with a reference annotation to generate FPKM values for known gene models. Differentially expressed genes were identified using edgeR [26]. The p-value significance threshold in multiple tests was set by the false discovery rate (FDR). The fold changes were also estimated according to the FPKM in each sample. The differentially expressed genes were selected using the following filter criteria: FDR ≤ 0.05 and fold change ≥2.

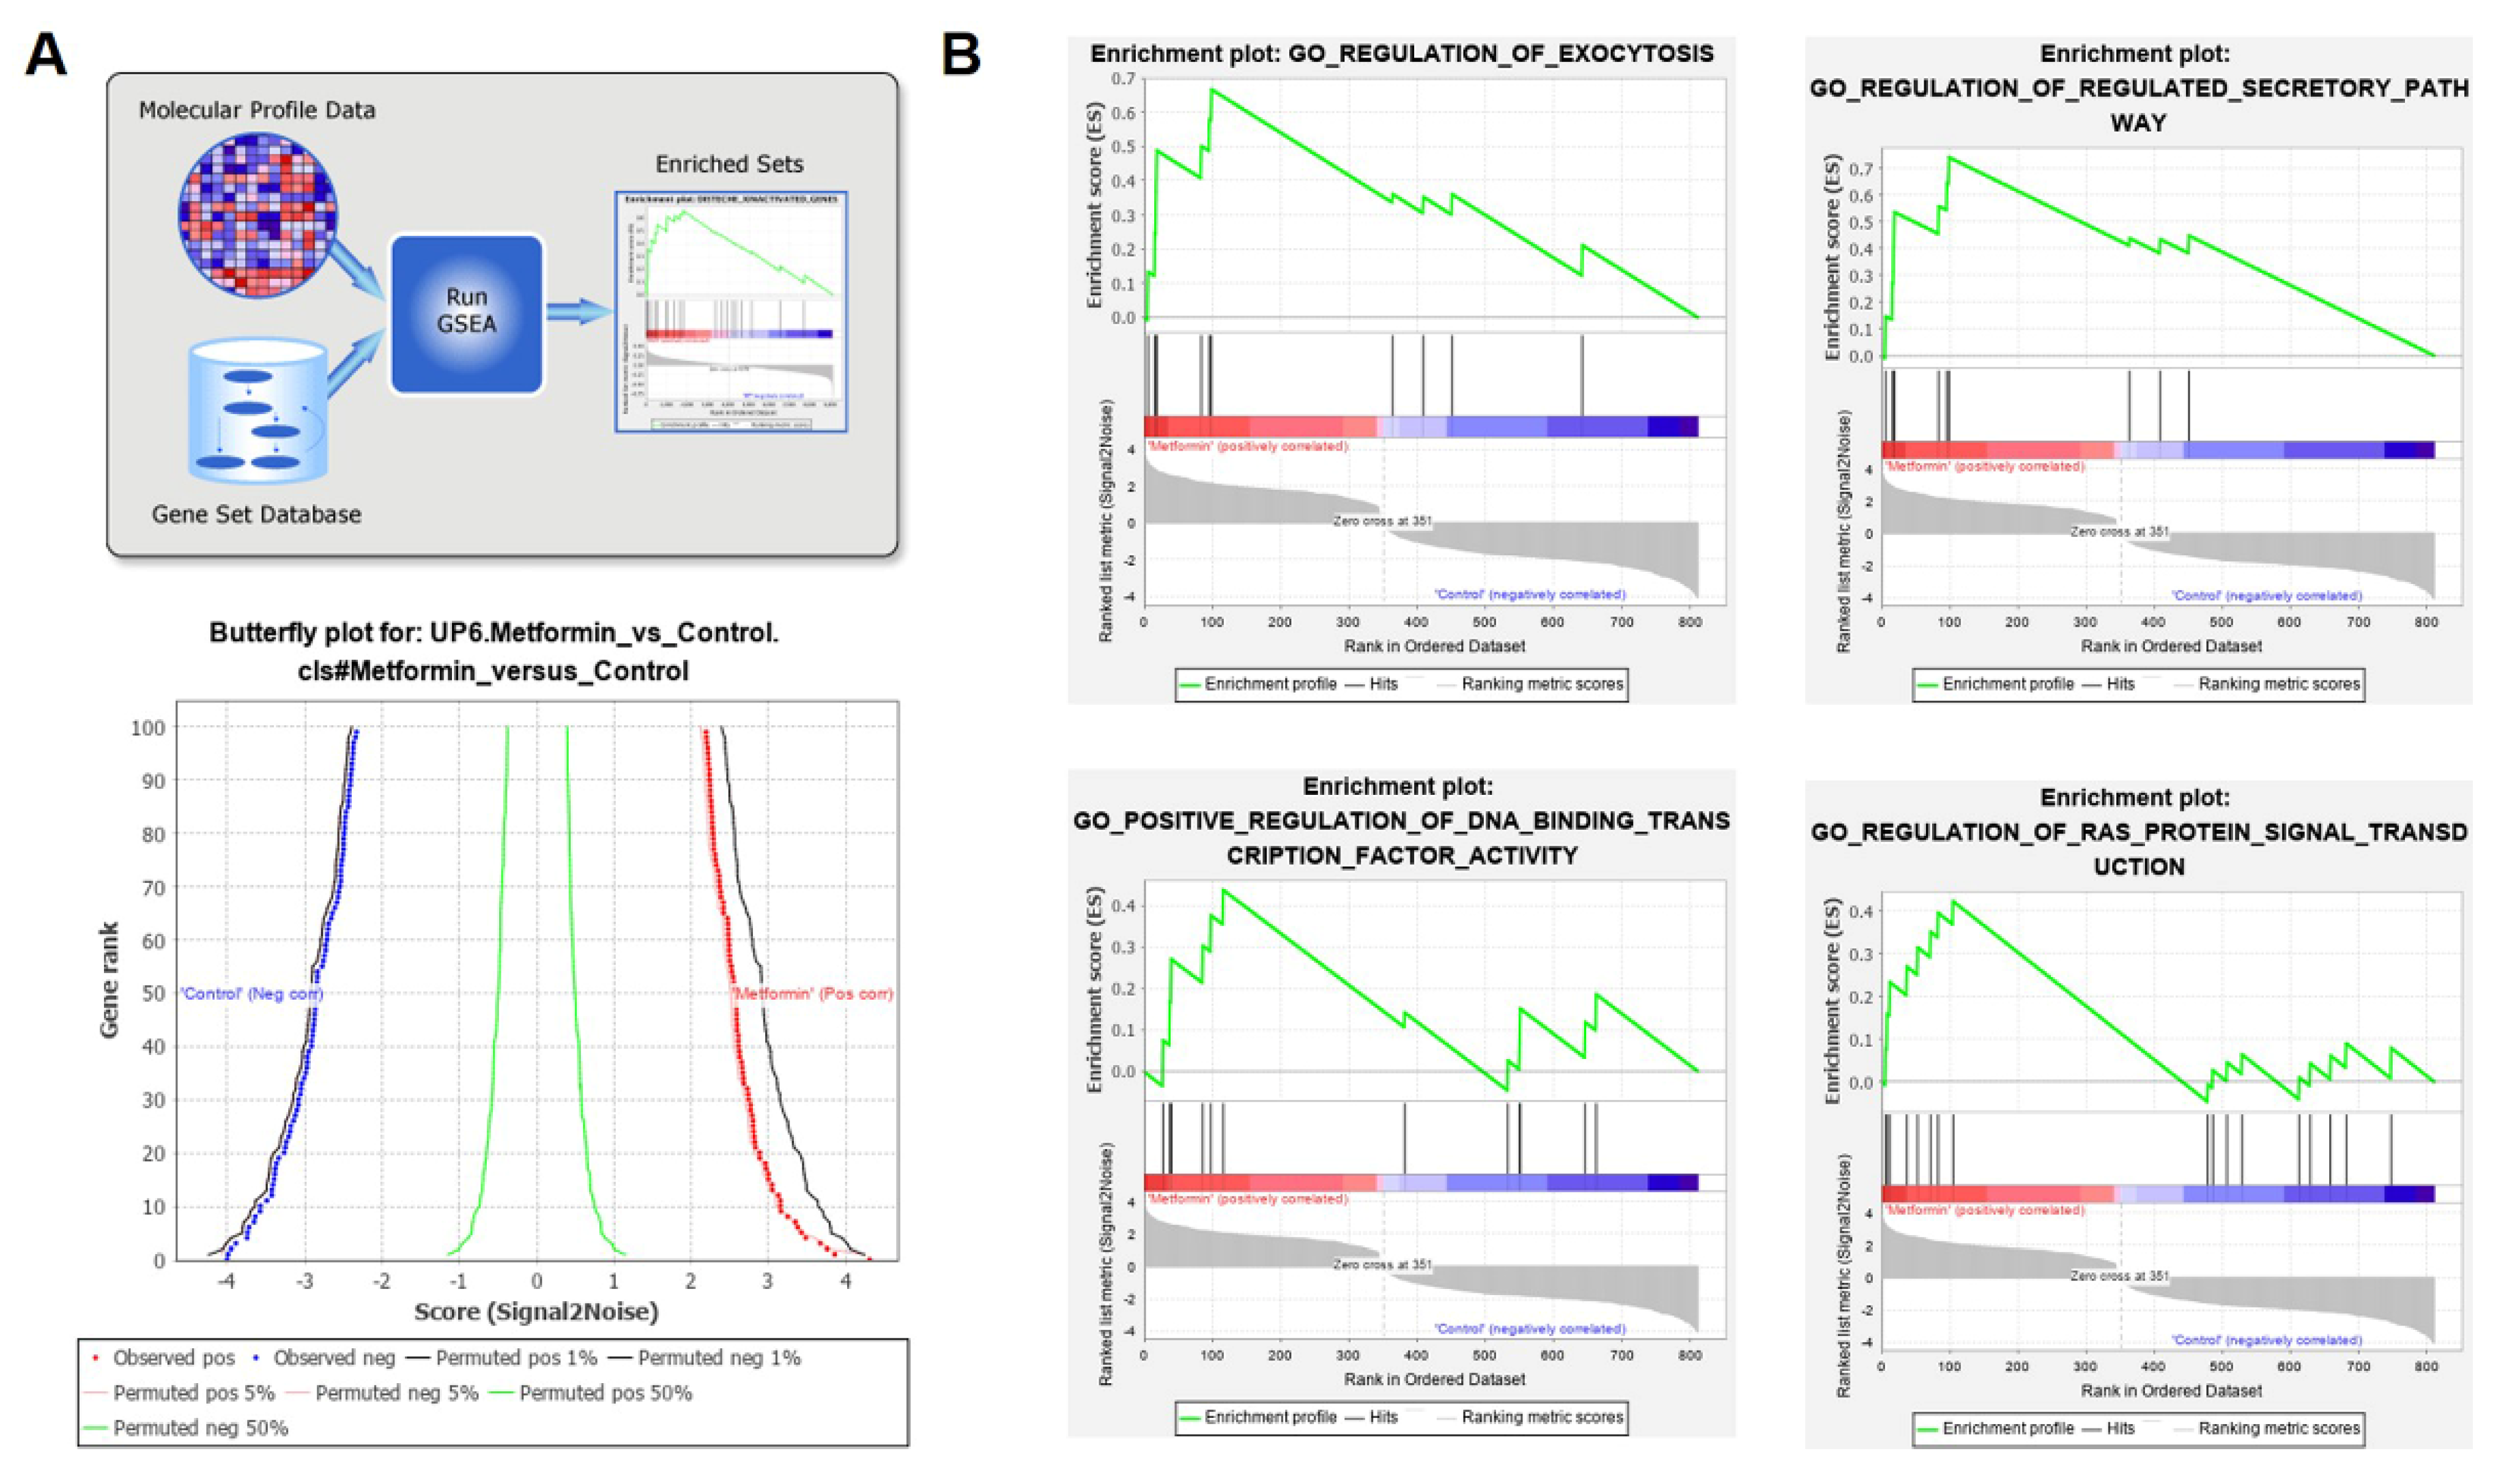
2.9. Gene Set Enrichment Analysis (GSEA)

Gene set enrichment analysis was performed by the GSEA software (version 4.0.3) using the different expression genes in metformin-treated macrophages. GSEA is a computational method that determines whether an a priori defined set of genes shows statistically significant, concordant differences between two biological states (e.g., phenotypes) [27,28].

2.10. Reverse Transcription and Quantitative PCR

Total RNA was first removed from the genomic DNA and then reverse-transcribed using the PrimeScript RT reagent Kit with gDNA Eraser (Takara, Japan) following the manufacturer’s instructions. The gDNA Eraser-treated RNA samples were reverse-transcribed with the RT mix primer at 37 °C for 15 min by PrimeScript® Reverse Transcriptase (Takara, Japan). The quantitative PCR (qPCR) was performed with gene-specific primers and SYBR Green Master Mix (Takara, Japan) on the CFX Connect™ Real-Time PCR Detection System (Bio-Rad, Hercules, CA, USA); primers are listed in Table 1. GAPDH and β-Actin RNA levels were used as internal controls to normalize gene expression.

2.11. Statistical Analyses

The statistical analysis was performed using the Statistical Product and Service Solutions (version 16.0) software. Statistical significance was assessed using a two-tailed unpaired Student’s t-test with a p value threshold of <0.05.

3. Results

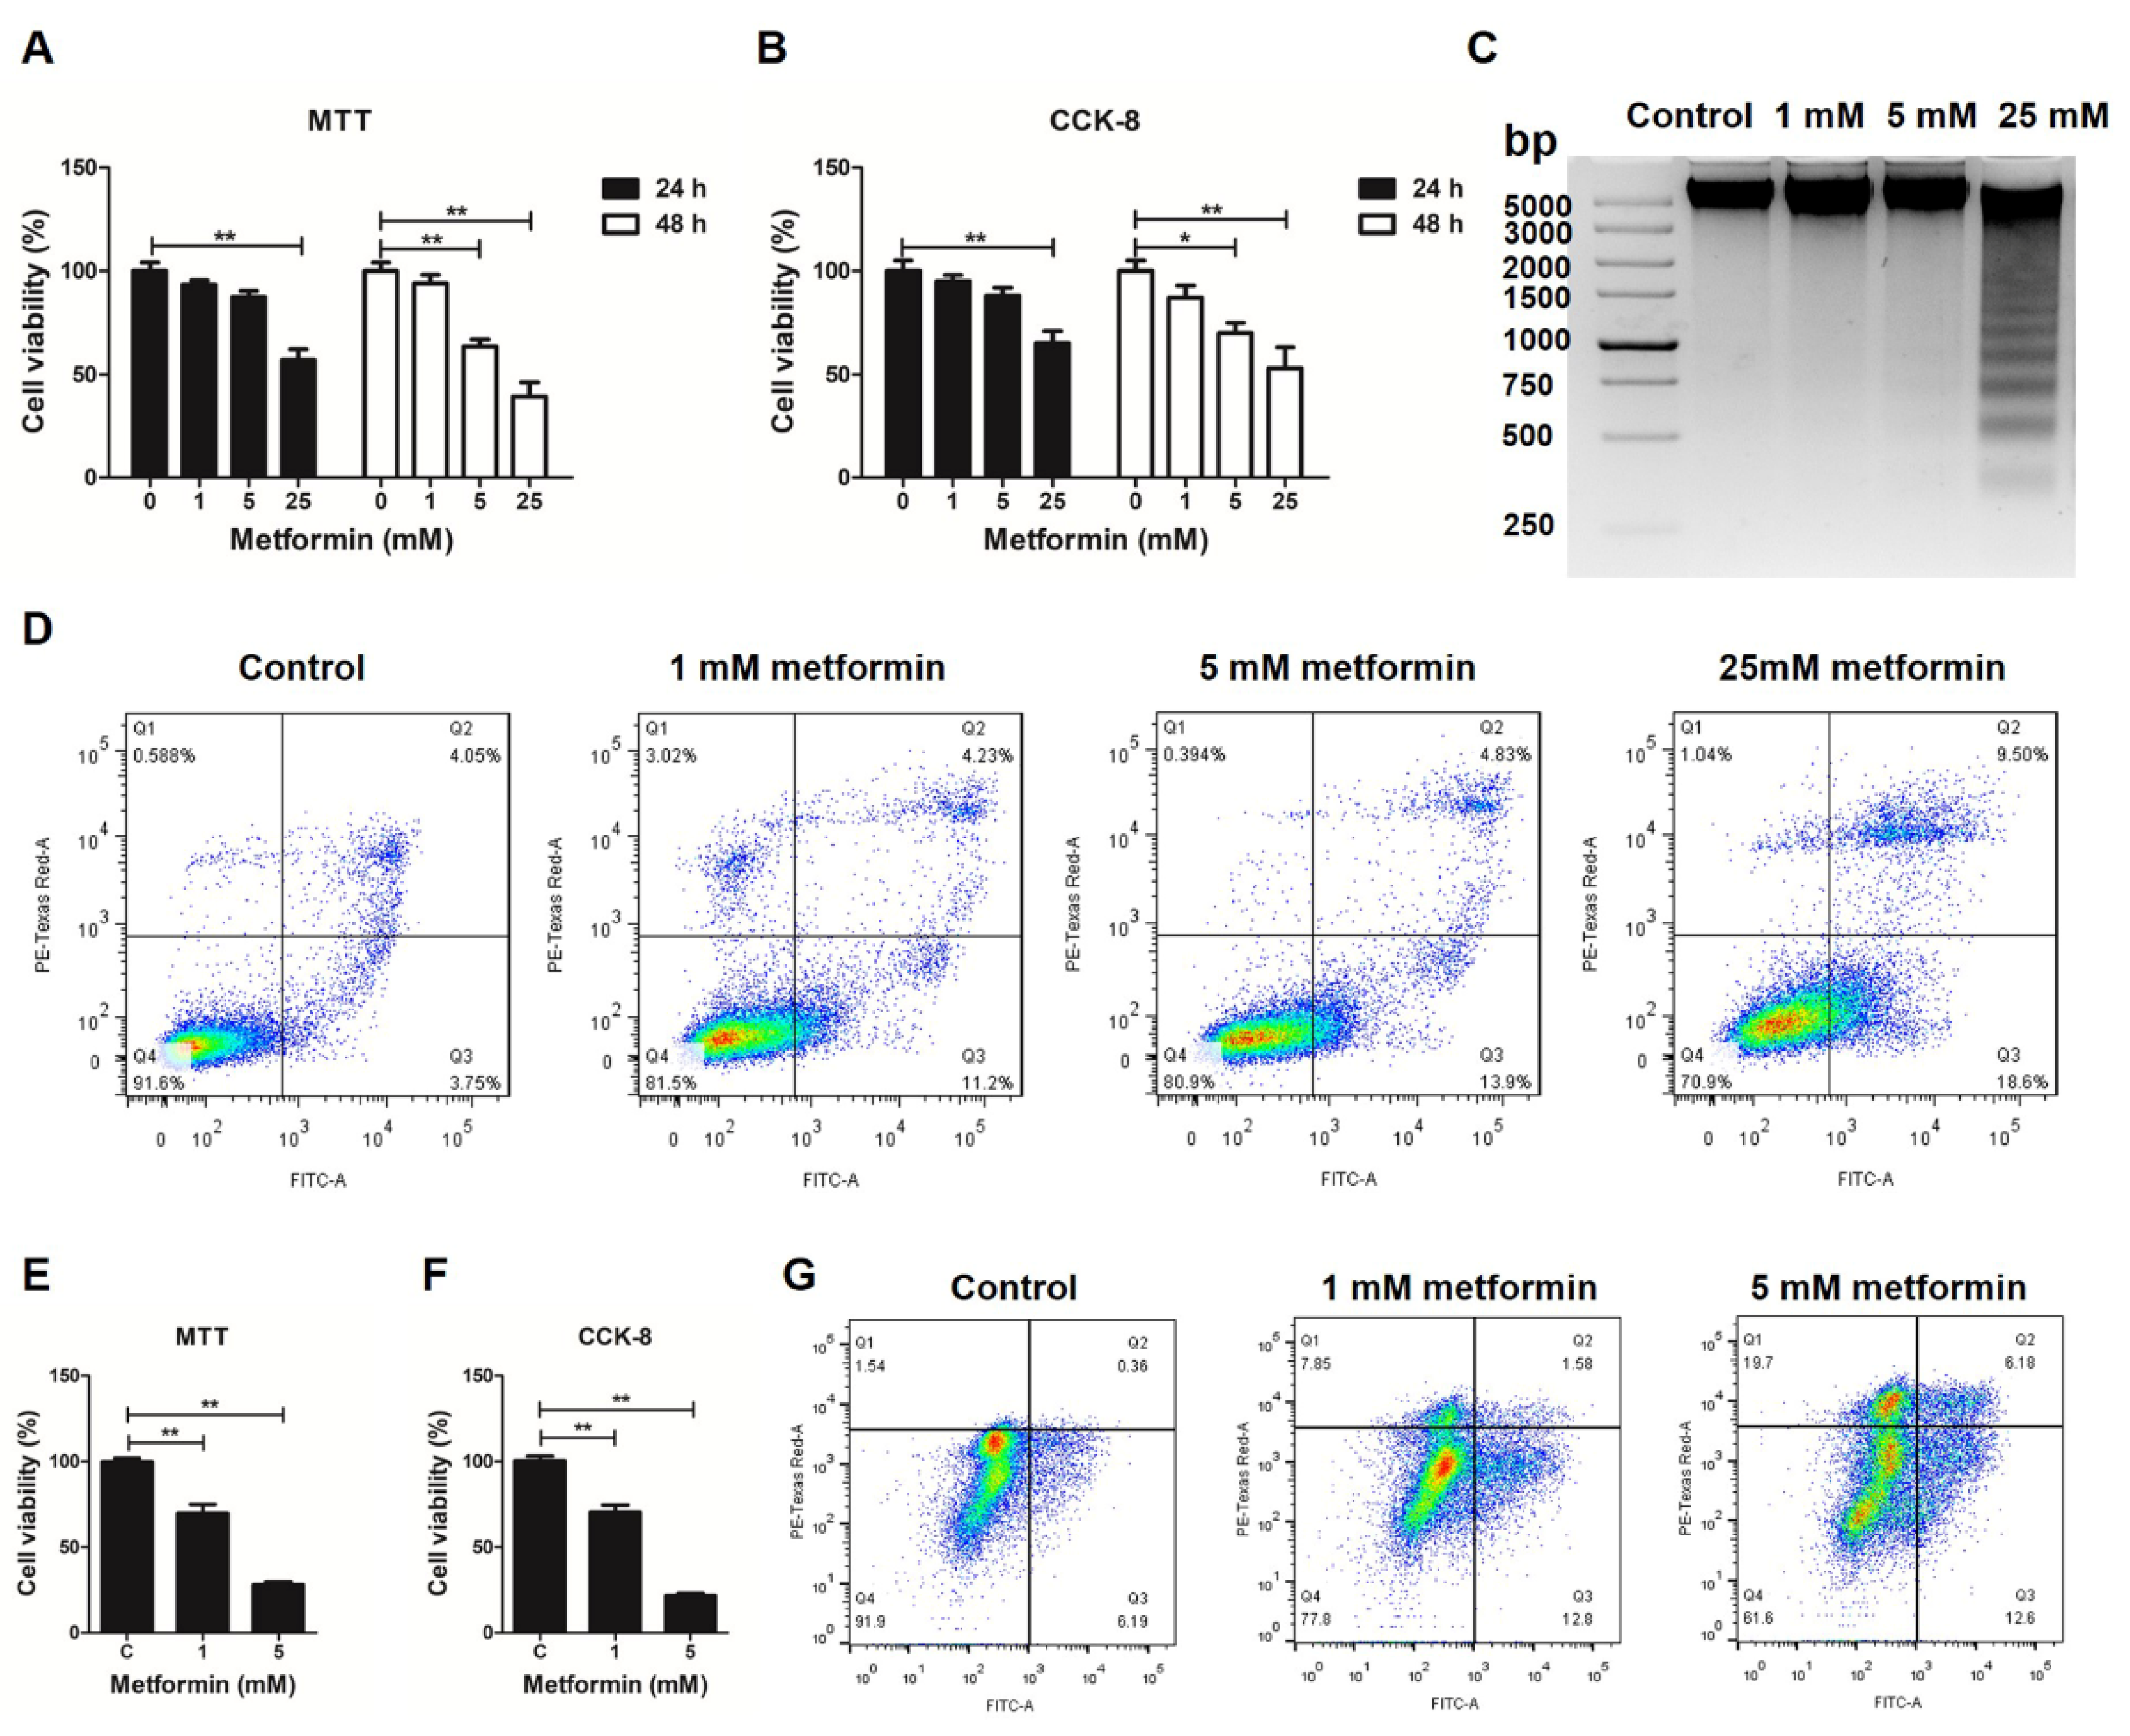
3.1. Metformin Induces Apoptosis in Macrophages

First, the effects of metformin on the proliferation/viability of chicken macrophages were measured by MTT (3-(4, 5-dimethylthiazolyl-2)-2, 5-diphenyltetrazolium bromide) and CCK-8 (Cell Counting Kit-8) assays. As shown in Figure 1A,B, metformin-treated chicken macrophages exhibited a lower cell viability rate compared to the control cells at 24 and 48 h. The formation of the DNA ladder in gel electrophoresis was obvious in 25 mM metformin-treated chicken macrophages (Figure 1C). The effect of metformin on apoptosis of chicken macrophages was further evaluated using flow cytometry based on propidium iodide (PI) and Annexin V-FITC staining. The percentages of apoptotic cells (Q2 and Q3 regions) were significantly increased in chicken macrophages treated with metformin at 5 mM and 25 mM (Figure 1D). Metformin also induces apoptosis in mouse macrophages. Compared to the control cells, metformin-treated mouse macrophages exhibited a lower cell viability rate at 48 h (Figure 1E,F), and the percentages of apoptotic cells were significantly increased in mouse macrophages treated with metformin at 1 mM and 5 mM (Figure 1G).

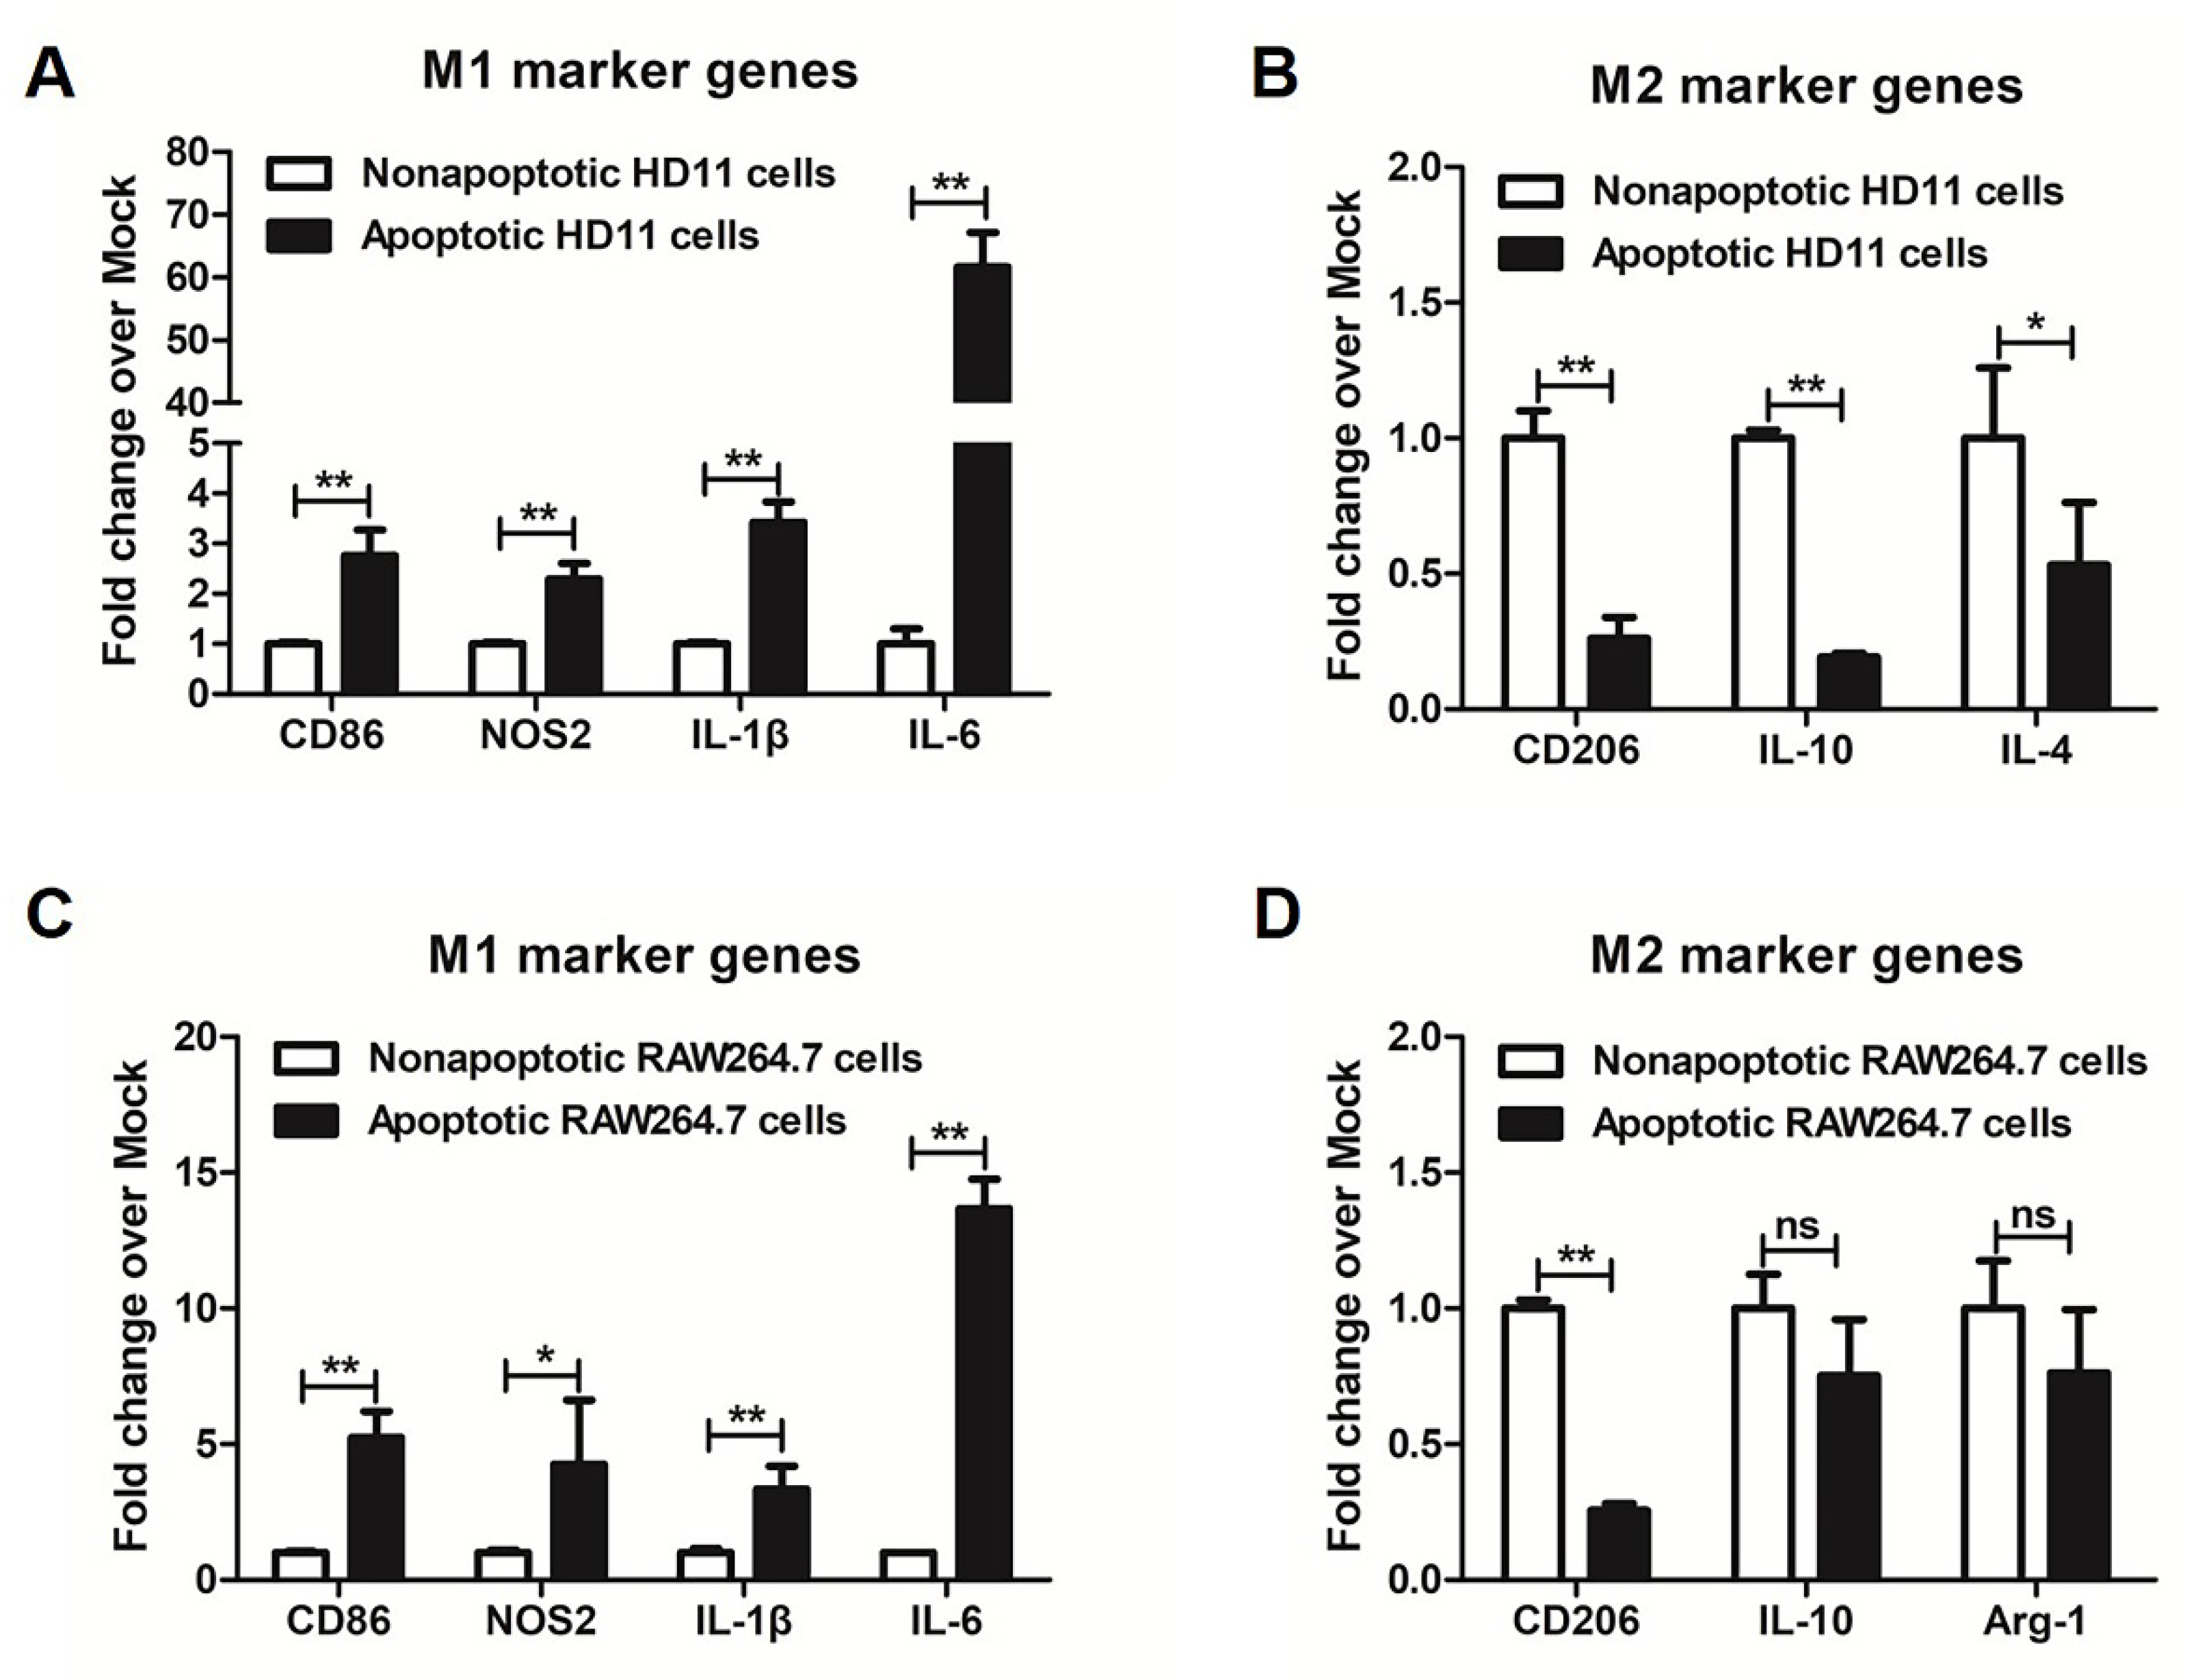
3.2. More M1 Marker Genes Were Detected in Metformin-Induced Apoptotic Macrophages

The apoptotic and nonapoptotic cells were further separated from metformin-treated macrophages to investigate whether metformin attenuated inflammatory responses by inducing apoptosis of pro-inflammatory macrophages (M1). In metformin-treated chicken macrophages, we found that M1 markers such as CD86, IL-6, IL-1β and NOS2 were higher in apoptotic macrophages compared to nonapoptotic cells (Figure 2A). However, metformin reduced M2 markers such as CD206, IL-4 and IL-10 in apoptotic macrophages (Figure 2B). In metformin-treated mouse macrophages, M1 markers such as CD86, IL-6, IL-1β and NOS2 in apoptotic macrophages were also higher (Figure 2C). On the contrary, expression of M2 markers such as CD206, Arg-1 and IL-10 were lower in apoptotic macrophages than in nonapoptotic cells (Figure 2D). These results indicated that metformin may attenuate inflammatory responses by inducing apoptosis of pro-inflammatory macrophages (M1).

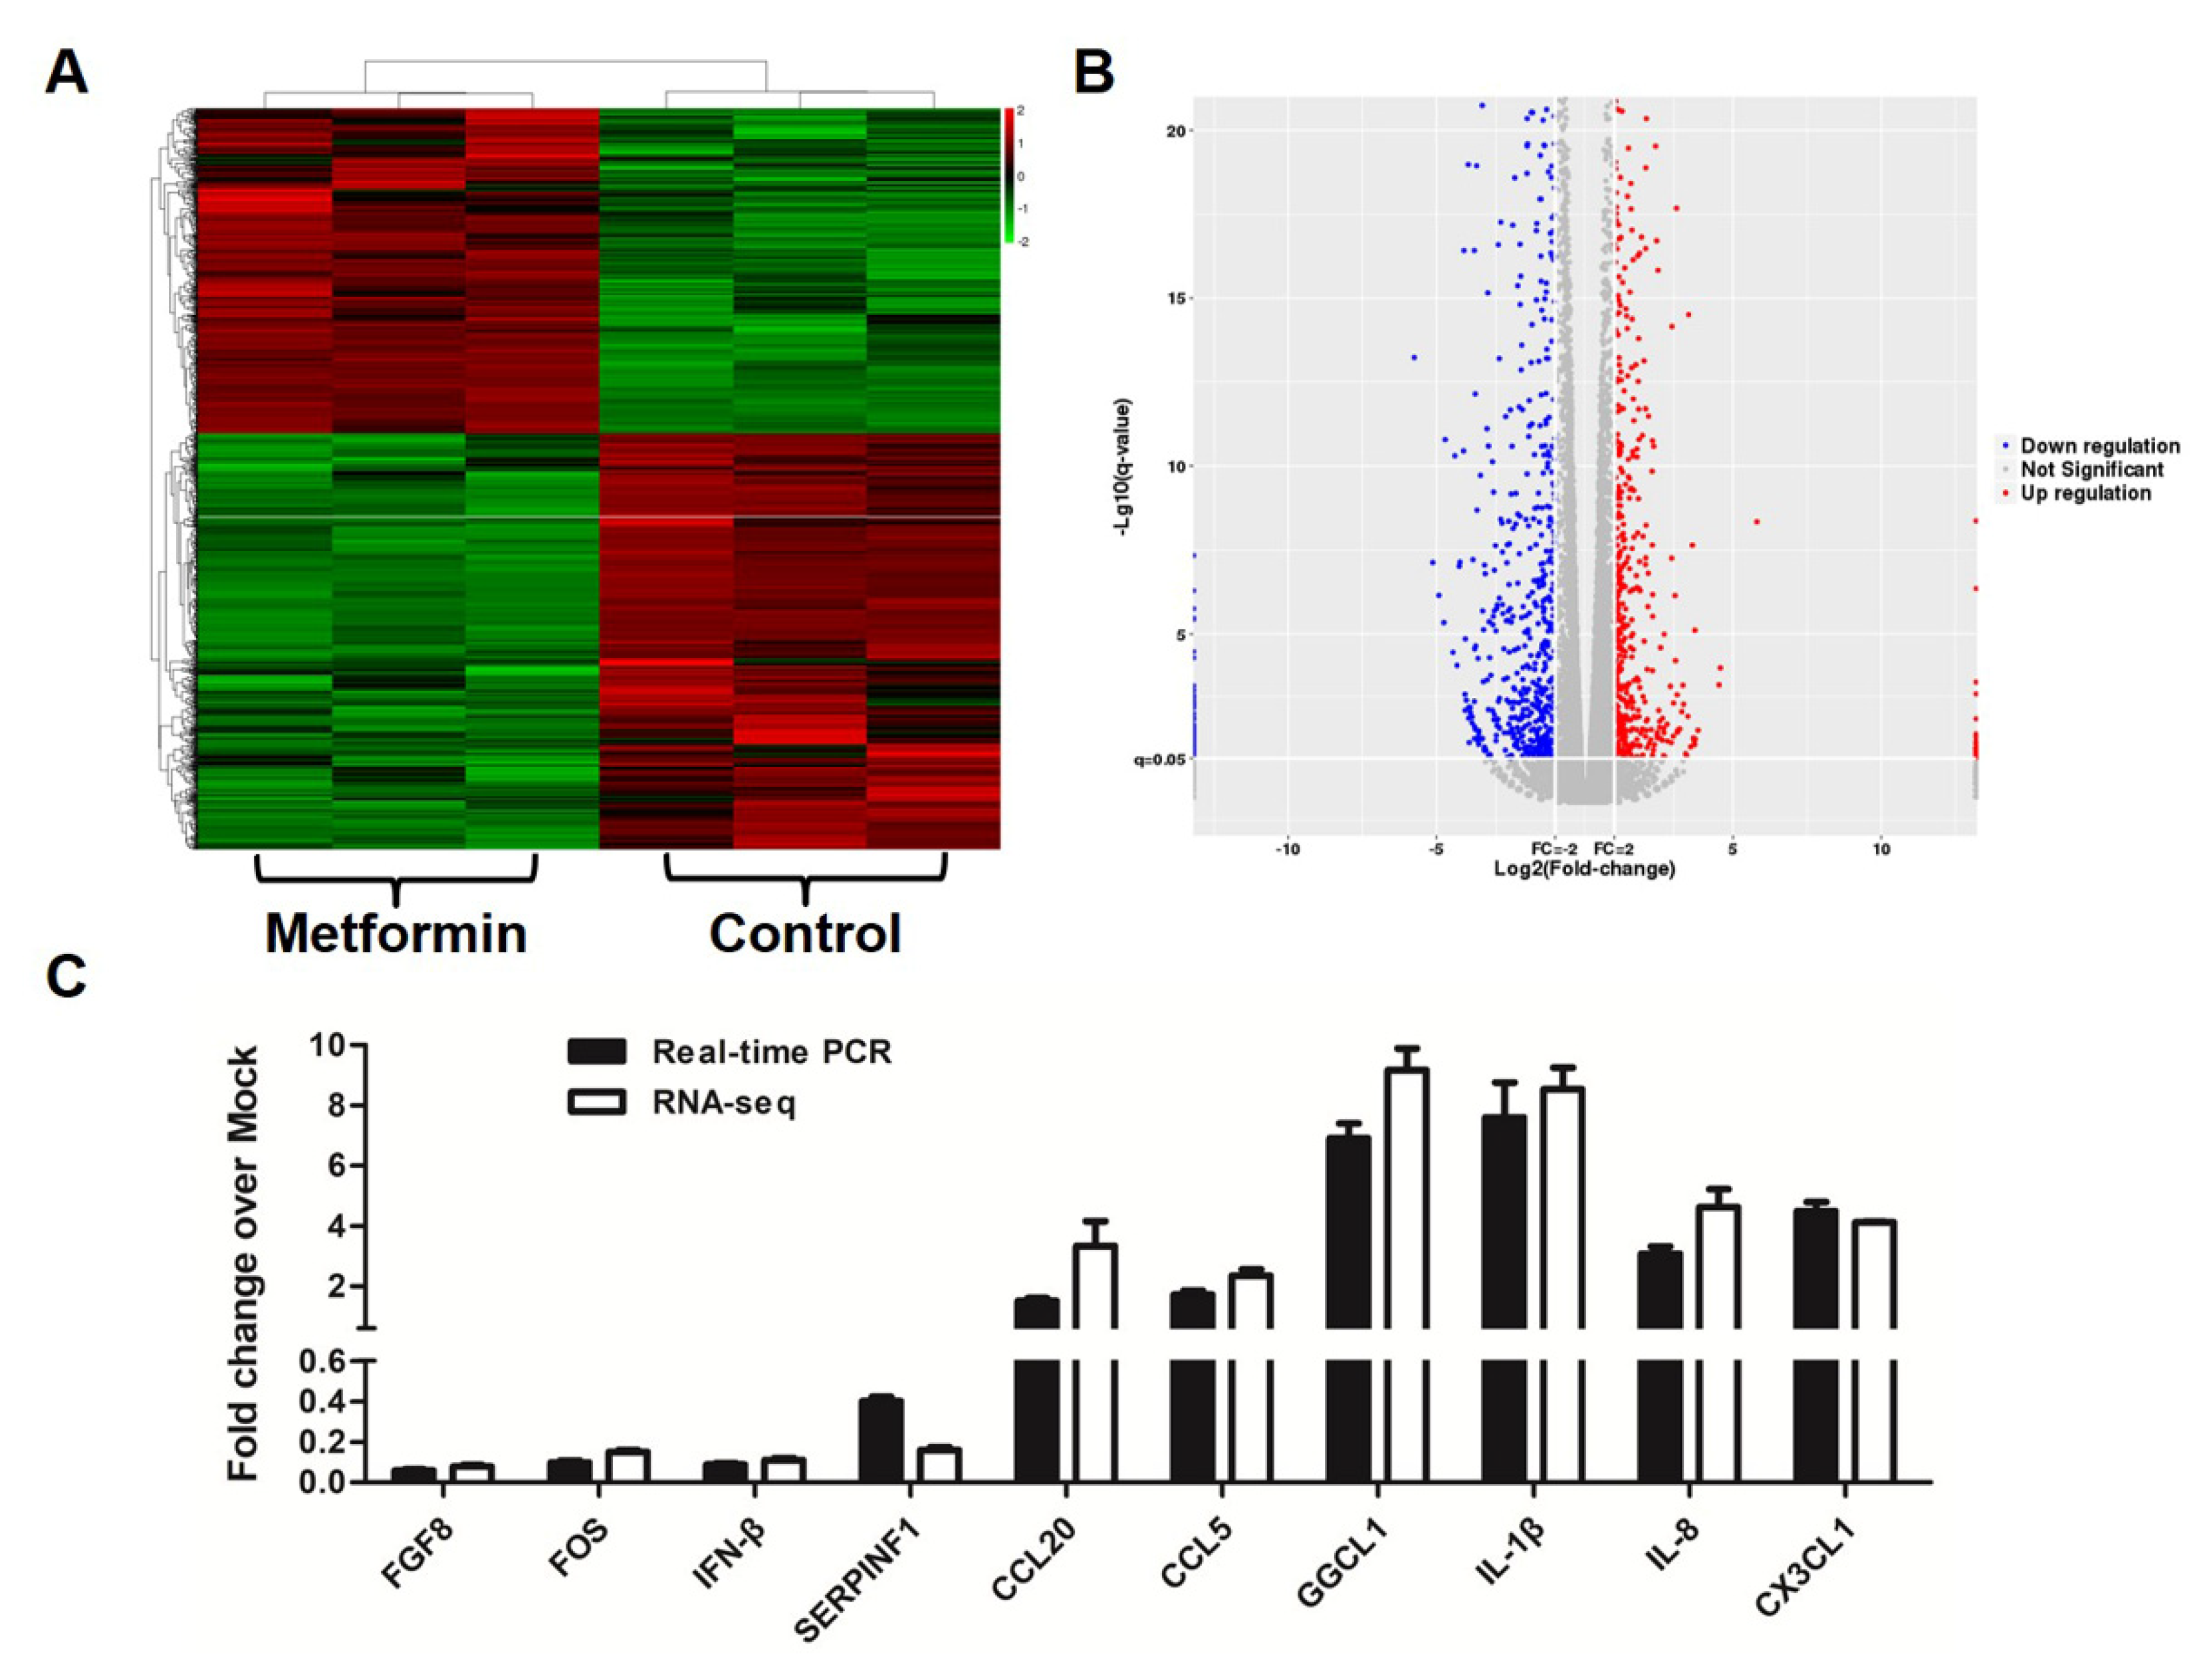
3.3. Metformin Affects Gene Expression Profiles in Macrophages

To investigate which gene changes underlie the observed effects of metformin on the survival rates of macrophages, the gene expression of 1 mM metformin-treated HD11 cells was profiled by RNA-Seq. A total of 1315 significantly differentially expressed genes (all of them FC > 2 and q-value < 0.05) were obtained from metformin-treated macrophages (as shown in Figure 3A and Supplementary File S1). Among them, 576 were upregulated and 739 downregulated (Figure 3B). We found that several interleukins (IL-1β and IL-8) and interleukin receptor genes (IL1r2, IL2rb, IL13ra1 and IL13ra2) and chemokine genes (Ccl5, Ccl20, Cx3cl1, Ccli9, Ccli7 and Ggcl1) were upregulated but several interferon genes and interferon-stimulated genes (Isgs), including Ifn-A, Ifn-B, Ifih1, Ifitm5 and Ifitm10 were downregulated. Metformin treatment also altered the expressions of cell growth related genes (including Tp73, Cdc23, Mcm3, Cpeb2, Adcy3 and Mapk10) and cell death related genes (including Rps6ka2, Fos, Bcl2, Tnfsf6 and Birc2) in macrophages. RNA-Seq data were validated by RT-qPCR analyses of 10 selected genes, including FGF8, FOS, IFN-β, SERPINF1, CCL20, CCL5, GGCL1, IL-1β, IL-8 and CX3CL1 (Figure 3C).

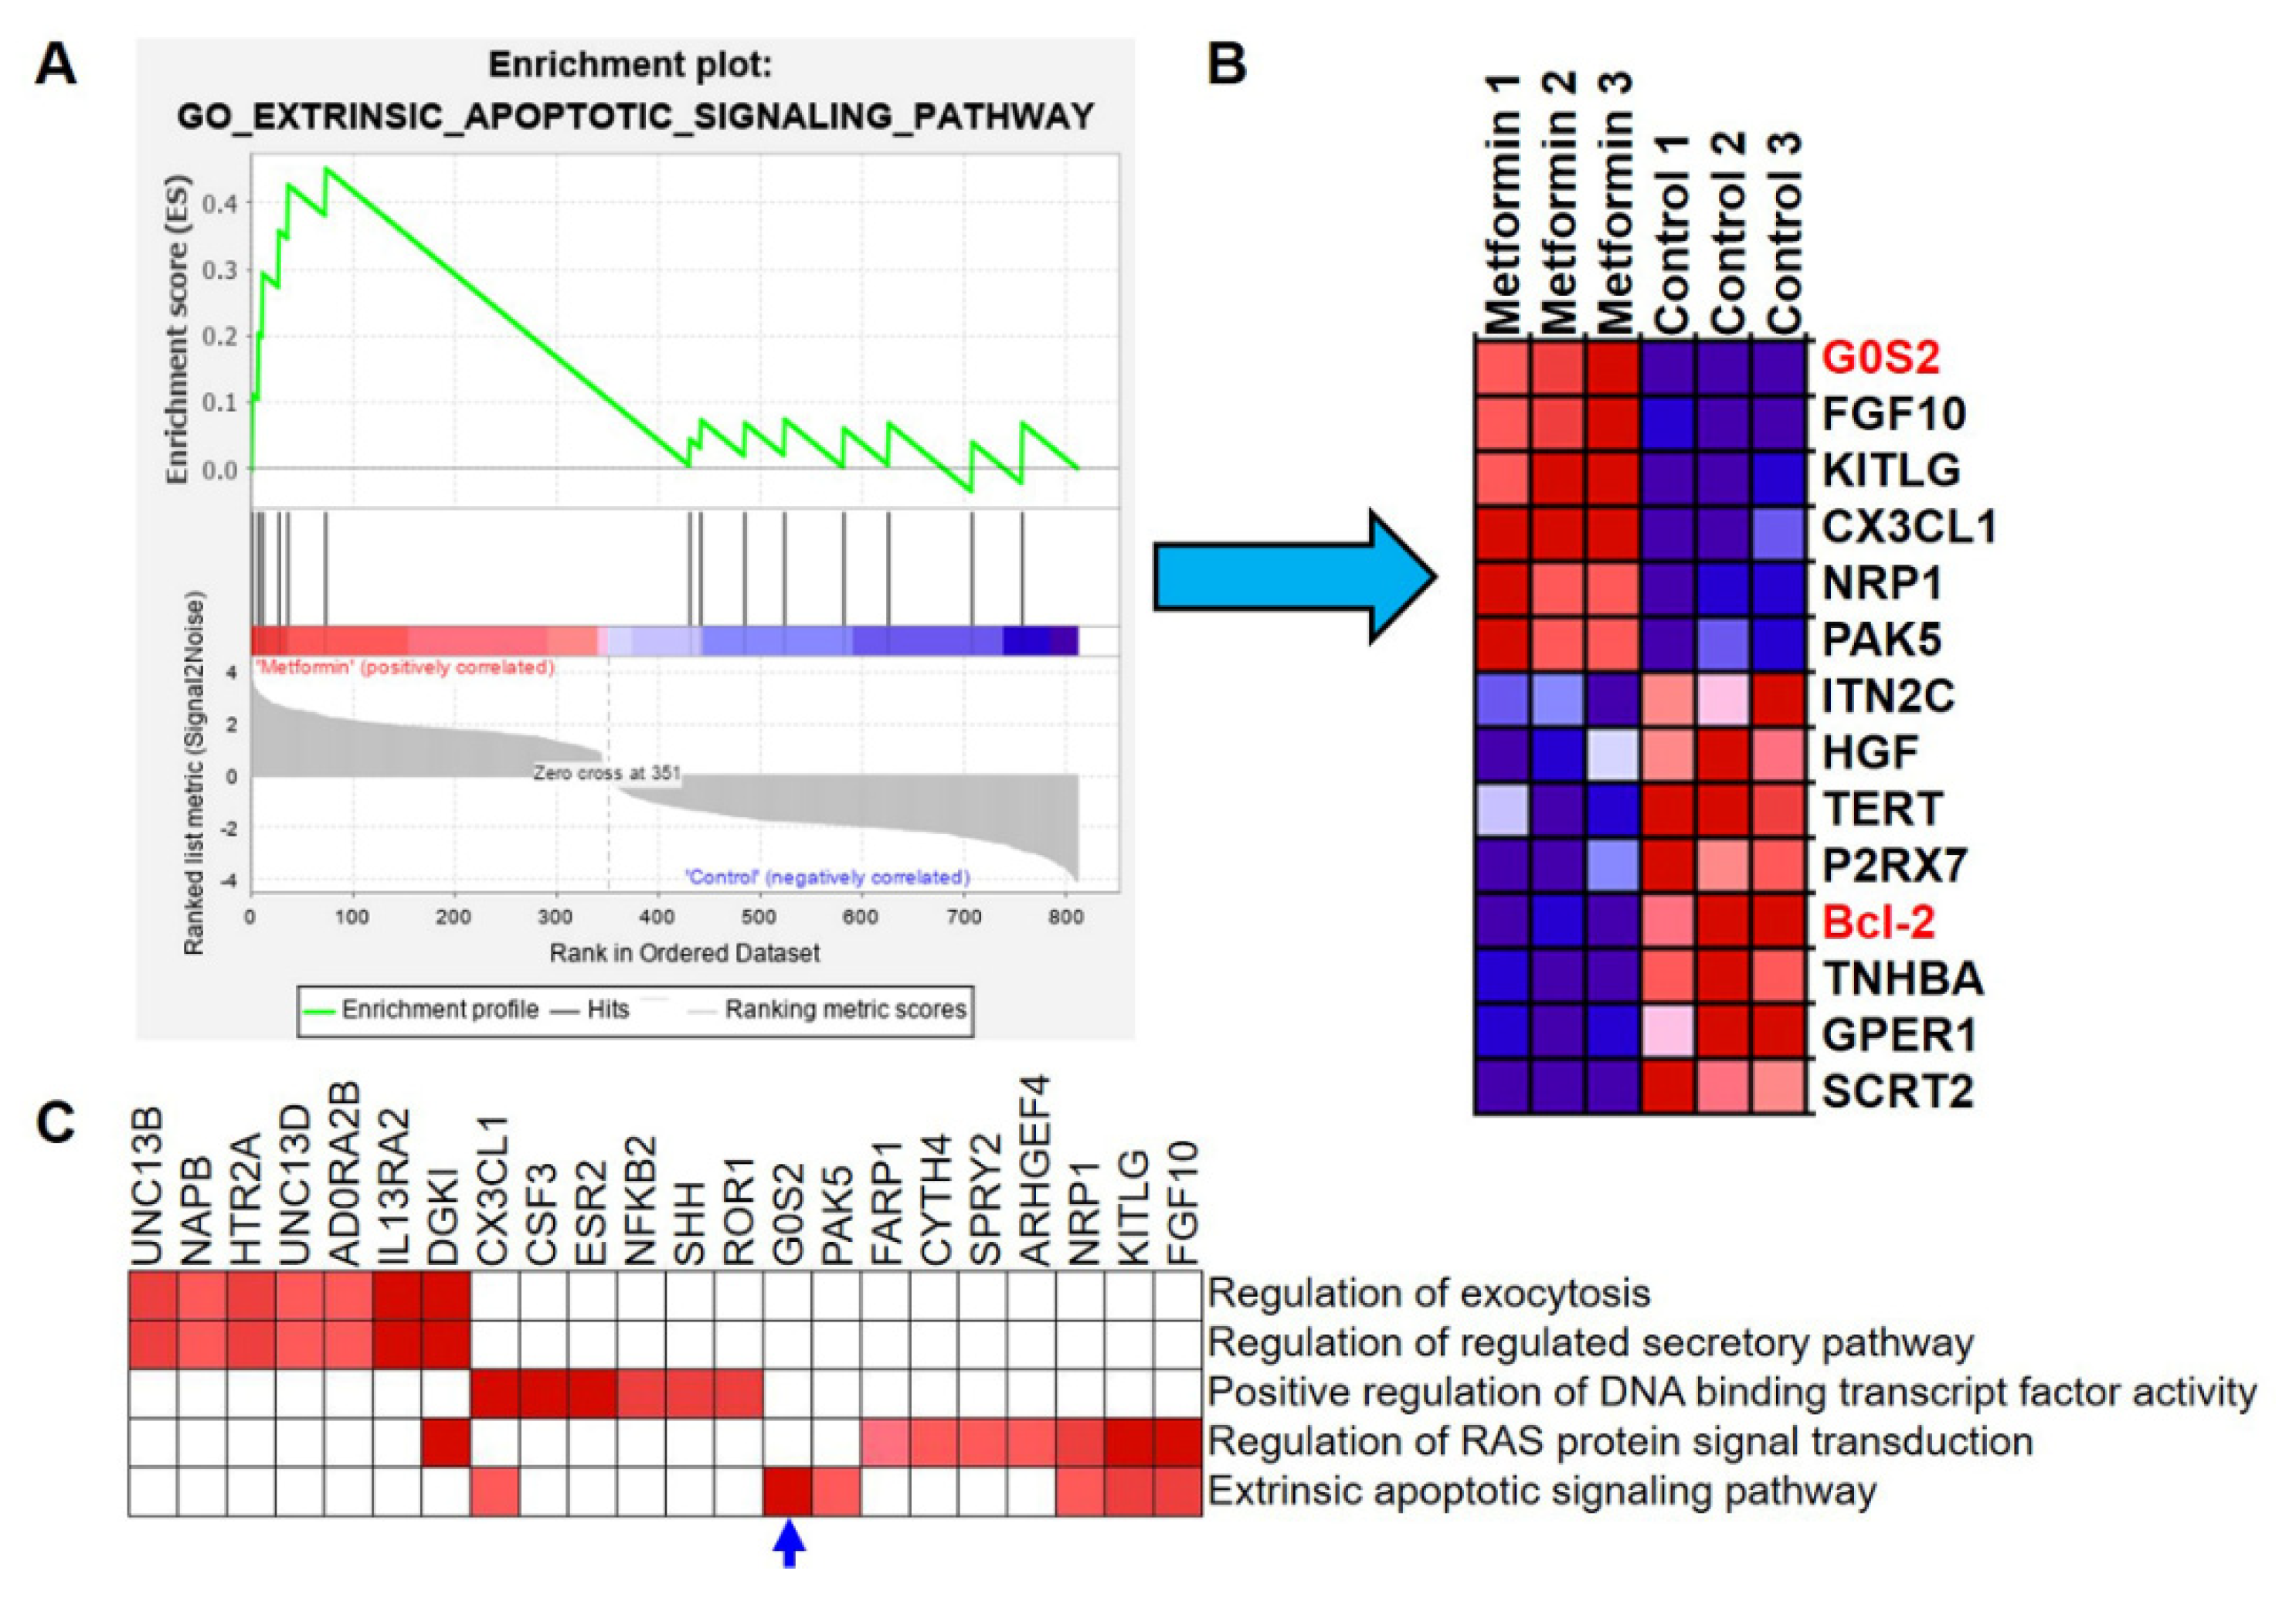
3.4. G0S2 Has the Most Significant and Positive Correlation with the Extrinsic Apoptotic Signaling Pathway in Metformin-Treated Macrophages

The gene set enrichment analysis further revealed that several pathways were significantly changed in metformin-treated macrophages. The top five significantly enriched pathways included regulation of exocytosis, the regulation of regulated secretory pathway, positive regulation of DNA binding transcript factor activity, regulation of RAS protein signal transduction and the extrinsic apoptotic signaling pathway (Figure 4 and Figure 5A).
Next, we focused on the extrinsic apoptotic signaling pathway to reveal the mechanism of apoptosis in macrophages induced by metformin. In the heat-map of this pathway, expression of the G0S2 (G0/G1 switch 2) gene was obviously increased, while expression of the apoptosis inhibitor Bcl-2 (B-cell lymphoma 2) was reduced in metformin-treated macrophages (Figure 5B). The leading edge analysis of the top five pathways performed by GSEA software confirmed that G0S2 was the most significantly and positively correlated with the extrinsic apoptotic signaling pathway (Figure 5C, blue arrow). Thus, we speculated that G0S2 might be a major player for apoptosis of metformin-treated macrophages.

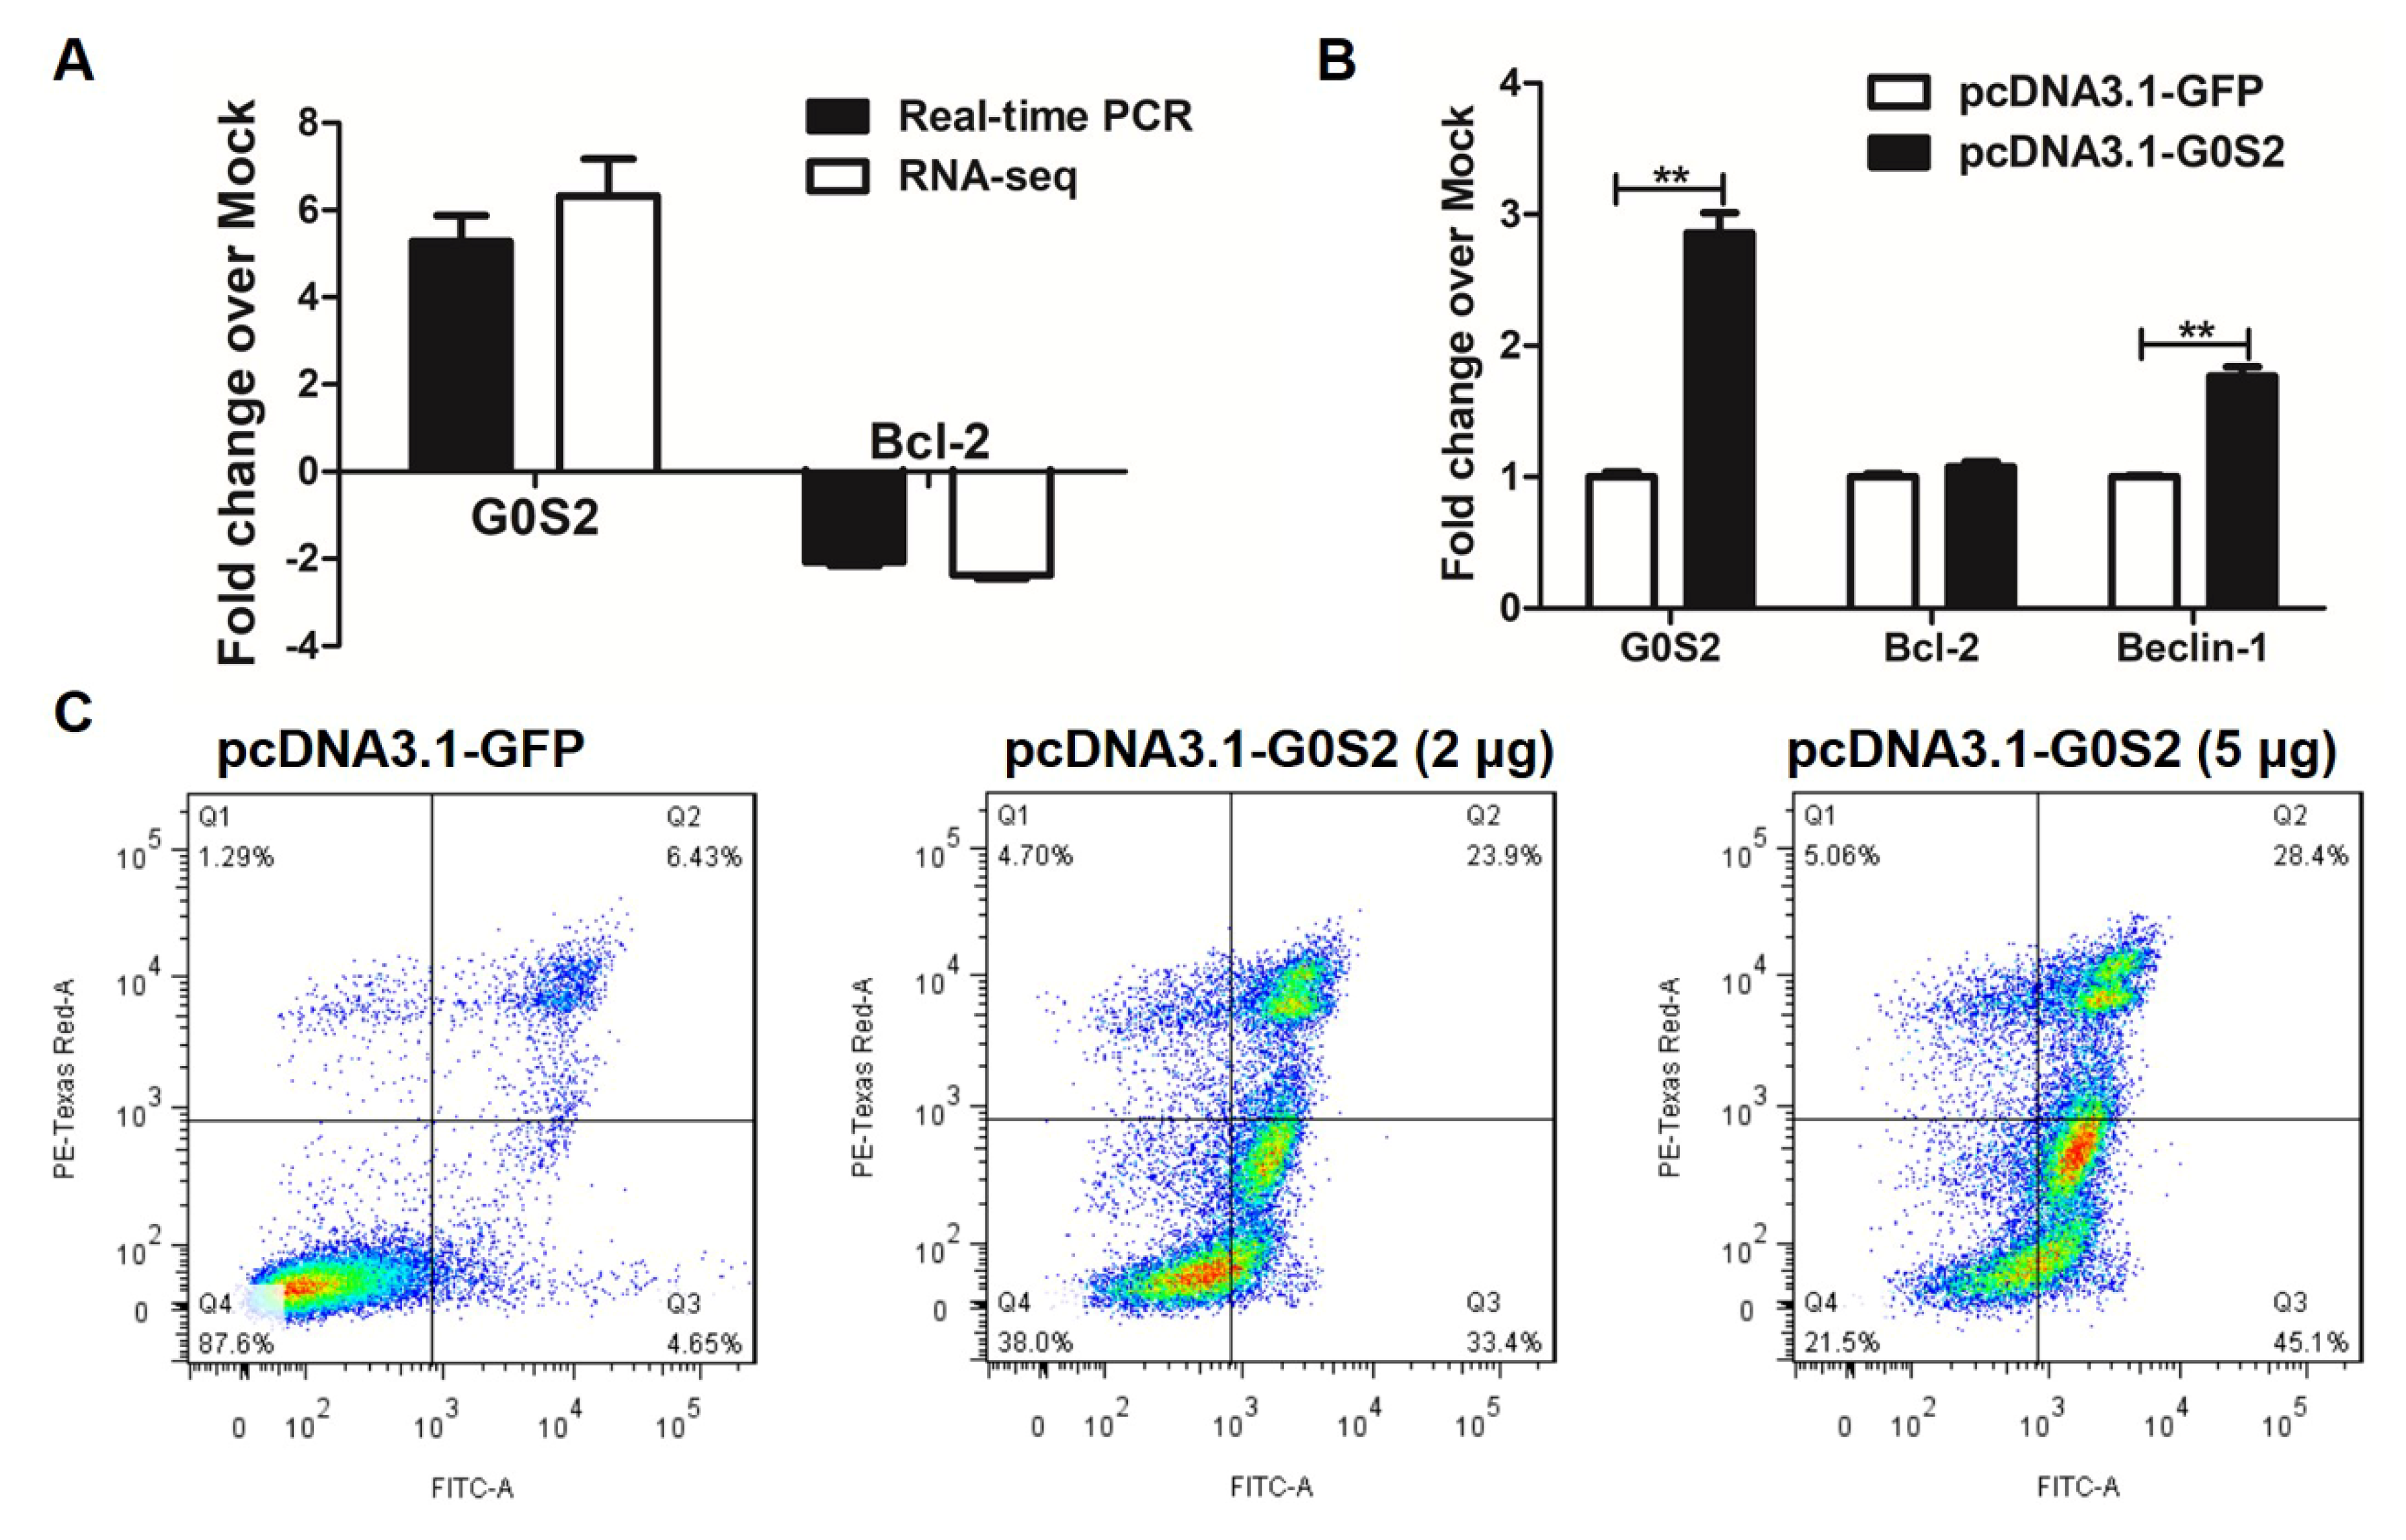
3.5. Metformin Promotes Apoptosis via G0S2 Induction
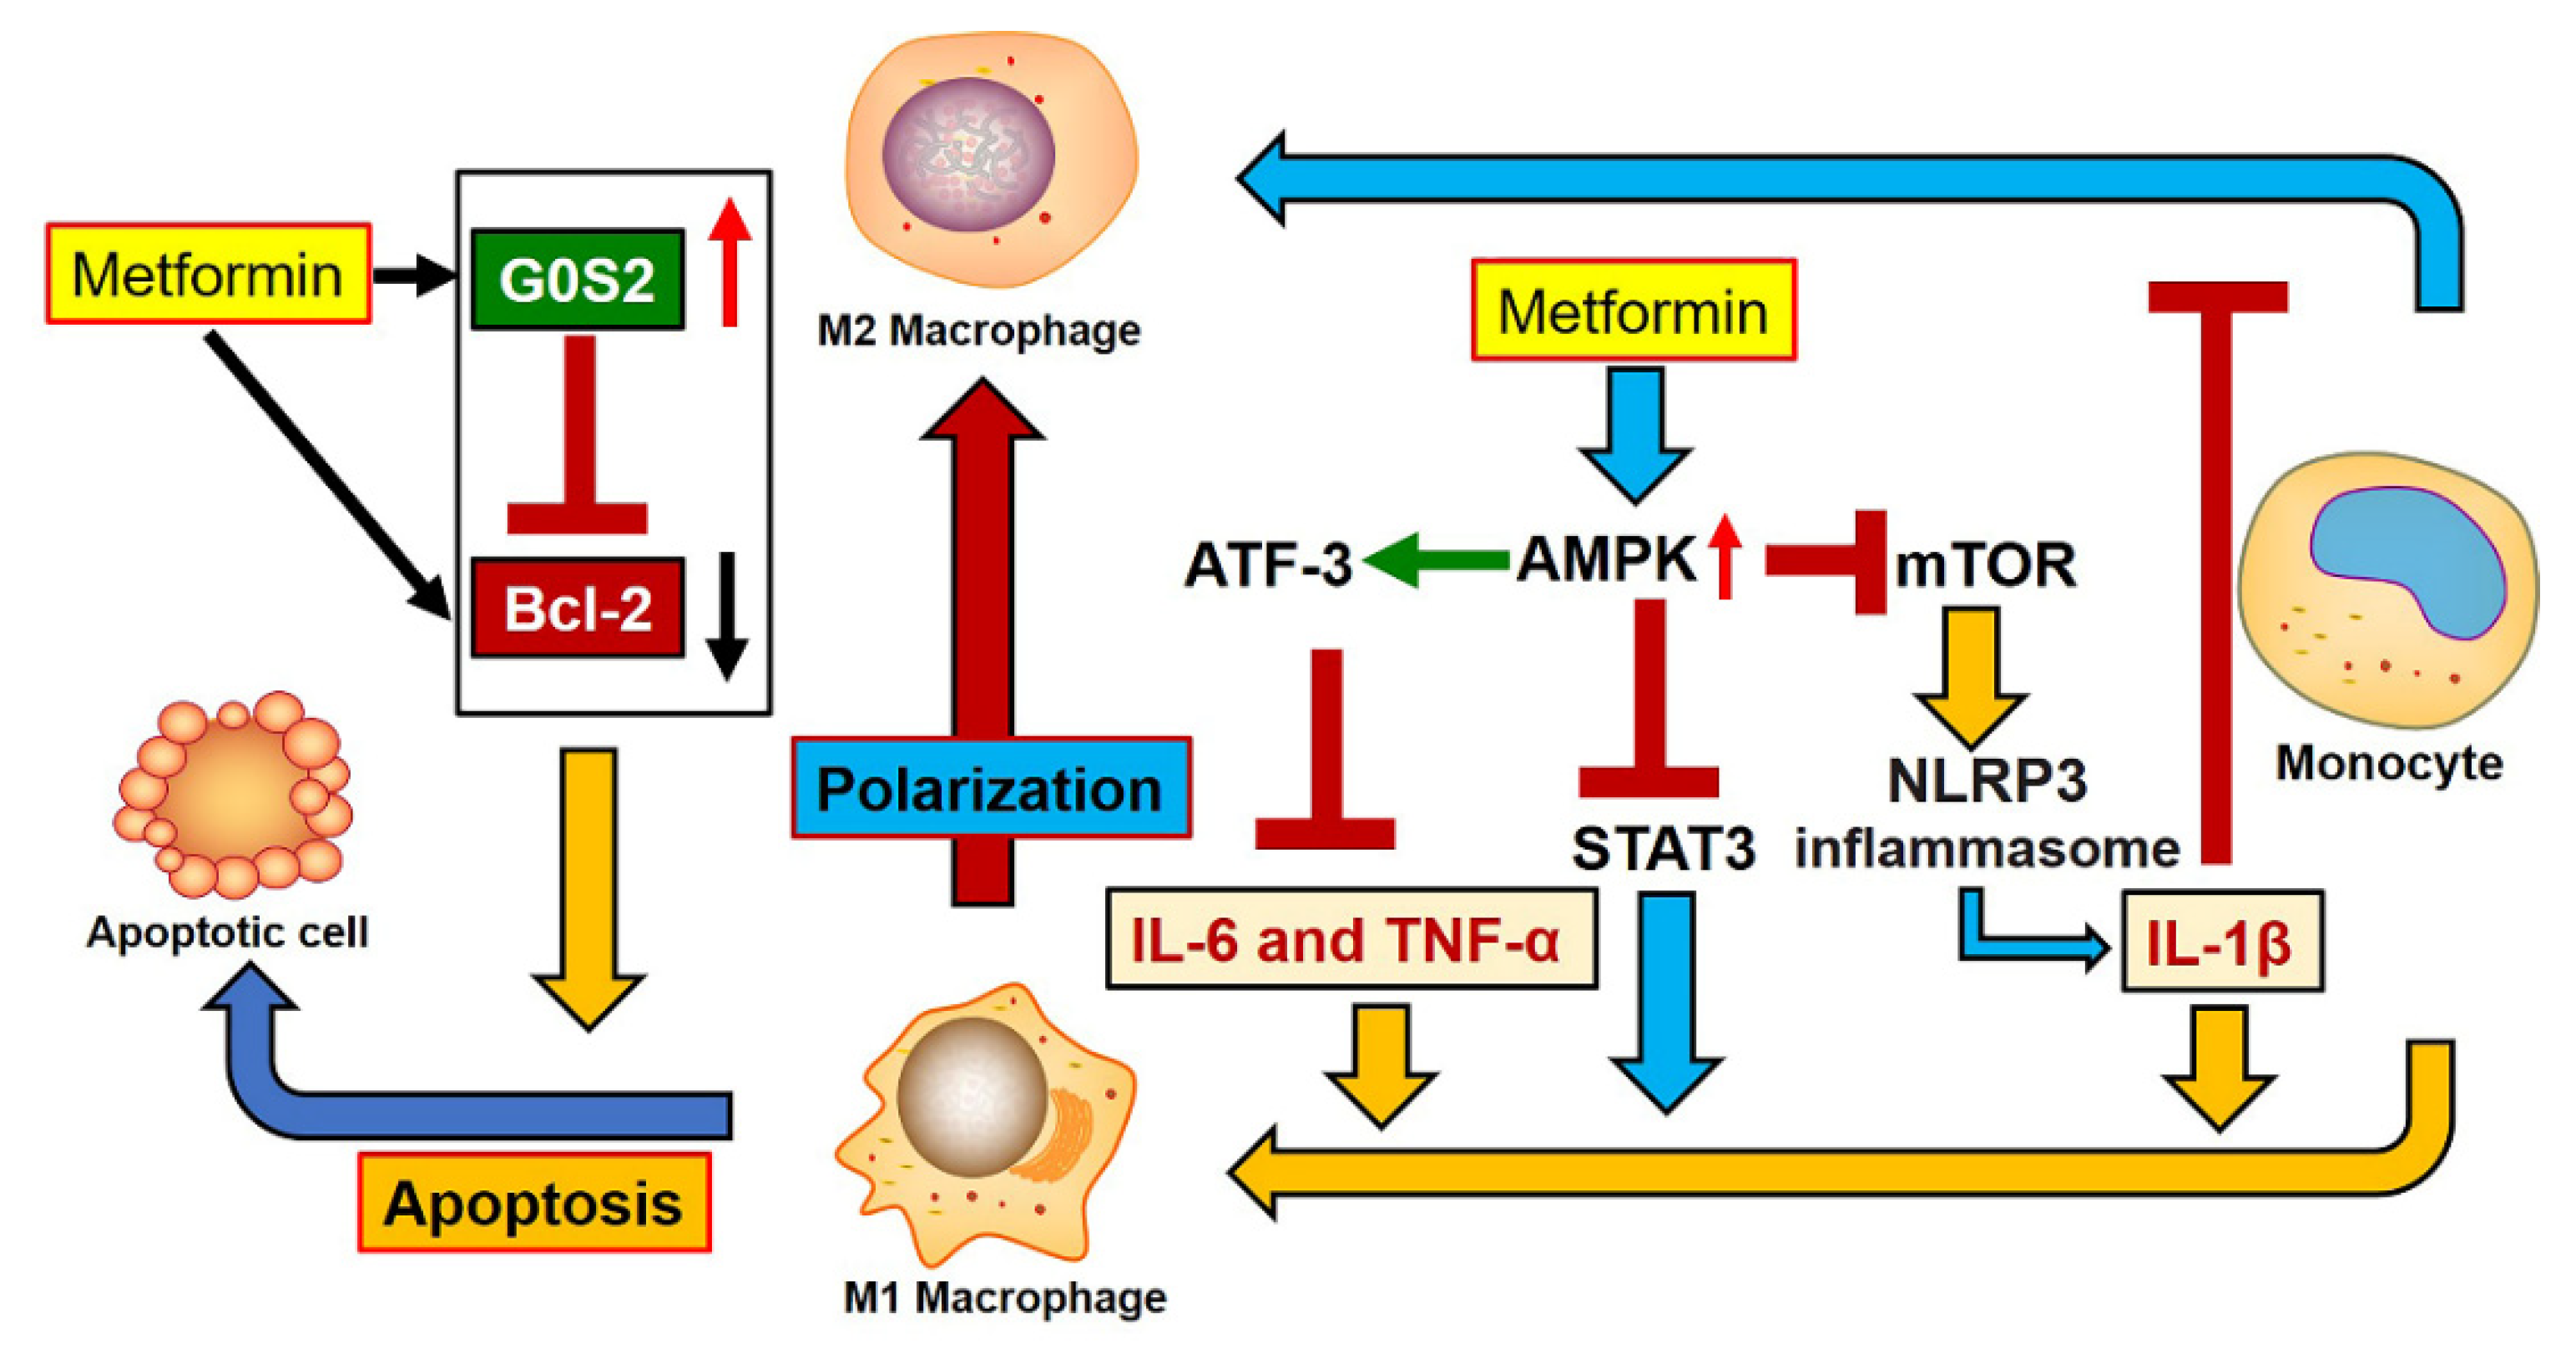
To further understand the role of G0S2 in apoptosis induced by metformin on macrophages, quantitative PCR was performed for G0S2 and Bcl-2, an important downstream target gene for G0S2. Quantitative PCR confirmed the RNA-seq results that metformin altered these two gene expression levels in macrophages, with upregulation of G0S2 and downregulation of Bcl-2 (Figure 6A). Overexpression of G0S2 did not affect the mRNA expression levels of Bcl-2 gene in macrophages (Figure 6B). However, it significantly increased the mRNA expression levels of beclin-1, the direct target gene of Bcl-2 (Figure 6B). In addition, transfection of G0S2 for 48 h in HD11 cells significantly induced apoptosis in a dose-dependent way (Figure 6C). These results suggested that G0S2 induction by metformin could induce apoptosis in macrophages and G0S2 exerted the pro-apoptotic effect at least in part through inhibition of Bcl-2 functions.

4. Discussion

Metformin has recently attracted attention as a new supportive therapeutic drug against a variety of diseases, including inflammation, cancer, anti-aging and infectious diseases. Anti-inflammatory effects have been mediated through macrophages. However, the anti-inflammatory mechanisms of metformin on macrophages are still not fully understood.
The present study has provided evidence for additional anti-inflammatory mechanisms of metformin’s actions on macrophages (Figure 7). It is well known that metformin can elicit anti-inflammatory effects by promoting M2 macrophage activation through induction of AMPK activation. There are at least three proposed mechanisms for AMPK-mediated modulation of macrophage activation by metformin. The first is inhibition of STAT3 activation via AMPK. STAT3 inhibited the phorbol myristate acetate (PMA)-induced macrophage activation, but this inhibition was removed by metformin-induced AMPK activation [17,18]. The second is related to inhibition of mTOR/NLRP3 inflammasome activity via AMPK. Activating and phosphorylating AMPK suppressed mTOR/NLRP3 inflammasome signaling pathway activation by reducing NLRP3, IL-1β and caspase-1 protein expression, which boosted M2 macrophage activation [15,29]. Finally, AMPK activation by metformin induced ATF-3 expression, resulting in a reduction of IL-6 and TNF-α in lipopolysaccharide (LPS)-induced inflammatory macrophages [30]. Our results support a novel anti-inflammatory mechanism of metformin on macrophages by inducing apoptosis of M1 macrophages through activation of G0S2 and inhibition of Bcl-2 (Figure 7).
Metformin induced the apoptosis of M1 phenotype macrophages in this study. It has been demonstrated that metformin induced endoplasmic reticulum stress [31,32], leading to apoptosis in M1, but not M2 macrophages. The transient receptor potential canonical 3 (TRPC3) channel contributes to endoplasmic reticulum stress-induced apoptosis in M1, but not in M2 macrophages. TRPC3-deficient macrophages polarized to the M1 phenotype showed reduced apoptosis [33,34]. In addition, the human cytolytic fusion proteins (CFP) also specifically eliminated polarized M1 macrophages in a transgenic mouse model of cutaneous chronic inflammation [35]. How metformin is related to TRPC3 and CFP needs further investigation.
Our proposed mechanism is also supported by other research findings from other anti-inflammatory drugs (such as curcumin and luteolin). These drugs could regulate macrophage activation via apoptosis [19,20,21]. Bcl-2 is a crucial anti-apoptotic gene and central regulator of caspase activation and cellular life-or-death switch [36,37,38]. Inhibition of Bcl-2 could lead to mitochondrial apoptosis in macrophages, and this intrinsic apoptosis would promote activation of IL-1β [39]. This may explain why metformin treatment activates IL-1β in certain macrophages. G0S2 specifically interacts with Bcl-2 and promotes apoptosis by preventing the formation of protective Bcl-2/Bax heterodimers [40]. Overexpression of G0S2 in this study significantly induced apoptosis in macrophages. Therefore, induction of apoptosis by G0S2 upregulation and Bcl-2 inhibition is an important anti-inflammatory mechanism of metformin on macrophages.
An important finding from this study is that metformin promoted apoptosis of macrophages via G0S2 induction. This new finding has added an additional layer of anti-inflammatory properties of metformin by possibly inducing apoptosis of inflammatory M1 macrophages, besides inducing alternative activation on non-apoptotic macrophages. Recently, it also has been suggested that the apoptotic cells may drive alternative activation of non-apoptotic macrophages [41]. All of these results support the notion that metformin has anti-inflammatory properties.
Induction of macrophage apoptosis by metformin was concentration-dependent in this study. The common concentrations of metformin for in vitro studies range between 0.5 and 10 mM. Compared to mouse macrophages, a higher concentration of metformin was required in chicken macrophages to induce a strong apoptosis. Nevertheless, treatment of both chicken macrophages and mouse macrophages with a low concentration of 1 mM metformin led to apoptosis in macrophages. However, whether the present results can be applied to in vivo application needs further investigation.

5. Conclusions

In conclusion, our results provide a novel anti-inflammatory mechanism of metformin on macrophages. Namely, it induces apoptosis of macrophages via G0S2 induction. In particular, metformin induced apoptosis of M1 macrophages, based on M1 marker genes in apoptotic macrophages. These findings may be significantly important for understanding the mechanisms of metformin’s anti-inflammatory actions.

Supplementary Materials

The following are available online at https://www.mdpi.com/article/10.3390/genes12091437/s1, Supplementary File S1: Lists of significantly differentially expressed genes in metformin-treated HD11 cells.

Author Contributions

Conceptualization, X.H., X.Z. and H.C.; methodology, X.H., H.L., C.D., X.C., Y.H., L.W., S.X. and Z.S.; software, X.H., C.D. and X.C.; validation, X.H., C.D. and X.C.; formal analysis, X.H., C.D. and X.C.; investigation, X.H., S.C., Q.X. and T.G.; resources, X.H.; data curation, X.H., H.L., C.D. and X.C.; writing—original draft preparation, X.H.; writing—review and editing, X.H., X.Z and H.C.; visualization, X.H.; supervision, X.Z. and H.C.; project administration, X.H. and H.C.; funding acquisition, H.C. All authors have read and agreed to the published version of the manuscript.

Funding

This study was supported by the National Natural Science Foundation of China (81773013, 31602032), the National Key Research and Development Program in China (2016YFC1303604) and the Priority Academic Program Development of Jiangsu Higher Education Institutions (Animal Science and Veterinary Medicine).

Institutional Review Board Statement

Not applicable.

Informed Consent Statement

Not applicable.

Data Availability Statement

All the data mentioned in this paper are available in the article and Supplementary Materials.

Conflicts of Interest

The authors declare no conflict of interest.

References

  1. Koelwyn, G.J.; Corr, E.M.; Erbay, E.; Moore, K.J. Regulation of macrophage immunometabolism in atherosclerosis. Nat. Immunol. 2018, 19, 526–537. [Google Scholar] [CrossRef] [Green Version]
  2. Wynn, T.A.; Chawla, A.; Pollard, J.W. Macrophage biology in development, homeostasis and disease. Nature 2013, 496, 445–455. [Google Scholar] [CrossRef] [PubMed]
  3. Murray, P.J.; Allen, J.E.; Biswas, S.K.; Fisher, E.A.; Gilroy, D.W.; Goerdt, S.; Gordon, S.; Hamilton, J.A.; Ivashkiv, L.B.; Lawrence, T.; et al. Macrophage activation and polarization: Nomenclature and experimental guidelines. Immunity 2014, 41, 14–20. [Google Scholar] [CrossRef] [Green Version]
  4. Blandino, G.; Valerio, M.; Cioce, M.; Mori, F.; Casadei, L.; Pulito, C.; Sacconi, A.; Biagioni, F.; Cortese, G.; Galanti, S.; et al. Metformin elicits anticancer effects through the sequential modulation of DICER and c-MYC. Nat. Commun. 2012, 3, 865. [Google Scholar] [CrossRef] [PubMed]
  5. Vancura, A.; Bu, P.; Bhagwat, M.; Zeng, J.; Vancurova, I. Metformin as an Anticancer Agent. Trends Pharmacol. Sci. 2018, 39, 867–878. [Google Scholar] [CrossRef] [PubMed]
  6. Martin-Montalvo, A.; Mercken, E.M.; Mitchell, S.J.; Palacios, H.H.; Mote, P.L.; Scheibye-Knudsen, M.; Gomes, A.P.; Ward, T.M.; Minor, R.K.; Blouin, M.J.; et al. Metformin improves healthspan and lifespan in mice. Nat. Commun. 2013, 4, 2192. [Google Scholar] [CrossRef] [PubMed]
  7. Lopez-Otin, C.; Galluzzi, L.; Freije, J.M.P.; Madeo, F.; Kroemer, G. Metabolic Control of Longevity. Cell 2016, 166, 802–821. [Google Scholar] [CrossRef] [PubMed] [Green Version]
  8. Pryor, R.; Norvaisas, P.; Marinos, G.; Best, L.; Thingholm, L.B.; Quintaneiro, L.M.; De Haes, W.; Esser, D.; Waschina, S.; Lujan, C.; et al. Host-Microbe-Drug-Nutrient Screen Identifies Bacterial Effectors of Metformin Therapy. Cell 2019, 178, 1299–1312.e29. [Google Scholar] [CrossRef] [PubMed] [Green Version]
  9. Fontaine, E. Metformin-Induced Mitochondrial Complex I Inhibition: Facts, Uncertainties, and Consequences. Front. Endocrinol. 2018, 9, 753. [Google Scholar] [CrossRef] [PubMed]
  10. Foretz, M.; Guigas, B.; Viollet, B. Understanding the glucoregulatory mechanisms of metformin in type 2 diabetes mellitus. Nat. Rev. Endocrinol. 2019, 15, 569–589. [Google Scholar] [CrossRef] [Green Version]
  11. Cameron, A.R.; Logie, L.; Patel, K.; Erhardt, S.; Bacon, S.; Middleton, P.; Harthill, J.; Forteath, C.; Coats, J.T.; Kerr, C.; et al. Metformin selectively targets redox control of complex I energy transduction. Redox Biol. 2018, 14, 187–197. [Google Scholar] [CrossRef] [PubMed] [Green Version]
  12. Wang, Y.; An, H.; Liu, T.; Qin, C.; Sesaki, H.; Guo, S.; Radovick, S.; Hussain, M.; Maheshwari, A.; Wondisford, F.E.; et al. Metformin Improves Mitochondrial Respiratory Activity through Activation of AMPK. Cell Rep. 2019, 29, 1511–1523.e5. [Google Scholar] [CrossRef] [PubMed]
  13. Martin-Rodriguez, S.; de Pablos-Velasco, P.; Calbet, J.A.L. Mitochondrial Complex I Inhibition by Metformin: Drug-Exercise Interactions. Trends Endocrinol. Metab. 2020, 31, 269–271. [Google Scholar] [CrossRef]
  14. Chiang, C.F.; Chao, T.T.; Su, Y.F.; Hsu, C.C.; Chien, C.Y.; Chiu, K.C.; Shiah, S.G.; Lee, C.H.; Liu, S.Y.; Shieh, Y.S. Metformin-treated cancer cells modulate macrophage polarization through AMPK-NF-kappaB signaling. Oncotarget 2017, 8, 20706–20718. [Google Scholar] [CrossRef] [Green Version]
  15. Qing, L.; Fu, J.; Wu, P.; Zhou, Z.; Yu, F.; Tang, J. Metformin induces the M2 macrophage polarization to accelerate the wound healing via regulating AMPK/mTOR/NLRP3 inflammasome singling pathway. Am. J. Transl. Res. 2019, 11, 655–668. [Google Scholar]
  16. Jing, Y.; Wu, F.; Li, D.; Yang, L.; Li, Q.; Li, R. Metformin improves obesity-associated inflammation by altering macrophages polarization. Mol. Cell. Endocrinol. 2018, 461, 256–264. [Google Scholar] [CrossRef] [PubMed]
  17. Vasamsetti, S.B.; Karnewar, S.; Kanugula, A.K.; Thatipalli, A.R.; Kumar, J.M.; Kotamraju, S. Metformin inhibits monocyte-to-macrophage differentiation via AMPK-mediated inhibition of STAT3 activation: Potential role in atherosclerosis. Diabetes 2015, 64, 2028–2041. [Google Scholar] [CrossRef] [PubMed] [Green Version]
  18. Hattori, Y.; Hattori, K.; Hayashi, T. Pleiotropic benefits of metformin: Macrophage targeting its anti-inflammatory mechanisms. Diabetes 2015, 64, 1907–1909. [Google Scholar] [CrossRef] [Green Version]
  19. Jin, S.; Meng, C.; He, Y.; Wang, X.; Zhang, Q.; Wang, Z.; Huang, W.; Wang, H. Curcumin prevents osteocyte apoptosis by inhibiting M1-type macrophage polarization in mice model of glucocorticoid-associated osteonecrosis of the femoral head. J. Orthop. Res. 2020, 38, 2020–2030. [Google Scholar] [CrossRef]
  20. Jiang, Q.; Pan, D.; Yang, Y.; Hu, Y.; Fang, L.; Shang, P.; Xia, Y.; Li, D. Luteolin Regulates Macrophage Polarization via the PI3K/Akt Pathway to Inhibit the Apoptosis Stimulated by Angiotensin II. Curr. Pharm. Biotechnol. 2018, 19, 428–437. [Google Scholar] [CrossRef]
  21. Cheon, S.Y.; Kim, E.J.; Kim, J.M.; Kam, E.H.; Ko, B.W.; Koo, B.N. Regulation of Microglia and Macrophage Polarization via Apoptosis Signal-Regulating Kinase 1 Silencing after Ischemic/Hypoxic Injury. Front. Mol. Neurosci. 2017, 10, 261. [Google Scholar] [CrossRef] [Green Version]
  22. Gautier, E.L.; Ivanov, S.; Lesnik, P.; Randolph, G.J. Local apoptosis mediates clearance of macrophages from resolving inflammation in mice. Blood 2013, 122, 2714–2722. [Google Scholar] [CrossRef] [Green Version]
  23. Kim, D.; Langmead, B.; Salzberg, S.L. HISAT: A fast spliced aligner with low memory requirements. Nat. Methods 2015, 12, 357–360. [Google Scholar] [CrossRef] [Green Version]
  24. Pertea, M.; Pertea, G.M.; Antonescu, C.M.; Chang, T.C.; Mendell, J.T.; Salzberg, S.L. StringTie enables improved reconstruction of a transcriptome from RNA-seq reads. Nat. Biotechnol. 2015, 33, 290–295. [Google Scholar] [CrossRef] [PubMed] [Green Version]
  25. Pertea, M.; Kim, D.; Pertea, G.M.; Leek, J.T.; Salzberg, S.L. Transcript-level expression analysis of RNA-seq experiments with HISAT, StringTie and Ballgown. Nat. Protoc. 2016, 11, 1650–1667. [Google Scholar] [CrossRef] [PubMed]
  26. Robinson, M.D.; McCarthy, D.J.; Smyth, G.K. edgeR: A Bioconductor package for differential expression analysis of digital gene expression data. Bioinformatics 2010, 26, 139–140. [Google Scholar] [CrossRef] [Green Version]
  27. Subramanian, A.; Tamayo, P.; Mootha, V.K.; Mukherjee, S.; Ebert, B.L.; Gillette, M.A.; Paulovich, A.; Pomeroy, S.L.; Golub, T.R.; Lander, E.S.; et al. Gene set enrichment analysis: A knowledge-based approach for interpreting genome-wide expression profiles. Proc. Natl. Acad. Sci. USA 2005, 102, 15545–15550. [Google Scholar] [CrossRef] [Green Version]
  28. Mootha, V.K.; Lindgren, C.M.; Eriksson, K.F.; Subramanian, A.; Sihag, S.; Lehar, J.; Puigserver, P.; Carlsson, E.; Ridderstrale, M.; Laurila, E.; et al. PGC-1alpha-responsive genes involved in oxidative phosphorylation are coordinately downregulated in human diabetes. Nat. Genet. 2003, 34, 267–273. [Google Scholar] [CrossRef] [PubMed]
  29. Zhang, L.; Lu, L.; Zhong, X.; Yue, Y.; Hong, Y.; Li, Y.; Li, Y. Metformin reduced NLRP3 inflammasome activity in Ox-LDL stimulated macrophages through adenosine monophosphate activated protein kinase and protein phosphatase 2A. Eur. J. Pharmacol. 2019, 852, 99–106. [Google Scholar] [CrossRef]
  30. Kim, J.; Kwak, H.J.; Cha, J.Y.; Jeong, Y.S.; Rhee, S.D.; Kim, K.R.; Cheon, H.G. Metformin suppresses lipopolysaccharide (LPS)-induced inflammatory response in murine macrophages via activating transcription factor-3 (ATF-3) induction. J. Biol. Chem. 2014, 289, 23246–23255. [Google Scholar] [CrossRef] [Green Version]
  31. Yang, J.; Wei, J.; Wu, Y.; Wang, Z.; Guo, Y.; Lee, P.; Li, X. Metformin induces ER stress-dependent apoptosis through miR-708-5p/NNAT pathway in prostate cancer. Oncogenesis 2015, 4, e158. [Google Scholar] [CrossRef] [Green Version]
  32. Loubiere, C.; Clavel, S.; Gilleron, J.; Harisseh, R.; Fauconnier, J.; Ben-Sahra, I.; Kaminski, L.; Laurent, K.; Herkenne, S.; Lacas-Gervais, S.; et al. The energy disruptor metformin targets mitochondrial integrity via modification of calcium flux in cancer cells. Sci. Rep. 2017, 7, 5040. [Google Scholar] [CrossRef] [Green Version]
  33. Solanki, S.; Dube, P.R.; Tano, J.Y.; Birnbaumer, L.; Vazquez, G. Reduced endoplasmic reticulum stress-induced apoptosis and impaired unfolded protein response in TRPC3-deficient M1 macrophages. Am. J. Physiol. Cell Physiol. 2014, 307, C521–C531. [Google Scholar] [CrossRef] [Green Version]
  34. Solanki, S.; Dube, P.R.; Birnbaumer, L.; Vazquez, G. Reduced Necrosis and Content of Apoptotic M1 Macrophages in Advanced Atherosclerotic Plaques of Mice With Macrophage-Specific Loss of Trpc3. Sci. Rep. 2017, 7, 42526. [Google Scholar] [CrossRef] [PubMed]
  35. Hristodorov, D.; Mladenov, R.; Fischer, R.; Barth, S.; Thepen, T. Fully human MAP-fusion protein selectively targets and eliminates proliferating CD64(+) M1 macrophages. Immunol. Cell Biol. 2016, 94, 470–478. [Google Scholar] [CrossRef] [PubMed]
  36. Singh, R.; Letai, A.; Sarosiek, K. Regulation of apoptosis in health and disease: The balancing act of BCL-2 family proteins. Nat. Rev. Mol. Cell Biol. 2019, 20, 175–193. [Google Scholar] [CrossRef] [PubMed]
  37. Ashkenazi, A.; Fairbrother, W.J.; Leverson, J.D.; Souers, A.J. From basic apoptosis discoveries to advanced selective BCL-2 family inhibitors. Nat. Rev. Drug Discov. 2017, 16, 273–284. [Google Scholar] [CrossRef]
  38. Cory, S.; Adams, J.M. The Bcl2 family: Regulators of the cellular life-or-death switch. Nat. Rev. Cancer 2002, 2, 647–656. [Google Scholar] [CrossRef] [PubMed]
  39. Chauhan, D.; Bartok, E.; Gaidt, M.M.; Bock, F.J.; Herrmann, J.; Seeger, J.M.; Broz, P.; Beckmann, R.; Kashkar, H.; Tait, S.W.G.; et al. BAX/BAK-Induced Apoptosis Results in Caspase-8-Dependent IL-1beta Maturation in Macrophages. Cell Rep. 2018, 25, 2354–2368.e5. [Google Scholar] [CrossRef] [Green Version]
  40. Welch, C.; Santra, M.K.; El-Assaad, W.; Zhu, X.; Huber, W.E.; Keys, R.A.; Teodoro, J.G.; Green, M.R. Identification of a protein, G0S2, that lacks Bcl-2 homology domains and interacts with and antagonizes Bcl-2. Cancer Res. 2009, 69, 6782–6789. [Google Scholar] [CrossRef] [Green Version]
  41. Rothlin, C.V.; Hille, T.D.; Ghosh, S. Determining the effector response to cell death. Nat. Rev. Immunol. 2021, 21, 292–304. [Google Scholar] [CrossRef] [PubMed]
Figure 1. The influence of metformin on cell proliferation and apoptosis in macrophages. MTT (A) and CCK-8 (B) assays were performed to analyze the cell proliferation of HD11 cells treated with metformin for 24 and 48 h. (C) Apoptotic DNA ladder detection for HD11 cells treated with metformin for 48 h. (D) Metformin-induced apoptosis in HD11 cells by flow cytometry. The X axis represents Annexin V-FITC, and the Y axis represents propidium iodide (PI). MTT (E) and CCK-8 (F) assays were performed to analyze the cell proliferation of RAW264.7 cells treated with metformin for 48 h. (G) Metformin-induced apoptosis in RAW264.7 cells by flow cytometry. The X axis represents Annexin V-FITC, and the Y axis represents PI. Q1 represents necrotic cells, Q2 represents late apoptotic cells, Q3 represents early apoptotic cells, and Q4 represents normal cells. * represents p < 0.05 and ** represents p < 0.01.
Genes 12 01437 g001
Figure 2. The influence of metformin on M1 and M2 marker genes in apoptotic macrophages. RT-qPCR analysis of M1 (A) and M2 (B) marker genes in apoptotic and nonapoptotic chicken macrophages separated from 25 mM metformin-treated chicken HD11 cells for 48 h. RT-qPCR analysis of M1 (C) and M2 (D) marker genes in apoptotic and nonapoptotic macrophages separated from 5 mM metformin-treated mouse RAW264.7 cells for 48 h. * represents p < 0.05 and ** represents p < 0.01.
Genes 12 01437 g002
Figure 3. RNA-seq analysis of metformin responsive-genes in macrophages. (A) Heat-map expression profiles of metformin responsive-genes in macrophages. (B) Volcano plot of the p values as a function of weighted fold change for mRNAs in metformin-treated macrophages. The X axis represents Log2 (fold change) and the Y axis represents −Log10 (q-values). (C) Validation of RNA-Seq data for 10 randomly selected differentially expressed genes by real-time PCR.
Genes 12 01437 g003
Figure 4. Gene set enrichment analysis (GSEA) of metformin responsive-genes in macrophages. (A) The work flow chart of GSEA and butterfly plot for metformin responsive-genes in macrophages. (B) Enrichment plots for regulation of exocytosis, regulation of regulated secretory pathway, positive regulation of DNA binding transcript factor activity and regulation of RAS protein signal transduction in the data set. The plots contain the enrichment score (ES) and positions of GeneSet members on the rank-ordered list. The X axis represents the rank-ordered dataset and the Y axis represents the enrichment score (ES).
Genes 12 01437 g004
Figure 5. G0S2 is the most significant and positive correlated protein with the extrinsic apoptotic signaling pathway in metformin-treated macrophages. (A) Enrichment plot of the extrinsic apoptotic signaling pathway in the data set, including the ES score and positions of GeneSet members on the rank-ordered list. (B) Heat map of the analyzed GeneSet in the extrinsic apoptotic signaling pathway. (C) Heat map of top five pathways clustered leading edge subsets. Rows are gene sets and columns are genes. This matrix is clustered.
Genes 12 01437 g005
Figure 6. Metformin modulates apoptosis via G0S2 in macrophages. (A) Validation of RNA-Seq data for G0S2 and Bcl-2 in metformin-treated HD11 cells by real-time PCR. (B) RT-qPCR analysis of G0S2, Bcl-2 and Beclin-1 gene expression in macrophages transfected with 2-μg G0S2 plasmid. (C) Flow cytometry results showed that over-expression of G0S2 induced apoptosis in HD11 cells. The X axis represents Annexin V-FITC and the Y axis represents PI. Q1 represents necrotic cells, Q2 represents late apoptotic cells, Q3 represents early apoptotic cells and Q4 represents normal cells. ** represents p < 0.01.
Genes 12 01437 g006
Figure 7. A working model of the anti-inflammatory mechanism for metformin on macrophages. The model describes how metformin promotes M2 macrophage activation through induction of AMPK activation, as previously proposed [15,17,18]. Synergistically, the results from this study support a novel anti-inflammatory mechanism of metformin on macrophages by inducing apoptosis of M1 macrophages through activation of G0S2 and inhibition of Bcl-2.
Genes 12 01437 g007
Table 1. Primers used in this study.
Primer NameNucleotide Sequence 5′-3′
Chicken CD86 fwdGGATGTCTTACAGGATGCT
Chicken CD86 revCTGCTCTCCAAGGTGAAG
Chicken NOS2 fwdCCACTCATTCTCCAAGCAA
Chicken NOS2 revAGGCAGAGCATACCACTT
Chicken IL-6 fwdGTCGAGTCTCTGTGCTAC
Chicken IL-6 revCTTCAGATTGGCGAGGAG
Chicken CD206 fwdGAGGACTGCGTTGTTATGA
Chicken CD206 revTCTTCTGTCGGTGCTTCT
Chicken IL-10 fwdGCTCTGAACTGCTGGATG
Chicken IL-10 revATGCTCTGCTGATGACTG
Chicken IL-4 fwdAATGACATCCAGGGAGAGG
Chicken IL-4 revCAGGTTCTTGTGGCAGTG
Chicken CCL5 fwdGCTCTGTCCCTCTCCATCCT
Chicken CCL5 revGTTGAAGCAGCACACGGTTG
Chicken IL-1β fwdTAGATGTCGTGTGTGATGAG
Chicken IL-1β revGTAGAAGATGAAGCGGGTC
Chicken IL-8 fwdACGCTGGTAAAGATGGGGAA
Chicken IL-8 revGCACACCTCTCTTCCATCC
Chicken CX3CL1 fwdGGTGGAGAAGATCGTGAAG
Chicken CX3CL1 revCTGGAGGTGAAGGTGGTA
Chicken CCL20 fwdTCAAGAGGATGTCAATGTGA
Chicken CCL20 revAGAGATAGTGGTGAGTAAGC
Chicken GGCL1 fwd CGAGCAAGGTGATGATGTA
Chicken GGCL1 revTTGGCACAGCACTTCTTC
Chicken IFN-β fwdGCCCACACACTCCAAAACACTG
Chicken IFN-β rev TTGATGCTGAGGTGAGCGTTG
Chicken FGF8 fwdACTGATCGGCAAGAGTAAC
Chicken FGF8 revCTCGTACTTGGCGTTCTG
Chicken FOS fwdCTACTGTGTTCCTGGCAAT
Chicken FOS revACATTCAGACCACCTCAAC
Chicken SERPINF1 fwdCCACAGCCAACTAGAGAAG
Chicken SERPINF1 revAGCAAGGAGAATACTGACATC
Chicken Bcl-2 fwdAGACCTACCTGCTTACACT
Chicken Bcl-2 revGCTTACTCTGACTGCTCTC
Chicken G0S2 fwdTCAGCCAGAAGCCCAACAGG
Chicken G0S2 revGATGACCACGCCGAAGAACG
ALVJ env fwd TGCGTGCGTGGTATTATTTC
ALVJ env rev AATGGTGAGGTCGCTGACTGT
Chicken β-Actin fwd GAGAAATTGTGCGTGACATCA
Chicken β-Actin rev CCTGAACCTCTCATTGCCA
Chicken GAPDH fwd GAGAAACCAGCCAAGTATGA
Chicken GAPDH rev CTGGTCCTCTGTGTATCCTA
Mouse CD86 fwdGACTCTACGACTTCACAATG
Mouse CD86 revTGTTAATGTCTGTTGGAGGA
Mouse NOS2 fwdTACTGCTGGTGGTGACAA
Mouse NOS2 revCTGAAGGTGTGGTTGAGTT
Mouse IL-6 fwdGCCAGAGTCCTTCAGAGA
Mouse IL-6 revGATGGTCTTGGTCCTTAGC
Mouse IL-1β fwdCTACAGGCTCCGAGATGA
Mouse IL-1β revCGTTGCTTGGTTCTCCTT
Mouse CD206 fwdGGCAAGTATCCACAGCAT
Mouse CD206 revGGTTCCATCACTCCACTC
Mouse IL-10 fwdGGTTGCCAAGCCTTATCG
Mouse IL-10 revTCCACTGCCTTGCTCTTA
Mouse Arg1 fwdGCAGAGGTCCAGAAGAATG
Mouse Arg1 revGGAGTGTTGATGTCAGTGT
Mouse GAPDH fwdGTGAAGGTCGGTGTGAAC
Mouse GAPDH revCTTGACTGTGCCGTTGAA
Publisher’s Note: MDPI stays neutral with regard to jurisdictional claims in published maps and institutional affiliations.

