
Expression and Polymorphism of TSLP/TSLP Receptors as Potential Diagnostic Markers of Colorectal Cancer Progression

 ,
,  ,
,  , ,
, ,
Abstract
1. Introduction
2. Materials and Methods
2.1. Study Population and Data Collection
2.2. Extraction of Total RNA from Colon Cancer and Normal Colon Tissues
2.3. Complementary DNA (cDNA) Synthesis
2.4. Quantitative RT-PCR (qRT-PCR)
2.5. Immunohistochemistry Array (IHC Array) and Histology Analysis
2.6. Extraction of DNA from Blood Specimens
2.7. TaqMan Genotyping Assay
2.8. Statistical Analyses
3. Results
3.1. Study Population Characterization
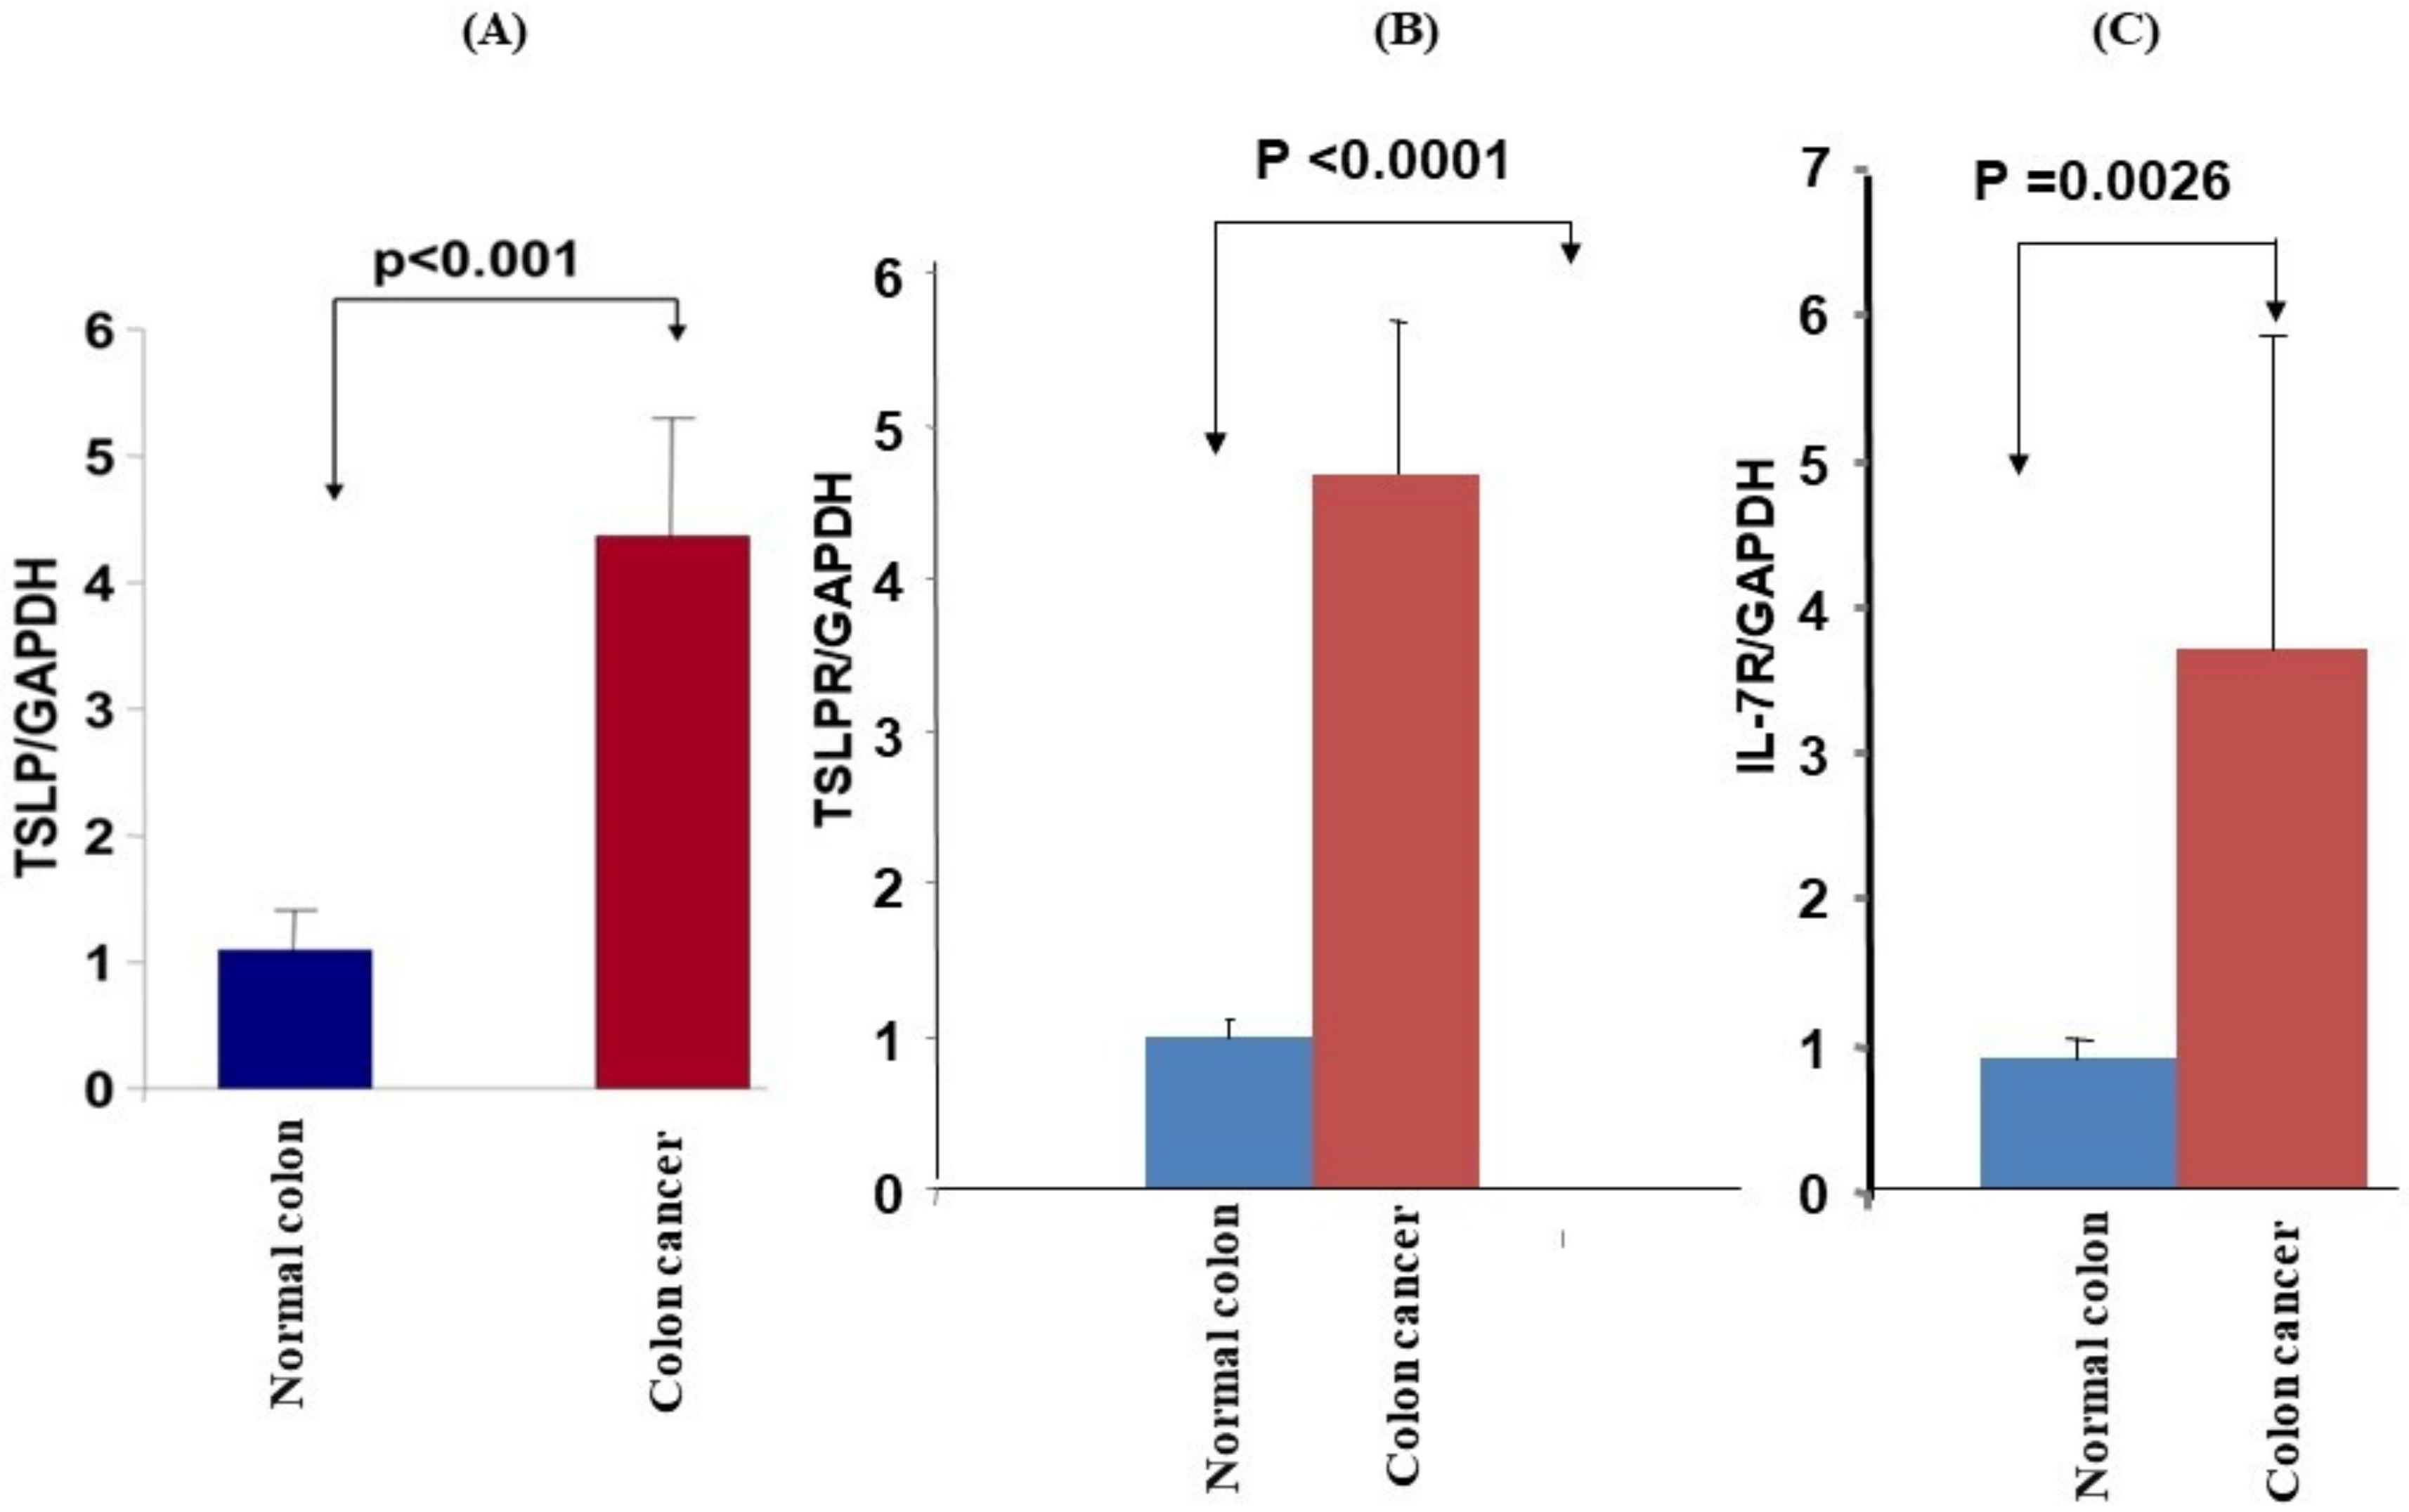
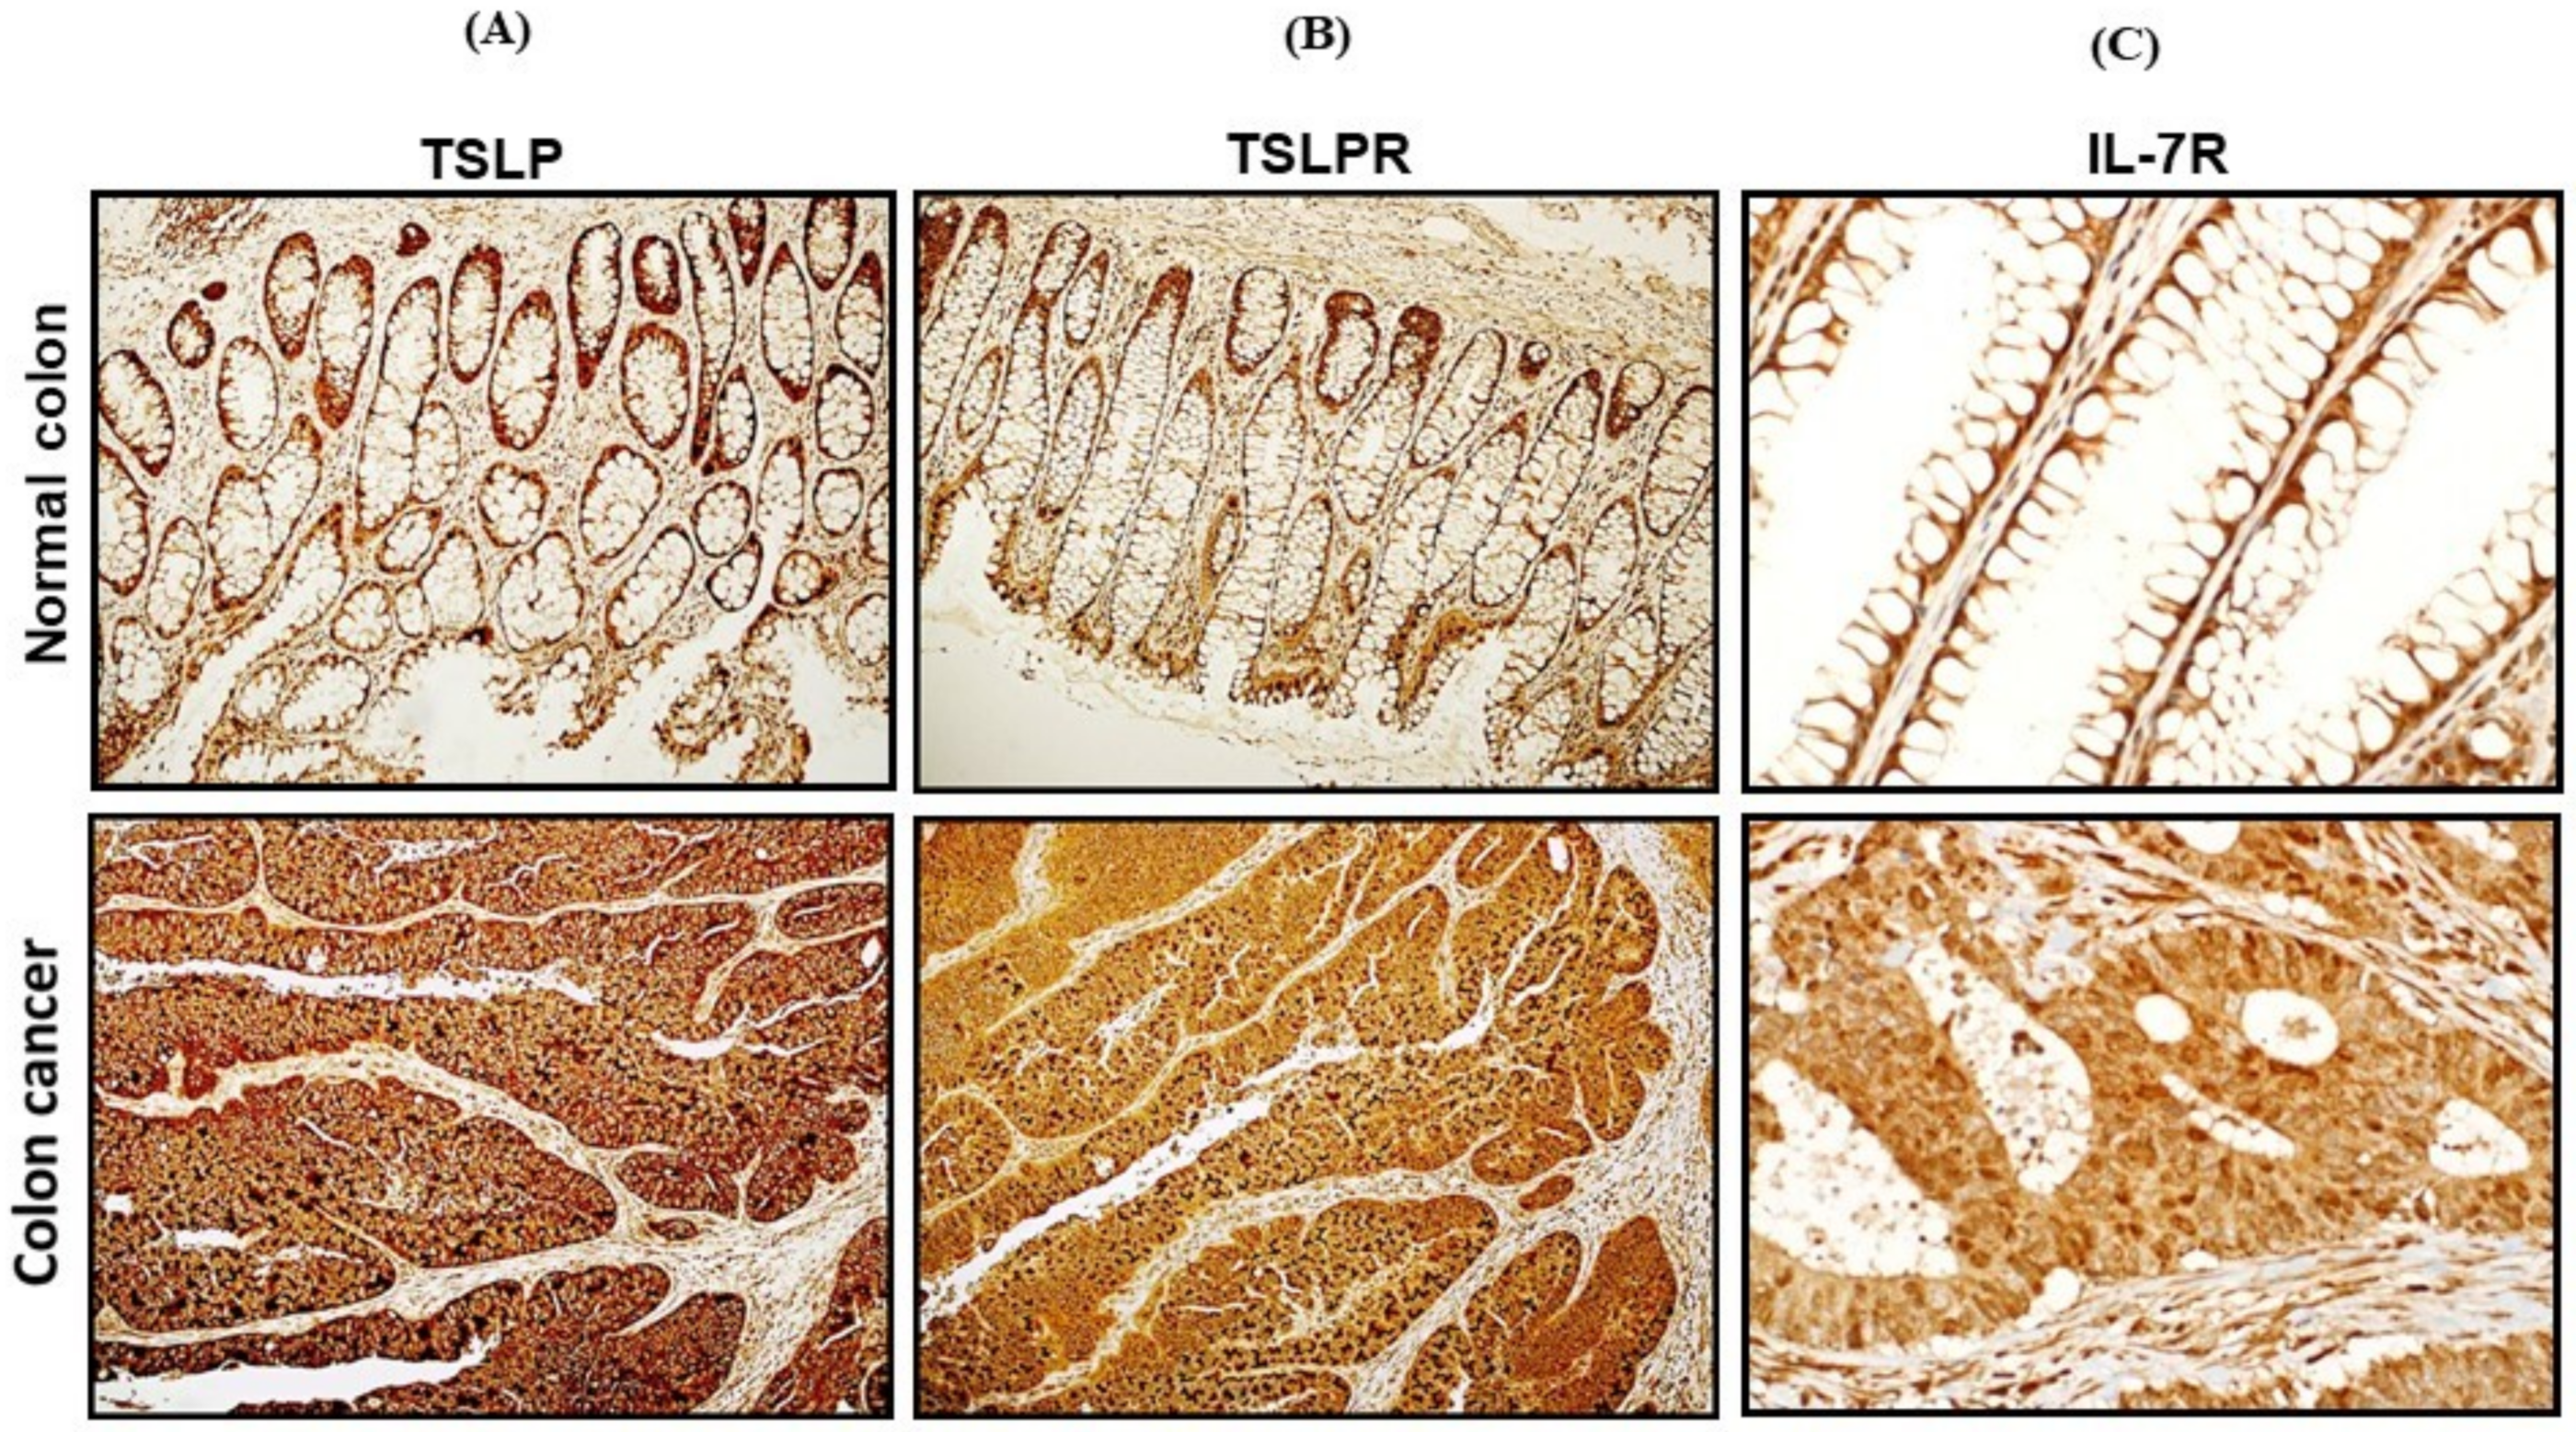
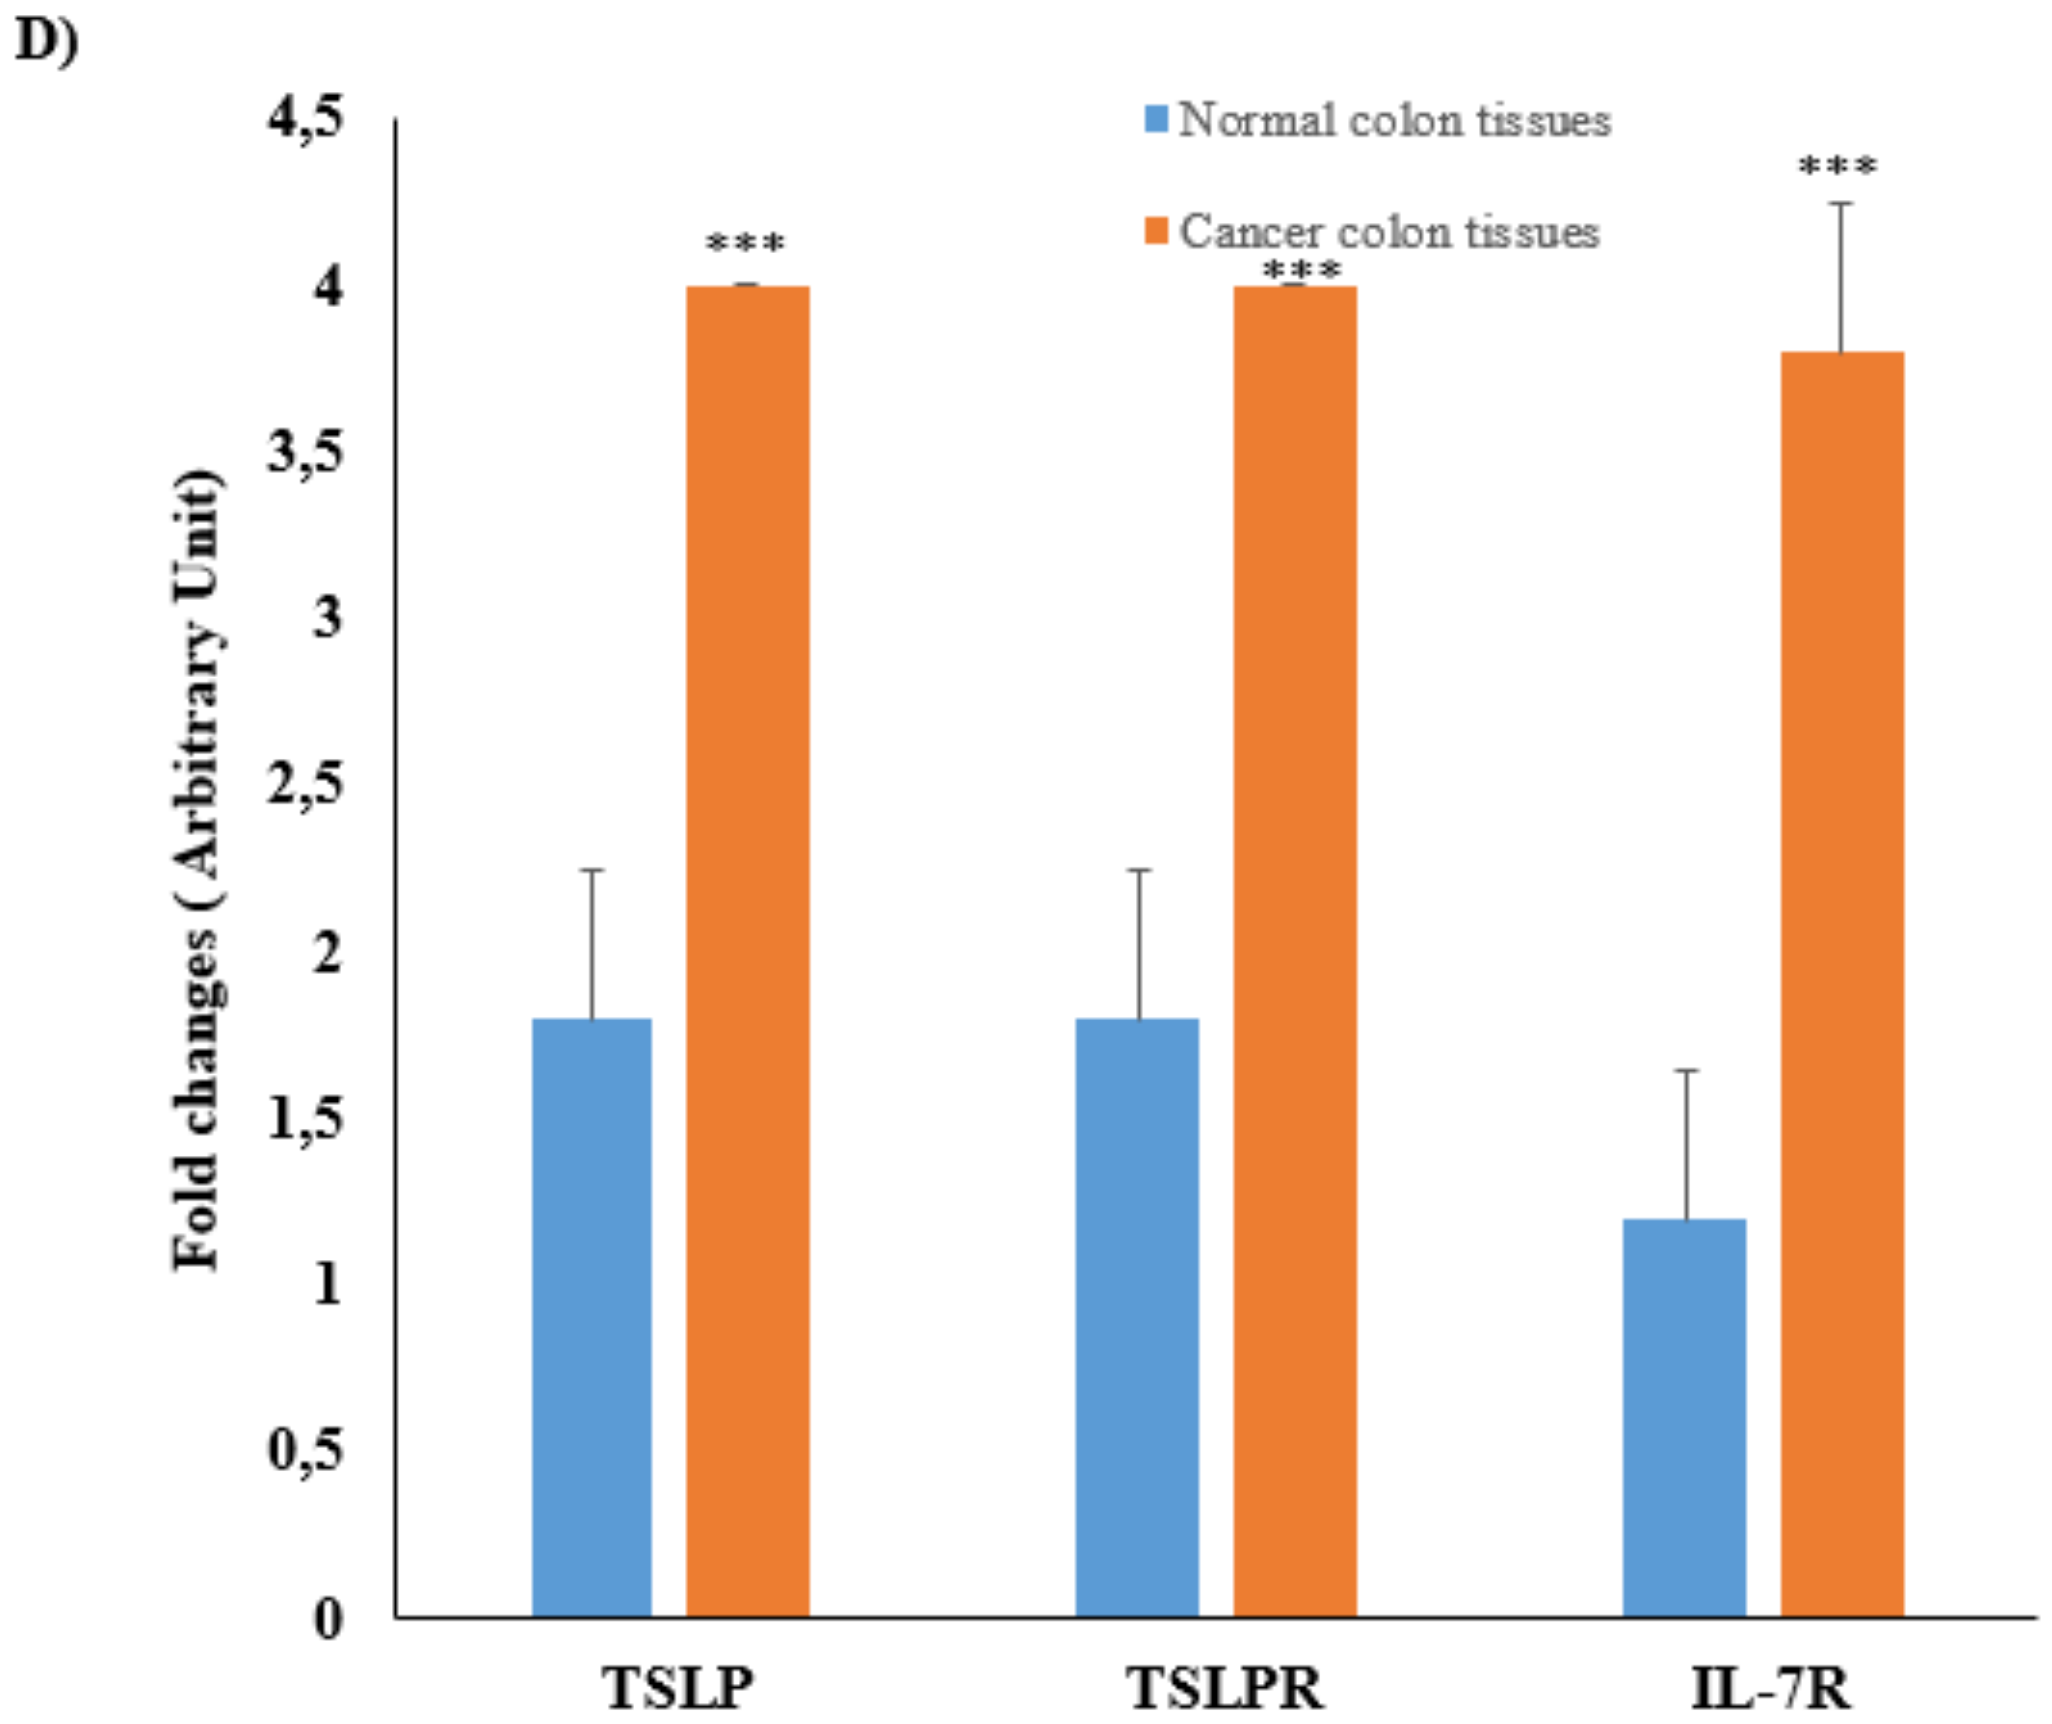
3.2. mRNA Expression and Protein Levels of TSLP/TSLPRs in Colon Cancer Tissue
3.3. Global Study of the Association between TSLP, TSLPR, and IL-7R Polymorphisms among CRC Patients
3.4. TSLP, TSLPR, and IL-7R Polymorphisms Associations with the CRC Patient’s Ages
3.5. TSLP, TSLPR, and IL-7R Polymorphism Associations among the CRC Patients’ Gender
3.6. TSLP, TSLPR, and IL-7R Polymorphisms Associations according to the Location of the Tumor in CRC Patients
4. Discussion
5. Conclusions
Author Contributions
Funding
Institutional Review Board Statement
Informed Consent Statement
Data Availability Statement
Acknowledgments
Conflicts of Interest
Abbreviations
| TSLP | Thymic stromal lymphopoietin |
| TSLPR | Thymic stromal lymphopoietin receptor |
| IL-7R | Interleukin-7 receptor |
| CRC | Colorectal cancer |
| AD | Atopic Dermatitis |
| IgE | Immunoglobulin E |
| SNP | Single nucleotide polymorphism |
| KKUH | King Khalid University Hospital |
| KSU | King Saud University |
| cDNA | Complementary DNA |
| qRT-PCR | Quantitative RT-PCR |
| IHC | Immunohistochemistry |
| PCR | Polymerase chain reaction |
| SD | Standard deviation |
| HWE | Hardy–Weinberg equilibrium |
| °C | Degrees centigrade |
| OR | Odds ratio |
| Cis | Confidence intervals |
| SPSS | Statistical Package of the Social Sciences |
References
- Parkin, D.M.; Bray, F.; Ferlay, J.; Pisani, P. Global Cancer Statistics, 2002. CA A Cancer J. Clin. 2005, 55, 74–108. [Google Scholar] [CrossRef]
- Chirca, A.; Radu, E.; Minca, D.G.; Costea, R. Relationship between Parameters Linked to Surgery, Hospitalization and Single Nucleotide Polymorphism in Patients with Colorectal Cancer. Maedica 2018, 13, 202–207. [Google Scholar] [CrossRef] [PubMed]
- Siegel, R.; Jemal, A. Colorectal Cancer Facts & Figures 2014–2016; American Cancer Society: Atalanta, GA, USA, 2014; pp. 1–28. [Google Scholar]
- Ibrahim, E.M.; Zeeneldin, A.A.; El-Khodary, T.R.; Al-Gahmi, A.M.; Bin Sadiq, B.M. Past, present and future of colorectal cancer in the Kingdom of Saudi Arabia. Saudi J. Gastroenterol. 2008, 14, 178–182. [Google Scholar] [CrossRef]
- Al-Madouj, A.; Eldali, A.; Al-Zahrani, A.S.; Alsayyad, J.; Bazarbashi, S.; Al-Eid, H. Ten-Year Cancer Incidence among Nationals of the GCC States: 1998–2007; Gulf Center for Cancer Control and Prevention: Riyadh, Saudi Arabia, 2011. [Google Scholar]
- Wilkes, G.; Hartshorn, K. Clinical Update: Colorectal, and anal cancers. Semin. Oncol. Nurs. 2012, 28, e1–e22. [Google Scholar] [CrossRef] [PubMed]
- Bardou, M.; Barkun, A.N.; Martel, M. Obesity and colorectal cancer. Gut 2013, 62, 933–947. [Google Scholar] [CrossRef]
- Kontou, N.; Psaltopoulou, T.; Soupos, N.; Polychronopoulos, E.; Xinopoulos, D.; Linos, A.; Panagiotakos, D. Alcohol consumption and colorectal cancer in a Mediterranean population: A case-control study. Dis. Colon Rectum 2012, 55, 703–710. [Google Scholar] [CrossRef] [PubMed]
- Chan, D.S.M.; Lau, R.; Aune, D.; Vieira, R.; Greenwood, D.C.; Kampman, E.; Norat, T. Red and Processed Meat and Colorectal Cancer Incidence: Meta-Analysis of Prospective Studies. PLoS ONE 2011, 6, e20456. [Google Scholar] [CrossRef]
- Liu, K.; Stamler, J.; Moss, D.; Garside, D.; Persky, V.; Soltero, I. Dietary cholesterol, fat, and fibre, and colon-cancer mortality: An Analysis of International Data. Lancet 1979, 314, 782–785. [Google Scholar] [CrossRef]
- Doubeni, C.A.; Laiyemo, A.O.; Major, J.M.; Schootman, M.; Lian, M.; Park, Y.; Graubard, B.I.; Hollenbeck, A.R.; Sinha, R. Socioeconomic status and the risk of colorectal cancer: An analysis of more than a half million adults in the National Institutes of Health-AARP Diet and Health Study. Cancer 2012, 118, 3636–3644. [Google Scholar] [CrossRef] [PubMed]
- American Cancer Society. Cancer Facts & Figures 2010; American Cancer Society: Atalanta, GA, USA, 2010. [Google Scholar]
- Rizzo, A.; Pallone, F.; Monteleone, G.; Fantini, M.C. Intestinal inflammation and colorectal cancer: A double-edged sword? World J. Gastroenterol. 2011, 17, 3092–3100. [Google Scholar]
- Cario, E. Toll-like receptors in inflammatory bowel diseases: A decade later. Inflamm. Bowel Dis. 2010, 16, 1583–1597. [Google Scholar] [CrossRef]
- Debelec-Butuner, B.; Alapinar, C.; Ertunc, N.; Gonen-Korkmaz, C.; Yörükoğlu, K.; Korkmaz, K.S. TNFalpha-mediated loss of beta-catenin/E-cadherin association and subsequent increase in cell migration is partially restored by NKX3.1 expression in prostate cells. PLoS ONE 2014, 9, e109868. [Google Scholar] [CrossRef]
- Balkwill, F.; Mantovani, A. Inflammation and cancer: Back to Virchow? Lancet 2001, 357, 539–545. [Google Scholar] [CrossRef]
- Chen, L.; Deng, H.; Cui, H.; Fang, J.; Zuo, Z.; Deng, J.; Li, Y.; Wang, X.; Zhao, L. Inflammatory responses and inflammation-associated diseases in organs. Oncotarget 2017, 9, 7204–7218. [Google Scholar] [CrossRef]
- Friend, S.L.; Hosier, S.; Nelson, A.; Foxworthe, D.; Williams, D.E.; Farr, A. A thymic stromal cell line supports in vitro development of surface IgM+ B cells and produces a novel growth factor affecting B and T lineage cells. Exp. Hematol. 1994, 22, 321–328. [Google Scholar]
- Leonard, W.J. TSLP: Finally in the limelight. Nat. Immunol. 2002, 3, 605–607. [Google Scholar] [CrossRef] [PubMed]
- Quentmeier, H.; Drexler, H.; Fleckenstein, D.; Zaborski, M.; Armstrong, A.; Sims, J.; Lyman, S. Cloning of human thymic stromal lymphopoietin (TSLP) and signaling mechanisms leading to proliferation. Leukemia 2001, 15, 1286–1292. [Google Scholar] [CrossRef] [PubMed]
- Liu, Y. Chapter 1 TSLP in Epithelial Cell and Dendritic Cell Cross Talk. Adv. Immunol. 2009, 101, 1–25. [Google Scholar] [CrossRef] [PubMed]
- Levin, S.D.; Koelling, R.M.; Friend, S.L.; Isaksen, D.E.; Ziegler, S.F.; Perlmutter, R.M.; Farr, A.G. Thymic stromal lymphopoietin: A cytokine that promotes the development of IgM+ B cells in vitro and signals via a novel mechanism. J. Immunol. 1999, 162, 677–683. [Google Scholar]
- Davey, H.W.; Wilkins, R.J.; Waxman, D. STAT5 Signaling in Sexually Dimorphic Gene Expression and Growth Patterns. Am. J. Hum. Genet. 1999, 65, 959–965. [Google Scholar] [CrossRef]
- Semlali, A.; Jacques, E.; Koussih, L.; Gounni, A.S.; Chakir, J. Thymic stromal lymphopoietin–induced human asthmatic airway epithelial cell proliferation through an IL-13–dependent pathway. J. Allergy Clin. Immunol. 2010, 125, 844–850. [Google Scholar] [CrossRef] [PubMed]
- Ziegler, S.F.; Roan, F.; Bell, B.D.; Stoklasek, T.A.; Kitajima, M.; Han, H. The Biology of Thymic Stromal Lymphopoietin (TSLP). Adv. Pharmacol. 2013, 66, 129–155. [Google Scholar] [CrossRef]
- Grivennikov, S.I.; Greten, F.R.; Karin, M. Immunity, inflammation, and cancer. Cell 2010, 140, 883–899. [Google Scholar] [CrossRef] [PubMed]
- Shan, L.; Redhu, N.S.; Saleh, A.; Halayko, A.J.; Chakir, J.; Gounni, A.S. Thymic stromal lymphopoietin receptor-mediated IL-6 and CC/CXC chemokines expression in human airway smooth muscle cells: Role of MAPKs (ERK1/2, p38, and JNK) and STAT3 pathways. J. Immunol. 2010, 184, 7134–7143. [Google Scholar] [CrossRef] [PubMed]
- Colotta, F.; Allavena, P.; Sica, A.; Garlanda, C.; Mantovani, A. Cancer-related inflammation, the seventh hallmark of cancer: Links to genetic instability. Carcinogenesis 2009, 30, 1073–1081. [Google Scholar] [CrossRef]
- Li, H.; Zhao, H.; Yu, J.; Su, Y.; Cao, S.; An, X.; Ren, X. Increased prevalence of regulatory T cells in the lung cancer microenvironment: A role of thymic stromal lymphopoietin. Cancer Immunol. Immunother. 2011, 60, 1587–1596. [Google Scholar] [CrossRef]
- Papatriantafyllou, M. Tumour immunology: TSLP drives human tumour progression. Nat. Rev. Immunol. 2011, 11, 235. [Google Scholar] [CrossRef]
- Olkhanud, P.B.; Rochman, Y.; Bodogai, M.; Malchinkhuu, E.; Wejksza, K.; Xu, M.; Gress, R.E.; Hesdorffer, C.; Leonard, W.J.; Biragyn, A. Thymic Stromal Lymphopoietin Is a Key Mediator of Breast Cancer Progression. J. Immunol. 2011, 186, 5656–5662. [Google Scholar] [CrossRef]
- Sargurupremraj, M.; Pukelsheim, K.; Hofer, T.; Wjst, M. Intermediary quantitative traits—An alternative in the identification of disease genes in asthma? Genes Immun. 2014, 15, 1–7. [Google Scholar] [CrossRef]
- Hirota, T.; Takahashi, A.; Kubo, M.; Tsunoda, T.; Tomita, K.; Doi, S.; Fujita, K.; Miyatake, A.; Enomoto, T.; Miyagawa, T.; et al. Genome-wide association study identifies three new susceptibility loci for adult asthma in the Japanese population. Nat. Genet. 2011, 43, 893–896. [Google Scholar] [CrossRef]
- Sun, Y.; Wei, X.; Deng, J.; Zhang, J.; He, Z.; Yang, M.; Liang, S.; Chen, Z.; Qin, H. Association of IL1RL1 rs3771180 and TSLP rs1837253 variants with asthma in the Guangxi Zhuang population in China. J. Clin. Lab. Anal. 2019, 33, e22905. [Google Scholar] [CrossRef]
- Harada, M.; Hirota, T.; Jodo, A.I.; Hitomi, Y.; Sakashita, M.; Tsunoda, T.; Miyagawa, T.; Doi, S.; Kameda, M.; Fujita, K.; et al. Thymic Stromal Lymphopoietin Gene Promoter Polymorphisms Are Associated with Susceptibility to Bronchial Asthma. Am. J. Respir. Cell Mol. Biol. 2011, 44, 787–793. [Google Scholar] [CrossRef]
- Fang, L.; Martínez, B.; Marrugo, J. Distribution of three polymorphisms of the TSLP gen in African-descendent population from San Basilio de Palenque, Colombia. Biomédica 2014, 33, 251–258. [Google Scholar]
- Semlali, A.; Almutairi, M.H.; Alharbi, S.N.; Alamri, A.M.; Alrefaei, A.F.; Almutairi, B.O.; Rouabhia, M. The correlation between single nucleotide polymorphisms of the thymic stromal lymphopoietin receptor and breast cancer in a cohort of female patients in Saudi Arabia. Environ. Sci. Pollut. Res. 2021, 31, 1–11. [Google Scholar] [CrossRef]
- Langner, K.F.; Joetzke, A.E.; Nerschbach, V.; Eberle, N.; Schuberth, H.-J.; Koy, M.; Nolte, I.; Betz, D. Detection of clonal antigen receptor gene rearrangement in dogs with lymphoma by real-time polymerase chain reaction and melting curve analysis. BMC Vet. Res. 2014, 10, 1. [Google Scholar] [CrossRef]
- Semlali, A.; Al Amri, A.; Azzi, A.; Al Shahrani, O.; Arafah, M.; Kohailan, M.; Aljebreen, A.M.; Alharbi, O.; Almadi, M.A.; Azzam, N.A.; et al. Expression and New Exon Mutations of the Human Beta Defensins and Their Association on Colon Cancer Development. PLoS ONE 2015, 10, e0126868. [Google Scholar] [CrossRef] [PubMed]
- Semlali, A.; Almutairi, M.; Parine, N.R.; Al Amri, A.; Almeer, R.; Alanazi, M.S.; Rouabhia, M. Expression and allele frequencies of Thymic stromal lymphopoietin are a key factor of breast cancer risk. Mol. Genet. Genom. Med. 2019, 7, e813. [Google Scholar] [CrossRef]
- Disabled World. Aging: Associated Conditions, Diseases & Information; Disabled World: New York, NY, USA, 2015. [Google Scholar]
- Saudi Cancer Registry. Cancer Incidence Report Saudi Arabia 2010; Saudi Cancer Registry: Riyadh, Saudi Arabia, 2014.
- Semlali, A.; Almutairi, M.; Azzi, A.; Parine, N.R.; Alamri, A.; Alsulami, S.; Alumri, T.M.; Alanazi, M.S.; Rouabhia, M. TSLP and TSLP receptors variants are associated with smoking. Mol. Genet. Genom. Med. 2019, 7, e842. [Google Scholar] [CrossRef] [PubMed]
- Li, W.; Qiu, T.; Ling, Y.; Guo, L.; Li, L.; Ying, J. Molecular pathological epidemiology of colorectal cancer in Chinese patients with KRAS and BRAF mutations. Oncotarget 2015, 6, 39607–39613. [Google Scholar] [CrossRef] [PubMed][Green Version]
- Sakai, E.; Fukuyo, M.; Ohata, K.; Matsusaka, K.; Doi, N.; Mano, Y.; Takane, K.; Abe, H.; Yagi, K.; Matsuhashi, N.; et al. Genetic and epigenetic aberrations occurring in colorectal tumors associated with serrated pathway. Int. J. Cancer 2015, 138, 1634–1644. [Google Scholar] [CrossRef] [PubMed]
- Pearce, B.; Abrahams-October, Z.; Xhakaza, L.; Jacobs, C.; Benjeddou, M. Effect of the African-specific promoter polymorphisms on the SLC22A2 gene expression levels. Drug Metab. Pers. Ther. 2018, 33, 85–89. [Google Scholar] [CrossRef] [PubMed]
- Deng, N.; Zhou, H.; Fan, H.; Yuan, Y. Single nucleotide polymorphisms and cancer susceptibility. Oncotarget 2017, 8, 110635–110649. [Google Scholar] [CrossRef] [PubMed]
- Jeziorska, D.M.; Jordan, K.; Vance, K.W. A systems biology approach to understanding cis-regulatory module function. Semin. Cell Dev. Biol. 2009, 20, 856–862. [Google Scholar] [CrossRef] [PubMed]
- Kuan, E.L.; Ziegler, S.F. Thymic Stromal Lymphopoietin and Cancer. J. Immunol. 2014, 193, 4283–4288. [Google Scholar] [CrossRef]
- Sherrill, J.D.; Gao, P.-S.; Stucke, E.M.; Blanchard, C.; Collins, M.H.; Putnam, P.E.; Franciosi, J.P.; Kushner, J.P.; Abonia, J.P.; Assa’Ad, A.H.; et al. Variants of thymic stromal lymphopoietin and its receptor associate with eosinophilic esophagitis. J. Allergy Clin. Immunol. 2010, 126, 160–165. [Google Scholar] [CrossRef]
- Margolis, D.J.; Kim, B.; Apter, A.J.; Gupta, J.; Hoffstad, O.; Papadopoulos, M.; Mitra, N. Thymic stromal lymphopoietin variation, filaggrin loss of function, and the persistence of atopic dermatitis. JAMA Dermatol. 2014, 150, 254–259. [Google Scholar] [CrossRef]
- Cianferoni, A.; Spergel, J. The importance of TSLP in allergic disease and its role as a potential therapeutic target. Expert Rev. Clin. Immunol. 2014, 10, 1463–1474. [Google Scholar] [CrossRef]
- Zhang, Y.; Zhou, B. Functions of thymic stromal lymphopoietin in immunity and disease. Immunol. Res. 2012, 52, 211–223. [Google Scholar] [CrossRef]


| Gene | Forward Primer (5′-3′) | Reverse Primer (5′-3′) |
|---|---|---|
| TSLP | TATGAGTGGGACCAAAAGTACCG | GGGATTGAAGGTTAGGCT CTGG |
| TSLPR | GAGTGGCAGTCCAAACAGGAA | ACATCCTCCATAGCCTTCACC |
| IL-7R | TGGACGCATGTGAATTTATC | CATTCACTCCAGAAGCCTTT |
| GAPDH | GGTATCGTCGAAGGACTCATGAC | ATGCCAGTGAGCTTCCCGTTCAGC |
| Gene | SNP ID | Base Change | Position |
|---|---|---|---|
| TSLP | rs10043985 | A/C | Promoter |
| rs2289276 | C/T | Intron Variant | |
| TSLPR | rs36139698 | C/T | Exon |
| rs36177645 | A/G | Exon | |
| rs36133495 | C/T | Exon | |
| IL-7R | rs12516866 | G/T | Intron Variant |
| rs1053496 | C/T | Downstream Non Coding Transcript Variant |
| Characteristic | CRC Case | Control | |
|---|---|---|---|
| Samples No. (%) | --- | 112 (100%) | 108 (100%) |
| Gender | Male | 64 (57.14%) | 61 (56.48%) |
| Female | 48 (42.86%) | 47 (43.52%) | |
| Age | Above 57 | 47 (41.96%) | 56 (42.59%) |
| Below 57 | 65 (58.04%) | 62 (57.41%) | |
| Tumor Localization | Colon | 61 (54.46%) | --- |
| Rectum | 51 (45.54%) | --- |
| Gene | SNP ID | Genotype | Cases | Controls | OR | (95% CI) | χ2-Value | p-Value * |
|---|---|---|---|---|---|---|---|---|
| TSLP | rs10043985 | AA | 51 (0.46) | 100 (0.93) | Ref | |||
| AC | 59 (0.54) | 7 (0.07) | 16.52 | 7.042–38.783 | 56.84 | <0.0001 * | ||
| CC | 0 (0) | 0 (0) | ||||||
| AC+CC | 59 (0.54) | 7 (0.07) | 16.527 | 7.042–38.783 | 56.84 | <0.0001 * | ||
| A | 161 (0.73) | 207 (0.97) | Ref | |||||
| C | 59 (0.27) | 7 (0.03) | 10.837 | 4.820–24.363 | 46.65 | <0.0001 * | ||
| rs2289276 | CC | 50 (0.49) | 47 (0.44) | Ref | ||||
| CT | 41 (0.40) | 51 (0.48) | 0.756 | 0.426–1.339 | 0.92 | 0.33702 | ||
| TT | 12 (0.11) | 9 (0.08) | 1.253 | 0.484–3.246 | 0.22 | 0.64147 | ||
| CT+TT | 53 (0.51) | 60 (0.56) | 0.830 | 0.482–1.429 | 0.45 | 0.50215 | ||
| C | 141 (0.68) | 145 (0.68) | Ref | |||||
| T | 65 (0.32) | 69 (0.32) | 0.969 | 0.643–1.460 | 0.02 | 0.87952 | ||
| TSLPR | rs36133495 | CC | 15 (0.14) | 16 (0.14) | Ref | |||
| CT | 47 (0.46) | 53 (0.49) | 0.946 | 0.422–2.119 | 0.02 | 0.89250 | ||
| TT | 41 (0.40) | 40 (0.37) | 1.093 | 0.478–2.503 | 0.04 | 0.83273 | ||
| CT+TT | 88 (0.86) | 93 (0.86) | 1.009 | 0.471–2.163 | 0.00 | 0.98097 | ||
| C | 77 (0.37) | 85 (0.39) | Ref | |||||
| T | 129 (0.63) | 133 (0.61) | 1.071 | 0.723–1.585 | 0.12 | 0.73275 | ||
| rs36177645 | AA | 6 (0.06) | 5 (0.06) | Ref | ||||
| AG | 42 (0.42) | 41 (0.46) | 0.854 | 0.242–3.017 | 0.06 | 0.80582 | ||
| GG | 52 (0.52) | 43 (0.48) | 1.008 | 0.288–3.53 | 0.00 | 0.99037 | ||
| AG+GG | 94 (0.94) | 84 (0.94) | 0.933 | 0.275–3.167 | 0.01 | 0.91085 | ||
| A | 54 (0.27) | 51 (0.29) | Ref | |||||
| G | 146 (0.63) | 127 (0.71) | 1.086 | 0.692–1.704 | 0.13 | 0.72044 | ||
| rs36139698 | CC | 4 (0.04) | 4 (0.04) | Ref | ||||
| CT | 28 (0.26) | 37 (0.34) | 0.757 | 0.174–3.292 | 0.14 | 0.70960 | ||
| TT | 76 (0.70) | 69 (0.62) | 1.101 | 0.265–4.574 | 0.02 | 0.89414 | ||
| CT+TT | 104 (0.96) | 106 (0.96) | 0.981 | 0.239–4.027 | 0.00 | 0.97891 | ||
| C | 36 (0.17) | 45 (0.20) | Ref | |||||
| T | 180 (0.83) | 175 (0.80) | 1.286 | 0.791–2.089 | 1.03 | 0.30926 | ||
| IL-7R | rs1053496 | CC | 33 (0.30) | 17 (0.18) | Ref | |||
| CT | 38 (0.35) | 37 (0.44) | 0.529 | 0.252–1.109 | 2.87 | 0.08999 | ||
| TT | 39 (0.35) | 43 (0.38) | 0.467 | 0.226–0.968 | 4.26 | 0.03903 * | ||
| CT+TT | 77 (0.70) | 80 (0.82) | 0.496 | 0.255–0.963 | 4.38 | 0.03640 * | ||
| C | 104 (0.47) | 71 (0.37) | Ref | |||||
| T | 116 (0.53) | 123 (0.63) | 0.644 | 0.434–0.955 | 4.8 | 0.02823 * | ||
| rs12516866 | GG | 47 (0.43) | 50 (0.46) | Ref | ||||
| GT | 55 (0.50) | 44 (0.40) | 1.330 | 0.758–2.332 | 0.99 | 0.31971 | ||
| TT | 8 (0.07) | 15 (0.14) | 0.567 | 0.220–1.461 | 1.40 | 0.23679 | ||
| GT+TT | 63 (0.57) | 59 (0.54) | 1.136 | 0.666–1.937 | 0.22 | 0.63952 | ||
| G | 149 (0.68) | 144 (0.66) | Ref | |||||
| T | 71 (0.32) | 74 (0.34) | 0.927 | 0.623–1.381 | 0.14 | 0.71001 |
| Gene | SNP ID | Genotype | Cases | Controls | OR | (95% CI) | χ2-Value | p-Value * |
|---|---|---|---|---|---|---|---|---|
| TSLP | rs10043985 | AA | 25 (0.46) | 59 (0.94) | Ref | |||
| AC | 29 (0.54) | 4 (0.06) | 17.11 | 5.443–53.781 | 32.20 | <0.0001 * | ||
| CC | 0 (0) | 0 (0) | ||||||
| AC+CC | 29 (0.54) | 4 (0.06) | 17.110 | 5.443–53.781 | 32.20 | <0.0001 * | ||
| A | 79 (0.73) | 122 (0.97) | Ref | |||||
| C | 29 (0.27) | 4 (0.03) | 11.196 | 3.79–33.069 | 26.91 | <0.0001 * | ||
| rs2289276 | CC | 22 (0.44) | 29 (0.47) | Ref | ||||
| CT | 19 (0.38) | 26 (0.43) | 0.963 | 0.428–2.167 | 0.01 | 0.92793 | ||
| TT | 9 (0.18) | 6 (0.1) | 1.977 | 0.612–6.385 | 1.32 | 0.25001 | ||
| CT+TT | 28 (0.56) | 32 (0.53) | 1.153 | 0.544–2.445 | 0.14 | 0.70955 | ||
| C | 63 (0.63) | 84 (0.69) | Ref | |||||
| T | 37 (0.37) | 38 (0.31) | 1.298 | 0.743–2.269 | 0.84 | 0.35899 | ||
| TSLPR | rs36139698 | CC | 6 (0.12) | 11 (0.17) | Ref | |||
| CT | 25 (0.50) | 33 (0.51) | 1.389 | 0.452–4.266 | 0.33 | 0.56528 | ||
| TT | 19 (0.38) | 21 (0.32) | 1.659 | 0.514–5.357 | 0.72 | 0.39555 | ||
| CT+TT | 44 (0.88) | 54 (0.83) | 1.494 | 0.512–4.361 | 0.54 | 0.46089 | ||
| C | 37 (0.37) | 55 (0.42) | Ref | |||||
| T | 63 (0.63) | 75 (0.58) | 1.249 | 0.732–2.131 | 0.66 | 0.41534 | ||
| rs36177645 | AA | 2 (0.04) | 5 (0.1) | Ref | ||||
| AG | 23 (0.47) | 25 (0.45) | 2.300 | 0.406–13.037 | 0.92 | 0.33692 | ||
| GG | 24 (0.49) | 25 (0.45) | 2.400 | 0.424–13.576 | 1.03 | 0.31118 | ||
| AG+GG | 47 (0.96) | 50 (0.90) | 2.350 | 0.435–12.704 | 1.04 | 0.30880 | ||
| A | 27 (0.28) | 35 (0.32) | Ref | |||||
| G | 71 (0.72) | 75 (0.68) | 1.227 | 0.675–2.231 | 0.45 | 0.50184 | ||
| rs36133495 | CC | 2 (0.04) | 4 (0.06) | Ref | ||||
| CT | 15 (0.28) | 22 (0.34) | 1.364 | 0.221–8.415 | 0.11 | 0.73767 | ||
| TT | 37 (0.68) | 39 (0.60) | 1.897 | 0.328–10.984 | 0.53 | 0.46854 | ||
| CT+TT | 52 (0.96) | 61 (0.94) | 1.705 | 0.300–9.687 | 0.37 | 0.54309 | ||
| C | 19 (0.18) | 30 (0.23) | Ref | |||||
| T | 89 (0.82) | 100 (0.77) | 1.405 | 0.740–2.670 | 1.09 | 0.29752 | ||
| IL-7R | rs1053496 | CC | 16 (0.30) | 9 (0.15) | Ref | |||
| CT | 18 (0.33) | 22 (0.37) | 0.460 | 0.165–1.285 | 2.23 | 0.13568 | ||
| TT | 20 (0.37) | 29 (0.48) | 0.388 | 0.143–1.050 | 3.56 | 0.05913 | ||
| CT+TT | 38 (0.70) | 51 (0.85) | 0.419 | 0.167–1.050 | 3.55 | 0.05944 | ||
| C | 50 (0.46) | 40 (0.33) | Ref | |||||
| T | 58 (0.54) | 80 (0.67) | 0.580 | 0.339–0.991 | 4.00 | 0.04556 * | ||
| rs12516866 | GG | 23 (0.43) | 31 (0.48) | Ref | ||||
| GT | 28 (0.52) | 24 (0.38) | 1.572 | 0.730–3.386 | 1.34 | 0.24636 | ||
| TT | 3 (0.05) | 9 (0.14) | 0.449 | 0.109–1.847 | 1.27 | 0.25925 | ||
| GT+TT | 31 (0.57) | 33 (0.52) | 1.266 | 0.611–2.624 | 0.40 | 0.52548 | ||
| G | 74 (0.69) | 86 (0.67) | Ref | |||||
| T | 34 (0.31) | 42 (0.33) | 0.941 | 0.544–1.628 | 0.05 | 0.82742 |
| Gene | SNP ID | Genotype | Cases | Controls | OR | (95% CI) | χ2-Value | p-Value * |
|---|---|---|---|---|---|---|---|---|
| TSLP | rs10043985 | AA | 26 (0.46) | 41 (0.93) | Ref | |||
| AC | 30 (0.54) | 3 (0.07) | 15.769 | 4.365–56.973 | 24.36 | <0.0001 * | ||
| CC | 0 (0) | 0 (0) | ||||||
| AC+CC | 30 (0.54) | 3 (0.07) | 15.769 | 4.365–56.973 | 24.36 | <0.0001 * | ||
| A | 82 (0.73) | 85 (0.97) | Ref | |||||
| C | 30 (0.27) | 3 (0.03) | 10.366 | 3.045–35.286 | 19.55 | <0.0001 * | ||
| rs2289276 | CC | 28 (0.53) | 18 (0.4) | Ref | ||||
| CT | 22 (0.41) | 25 (0.54) | 0.566 | 0.248–1.290 | 1.85 | 0.17390 | ||
| TT | 3 (0.06) | 3 (0.06) | 0.643 | 0.117–3.541 | 0.26 | 0.60980 | ||
| CT+TT | 25 (0.47) | 28 (0.60) | 0.574 | 0.258–1.279 | 1.86 | 0.17285 | ||
| C | 78 (0.74) | 61 (0.66) | Ref | |||||
| T | 28 (0.26) | 31 (0.34) | 0.706 | 0.383–1.301 | 1.25 | 0.26393 | ||
| TSLPR | rs36139698 | CC | 9 (0.17) | 5 (0.11) | Ref | |||
| CT | 22 (0.41) | 20 (0.46) | 0.611 | 0.175–2.132 | 0.60 | 0.43776 | ||
| TT | 22 (0.41) | 19 (0.43) | 0.643 | 0.184–2.254 | 0.48 | 0.48877 | ||
| CT+TT | 44 (0.83) | 39 (0.89) | 0.627 | 0.194–2.030 | 0.61 | 0.43317 | ||
| C | 40 (0.38) | 30 (0.34) | Ref | |||||
| T | 66 (0.62) | 58 (0.66) | 0.853 | 0.473–1.540 | 0.28 | 0.59869 | ||
| rs36177645 | AA | 4 (0.08) | 0 (0.00) | Ref | ||||
| AG | 19 (0.37) | 16 (0.47) | 0.131 | 0.007–2.623 | 3.10 | 0.07826 | ||
| GG | 28 (0.55) | 18 (0.53) | 0.171 | 0.009–3.369 | 2.45 | 0.11785 | ||
| AG+GG | 47 (0.92) | 34 (1.00) | 0.153 | 0.008–2.936 | 2.80 | 0.09436 | ||
| A | 27 (0.26) | 16 (0.24) | Ref | |||||
| G | 75 (0.74) | 52 (0.76) | 0.855 | 0.419–1.743 | 0.19 | 0.66561 | ||
| rs36133495 | CC | 2 (0.04) | 0 (0.00) | Ref | ||||
| CT | 13 (0.24) | 15 (0.33) | 0.174 | 0.008–3.956 | 2.14 | 0.14323 | ||
| TT | 39 (0.72) | 30 (0.67) | 0.259 | 0.012–5.596 | 1.51 | 0.21978 | ||
| CT+TT | 52 (0.96) | 45 (1.0) | 0.231 | 0.011–4.933 | 1.70 | 0.19215 | ||
| C | 17 (0.16) | 15 (0.17) | Ref | |||||
| T | 91 (0.84) | 75 (0.83) | 1.071 | 0.501–2.286 | 0.03 | 0.86010 | ||
| IL-7R | rs1053496 | CC | 17 (0.30) | 8 (0.22) | Ref | |||
| CT | 20 (0.36) | 15 (0.41) | 0.627 | 0.214–1.837 | 0.73 | 0.39379 | ||
| TT | 19 (0.34) | 14 (0.37) | 0.639 | 0.215–1.895 | 0.66 | 0.41779 | ||
| CT+TT | 39 (0.70) | 29 (0.78) | 0.633 | 0.240–1.666 | 0.86 | 0.35235 | ||
| C | 54 (0.48) | 31 (0.42) | Ref | |||||
| T | 58 (0.52) | 43 (0.58) | 0.774 | 0.428–1.400 | 0.72 | 0.39688 | ||
| rs12516866 | GG | 24 (0.42) | 19 (0.42) | Ref | ||||
| GT | 27 (0.48) | 20 (0.44) | 1.069 | 0.464–2.462 | 0.02 | 0.87592 | ||
| TT | 5 (0.09) | 6 (0.13) | 0.660 | 0.174–2.496 | 0.38 | 0.53863 | ||
| GT+TT | 32 (0.57) | 26 (0.57) | 0.974 | 0.441–2.155 | 0.00 | 0.94886 | ||
| G | 75 (0.67) | 58 (0.64) | Ref | |||||
| T | 37 (0.33) | 32 (0.36) | 0.894 | 0.499–1.604 | 0.14 | 0.7074 |
| Gene | SNP ID | Genotype | Cases | Controls | OR | (95% CI) | χ2-Value | p-Value * |
|---|---|---|---|---|---|---|---|---|
| TSLP | rs10043985 | AA | 26 (0.42) | 55 (0.93) | Ref | |||
| AC | 36 (0.58) | 4 (0.07) | 19.038 | 6.129–59.139 | 35.93 | <0.0001 * | ||
| CC | 0 (0) | 0 (0) | ||||||
| AC+CC | 36 (0.58) | 4 (0.07) | 19.038 | 6.129–59.139 | 35.93 | <0.0001 * | ||
| A | 88 (0.71) | 114 (0.97) | Ref | |||||
| C | 36 (0.29) | 4 (0.03) | 11.659 | 4.000–33.983 | 28.82 | <0.0001 * | ||
| rs2289276 | CC | 30 (0.51) | 26 (0.45) | Ref | ||||
| CT | 25 (0.42) | 27 (0.46) | 0.802 | 0.377–1.709 | 0.33 | 0.56819 | ||
| TT | 4 (0.07) | 5 (0.09) | 0.693 | 0.168–2.856 | 0.26 | 0.61087 | ||
| CT+TT | 29 (0.49) | 32 (0.55) | 0.785 | 0.380–1.625 | 0.42 | 0.51458 | ||
| C | 85 (0.72) | 79 (0.68) | Ref | |||||
| T | 33 (0.28) | 37 (0.32) | 0.829 | 0.473–1.452 | 0.43 | 0.51149 | ||
| TSLPR | rs36139698 | CC | 10 (0.17) | 10 (0.17) | Ref | |||
| CT | 29 (0.48) | 31 (0.52) | 0.935 | 0.340–2.574 | 0.02 | 0.89725 | ||
| TT | 21 (0.35) | 19 (0.31) | 1.105 | 0.378–3.235 | 0.03 | 0.85505 | ||
| CT+TT | 50 (0.83) | 50 (0.83) | 1.000 | 0.383–2.612 | 0.00 | 1.000 | ||
| C | 49 (0.41) | 51 (0.43) | Ref | |||||
| T | 71 (0.59) | 69 (0.57) | 1.071 | 0.641–1.789 | 0.07 | 0.79343 | ||
| rs36177645 | AA | 3 (0.05) | 4 (0.08) | Ref | ||||
| AG | 27 (0.5) | 19 (0.39) | 1.895 | 0.380–9.459 | 0.62 | 0.43088 | ||
| GG | 25 (0.45) | 26 (0.53) | 1.282 | 0.260–6.315 | 0.09 | 0.75964 | ||
| AG+GG | 52 (0.55) | 45 (0.92) | 1.541 | 0.327–7.254 | 0.30 | 0.58209 | ||
| A | 33 (0.30) | 27 (0.28) | Ref | |||||
| G | 77 (0.70) | 71 (0.72) | 0.887 | 0.486–1.620 | 0.15 | 0.69716 | ||
| rs36133495 | CC | 2 (0.03) | 3 (0.05) | Ref | ||||
| CT | 19 (0.31) | 17 (0.28) | 1.676 | 0.249–11.266 | 0.29 | 0.59222 | ||
| TT | 40 (0.66) | 41 (0.67) | 1.463 | 0.232–9.228 | 0.17 | 0.68376 | ||
| CT+TT | 59 (0.97) | 58 (0.95) | 1.526 | 0.246–9.470 | 0.21 | 0.64791 | ||
| C | 23 (0.19) | 23 (0.19) | Ref | |||||
| T | 99 (0.81) | 99 (0.81) | 1.000 | 0.526–1.900 | 0.00 | 1.00 | ||
| IL-7R | rs1053496 | CC | 22 (0.35) | 9 (0.17) | Ref | |||
| CT | 20 (0.32) | 20 (0.37) | 0.409 | 0.152–1.104 | 3.18 | 0.07464 | ||
| TT | 21 (0.33) | 25 (0.46) | 0.344 | 0.130–0.905 | 4.81 | 0.02824 * | ||
| CT+TT | 41 (0.65) | 45 (0.63) | 0.373 | 0.154–0.902 | 4.97 | 0.02572 * | ||
| C | 64 (0.51) | 38 (0.35) | Ref | |||||
| T | 62 (0.49) | 70 (0.65) | 0.526 | 0.310–0.891 | 5.76 | 0.01638 * | ||
| rs12516866 | GG | 27 (0.43) | 29 (0.48) | Ref | ||||
| GT | 31 (0.49) | 22 (0.37) | 1.513 | 0.710–3.227 | 1.15 | 0.28251 | ||
| TT | 5 (0.08) | 9 (0.15) | 0.597 | 0.178–2.006 | 0.71 | 0.40105 | ||
| GT+TT | 36 (0.57) | 31 (0.52) | 1.247 | 0.613–2.539 | 0.37 | 0.54213 | ||
| G | 85 (0.67) | 80 (0.67) | Ref | |||||
| T | 41 (0.33) | 40 (0.33) | 0.965 | 0.567–1.642 | 0.02 | 0.89467 |
| Gene | SNP ID | Genotype | Cases | Controls | OR | (95% CI) | χ2-Value | p-Value * |
|---|---|---|---|---|---|---|---|---|
| TSLP | rs10043985 | AA | 25 (0.52) | 43 (0.93) | Ref | |||
| AC | 23 (0.48) | 3 (0.07) | 13.187 | 3.593–48.395 | 20.12 | <0.0001 * | ||
| CC | 0 (0) | 0 (0) | ||||||
| AC+CC | 23 (0.48) | 3 (0.07) | 13.187 | 3.593–48.395 | 20.12 | <0.0001 * | ||
| A | 73 (0.76) | 89 (0.97) | Ref | |||||
| C | 23 (0.24) | 3 (0.03) | 9.347 | 2.699–32.374 | 16.89 | <0.0001 * | ||
| rs2289276 | CC | 20 (0.46) | 20 (0.43) | Ref | ||||
| CT | 16 (0.36) | 24 (0.51) | 0.667 | 0.275–1.616 | 0.81 | 0.36869 | ||
| TT | 8 (0.18) | 3 (0.06) | 2.667 | 0.617–11.535 | 1.80 | 0.17973 | ||
| CT+TT | 24 (0.54) | 27 (0.57) | 0.889 | 0.388–2.036 | 0.08 | 0.78050 | ||
| C | 56 (0.64) | 64 (0.68) | Ref | |||||
| T | 32 (0.36) | 30 (0.32) | 1.219 | 0.660–2.252 | 0.40 | 0.52684 | ||
| TSLPR | rs36139698 | CC | 5 (0.11) | 6 (0.13) | Ref | |||
| CT | 18 (0.42) | 22 (0.47) | 0.982 | 0.257–3.751 | 0.00 | 0.97859 | ||
| TT | 20 (0.47) | 19 (0.40) | 1.263 | 0.330–4.837 | 0.12 | 0.73281 | ||
| CT+TT | 38 (0.89) | 41 (0.87) | 1.112 | 0.314–3.945 | 0.03 | 0.86922 | ||
| C | 28 (0.33) | 34 (0.36) | Ref | |||||
| T | 58 (0.67) | 60 (0.64) | 1.174 | 0.633–2.175 | 0.26 | 0.61046 | ||
| Rs36177645 | AA | 3 (0.07) | 1 (0.02) | Ref | ||||
| AG | 15 (0.33) | 22 (0.58) | 0.227 | 0.022–2.398 | 1.74 | 0.18708 | ||
| GG | 27 (0.60) | 15 (0.40) | 0.600 | 0.057–6.288 | 0.18 | 0.66726 | ||
| AG+GG | 42 (0.93) | 37 (0.98) | 0.378 | 0.038–3.796 | 0.73 | 0.39246 | ||
| A | 21 (0.04) | 24 (0.31) | Ref | |||||
| G | 69 (0.2) | 52 (0.68) | 1.516 | 0.763–3.016 | 1.42 | 0.23377 | ||
| Rs36133495 | CC | 2 (0.04) | 1 (0.02) | Ref | ||||
| CT | 9 (0.2) | 20 (0.43) | 0.225 | 0.018–2.813 | 1.53 | 0.21609 | ||
| TT | 36 (0.76) | 26 (0.55) | 0.692 | 0.060–8.046 | 0.09 | 0.76777 | ||
| CT+TT | 45 (0.96) | 46 (0.98) | 0.489 | 0.043–5.586 | 0.34 | 0.55734 | ||
| C | 13 (0.14) | 22 (0.23) | Ref | |||||
| T | 81 (0.86) | 72 (0.77) | 1.904 | 0.894–4.053 | 2.84 | 0.09173 | ||
| IL-7R | rs1053496 | CC | 11 (0.23) | 7 (0.17) | Ref | |||
| CT | 18 (0.38) | 17 (0.41) | 0.674 | 0.212–2.142 | 0.45 | 0.50245 | ||
| TT | 18 (0.38) | 17 (0.41) | 0.674 | 0.212–2.142 | 0.45 | 0.50245 | ||
| CT+TT | 36 (0.76) | 34 (0.82) | 0.674 | 0.234–1.939 | 0.54 | 0.46266 | ||
| C | 40 (0.43) | 31 (0.38) | Ref | |||||
| T | 54 (0.57) | 51 (0.62) | 0.821 | 0.448–1.503 | 0.41 | 0.52182 | ||
| rs12516866 | GG | 20 (0.43) | 20 (0.43) | Ref | ||||
| GT | 24 (0.51) | 22 (0.46) | 1.091 | 0.467–2.547 | 0.04 | 0.84057 | ||
| TT | 3 (0.06) | 5 (0.1) | 0.600 | 0.126–2.855 | 0.42 | 0.51824 | ||
| GT+TT | 27 (0.57) | 27 (0.56) | 1.000 | 0.441–2.265 | 0.00 | 1.000 | ||
| G | 64 (0.68) | 62 (0.66) | Ref | |||||
| T | 30 (0.32) | 32 (0.34) | 0.908 | 0.494–1.669 | 0.10 | 0.75636 |
| Gene | SNP ID | Genotype | Cases | Controls | OR | (95% CI) | χ2-Value | p-Value * |
|---|---|---|---|---|---|---|---|---|
| TSLP | rs10043985 | AA | 27 (0.44) | 100 (0.93) | Ref | |||
| AC | 34 (0.56) | 7 (0.07) | 17.989 | 7.185–45.044 | 50.97 | <0.0001 * | ||
| CC | 0 (0) | 0 (0) | ||||||
| AC+CC | 34 (0.56) | 7 (0.07) | 17.989 | 7.185–45.044 | 50.97 | <0.0001 * | ||
| A | 88 (0.72) | 207 (0.97) | Ref | |||||
| C | 34 (0.28) | 7 (0.03) | 11.425 | 4.879–26.754 | 43.88 | <0.0001 * | ||
| rs2289276 | CC | 30 (0.50) | 47 (0.44) | Ref | ||||
| CT | 23 (0.38) | 51 (0.48) | 0.707 | 0.361–1.384 | 1.03 | 0.31049 | ||
| TT | 7 (0.12) | 9 (0.08) | 1.219 | 0.410–3.620 | 0.13 | 0.72175 | ||
| CT+TT | 30 (0.50) | 60 (0.56) | 0.783 | 0.416–1.477 | 0.57 | 0.44989 | ||
| C | 83 (0.69) | 145 (0.68) | Ref | |||||
| T | 37 (0.31) | 69 (0.32) | 0.937 | 0.579–1.517 | 0.07 | 0.79058 | ||
| TSLPR | rs36139698 | CC | 7 (0.12) | 16 (0.14) | Ref | |||
| CT | 31 (0.53) | 53 (0.49) | 1.337 | 0.495–3.607 | 0.33 | 0.56564 | ||
| TT | 20 (0.35) | 40 (0.37) | 1.143 | 0.405–3.226 | 0.06 | 0.80082 | ||
| CT+TT | 51 (0.88) | 93 (0.86) | 1.253 | 0.484–3.246 | 0.22 | 0.64123 | ||
| C | 45 (0.39) | 85 (0.39) | Ref | |||||
| T | 71 (0.61) | 133 (0.61) | 1.008 | 0.635–1.601 | 0.00 | 0.97185 | ||
| rs36177645 | AA | 3 (0.05) | 5 (0.06) | Ref | ||||
| AG | 26 (0.46) | 41 (0.46) | 1.057 | 0.233–4.800 | 0.01 | 0.94285 | ||
| GG | 27 (0.48) | 43 (0.48) | 1.047 | 0.231–4.738 | 0.00 | 0.95294 | ||
| AG+GG | 53 (0.94) | 84 (0.94) | 1.052 | 0.241–4.583 | 0.00 | 0.94660 | ||
| A | 32 (0.29) | 51 (0.29) | Ref | |||||
| G | 80 (0.71) | 127 (0.71) | 1.004 | 0.595–1.694 | 0.00 | 0.98825 | ||
| rs36133495 | CC | 2 (0.03) | 4 (0.04) | Ref | ||||
| CT | 17 (0.28) | 37 (0.34) | 0.919 | 0.153–5.514 | 0.01 | 0.92629 | ||
| TT | 42 (0.69) | 69 (0.62) | 1.217 | 0.214–6.937 | 0.05 | 0.82442 | ||
| CT+TT | 59 (0.97) | 106 (0.96) | 1.113 | 0.198–6.26 | 0.01 | 0.90308 | ||
| C | 21 (0.17) | 45 (0.20) | Ref | |||||
| T | 101 (0.83) | 175 (0.80) | 1.237 | 0.697–2.193 | 0.53 | 0.46684 | ||
| IL-7R | rs1053496 | CC | 16 (0.26) | 17 (0.18) | Ref | |||
| CT | 23 (0.38) | 37 (0.44) | 0.660 | 0.280–1.558 | 0.90 | 0.34250 | ||
| TT | 22 (0.36) | 43 (0.38) | 0.544 | 0.231–1.277 | 1.98 | 0.15984 | ||
| CT+TT | 0 (0.74) | 80 (0.82) | 0.598 | 0.276–1.296 | 1.72 | 0.19009 | ||
| C | 55 (0.45) | 71 (0.37) | Ref | |||||
| T | 67 (0.55) | 123 (0.63) | 0.703 | 0.443–1.115 | 2.25 | 0.13373 | ||
| rs12516866 | GG | 23 (0.38) | 50 (0.46) | Ref | ||||
| GT | 33 (0.54) | 44 (0.40) | 1.630 | 0.835–3.183 | 2.06 | 0.15086 | ||
| TT | 5 (0.08) | 15 (0.14) | 0.725 | 0.235–2.235 | 0.32 | 0.57410 | ||
| GT+TT | 38 (0.62) | 59 (0.54) | 1.400 | 0.738–2.656 | 1.06 | 0.30216 | ||
| G | 79 (0.65) | 144 (0.66) | Ref | |||||
| T | 43 (0.35) | 74 (0.34) | 1.059 | 0.665–1.687 | 0.06 | 0.80863 |
| Gene | SNP ID | Genotype | Cases | Controls | OR | (95% CI) | χ2-Value | p-Value * |
|---|---|---|---|---|---|---|---|---|
| TSLP | rs10043985 | AA | 21 (0.58) | 100 (0.93) | Ref | |||
| AC | 15 (0.42) | 7 (0.07) | 10.204 | 3.705–28.101 | 25.53 | <0.0001 * | ||
| CC | 0 (0) | 0 (0) | ||||||
| AC+CC | 15 (0.42) | 7 (0.07) | 10.204 | 3.705–28.101 | 25.53 | <0.0001 * | ||
| A | 57 (0.79) | 207 (0.97) | Ref | |||||
| C | 15 (0.21) | 7 (0.33) | 7.782 | 3.028–19.998 | 23.40 | <0.0001 * | ||
| rs2289276 | CC | 14 (0.42) | 47 (0.44) | Ref | ||||
| CT | 14 (0.42) | 51 (0.48) | 0.922 | 0.398–2.135 | 0.04 | 0.84886 | ||
| TT | 5 (0.15) | 9 (0.08) | 1.865 | 0.537–6.480 | 0.98 | 0.32204 | ||
| CT+TT | 19 (0.57) | 60 (0.56) | 1.063 | 0.483–2.340 | 0.02 | 0.87917 | ||
| C | 42 (0.64) | 145 (0.68) | Ref | |||||
| T | 24 (0.36) | 69 (0.32) | 1.201 | 0.674–2.140 | 0.39 | 0.53435 | ||
| TSLPR | rs36139698 | CC | 3 (0.1) | 16 (0.14) | Ref | |||
| CT | 12 (0.36) | 53 (0.49) | 1.208 | 0.303–4.815 | 0.07 | 0.78907 | ||
| TT | 18 (0.55) | 40 (0.37) | 2.400 | 0.620–9.284 | 1.68 | 0.19533 | ||
| CT+TT | 30 (91) | 93 (0.86) | 1.720 | 0.469–6.313 | 0.68 | 0.40874 | ||
| C | 18 (0.27) | 85 (0.39) | Ref | |||||
| T | 48 (0.73) | 133 (0.61) | 1.704 | 0.930–3.125 | 3.01 | 0.08277 | ||
| rs36177645 | AA | 2 (0.06) | 5 (0.06) | Ref | ||||
| AG | 8 (0.26) | 41 (0.46) | 0.488 | 0.080–2.970 | 0.63 | 0.42879 | ||
| GG | 21 (0.68) | 43 (0.48) | 1.221 | 0.218–6.824 | 0.05 | 0.81992 | ||
| AG+GG | 29 (0.94) | 84 (0.94) | 0.863 | 0.159–4.693 | 0.03 | 0.86458 | ||
| A | 12 (0.2) | 51 (0.29) | Ref | |||||
| G | 50 (0.8) | 127 (0.71) | 1.673 | 0.824–3.400 | 2.05 | 0.15191 | ||
| rs36133495 | CC | 1 (0.03) | 4 (0.04) | Ref | ||||
| CT | 6 (0.17) | 37 (0.34) | 0.649 | 0.062–6.835 | 0.13 | 0.71692 | ||
| TT | 28 (0.8) | 69 (0.62) | 1.623 | 0.174–15.169 | 0.18 | 0.66823 | ||
| CT+TT | 34 (0.25) | 106 (0.96) | 1.283 | 0.139–11.874 | 0.05 | 0.82583 | ||
| C | 8 (0.11) | 45 (0.20) | Ref | |||||
| T | 62 (0.89) | 175 (0.80) | 1.993 | 0.890–4.461 | 2.90 | 0.08877 | ||
| IL-7R | rs1053496 | CC | 10 (0.28) | 17 (0.18) | Ref | |||
| CT | 12 (0.33) | 37 (0.44) | 0.551 | 0.199–1.524 | 1.33 | 0.24837 | ||
| TT | 14 (0.39) | 43 (0.38) | 0.553 | 0.206–1.485 | 1.40 | 0.23718 | ||
| CT+TT | 26 (0.72) | 80 (0.82) | 0.552 | 0.225–1.356 | 1.71 | 0.19156 | ||
| C | 32 (0.44) | 71 (0.37) | Ref | |||||
| T | 40 (0.56) | 123 (0.63) | 0.722 | 0.417–1.249 | 1.36 | 0.24310 | ||
| rs12516866 | GG | 16 (0.44) | 50 (0.46) | Ref | ||||
| GT | 18 (0.50) | 44 (0.40) | 1.278 | 0.583–2.805 | 0.38 | 0.53976 | ||
| TT | 2 (0.06) | 15 (0.14) | 0.417 | 0.086–2.021 | 1.24 | 0.26562 | ||
| GT+TT | 20 (0.56) | 59 (0.54) | 1.059 | 0.497–2.26 | 0.02 | 0.88149 | ||
| G | 50 (0.70) | 144 (0.66) | Ref | |||||
| T | 22 (0.30) | 74 (0.34) | 0.856 | 0.482–1.521 | 0.28 | 0.59619 |
Publisher’s Note: MDPI stays neutral with regard to jurisdictional claims in published maps and institutional affiliations. |
© 2021 by the authors. Licensee MDPI, Basel, Switzerland. This article is an open access article distributed under the terms and conditions of the Creative Commons Attribution (CC BY) license (https://creativecommons.org/licenses/by/4.0/).
Share and Cite
Semlali, A.; Almutairi, M.H.; Alamri, A.; Reddy Parine, N.; Arafah, M.; Almadi, M.A.; Aljebreen, A.M.; Alharbi, O.; Azzam, N.A.; Almutairi, R.; et al. Expression and Polymorphism of TSLP/TSLP Receptors as Potential Diagnostic Markers of Colorectal Cancer Progression. Genes 2021, 12, 1386. https://doi.org/10.3390/genes12091386
Semlali A, Almutairi MH, Alamri A, Reddy Parine N, Arafah M, Almadi MA, Aljebreen AM, Alharbi O, Azzam NA, Almutairi R, et al. Expression and Polymorphism of TSLP/TSLP Receptors as Potential Diagnostic Markers of Colorectal Cancer Progression. Genes. 2021; 12(9):1386. https://doi.org/10.3390/genes12091386
Chicago/Turabian StyleSemlali, Abdelhabib, Mikhlid H. Almutairi, Abdullah Alamri, Narasimha Reddy Parine, Maha Arafah, Majid A. Almadi, Abdulrahman M. Aljebreen, Othman Alharbi, Nahla Ali Azzam, Riyadh Almutairi, and et al. 2021. "Expression and Polymorphism of TSLP/TSLP Receptors as Potential Diagnostic Markers of Colorectal Cancer Progression" Genes 12, no. 9: 1386. https://doi.org/10.3390/genes12091386
APA StyleSemlali, A., Almutairi, M. H., Alamri, A., Reddy Parine, N., Arafah, M., Almadi, M. A., Aljebreen, A. M., Alharbi, O., Azzam, N. A., Almutairi, R., Alanazi, M., & Rouabhia, M. (2021). Expression and Polymorphism of TSLP/TSLP Receptors as Potential Diagnostic Markers of Colorectal Cancer Progression. Genes, 12(9), 1386. https://doi.org/10.3390/genes12091386