1. Introduction
Promoters and enhancers are two important cis-regulatory elements that control gene transcription [
1]. Enhancers [
2,
3] can increase the transcription of specific genes and promoters [
4,
5], and determine the position of transcription start point and frequency. Enhancer–promoter interactions (EPIs) are vital for the regulation of gene expression [
6] and reveal associations between some special genes and diseases [
7,
8,
9]. For example, Smeno et al. [
10] found that there are EPIs existing in introns of FTO and Irx3 with increased risk for obesity and type-2 diabetes.
In recent decades, many studies [
11,
12,
13,
14,
15,
16] have shown that the mechanism of EPIs is complicated: one enhancer can act on one or more target promoters, while one target promoter can be co-regulated by one or more enhancers. Although the experimental approaches can identify EPIs accurately, such as FISH [
17] and chromosome conformation capture (3C) [
18], the result may contain a lot of irrelevant information. Moreover, experimental approaches are also expensive and time consuming.
Therefore, with the development of various high-throughput technologies, computational methods have become usual alternatives for identifying EPIs. Whalen et al. [
19] proposed a model named TargetFinder, which used lots of sequence and genomic information obtained in biological experiments to predict EPIs. Talukder et al. [
13] built an Adaboost model using functional and genomic data to predict EPIs. However, these traditional machine learning methods often require feature engineering, which leads to redundant features, such as GTB [
14], GBRT [
15], and random forest [
16]. The fact that potential information may affect EPI predictions is excluded from consideration.
In recent years, deep learning methods have been proposed to address the above limitations, which build different neural network architectures to learn potential sequence information. One-hot and its variant high-order encoding are usual encoding methods [
20,
21,
22,
23] that pay more attention to extract sequence context information than the potential spatial position information contained in a sequence. For example, Zhuang et al. [
21] used one-hot to encode enhancer and promoter sequences that only consider the information of single nucleotides. In order to learn more relevant sequence information, many methods use CNN (Convolutional Neural Networks) to extract potential sequence information, such as EPIsCNN [
21] and EPIVAN [
6]. Singh et al. [
20] proposed SPEID, a hybrid of CNN and LSTM (Long short-term Memory) that better characterizes long-range interactions. However, LSTM may cause a long operation time. Min et al. [
22] used a matching heuristic from natural language inference to explore the interaction between enhancers and promoters. Although these methods found different ways to obtain more information on EPIs, they still ignored the spatial position relationship.
Overall, even though these researchers have made considerable progress, some limitations still exist. First, almost all these methods do not take into consideration the spatial position relationship. Therefore, these models cannot extract more information. Second, few studies have focused on the analysis of features extracted by model from the spatial perspective; they only use the quantitative value of AUC (area under the curve) and AUPR (area under the precision–recall curve) to evaluate prediction accuracy. Third, most recent methods lack generalization capability across different cell line datasets. They obtained satisfactory prediction accuracy when train datasets were the same as test datasets, but performed worse across cell lines. Although EPIHC [
23] and SEPT [
24] both use different transfer learning approaches, their results are unsatisfactory.
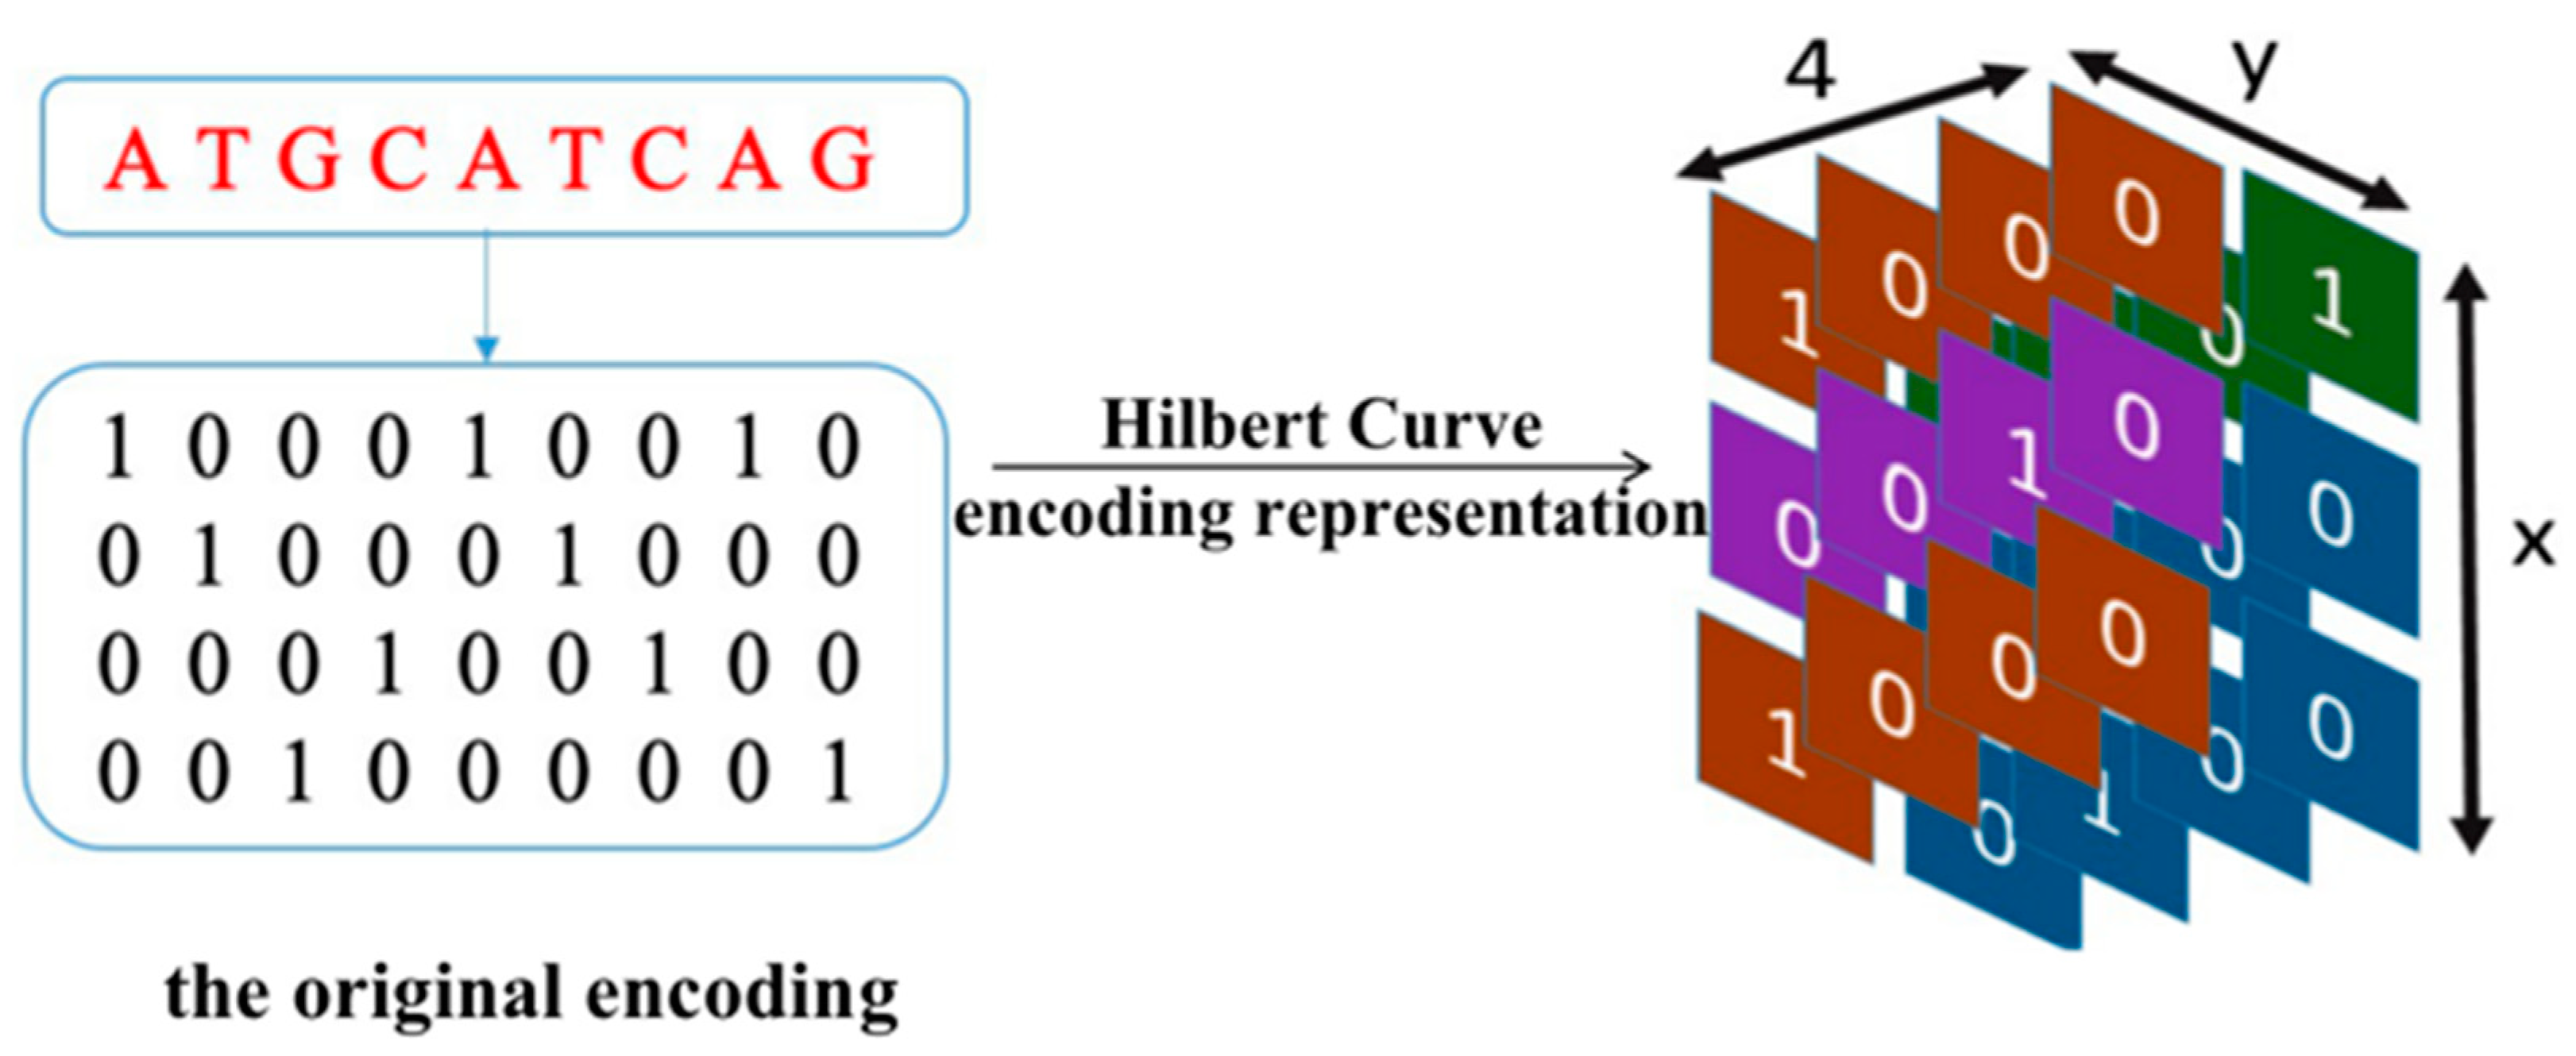
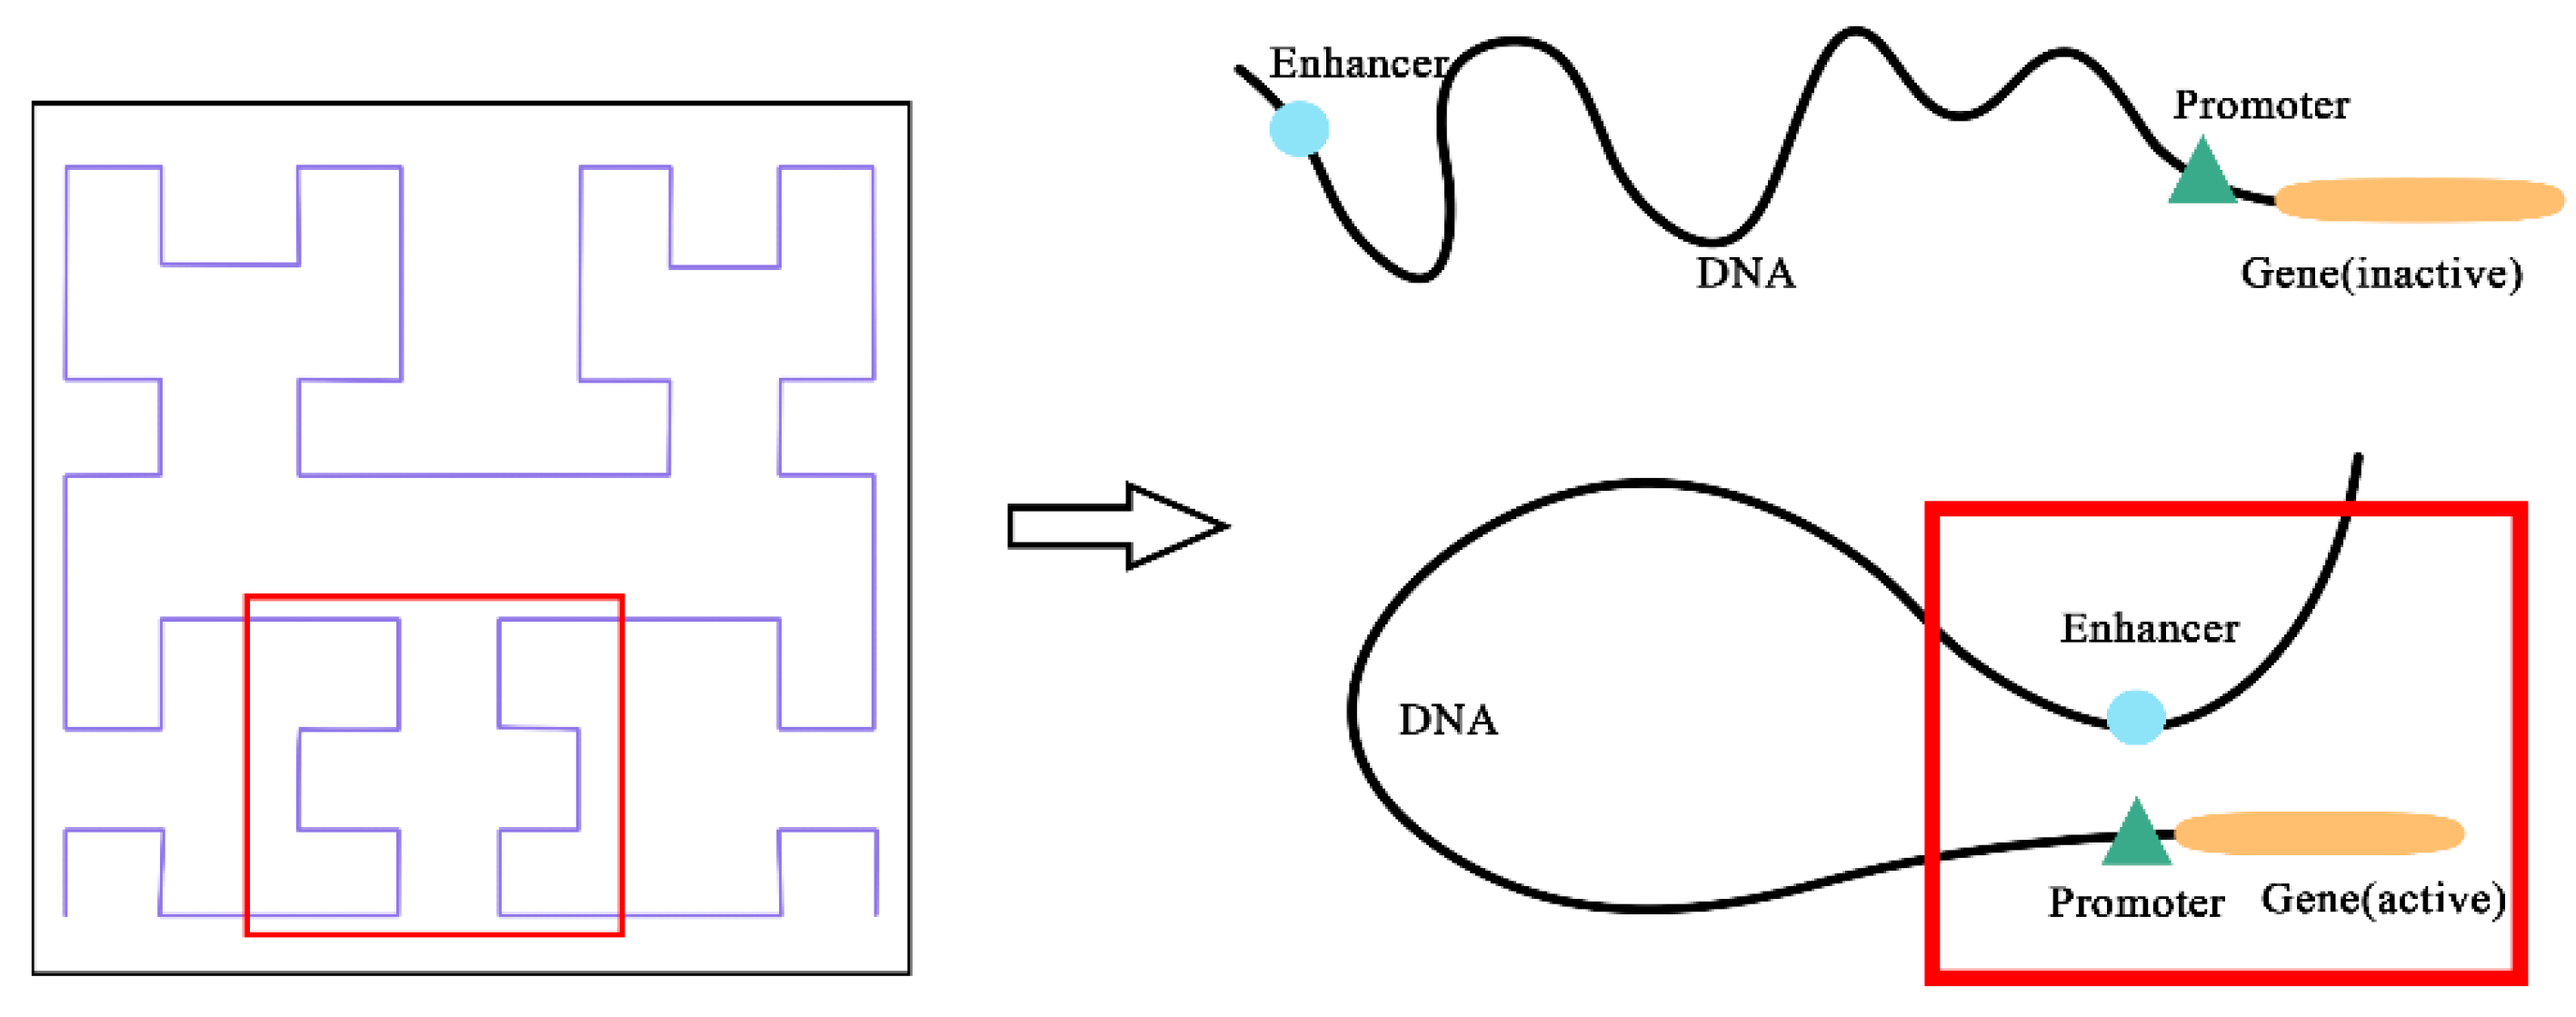
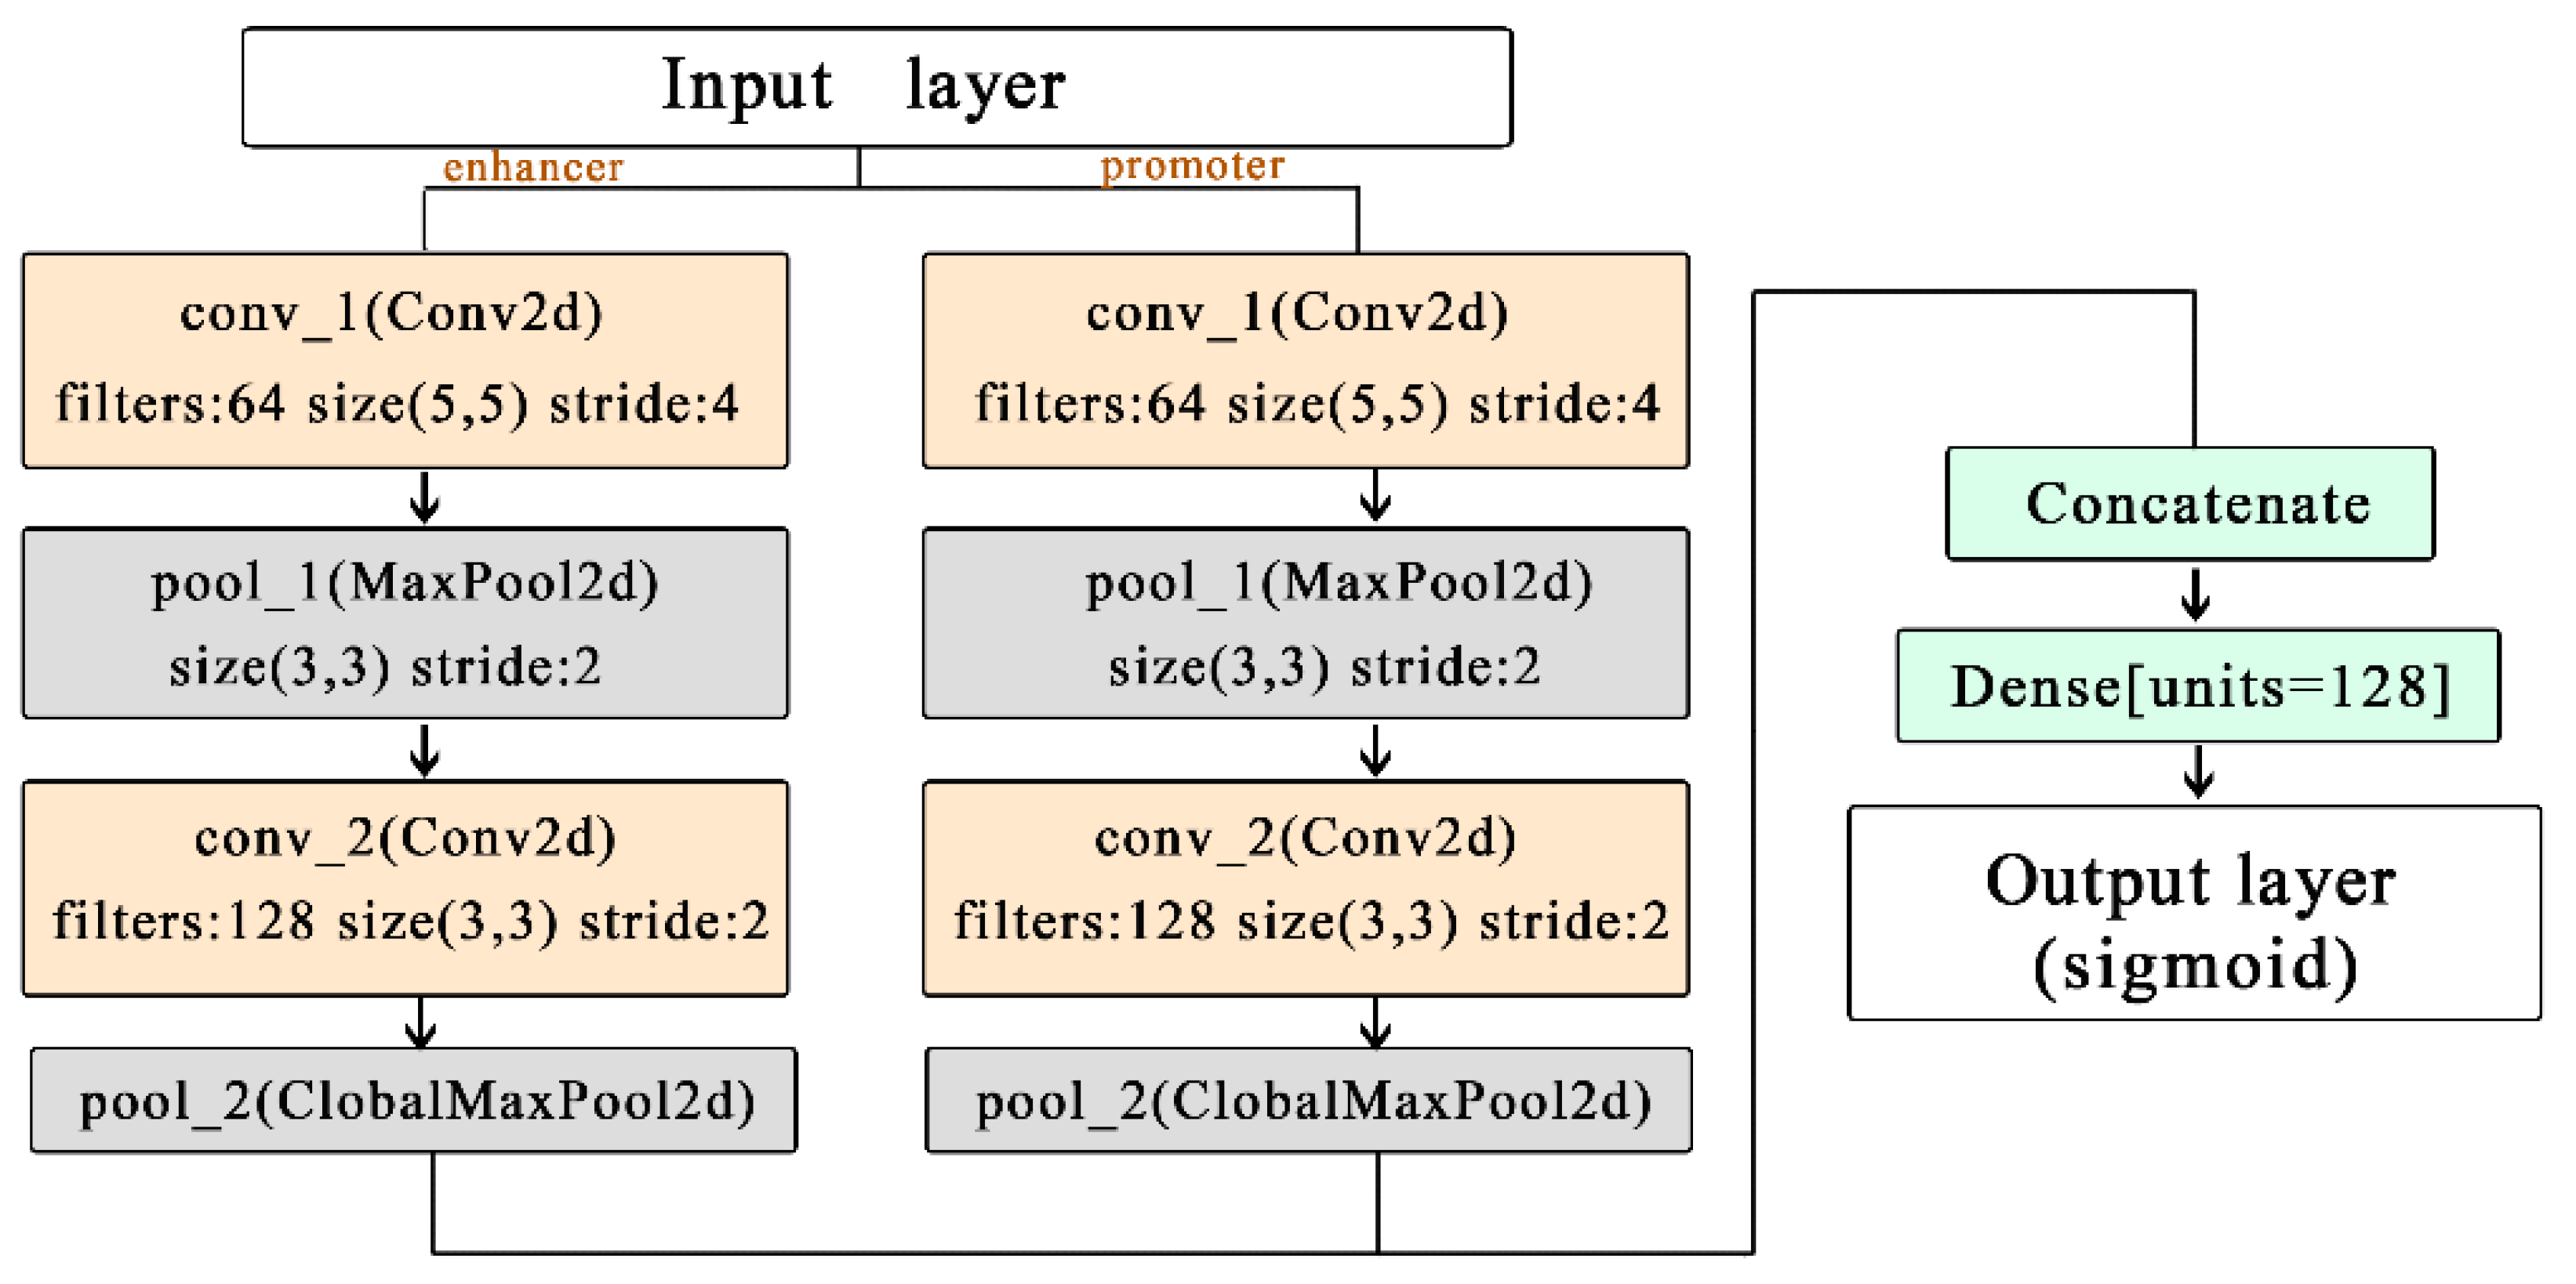
To address the above limitations, we have designed a model named EPIsHilbert using Hilbert curve encoding and transfer learning. Many researchers have shown that enhancers interact with promoters through complex spatial positions, such as rotating or folding around. Hilbert curve encoding avoids some loss of the spatial position relationship between an enhancer and a promoter, so it can help improve a model’s performance. In order to explore the sequence features that affect the EPIs and their spatial relationships, we add a class activation map (CAM) visualization to display the frequency of sequence features. The occurrence of some diseases is usually related to genetic elements that control the gene regulation, so sequence features with a high frequency of occurrence can be further used in genetic testing or disease diagnosis. For achieving satisfactory prediction performance across cell lines, we proposed two transfer learning strategies to pre-train the model with data from various cell lines. We further explored the reasons for the conclusions of transfer learning according to the analysis of coincidence degree. Experiment results demonstrated that EPIsHilbert not only improved the accuracy of the model prediction in some target cell lines, but also obtained satisfying performance across cell lines.
3. Results
3.1. The Prediction Performance of Cell Line-Specific Model
In this section, we demonstrate that the model trained on the specific cell line alone is not applicable to other cell lines. The results of the model on each cell line in terms of AUC and AUPR are shown in
Table 2 and
Table 3, respectively. On the whole, the cell line-specific model that uses the same cell line in training and test sets performs very well. Practically speaking, the AUC and AUPR values are both over 0.9, even up to 0.983 and 0.988, separately. As seen from the non-diagonal results of tables, the cross-cell line ability of the model is significantly bad. For example, when we use the model fitted for cell line NHEK to predict EPIs for the other five cell lines, the AUPR values of the other five cell lines range from 0.465 to 0.550, while that of NHEK is 0.988.
We can draw two conclusions based on the above results. One, the model without transfer learning lacks a generalization capability across different cell line datasets. On the other hand, the model trained on one specific cell line has a good predictive ability in that cell line.
3.2. Advantages of Transfer Learning
3.2.1. Using the Data from Other Cell Lines to Pre-Train a Model
The model transferred to a new cell line in this section is called EPIsHilbert-transOne.
Table 4 shows the AUPR value of EPIsHilbert-transOne on each cell line. At the same time, we add EPIsHilbert for comparison. The performance of the cross-cell line prediction is significantly improved. For instance, when we used the cell line-specific model fitted for cell line NHEK to predict EPIs for the other five cell lines, the method yielded AUC values of 0.441–0.557, much smaller than 0.887–0.931 obtained from EPIsHilbert-transOne. After using transfer learning, the F1 value increased by at least 0.66, and the AUC and AUPR values also increased by more than 0.40. For cell line-specific predictions, there is a significant improvement for HUVEC, K562, GM12878, and Hela-S3, while EPIsHilbert-transOne performs slightly worse than EPIsHilbert on NHEK and IMR90.
Hence, our proposed EPIsHilbert-transOne clearly outperforms EPIsHilbert across cell lines and also improves the performance on four cell lines for cell line-specific predictions.
3.2.2. Using the Data from All Cell Lines to Pre-Train a Model
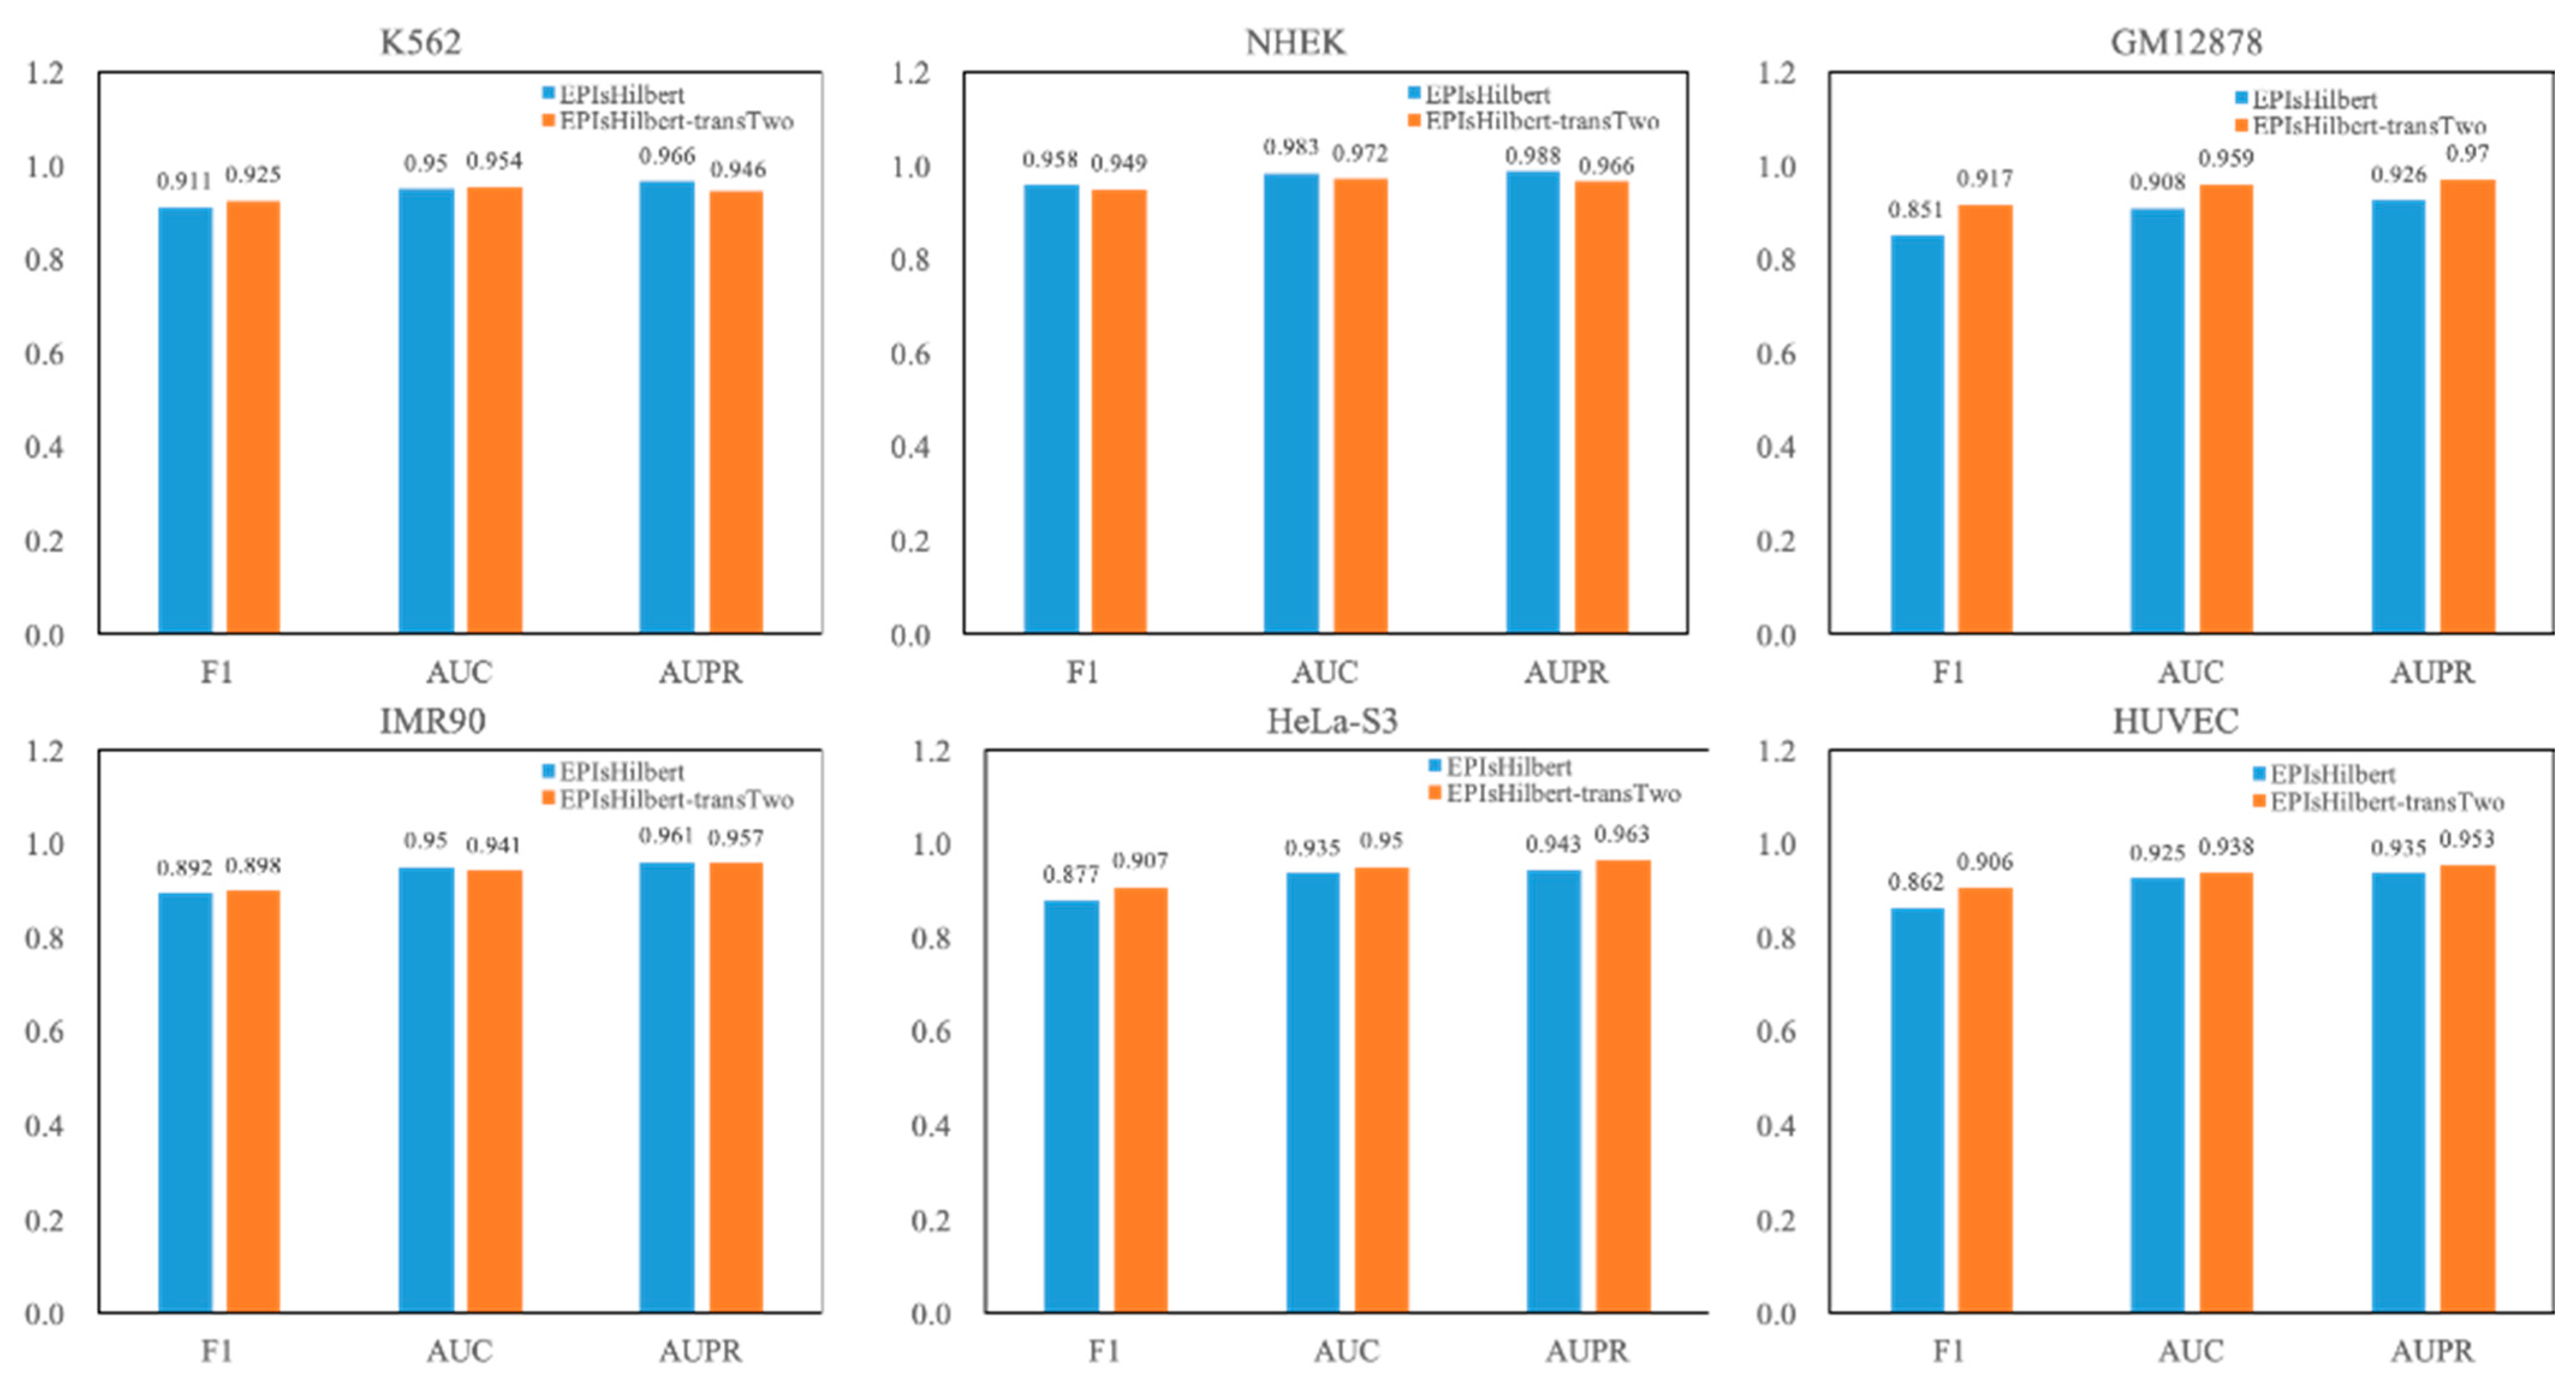
For the convenience of discussion, our model in this section is denoted as EPIsHilbert-transTwo. The experimental result of EPIsHilbert-transTwo on each cell line in terms of AUPR is shown in
Table 5. It is observed that EPIsHilbert-transTwo improves the performance of the model across cell lines. After using transfer learning, the F1 value is increased at least 0.69, the AUC and AUPR values are also increased more than 0.46. As seen in
Figure 4, comparing EPIsHilbert-transTwo with EPIsHilbert, we can find that, for cell line-specific predictions, there is a significant improvement in HUVEC, GM12878, and Hela-S3, while EPIsHilbert-transTwo performs slightly worse than EPIsHilbert on NHEK, IMR90, and K562.
3.2.3. The Analysis of Epis Overlap Ratio for Different Cell Lines
After using the strategy of transfer learning, the prediction ability of the model across cell lines was improved, which indicated there may have been common sequence fragments among all cell lines. To demonstrate this hypothesis, we explore the sequence overlap ratio of EPIs between different cell lines. The overlap ratio refers to the sequence similarity of EPIs in different cell lines, and the calculation process is as follows:
- i.
Set the number of coincident samples () and select each enhancer–promoter pair . The represents EPIs positive samples size in the target cell line.
- ii.
Take the other five cell lines as a dataset, . Search each enhancer–promoter pair in EPIs positive samples of . The represents EPIs positive samples size in .
- iii.
For each , search all and calculate their overlap ratio. If the overlap ratio , then the number of plus one. is the threshold of overlap ratio.
- iv.
Calculate the remaining four cell lines in a loop to obtain the number of overlapping EPIs between the target cell line and the other five cell lines.
- v.
Modify the target cell line and repeat the above steps five times to complete the overlap number statistics.
is set to
and
, respectively. The results are shown in
Table 6 and
Table 7. When
is
, it can be seen that the overlapping number of EPIs from NHEK and IMR90 completely with each cell line is small, while the other four cell lines have more overlapping EPIs. When
is reduced to
, the number of EPIs from NHEK and IMR90 does not increase much. However, the other four cell lines show a hefty increase, with the largest increase of more than
pairs of similar EPIs.
Therefore, we can infer that, when continues to decrease, the four cell lines, except NHEK and IMR90, will increase even more. NHEK and IMR90 have more particular features. On the whole, EPIs in different cell lines have some common sequence features. Thus, we prove the effectiveness of transfer learning.
3.3. Model Comparison
To consolidate the importance of our study, we compared the performance of our proposed models with the other two typical baseline predictors. The two typical baseline predictors are SPEID [
20] and EPIsCNN [
6]. SPEID, a hybrid of CNN and LSTM, only uses sequence data for prediction, while EPIsCNN uses a simple CNN structure that is the same as SPEID. As shown in
Table 8, the experimental result shows that the three methods we proposed models all outperform SPEID and EPIsCNN.
These three models we proposed are suitable for different cell lines. To be specific, EPIsHilbert achieves slightly better performance on NHEK and IMR90, while EPIsHilbert-transOne performs better on K562 and Hela-S3. Moreover, on HUVEC and GM12878 cell lines, we obtain the best prediction result from the EPIsHilbert-transTwo model.
Based on the above results, we can infer that NHEK and IMR90 cell lines have more unique features because the results are not ideal. However, the two models using transfer learning perform better on K562, HeLa-S3, HUVEC, and GM12878 cell lines. It suggested that many features that influence EPIs in these four cell lines are also shared in all six cell lines.
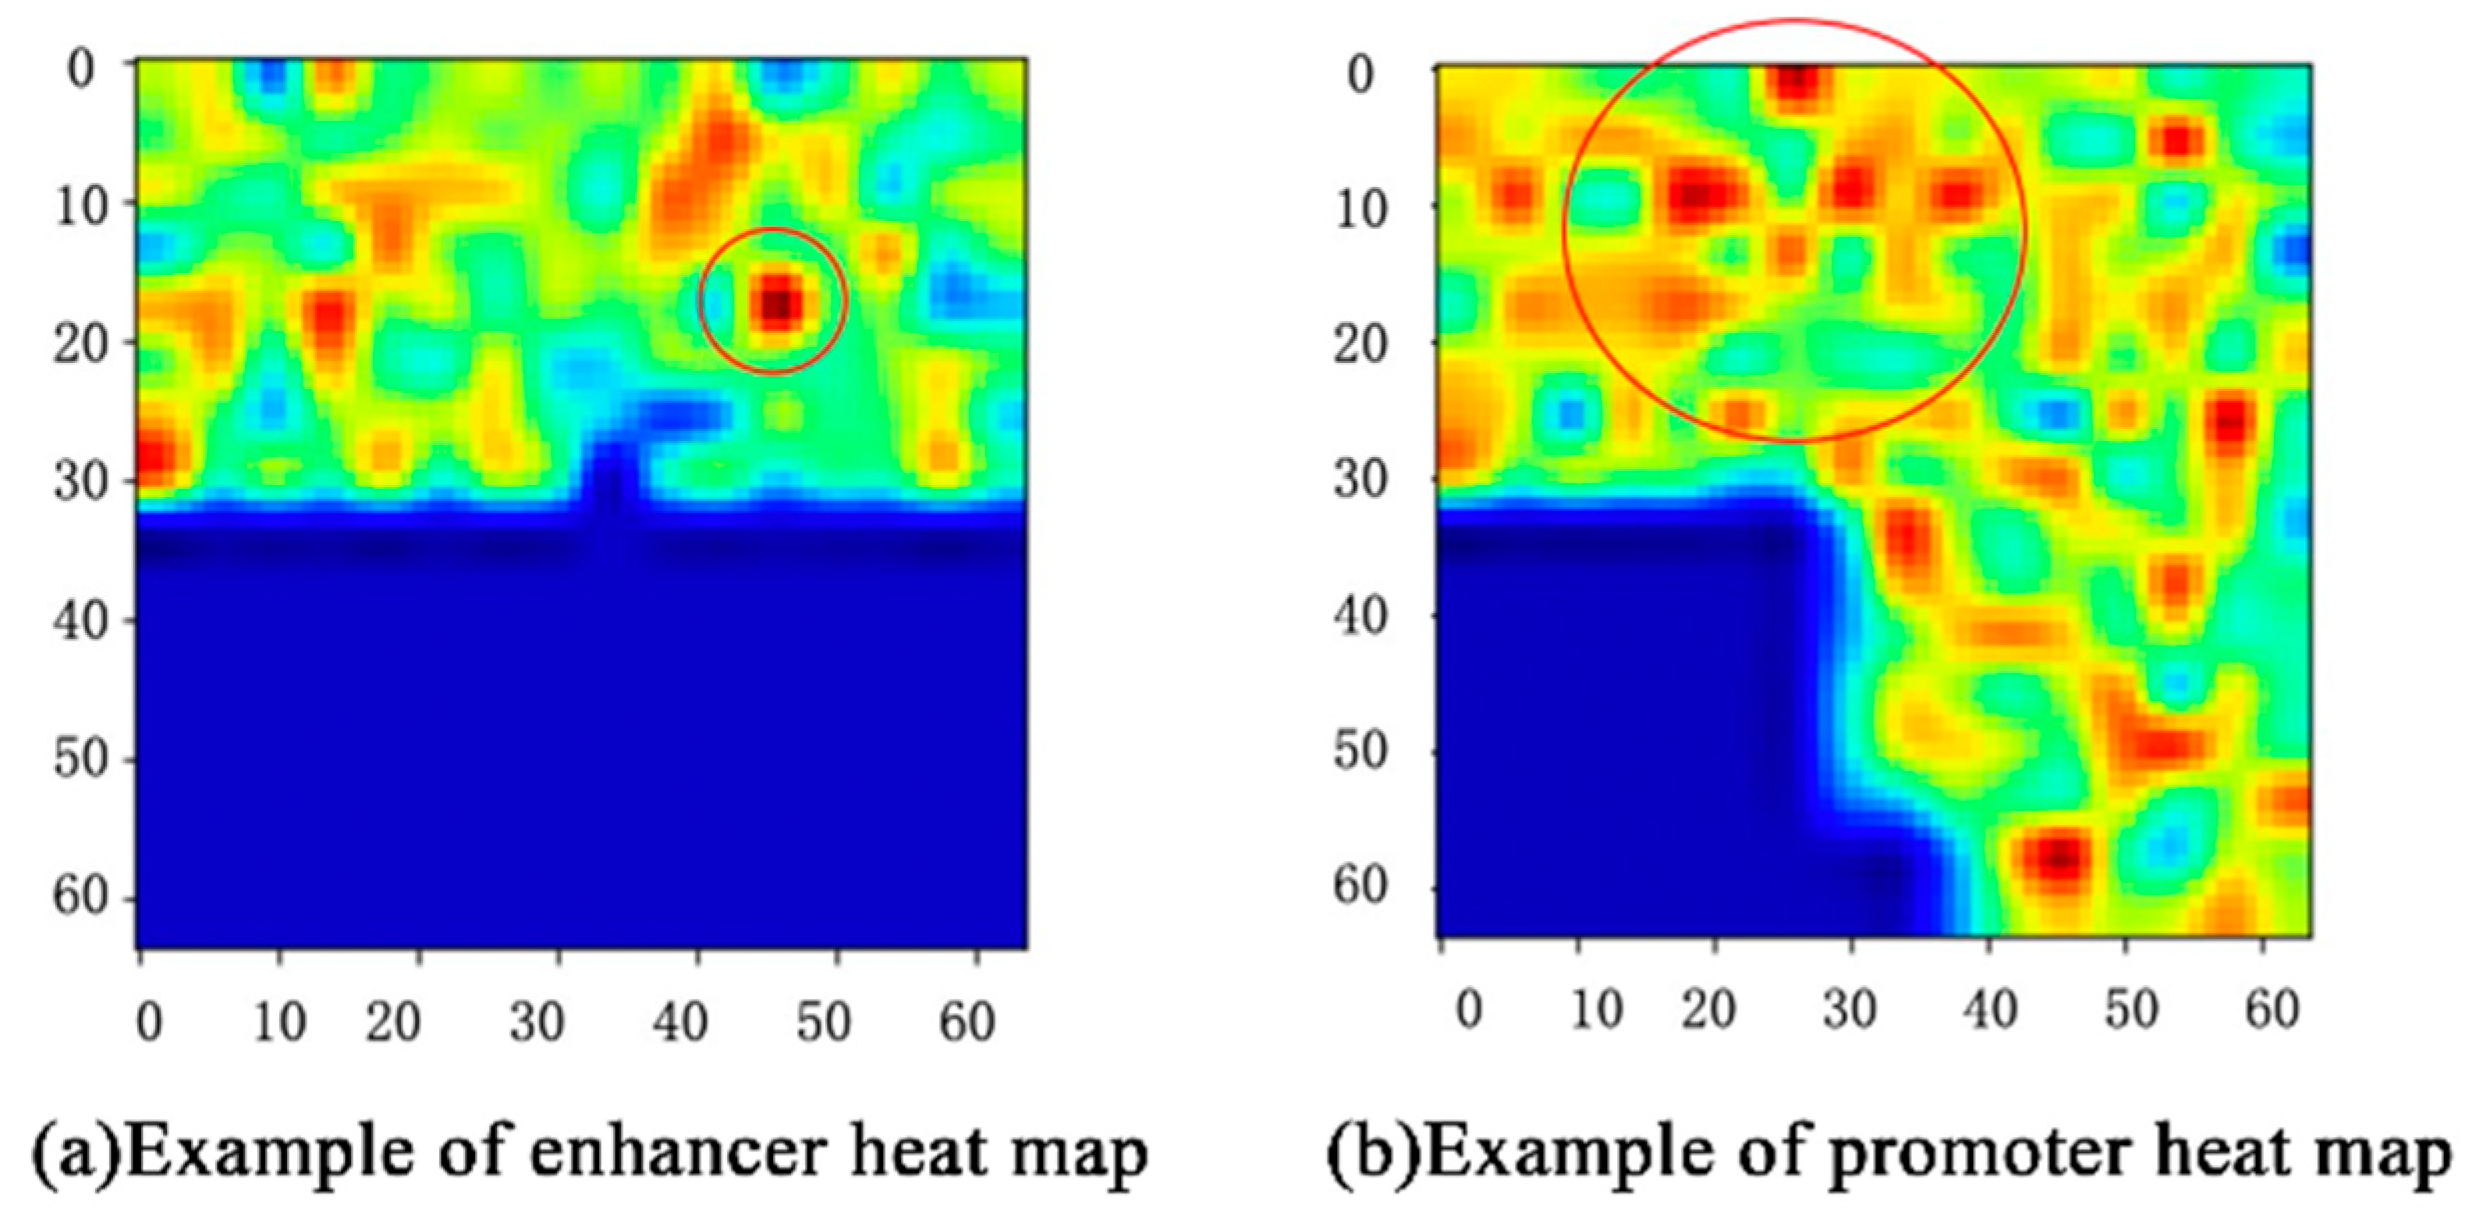
3.4. Visulation of Sequences Features and Their Relationship
In our work, the proposed class activation map (CAM) [
30] visualized the three-dimensional vectors with a heat map that presents the spatial distribution of features, and color depth indicates the influence of features on the interactions of enhancers and promoters.
For example, the CAM of one enhancer–promoter pair in IMR90 is shown in
Figure 5. The features that play an important role in EPIs are mainly concentrated in the upper half of
Figure 5. The deeper the red, the greater the impact. Likewise, features in the lower-left corner almost do not influence EPIs. For each input enhancer–promoter pair, CAM can not only help us observe the distribution of the features of the EPIs from the space perspective, but also show the degree to which these features influence EPIs through the color-depth in the heat map. What is more, it also demonstrates that the enhancer approaches the promoter in complex spatial structures intuitively.
On the basis of CAM, we combine the heat map with the actual coding sequence to complete statistics on the frequency of features. We analyzed the heat map of enhancer and promoter sequences in 1254 EPIs positive samples of IMR90 cell lines to obtain the representations of features sequence. The statistics of enhancer and promoter feature occurrence frequency in IMR90 are shown in
Table 9 and
Table 10, respectively. GGG, AAA, CGT, CAT, and ATT are the features of enhancers with greater influence on EPIs. The features of promoters including CCC, TCC, TTC, TTT, and CTT have a greater impact on EPIs. It is obvious that there are high frequencies of only 3–4 nucleotide-long features, perhaps longer motifs may not have biological significance. As we all know, DNA transcription is based on three nucleotides. Thus, we can judge the motif that has a specific function as being 3–4 nucleotides long. However, our subsequent study will also extend the length to consider association-specific motifs and deeper analysis about diseases.
In this section, we counted the frequency of feature occurrences. The prevalence of some diseases is usually related to genetic elements that control gene regulation. Thus, in the field of disease diagnosis, features with a high frequency of occurrence can be used in genetic testing or to study the causes of diseases as an assisting technique.
4. Conclusions
In this article, we proposed a model named EPIsHilbert using only sequence data to predict EPIs. Being different from existing methods, EPIsHilbert is innovative at using the Hilbert curve to encode enhancer and promoter sequences and better preserves the spatial structure of the sequence. Thus, we can utilize sequences information and then obtain more details from them. Experimental results on six cell lines indicated that EPIsHilbert performs better than any existing method with an 0.908~0.983 of AUROC and 0.926~0.988 of AUPR.
In order to improve the ability of crossing cell lines, we used two transfer learning strategies to pre-train a CNN model by taking advantage of the data from various cell lines. Applied to the same CNN model, each method is more accurate for cross-cell line prediction than current practice, even if it may lose the specificity of each cell line. We further conducted a similarity analysis of the interactions between enhancers and promoters among cell lines. The result shows that NHEK and IMR90 cell lines contain more specific features, while the other four cell lines have more common features, so the prediction accuracy could be further improved by using transfer learning to pre-train the model.
We also created a class activation map to explore the features that affect EPIs and the spatial relationships of these features. On this basis, this paper combines a heat map with actual coding sequences to complete statistics regarding the frequency of features. The features with a high frequency of occurrence have a greater impact on the interactions between enhancers and promoters, and they can be further used in a genetic test for disease diagnosis and treatment.
Given the excellent performance of EPIsHilbert, we will continue to improve our approach. We may further explore other deep learning architecture for prediction, such as GCN. Then, we suggest that using EPIs data from more datasets may result in a better performance. Since we only use sequence data, integrating sequence data with epi-genomic data is an expected way to improve performance. Moreover, we expect EPIsHilbert can play an important role in all kinds of sequence prediction tasks.


