Article

Analysis of Genetic Variants Associated with Levels of Immune Modulating Proteins for Impact on Alzheimer’s Disease Risk Reveal a Potential Role for SIGLEC14

1
Department of Physiology, University of Kentucky, Lexington, KY 40506, USA
2
Sanders-Brown Center on Aging, University of Kentucky, Lexington, KY 40506, USA
3
Department of Biostatistics, University of Kentucky, Lexington, KY 40506, USA
*
Author to whom correspondence should be addressed.
Genes 2021, 12(7), 1008; https://doi.org/10.3390/genes12071008
Submission received: 19 May 2021 / Revised: 23 June 2021 / Accepted: 25 June 2021 / Published: 30 June 2021
(This article belongs to the Special Issue Genetics of Alzheimer’s Disease)

Abstract

:
Genome-wide association studies (GWAS) have identified immune-related genes as risk factors for Alzheimer’s disease (AD), including TREM2 and CD33, frequently passing a stringent false-discovery rate. These genes either encode or signal through immunomodulatory tyrosine-phosphorylated inhibitory motifs (ITIMs) or activation motifs (ITAMs) and govern processes critical to AD pathology, such as inflammation and amyloid phagocytosis. To investigate whether additional ITIM and ITAM-containing family members may contribute to AD risk and be overlooked due to the stringent multiple testing in GWAS, we combined protein quantitative trait loci (pQTL) data from a recent plasma proteomics study with AD associations in a recent GWAS. We found that pQTLs for genes encoding ITIM/ITAM family members were more frequently associated with AD than those for non-ITIM/ITAM genes. Further testing of one family member, SIGLEC14 which encodes an ITAM, uncovered substantial copy number variations, identified an SNP as a proxy for gene deletion, and found that gene expression correlates significantly with gene deletion. We also found that SIGLEC14 deletion increases the expression of SIGLEC5, an ITIM. We conclude that many genes in this ITIM/ITAM family likely impact AD risk, and that complex genetics including copy number variation, opposing function of encoded proteins, and coupled gene expression may mask these AD risk associations at the genome-wide level.

1. Introduction

Genome-wide association studies (GWAS) have identified a set of polymorphisms that modulate the risk of Alzheimer’s disease (AD) [1,2,3,4,5,6]. The pathways implicated in this process include innate immunity, cholesterol homeostasis, and protein trafficking [7,8,9]. Four of these genes, TREM2, CD33, PILRA, and FCER1G, are members of the family of non-catalytic tyrosine-phosphorylated receptors (NTRs), which function through immunomodulatory tyrosine-phosphorylated activating motifs (ITAMs) or inhibitory motifs (ITIMs). The underlying immunomodulatory pathway is further implicated by AD-associated variants in phospholipase C (PLCG2) and INPP5D which encode proteins acting downstream of these ITAM- and ITIM-containing proteins. Functional studies have informed the current hypothesis that the variants associated with AD in the ITAM/ITIM family modulate inflammation and phagocytosis [10,11,12,13,14,15,16,17,18].
The ITAM family, including TREM2, recruit kinases such as spleen tyrosine kinase (Syk) and phosphoinositide 3-kinase (PI3K) to induce downstream signaling, while the ITIM family, including CD33, recruit phosphatases such as SHP-1 to dephosphorylate Syk and ITAMs, thereby counteracting ITAM activity [19]. These ITAM and ITIM proteins are predominantly expressed in immune cells such as microglia. Overall, these and other studies have shown that microglia contribute to AD pathogenesis, a concept that has been reviewed recently [20,21,22].
The critical barrier to progress in translating GWAS candidate genes to treatments is elucidating the actions of the functional variant at the molecular level, i.e., splicing (sQTL), gene expression (eQTL), or protein level (pQTL), to understand whether the pathway affected is detrimental or beneficial to disease risk. GWAS single nucleotide polymorphisms (SNPs) in AD are frequently identified as eQTLs in the brain [23]. Sun et al. have used GWAS to identify pQTLs for the plasma proteome, including ITIM and ITAM-containing proteins [24]. To investigate the hypothesis that these pQTLs may uncover additional AD-related genes that may have been overlooked in AD GWAS because of their stringent false-discovery rate controls, we examined the Sun et al. cis-pQTL data together with the Jansen et al. AD GWAS results. Parsing the proteins from the genome-wide significant cis-pQTL dataset by whether or not an ITIM/ITAM domain was present, and then examining whether the associated SNP is nominally significant (p < 0.05) for AD association, found a significant overrepresentation of ITIM/ITAM encoding genes with nominal AD associations. Since one of these genes, SIGLEC14, has been reported to be deleted in some individuals, we investigated further and found that the pQTL and AD SNP, rs1106476, is a proxy for the previously identified deletion polymorphism [25]. We defined this deletion further by identifying additional SIGLEC14 copy number variants and by determining the effect of SIGLEC14 copy number on the expression of SIGLEC14 and the neighboring SIGLEC5. We conclude that variants in ITIM/ITAM family members, including SIGLEC14, represent underappreciated potential genetic risk factors for AD.

2. Materials and Methods

2.1. Preparation of gDNA, RNA, and cDNA from Human Tissue

Human blood and anterior cingulate autopsy tissue from 61 donors were generously provided by the Sanders-Brown Alzheimer’s disease center neuropathology core and have been described elsewhere [26]. The matched brain and blood samples were from deceased individuals with an average age at death of 82.4 ± 8.7 (mean ± SD) years for non-AD and 81.7 ± 6.2 years for AD subjects. The average postmortem interval (PMI) for non-AD and AD subjects was 2.8 ± 0.8 and 3.4 ± 0.6 h, respectively. Non-AD and AD samples were comprised of 48% and 55% female subjects. MMSE scores were, on average, 28.4 ± 1.6 for non-AD subjects and 11.9 ± 8.0 for AD subjects. These samples were used for genotyping and gene expression studies. Three additional blood samples matched to whole-genome sequencing (WGS) data were obtained to confirm WGS observations of additional SIGLEC14 copies. DNA from these patients was prepared using a QIAamp DNA Blood Mini kit (Qiagen, Germantown, MD, USA) per the manufacturer’s instructions.

2.2. Genotyping and Copy Number Variant Assays

Copy number variation in SIGLEC14 was determined using a TaqMan-based copy number variant (CNV) assay (Invitrogen, Waltham, MA, USA; Catalog number 4400291, Assay number Hs03319513_cn) compared to RNAse P (Invitrogen, 4403326). Amplification and quantitation were performed per manufacturer instructions. Genotyping the rs1106476 was performed with a custom TaqMan assay (Invitrogen). This assay discriminates rs1106476 and rs872629, which are in perfect LD. As coinherited SNPs, this variant is also known as rs35495434.

2.3. Gene Expression by qPCR

Gene expression was quantified by qPCR with PerfeCTa SYBR Green master mix as previously described [14]. SIGLEC14 was quantified with primers corresponding to a sequence in exons 3 and 5: 5′-CAGGTGAAACGCCAAGGAG-3′ and 5′-GCGAGGAACAGGGACTGG-3′. SIGLEC5 was quantified with primers corresponding to sequences in exons 4 and 5: 5′-ACCATCTTCAGGAACGGCAT-3′ and 5′-GGGAGCATCACAGAGCAGC-3′. Cycling conditions for all qPCRs were as follows: 95 °C, 2 min; 95 °C, 15 s, 60 °C, 15 s, 72 °C, 30 s, 40 cycles. Copy numbers present in the cDNA were determined relative to standard curves that were executed in parallel [19].

2.4. WGS Data Analysis

To investigate the frequency and range of SIGLEC14 CNV, we performed a read-depth analysis for WGS data. We obtained compressed sequence alignment map (CRAM) files from the AD sequencing project (ADSP) and AD Neuroimaging (ADNI). We extracted paired-end reads mapped to the SIGLEC14-SIGLEC5 locus under Genome Reference Consortium Human Build 38 (GRCh38/hg38), and then computed the depth at each position using the samtools depth function [27].

2.5. Statistical Analyses

The association of cis-pQTL proteins containing ITIM/ITAM domains and AD-associated SNPs was calculated using a simple chi-square test. Gene expression was analyzed by using JMP14 Pro using one-way analysis of variance (ANOVA) followed by Tukey’s post-hoc multiple testing correction and graphed in GraphPad Prism 8.

3. Results

3.1. ITIM/ITAM pQTLs Are Overrepresented in AD GWAS Results

To evaluate whether pQTLs for ITIM or ITAM-containing proteins were associated with AD, we compiled a list of ITIM and ITAM-containing proteins from prior reviews [28,29,30,31]. The resulting list contained 187 genes and is provided as Supplemental Table S1. The cis-acting pQTLs from Sun et al. and AD associations from Jansen et al. were then matched by chromosomal coordinates [2,24]. Both datasets were provided under Genome Reference Consortium Human Build 37 (GRCh37/hg19). Genes were then subset as either coding for an ITIM/ITAM gene or not and nominally significant (p < 0.05) for AD association or not. The SNPs which are associated with both ITIM/ITAM protein levels in plasma and AD risk are shown in Table 1. We found that pQTLs that affect ITIM or ITAM genes were significantly overrepresented in nominally significant AD associations (p = 6.51 × 10⁻⁵, χ 1 2 = 15.95, Table 2).

3.2. SIGLEC14 pQTL Is a Proxy for the Deletion Polymorphism

Previous reports have identified a SIGLEC14 deletion [25]. Given the strong pQTL signal from rs1106476 on SIGLEC14 reported by Sun et al., and the fact that rs1106476 is within the neighboring SIGLEC5 gene, yet has a cis-pQTL effect on SIGLEC14, we hypothesized that rs1106476 is a proxy for the SIGLEC14 deletion polymorphism. To test this hypothesis, we genotyped a set of DNA samples for rs1106476 and quantified genomic copy number variation (CNV). We found that the proxy SNP correlates with SIGLEC14 deletion well but not perfectly (p < 0.0001, χ 2 2 = 38.40) (Table 3). To better understand this deletion, we then sequenced the region containing the SIGLEC14-SIGLEC5 fusion in five minor allele carriers (two homozygous for SIGLEC14 deletion and three heterozygous) [25]. Based on these sequencing data, relative to reference sequences, we found a 692 bp region of complete identity between SIGLEC14 and SIGLEC5. Within this region, the deletion polymorphism sequence corresponds to SIGLEC14 at the 5′ end, but SIGLEC5 on the 3′ end, with respect to reference sequence data (Figure 1). Overall, this represents a 17 kb deletion.

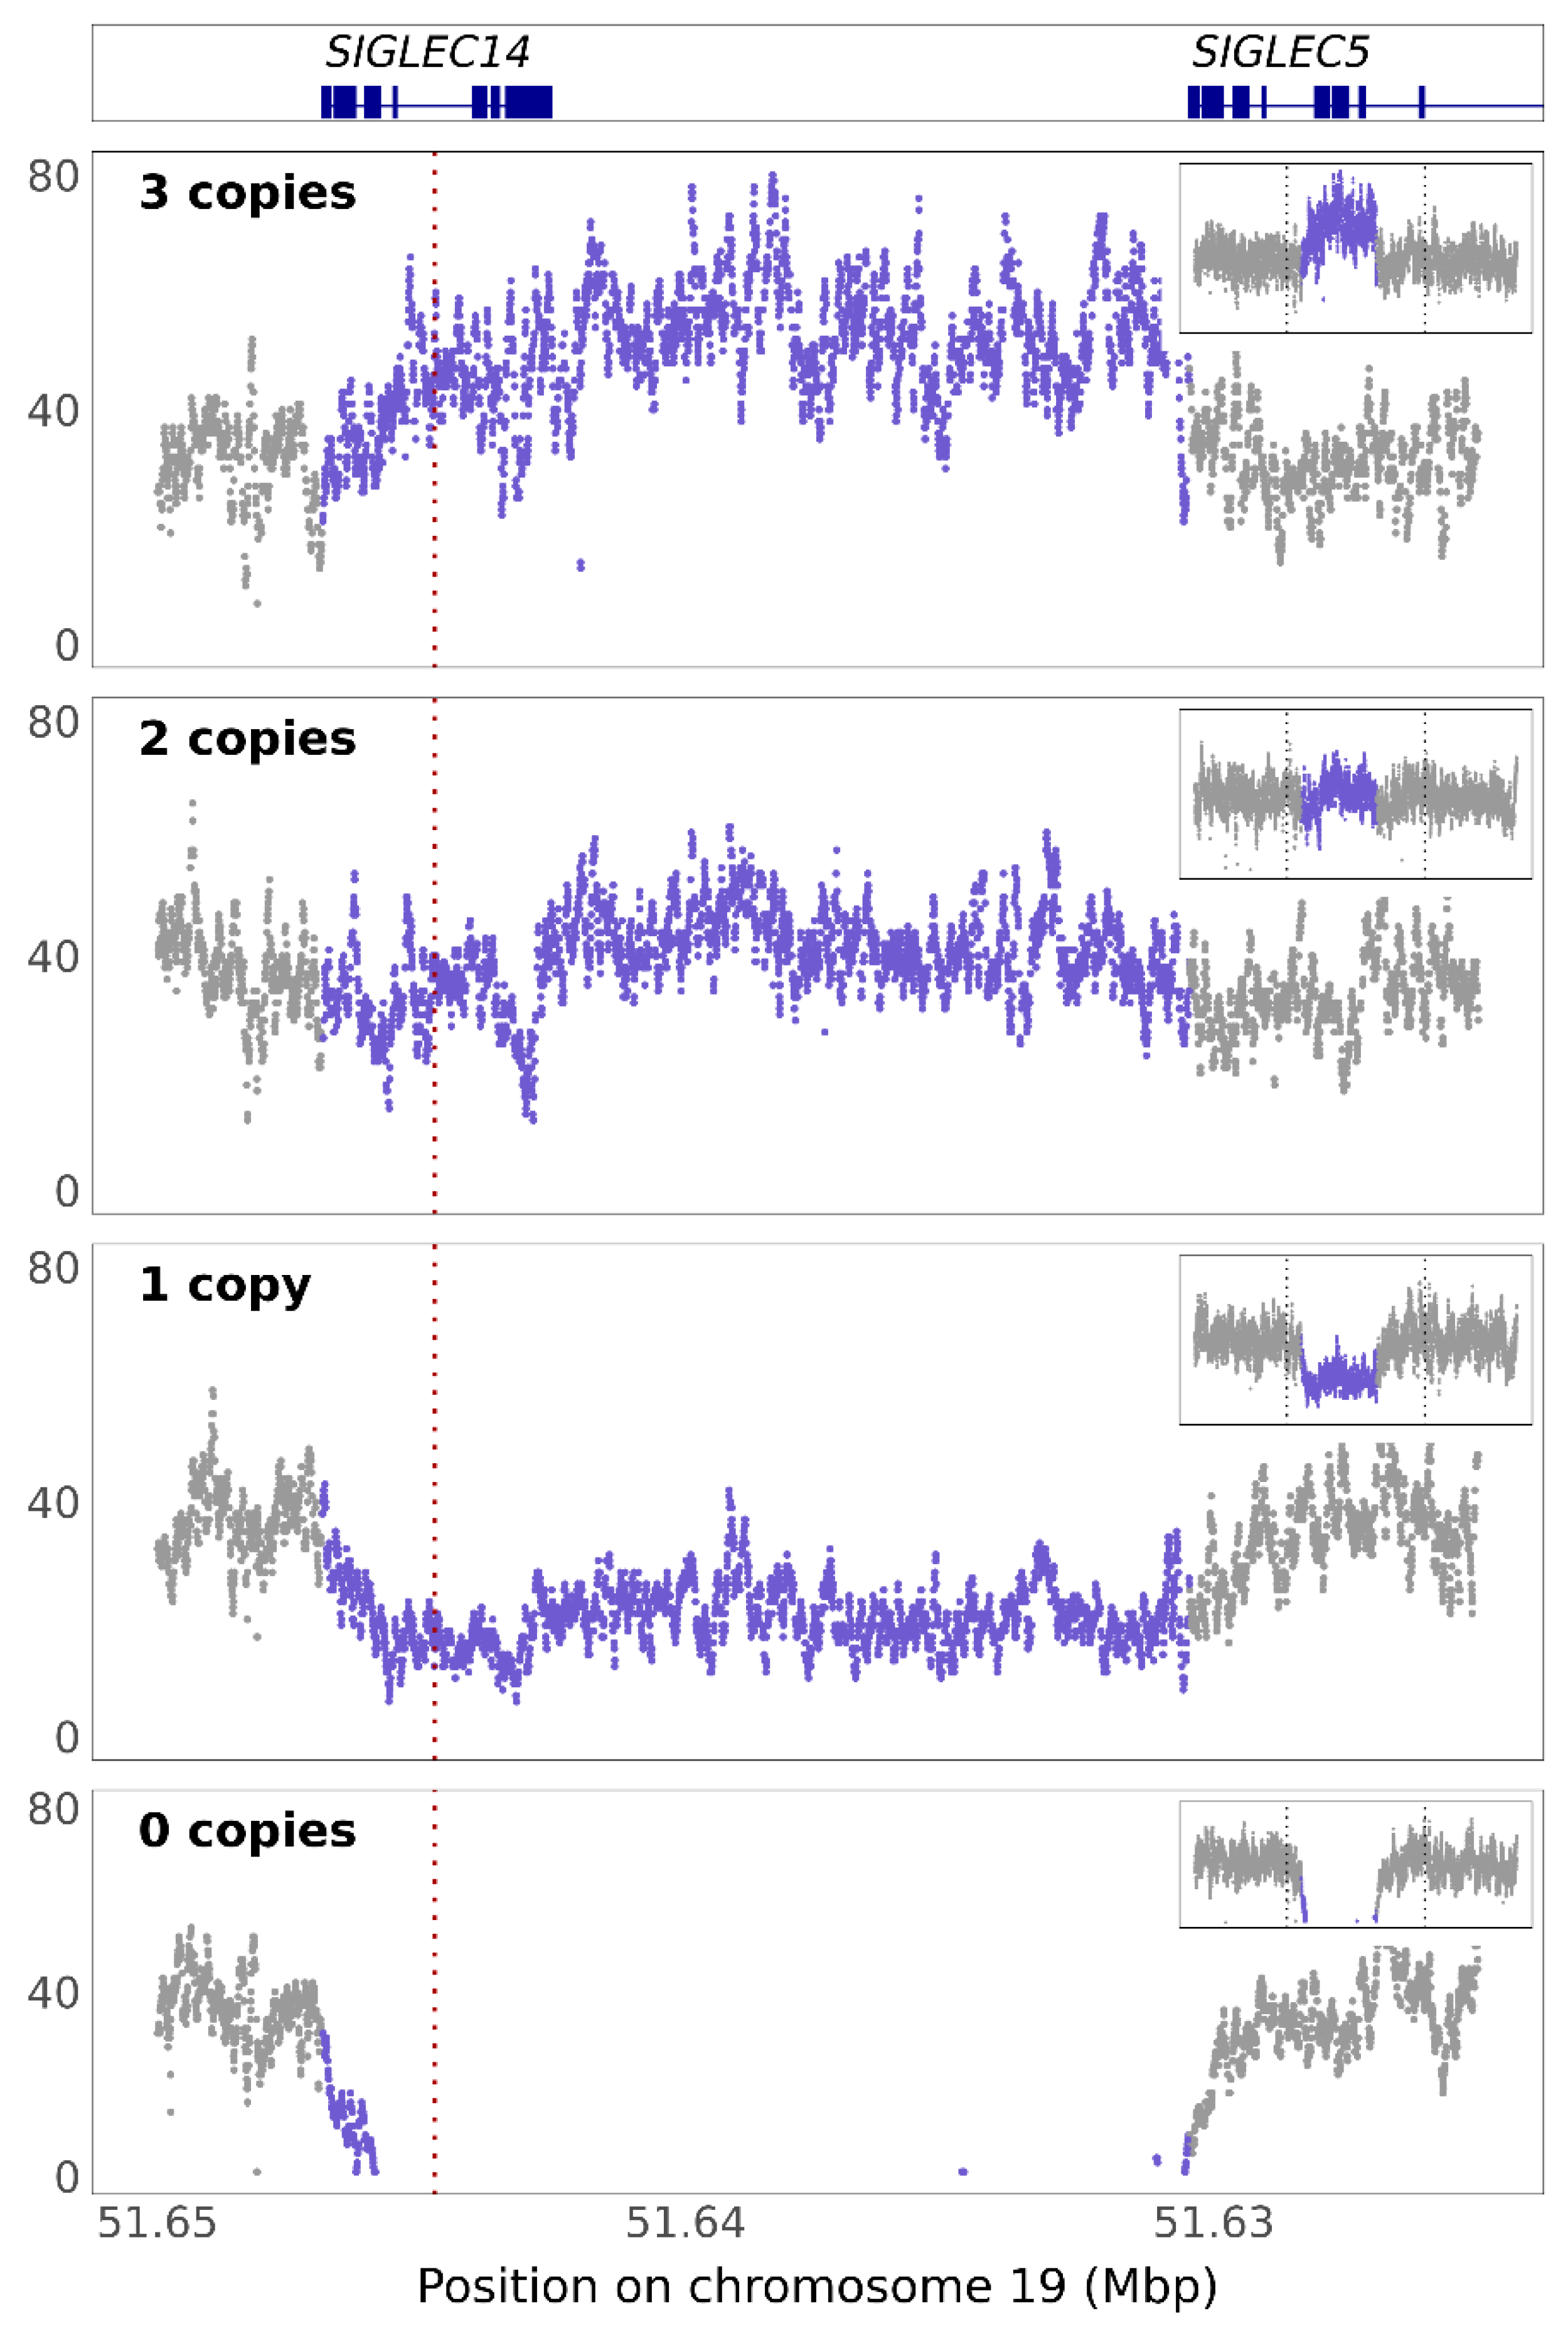
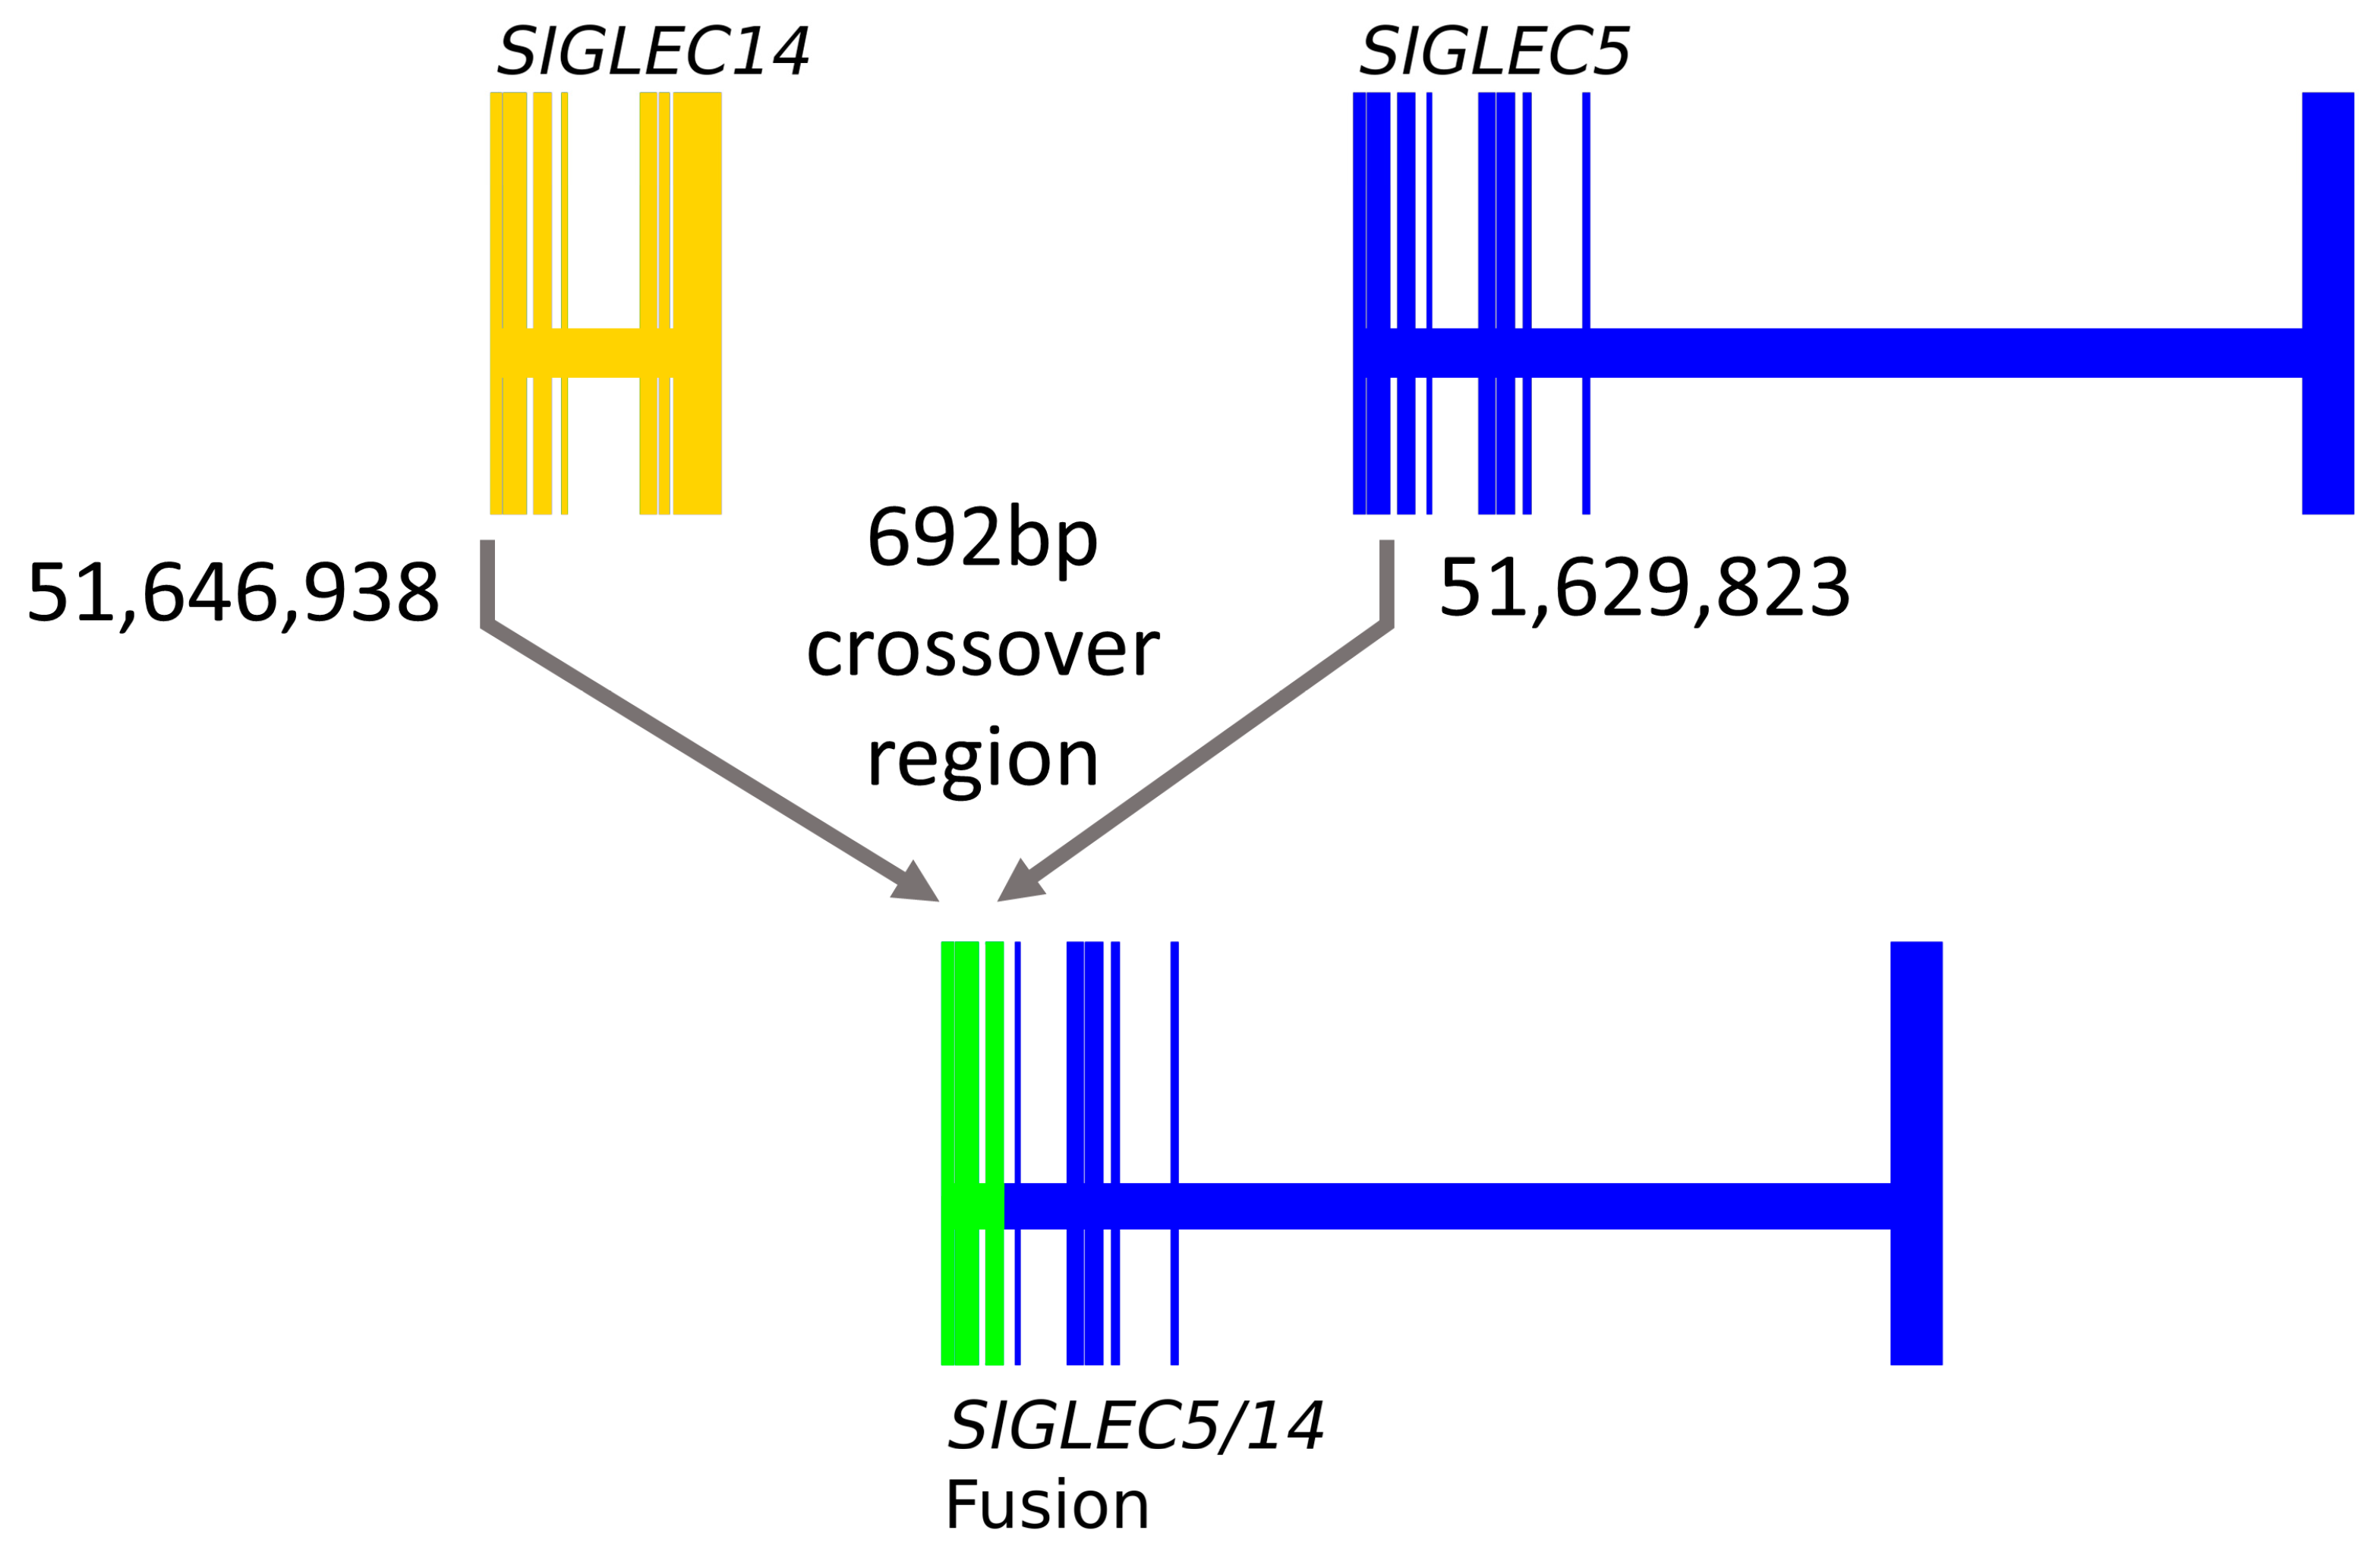
3.3. SIGLEC14 CNV Is Not Fully Captured by rs1106476

As noted in Table 3, we found some individuals that had three copies of SIGLEC14 as detected by the CNV assay. To validate these findings, we leveraged the ADNI and ADSP WGS datasets and compared read depth in the SIGLEC14 locus with surrounding sequences (Figure 2). Both datasets contained individuals with SIGLEC14 copy numbers ranging from 0–3. The presence of three copies of SIGLEC14 was cross-validated between WGS data and CNV assay in three individuals. Further, the frequencies across populations are equivalent (Table 4; p = 6.76 × 10⁻¹², χ2 = 69.30). Read depths for Caucasian, African American, and other populations are shown as Supplemental Figures S1–S3.

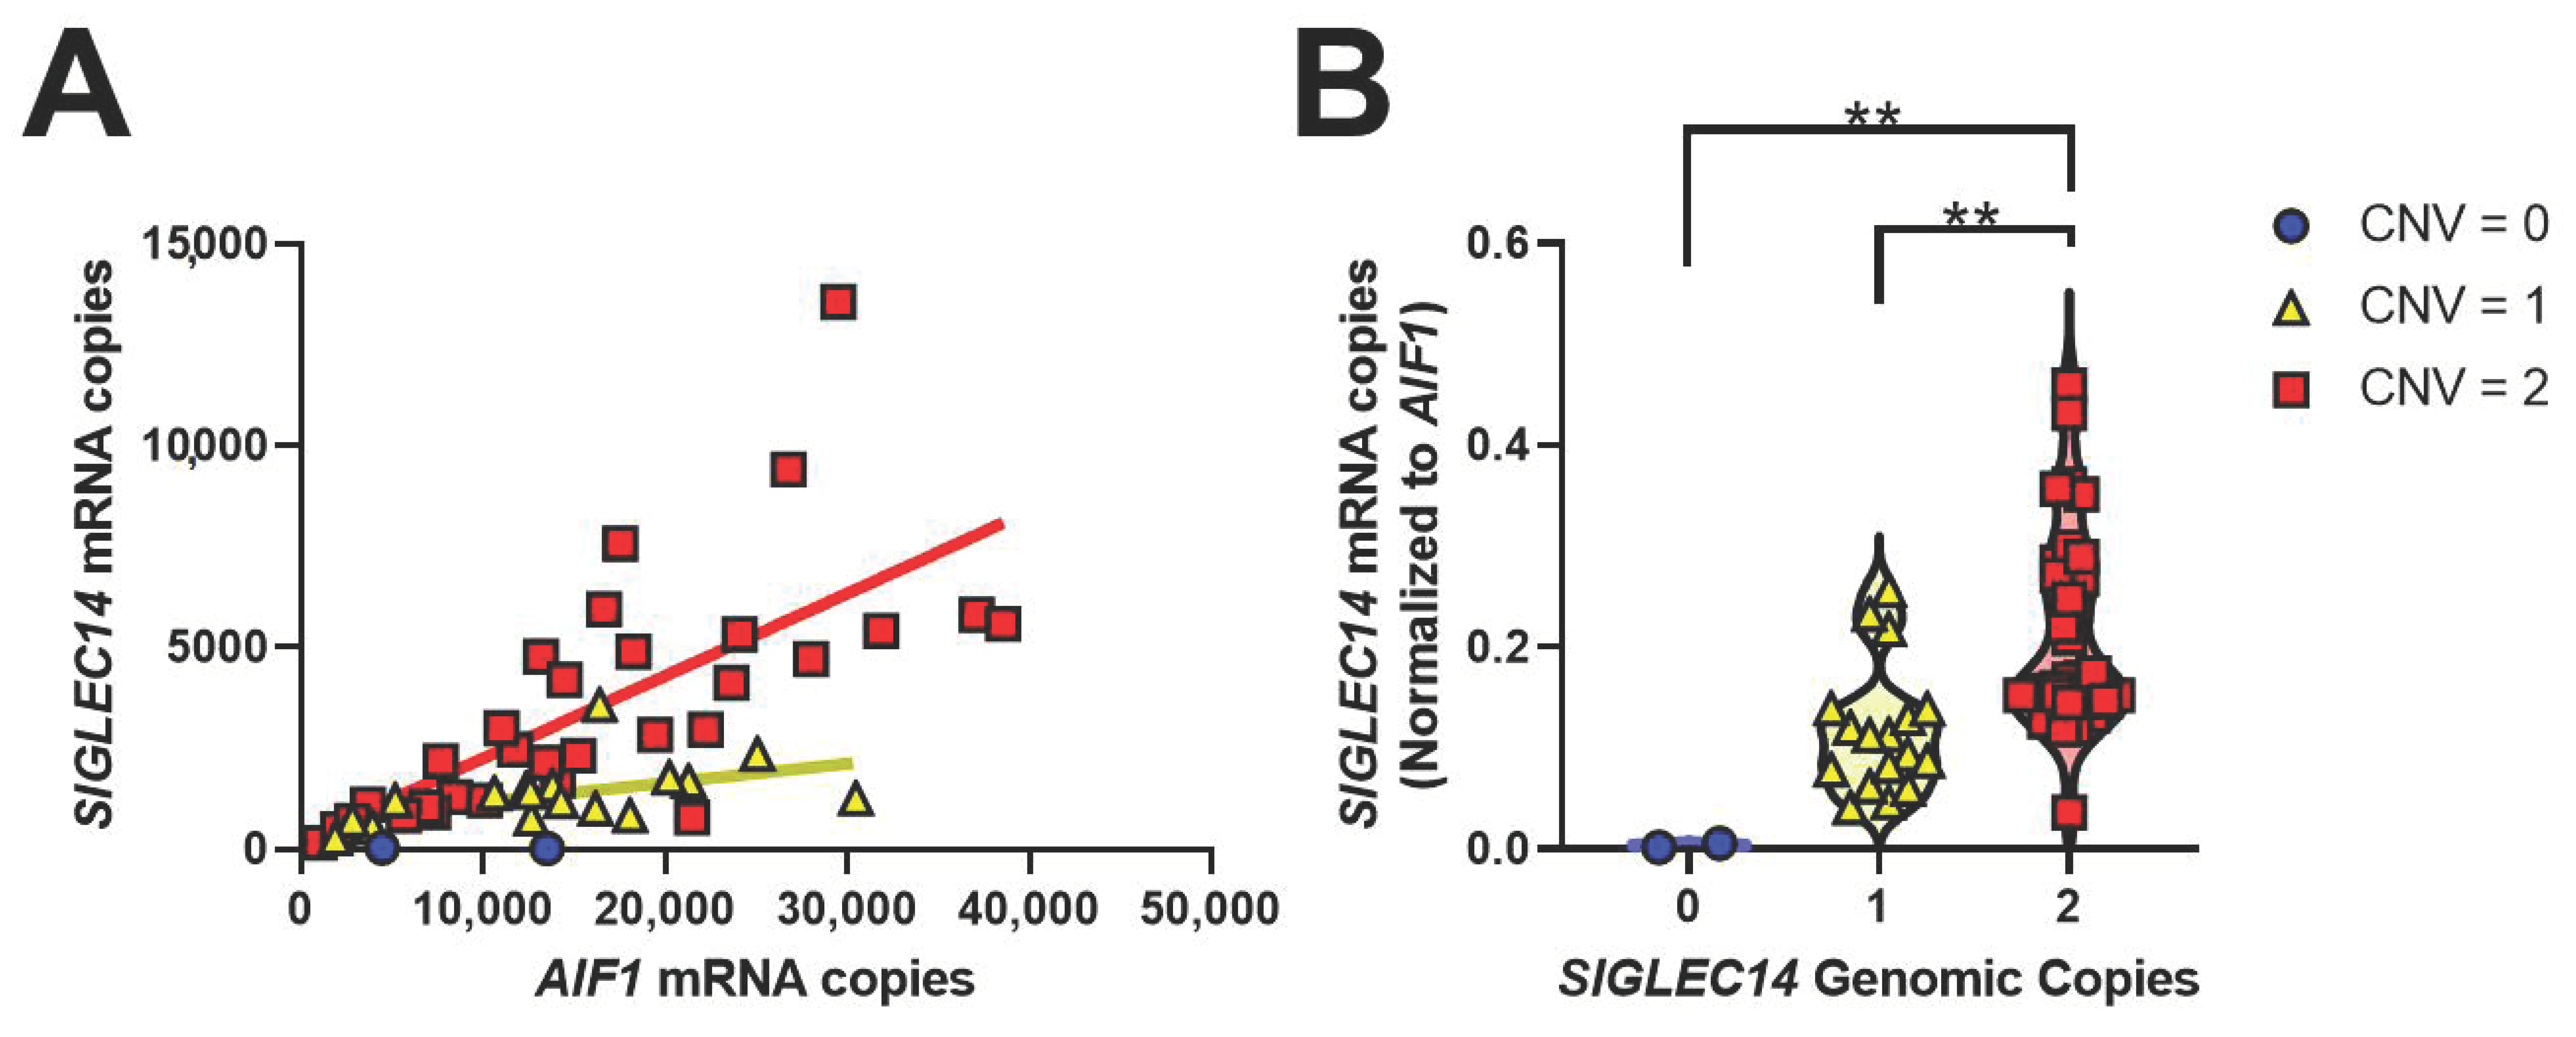
3.4. SIGLEC14 Is Expressed in Human Brain, and CNV Correlates with Gene Expression

To test whether gene expression compensation may neutralize the effect of genomic SIGLEC14 deletion, we quantified SIGLEC14 expression relative to SIGLEC14 gene copy number in cDNA prepared from human brain samples. Consistent with RNAseq studies that show SIGLEC14 is expressed in microglia, SIGLEC14 expression strongly correlated with expression of the microglial gene AIF1 (p < 0.0001, r2 = 0.409, Figure 3A) [19,32]. When SIGLEC14 expression is normalized to AIF1 expression, SIGLEC14 expression was dependent in a step-wise manner with SIGLEC14 CNV (p = 0.0002, F2,47 = 10.679, Figure 3B). Strikingly, individuals with one copy of SIGLEC14 have a mean SIGLEC14 expression of 54.6% compared to individuals with two copies. We interpret this to mean that there is no compensatory increase in SIGLEC14 expression in individuals heterozygous for SIGLEC14 deletion.

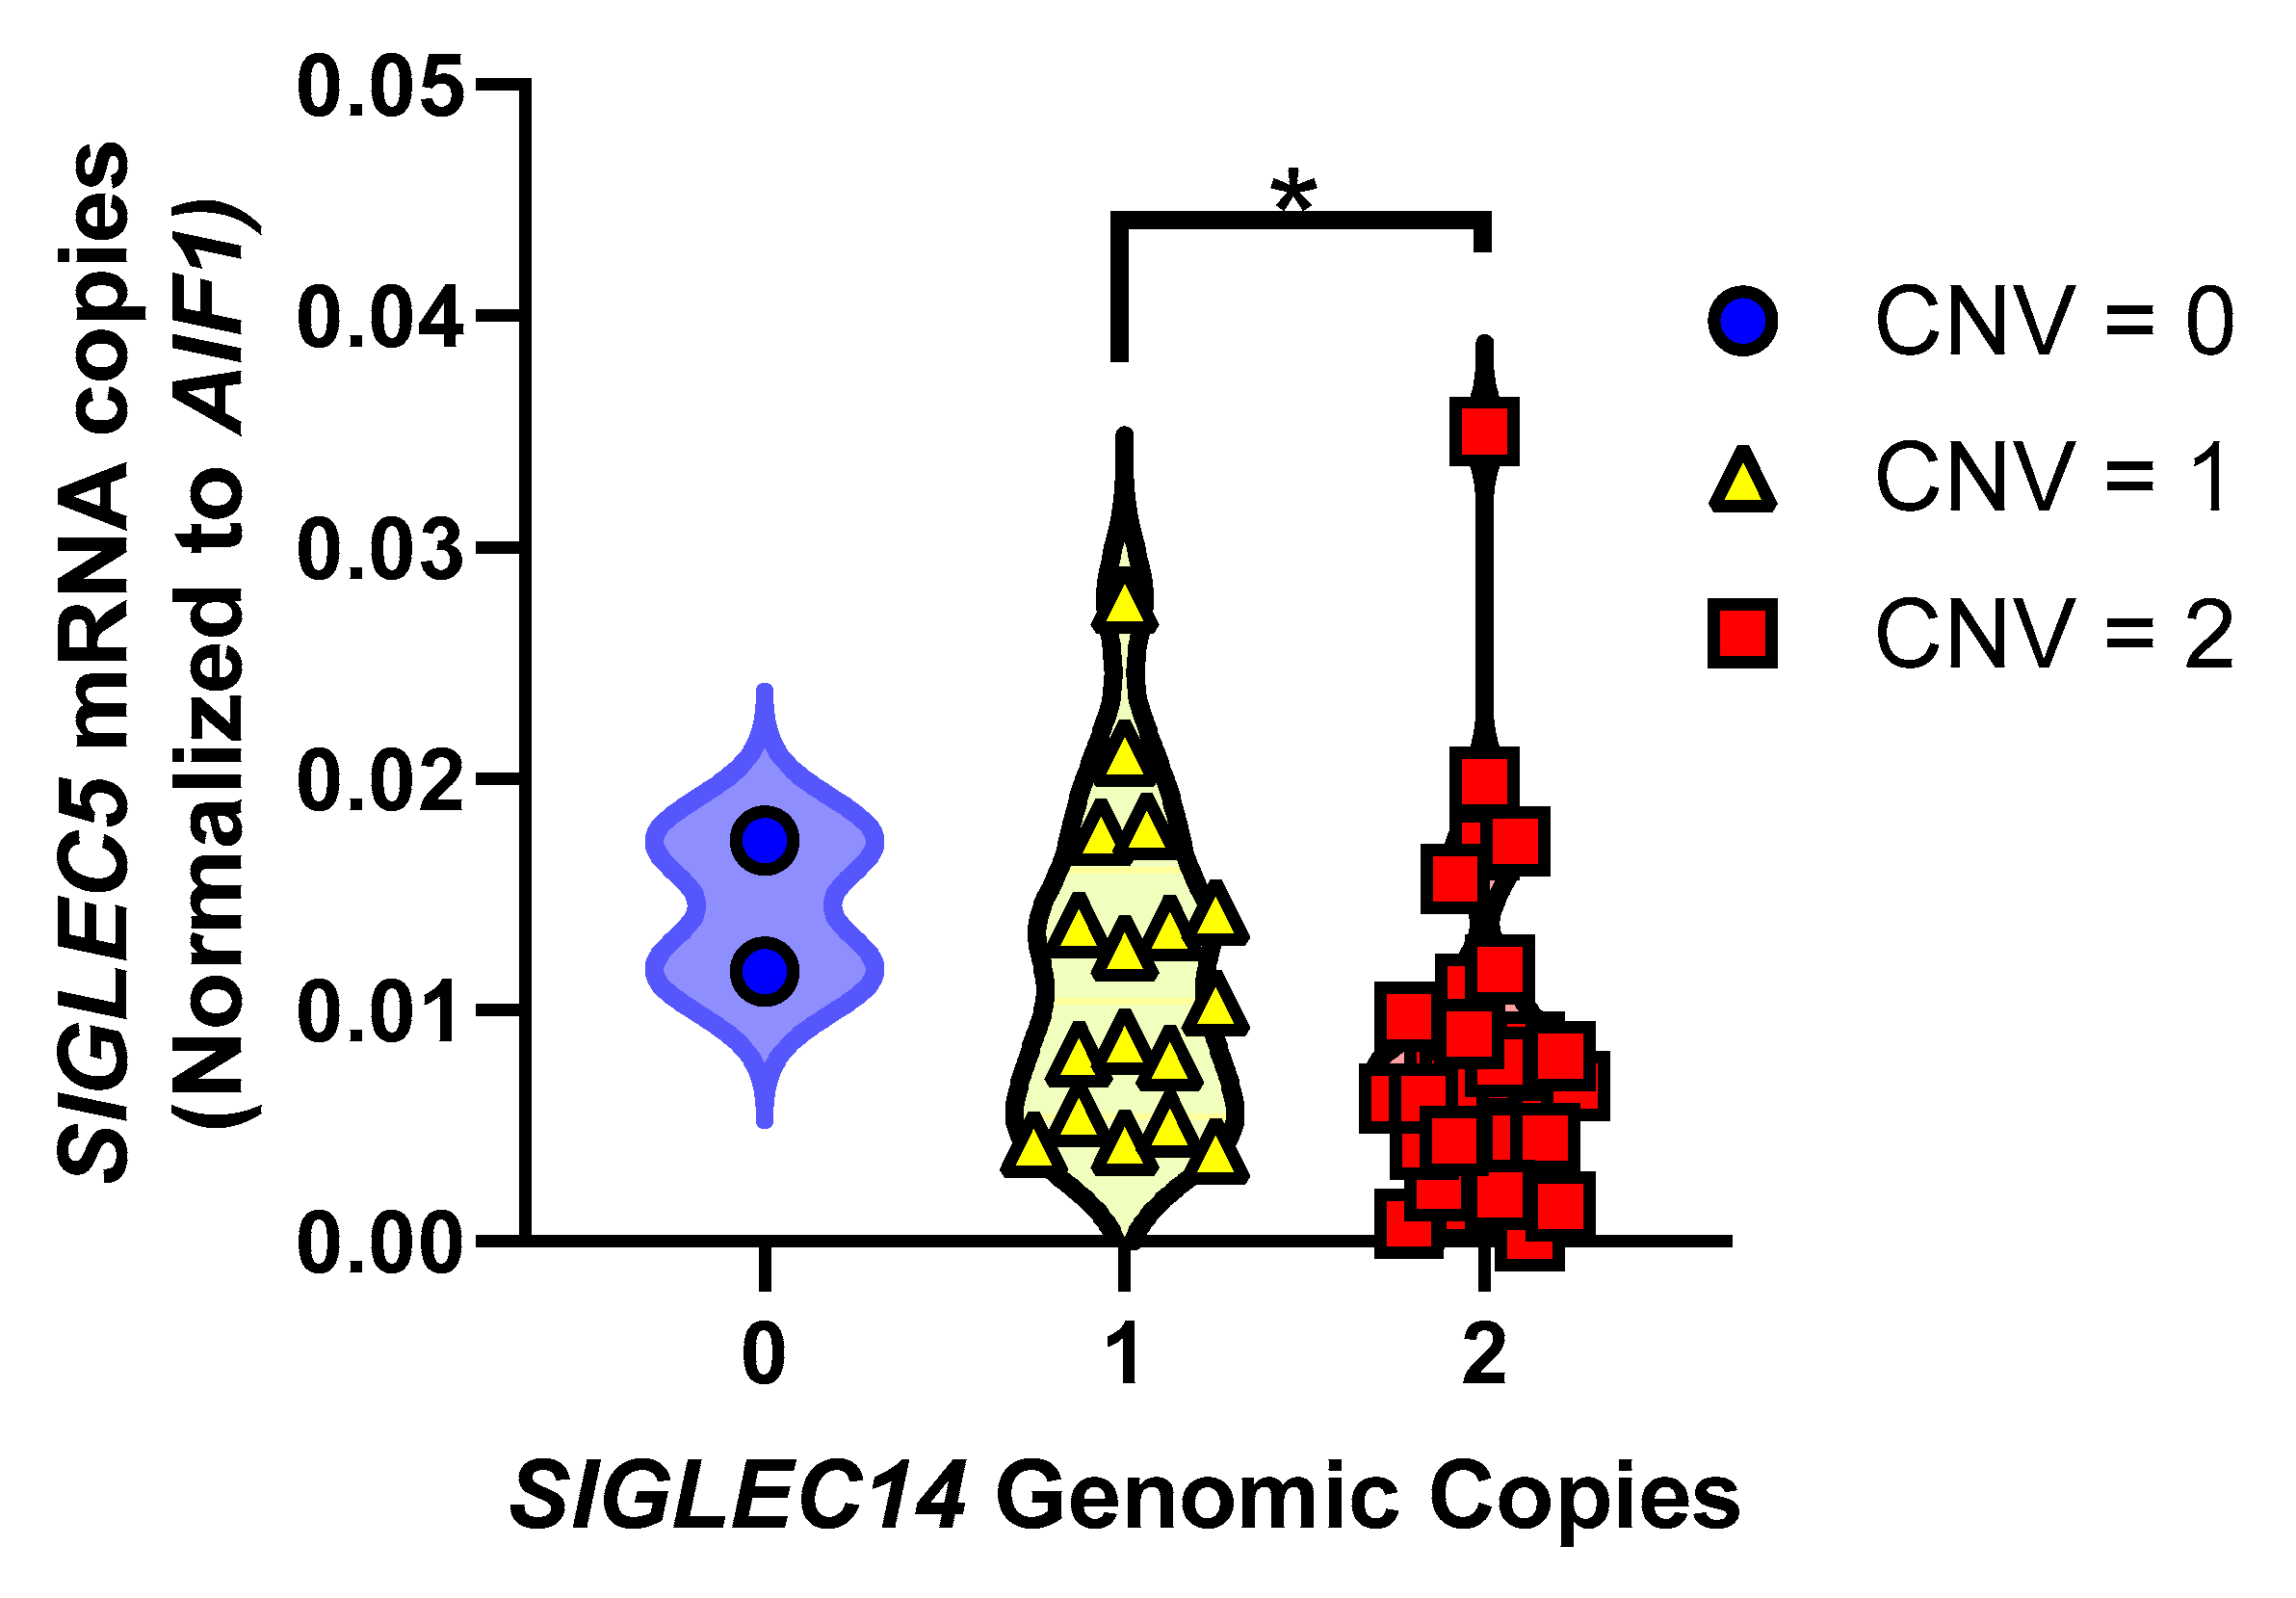
3.5. SIGLEC14 Deletion Leads to Increased SIGLEC5 Expression

To test whether SIGLEC5 expression changed with respect to SIGLEC14 deletion, we quantified SIGLEC5 expression relative to SIGLEC14 CNV in these same brain samples. Since SIGLEC5 does not have its own promoter and there are no H3K27 acetylation peaks between SIGLEC14 and SIGLEC5, we hypothesized that an inverse relationship exists between SIGLEC14 CNV and SIGLEC5 expression, where a SIGLEC14 deletion brings SIGLEC5 closer to the promoter leading to increased transcription (Supplemental Figure S4) [33,34,35]. We found that SIGLEC5 expression significantly increases with respect to SIGLEC14 genomic deletions (Figure 4; p = 0.0220, F2,46 = 4.151).

4. Discussion

The primary finding of this paper is that pQTLs for ITIM and ITAM-containing proteins are overrepresented as being nominally significant for AD risk, suggesting that the ITIM and ITAM family of proteins may contribute to AD pathogenesis. This adds to the current body of work which supports the hypothesis that AD is mediated, at least in part, by immune cell dysfunction [1,4,5,36]. Indeed, transcriptomics and genomics studies have frequently identified genes predominantly expressed in microglia within the CNS as associated with AD risk [37,38,39,40,41]. Within a pQTL study, variants that affect the expression of the ITIM/ITAM family of genes—which govern immune cell activation state—are more commonly associated with AD risk than variants for genes, not in this family (Table 2). Although we hypothesized that variants that enhanced ITAM levels or decreased ITIM levels would be associated with reduced AD risk, this was not observed. This likely indicates that while some of these pQTLs may reflect increased functional signaling, others may involve alterations in splicing to generate soluble isoforms or may increase susceptibility to cleavage from the cell surface. Hence, an SNP that associates with increased plasma protein levels does not necessarily correlate with increased cell surface expression and signaling.
SIGLEC14 was selected for further investigation based on its previously reported deletion polymorphism and close relationship to another AD-associated gene, CD33 [2,25]. Since SNPs have previously been recognized as proxies for deletion of other genes [42,43,44], and SIGLEC14 deletion has been previously reported [25], we hypothesized that the strong pQTL signal from rs1106476 reported in Sun et al. [24] correlated with SIGLEC14 deletion. Indeed, we found that rs1106476 is a proxy for SIGLEC14 deletion and the minor allele count corresponds to the number of SIGLEC14 deletions in 89% of cases in our dataset (Table 3).
This proxy variant does not, however, predict copy numbers greater than two. For instance, we observed four individuals with three copies of SIGLEC14; two of these individuals were homozygous minor for rs1106476 and two were heterozygous for rs1106476 (Table 3). Additional copy number variation is also present in the ADSP and ADNI sequencing projects (Figure 2). These CNVs are equivalent across populations in these datasets (Table 4, Supplemental Figures S1–S3). Based on these data and the recombination peak which spans from upstream of SIGLEC14 through exon 8 of SIGLEC5 (Supplemental Figure S5), we hypothesize that the additional copies integrate from a deletion event, though far less frequently than the deletion itself [45]. Across the 3095 individual WGS dataset in ADSP, we found SIGLEC14 deletion has a minor allele frequency (MAF) of 0.2023, while insertion occurs at a MAF of only 0.0195, suggesting a 10-times lower rate of integration than deletion (Table 4).
In the brain, SIGLEC14 is predominantly expressed in microglia, in keeping with its putative role as an immune receptor (Figure 3A). The SIGLEC14 deletion polymorphism also strongly correlates with SIGLEC14 gene expression (Figure 3B). Due to the low frequency of the additional copy integration, we do not have sufficient samples with which to correlate SIGLEC14 expression to additional copy numbers, nor can we conclude whether additional SIGLEC14 genomic copies are transcribed in frame and subsequently produce protein.
We also find that SIGLEC14 deletion increases the expression of SIGLEC5 (Figure 4). For individuals with at least one copy of SIGLEC14, the expression of SIGLEC14 is substantially higher than SIGLEC5. Coupled with the lack of an independent promoter or H3K27 acetylation peaks between the two genes in GeneHancer or Encode, respectively, we infer that expression of both genes is governed by a common promoter proximal to SIGLEC14, that the integrity of this promoter is preserved after SIGLEC14 deletion, and that SIGLEC14 deletion results in an increase in SIGLEC5 expression due to its closer proximity to this common element. The SIGLEC family of receptors bind sialic acids as ligands to initiate their signaling cascades, and sialylated proteins, as well as gangliosides, are abundant in amyloid plaques [46,47,48]. This decrease in expression of SIGLEC14, an ITAM-coupling protein, and concomitant increase in expression of SIGLEC5, an ITIM-containing protein, may lead to a dampened microglial activation state or proportion of activated microglia in deletion carriers. We speculate that decreased SIGLEC14 expression and increased SIGLEC5 expression may decrease the phagocytic capacity in AD. This is similar to the inverse relationship between TREM2 and CD33, two well-known AD risk factors. Loss of the ITAM-containing TREM2 decreases phagocytic capacity, while loss of CD33 increases phagocytic capacity [11,13,49]. Since TREM2, which couples with DAP12, is critical for the transition of microglia into a full disease-associated phenotype, SIGLEC14 may also contribute to this transition [50]. Future studies could investigate whether at the single-cell level SIGLEC14 CNV affects disease-associated microglial induction.
Copy number variation may represent a relatively unexplored source of genetic variation in AD [51]. GWAS such as Jansen et al. rely on SNPs, which do not always capture the full range of variation [2]. Additionally, “camouflaged” genes such as SIGLEC5 and SIGLEC14 with high sequence identity due to gene duplication are challenging for WGS and WES technologies which rely on small fragments of DNA sequence, typically under 250 bp reads [51]. As such, variants which may have disease relevance and association may be overlooked with current methods. SIGLEC14 is an example of one such possibly overlooked risk contributor in AD. SIGLEC14 encodes an ITAM protein and signals through DAP12 similar to TREM2, and deletion of SIGLEC14 is associated with increased AD risk, also similar to SNPs that reduce TREM2 function [1,3,4,5]. Ligands for SIGLEC14, which include sialylated proteins, are commonly found within amyloid plaques similar to ligands for TREM2. We propose that the effect size and significance of association are masked through copy number variation not accounted for using the proxy SNP alone, i.e., loss of SIGLEC14 function likely increases risk, but the proxy SNP rs1106476 occasionally also marks the individuals with an extra SIGLEC14 copy, thus reducing the power of rs1106476 association with AD. We thus conclude that SIGLEC14 represents a potentially overlooked AD genetic risk factor due to complex genetics.

Supplementary Materials

The following are available online at https://www.mdpi.com/article/10.3390/genes12071008/s1, Figure S1: Whole genome sequencing (WGS) read depth data from the Alzheimer’s Disease Sequencing Project (ASDP) in Caucasian population, Figure S2: WGS read depth data from the ASDP in African American population, Figure S3: WGS read depth data from the ASDP in all other populations, Figure S4: The SIGLEC14 locus contains no H3K27Ac peaks nor regulatory elements between SIGLEC14 and SIGLEC5. Expression of SIGLEC14 is approximately ten times higher than SIGLEC5 in individuals with both copies of SIGLEC14, while SIGLEC5 expression is higher in individuals lacking SIGLEC14 copies, in keeping with a common promoter or enhancer governing the single locus, Figure S5: SIGLEC5 and SIGLEC14 share a broad recombination peak (gray line). Note that, since SIGLEC14 and SIGLEC5 are on the minus strand, these genes appear inverted in this figure and read right-to-left, Table S1: List of ITIM/ITAM genes and their aliases.

Author Contributions

Conceptualization, B.C.S., D.W.F. and S.E.; data curation, B.C.S. and Y.K.; formal analysis, B.C.S., Y.K., D.W.F. and S.E.; funding acquisition, D.W.F. and S.E.; investigation, B.C.S., Y.K., J.F.S., D.W.F. and S.E.; methodology, B.C.S., Y.K., J.F.S., D.W.F. and S.E.; resources, B.C.S., Y.K., J.F.S., D.W.F. and S.E.; supervision, D.W.F. and S.E.; visualization, B.C.S. and Y.K.; writing—original draft, B.C.S.; writing—reviewing and editing, B.C.S., Y.K., J.F.S., D.W.F. and S.E. All authors have read and agreed to the published version of the manuscript.

Funding

This work was funded by grants R21AG068370 (S.E.), RF1AG059717 (S.E.), RF1AG059717-01S1 (S.E. & B.C.S.), R56AG057191 (D.W.F. & Y.K.), R01AG057187 (D.W.F. & Y.K.), R21AG061551 (D.W.F. & Y.K.), R01AG054060 (D.W.F. & Y.K.), and the UK-ADC P30AG028383 from the National Institute on Aging.

Institutional Review Board Statement

The study was conducted according to the guidelines of the Declaration of Helsinki and approved by the Institutional Review Board at the University of Kentucky (protocol code 48095 on 9/16/2020).

Informed Consent Statement

Informed consent was obtained for all subjects involved in the study.

Data Availability Statement

The Sun et al. proteomics dataset is available through the supplementary materials provided in the original publication, accessed on 30 January 2020 [24]. The Jansen et al. AD summary statistics are available through: https://ctg.cncr.nl/software/summary_statistics, accessed on 10 January 2019.

Conflicts of Interest

The authors declare no conflict of interest.

References

  1. Hollingworth, P.; Harold, D.; Sims, R.; Gerrish, A.; Lambert, J.C.; Carrasquillo, M.M.; Abraham, R.; Hamshere, M.L.; Pahwa, J.S.; Moskvina, V.; et al. Common variants at ABCA7, MS4A6A/MS4A4E, EPHA1, CD33 and CD2AP are associated with Alzheimer’s disease. Nat. Genet. 2011, 43, 429–435. [Google Scholar] [CrossRef] [PubMed] [Green Version]
  2. Jansen, I.E.; Savage, J.E.; Watanabe, K.; Bryois, J.; Williams, D.M.; Steinberg, S.; Sealock, J.; Karlsson, I.K.; Hagg, S.; Athanasiu, L.; et al. Genome-wide meta-analysis identifies new loci and functional pathways influencing Alzheimer’s disease risk. Nat. Genet. 2019, 51, 404–413. [Google Scholar] [CrossRef] [PubMed]
  3. Kunkle, B.W.; Grenier-Boley, B.; Sims, R.; Bis, J.C.; Damotte, V.; Naj, A.C.; Boland, A.; Vronskaya, M.; van der Lee, S.J.; Amlie-Wolf, A.; et al. Genetic meta-analysis of diagnosed Alzheimer’s disease identifies new risk loci and implicates Abeta, tau, immunity and lipid processing. Nat. Genet. 2019, 51, 414–430. [Google Scholar] [CrossRef] [PubMed] [Green Version]
  4. Lambert, J.C.; Ibrahim-Verbaas, C.A.; Harold, D.; Naj, A.C.; Sims, R.; Bellenguez, C.; DeStafano, A.L.; Bis, J.C.; Beecham, G.W.; Grenier-Boley, B.; et al. Meta-analysis of 74,046 individuals identifies 11 new susceptibility loci for Alzheimer’s disease. Nat. Genet. 2013, 45, 1452–1458. [Google Scholar] [CrossRef] [Green Version]
  5. Naj, A.C.; Jun, G.; Beecham, G.W.; Wang, L.S.; Vardarajan, B.N.; Buros, J.; Gallins, P.J.; Buxbaum, J.D.; Jarvik, G.P.; Crane, P.K.; et al. Common variants at MS4A4/MS4A6E, CD2AP, CD33 and EPHA1 are associated with late-onset Alzheimer’s disease. Nat. Genet. 2011, 43, 436–441. [Google Scholar] [CrossRef] [Green Version]
  6. Novikova, G.; Kapoor, M.; Tcw, J.; Abud, E.M.; Efthymiou, A.G.; Chen, S.X.; Cheng, H.; Fullard, J.F.; Bendl, J.; Liu, Y.; et al. Integration of Alzheimer’s disease genetics and myeloid genomics identifies disease risk regulatory elements and genes. Nat. Commun. 2021, 12, 1–14. [Google Scholar] [CrossRef]
  7. Jones, L.; Holmans, P.A.; Hamshere, M.L.; Harold, D.; Moskvina, V.; Ivanov, D.; Pocklington, A.; Abraham, R.; Hollingworth, P.; Sims, R.; et al. Genetic evidence implicates the immune system and cholesterol metabolism in the aetiology of Alzheimer’s disease. PLoS ONE 2010, 5, e13950. [Google Scholar] [CrossRef]
  8. Karch, C.M.; Goate, A.M. Alzheimer’s disease risk genes and mechanisms of disease pathogenesis. Biol. Psychiatry 2015, 77, 43–51. [Google Scholar] [CrossRef] [Green Version]
  9. Malik, M.; Parikh, I.; Vasquez, J.B.; Smith, C.; Tai, L.; Bu, G.; LaDu, M.J.; Fardo, D.W.; Rebeck, G.W.; Estus, S. Genetics ignite focus on microglial inflammation in Alzheimer’s disease. Mol. Neurodegener. 2015, 10, 52. [Google Scholar] [CrossRef] [PubMed] [Green Version]
  10. Bhattacherjee, A.; Jung, S.J.; Ho, M.; Eskandari-Sedighi, G.; St. Laurent, C.D.; McCord, K.A.; Bains, A.; Gaurav, S.; Sarkar, S.S.; Plemel, J.; et al. The CD33 short isoform is a gain-of-function variant that enhances Aβ1-42 phagocytosis in microglia. Mol. Neurodegener. 2021, 16, 1–22. [Google Scholar] [CrossRef]
  11. Bhattacherjee, A.; Rodrigues, E.; Jung, J.; Luzentales-Simpson, M.; Enterina, J.R.; Galleguillos, D.; St. Laurent, C.D.; Nakhaei-Nejad, M.; Fuchsberger, F.F.; Streith, L.; et al. Repression of phagocytosis by human CD33 is not conserved with mouse CD33. Commun. Biol. 2019, 2, 450. [Google Scholar] [CrossRef] [Green Version]
  12. Chan, G.; White, C.C.; Winn, P.A.; Cimpean, M.; Replogle, J.M.; Glick, L.R.; Cuerdon, N.E.; Ryan, K.J.; Johnson, K.A.; Schneider, J.A.; et al. CD33 modulates TREM2: Convergence of Alzheimer loci. Nat. Neurosci. 2015, 18, 1556–1558. [Google Scholar] [CrossRef] [Green Version]
  13. Griciuc, A.; Serrano-Pozo, A.; Parrado, A.R.; Lesinski, A.N.; Asselin, C.N.; Mullin, K.; Hooli, B.; Choi, S.H.; Hyman, B.T.; Tanzi, R.E. Alzheimer’s Disease Risk Gene CD33 Inhibits Microglial Uptake of Amyloid Beta. Neuron 2013, 78, 631–643. [Google Scholar] [CrossRef] [PubMed] [Green Version]
  14. Malik, M.; Chiles, I.I.I.J.; Xi, H.S.; Medway, C.; Simpson, J.; Potluri, S.; Howard, D.; Liang, Y.; Paumi, C.M.; Mukherjee, S.; et al. Genetics of CD33 in Alzheimer’s disease and acute myeloid leukemia. Hum. Mol. Genet. 2015, 24, 3557–3570. [Google Scholar] [CrossRef] [Green Version]
  15. Malik, M.; Simpson, J.F.; Parikh, I.; Wilfred, B.R.; Fardo, D.W.; Nelson, P.T.; Estus, S. CD33 Alzheimer’s Risk-Altering Polymorphism, CD33 Expression, and Exon 2 Splicing. J. Neurosci. 2013, 33, 13320–13325. [Google Scholar] [CrossRef] [PubMed] [Green Version]
  16. Raj, T.; Ryan, K.J.; Replogle, J.M.; Chibnik, L.B.; Rosenkrantz, L.; Tang, A.; Rothamel, K.; Stranger, B.E.; Bennett, D.A.; Evans, D.A.; et al. CD33: Increased inclusion of exon 2 implicates the Ig V-set domain in Alzheimer’s disease susceptibility. Hum. Mol. Genet. 2014, 23, 2729–2736. [Google Scholar] [CrossRef] [PubMed] [Green Version]
  17. Siddiqui, S.S.; Springer, S.A.; Verhagen, A.; Sundaramurthy, V.; Alisson-Silva, F.; Jiang, W.; Ghosh, P.; Varki, A. The Alzheimer’s disease-protective CD33 splice variant mediates adaptive loss of function via diversion to an intracellular pool. J. Biol. Chem. 2017, 292, 15312–15320. [Google Scholar] [CrossRef] [Green Version]
  18. McQuade, A.; Kang, Y.J.; Hasselmann, J.; Jairaman, A.; Sotelo, A.; Coburn, M.; Shabestari, S.K.; Chadarevian, J.P.; Fote, G.; Tu, C.H.; et al. Gene expression and functional deficits underlie TREM2-knockout microglia responses in human models of Alzheimer’s disease. Nat. Commun. 2020, 11, 1–17. [Google Scholar] [CrossRef] [PubMed]
  19. Estus, S.; Shaw, B.C.; Devanney, N.; Katsumata, Y.; Press, E.E.; Fardo, D.W. Evaluation of CD33 as a genetic risk factor for Alzheimer’s disease. Acta Neuropathol. 2019, 138, 187–199. [Google Scholar] [CrossRef]
  20. Griciuc, A.; Tanzi, R.E. The role of innate immune genes in Alzheimer’s disease. Curr. Opin. Neurol. 2021, 34, 228–236. [Google Scholar] [CrossRef]
  21. Efthymiou, A.G.; Goate, A.M. Late onset Alzheimer’s disease genetics implicates microglial pathways in disease risk. Mol. Neurodegener. 2017, 12, 43. [Google Scholar] [CrossRef]
  22. Gandy, S.; Heppner, F.L. Microglia as dynamic and essential components of the amyloid hypothesis. Neuron 2013, 78, 575–577. [Google Scholar] [CrossRef] [Green Version]
  23. Allen, M.; Zou, F.; Chai, H.S.; Younkin, C.S.; Crook, J.; Pankratz, V.S.; Carrasquillo, M.M.; Rowley, C.N.; Nair, A.A.; Middha, S.; et al. Novel late-onset Alzheimer disease loci variants associate with brain gene expression. Neurology 2012, 79, 221–228. [Google Scholar] [CrossRef] [PubMed]
  24. Sun, B.B.; Maranville, J.C.; Peters, J.E.; Stacey, D.; Staley, J.R.; Blackshaw, J.; Burgess, S.; Jiang, T.; Paige, E.; Surendran, P.; et al. Genomic atlas of the human plasma proteome. Nature 2018, 558, 73–79. [Google Scholar] [CrossRef]
  25. Yamanaka, M.; Kato, Y.; Angata, T.; Narimatsu, H. Deletion polymorphism of SIGLEC14 and its functional implications. Glycobiology 2009, 19, 841–846. [Google Scholar] [CrossRef]
  26. Zou, F.; Gopalraj, R.K.; Lok, J.; Zhu, H.; Ling, I.F.; Simpson, J.F.; Tucker, H.M.; Kelly, J.F.; Younkin, S.G.; Dickson, D.W.; et al. Sex-dependent association of a common low-density lipoprotein receptor polymorphism with RNA splicing efficiency in the brain and Alzheimer’s disease. Hum. Mol. Genet. 2007, 17, 929–935. [Google Scholar] [CrossRef] [PubMed]
  27. Li, H.; Handsaker, B.; Wysoker, A.; Fennell, T.; Ruan, J.; Homer, N.; Marth, G.; Abecasis, G.; Durbin, R.; Genome Project Data Processing Subgroup. The Sequence Alignment/Map format and SAMtools. Bioinformatics 2009, 25, 2078–2079. [Google Scholar] [CrossRef] [PubMed] [Green Version]
  28. Barrow, A.D.; Trowsdale, J. You say ITAM and I say ITIM, let’s call the whole thing off: The ambiguity of immunoreceptor signalling. Eur. J. Immunol. 2006, 36, 1646–1653. [Google Scholar] [CrossRef]
  29. Dushek, O.; Goyette, J.; van der Merwe, P.A. Non-catalytic tyrosine-phosphorylated receptors. Immunol. Rev. 2012, 250, 258–276. [Google Scholar] [CrossRef]
  30. Isakov, N. Immunoreceptor tyrosine-based activation motif (ITAM), a unique module linking antigen and Fc receptors to their signaling cascades. J. Leukoc. Biol. 1997, 61, 6–16. [Google Scholar] [CrossRef] [Green Version]
  31. Ravetch, J.V. Immune Inhibitory Receptors. Science 2000, 290, 84–89. [Google Scholar] [CrossRef]
  32. Zhang, Y.; Sloan, S.A.; Clarke, L.E.; Caneda, C.; Plaza, C.A.; Blumenthal, P.D.; Vogel, H.; Steinberg, G.K.; Edwards, M.S.; Li, G.; et al. Purification and Characterization of Progenitor and Mature Human Astrocytes Reveals Transcriptional and Functional Differences with Mouse. Neuron 2016, 89, 37–53. [Google Scholar] [CrossRef] [Green Version]
  33. An integrated encyclopedia of DNA elements in the human genome. Nature 2012, 489, 57–74. [CrossRef]
  34. Fishilevich, S.; Nudel, R.; Rappaport, N.; Hadar, R.; Plaschkes, I.; Iny Stein, T.; Rosen, N.; Kohn, A.; Twik, M.; Safran, M.; et al. GeneHancer: Genome-wide integration of enhancers and target genes in GeneCards. Database 2017, 2017. [Google Scholar] [CrossRef] [Green Version]
  35. Kent, W.J.; Sugnet, C.W.; Furey, T.S.; Roskin, K.M.; Pringle, T.H.; Zahler, A.M.; Haussler, A.D. The Human Genome Browser at UCSC. Genome Res. 2002, 12, 996–1006. [Google Scholar] [CrossRef] [Green Version]
  36. Mawuenyega, K.G.; Sigurdson, W.; Ovod, V.; Munsell, L.; Kasten, T.; Morris, J.C.; Yarasheski, K.E.; Bateman, R.J. Decreased Clearance of CNS-Amyloid in Alzheimer’s Disease. Science 2010, 330, 1774. [Google Scholar] [CrossRef] [Green Version]
  37. Holtman, I.R.; Raj, D.D.; Miller, J.A.; Schaafsma, W.; Yin, Z.; Brouwer, N.; Wes, P.D.; Möller, T.; Orre, M.; Kamphuis, W.; et al. Induction of a common microglia gene expression signature by aging and neurodegenerative conditions: A co-expression meta-analysis. Acta Neuropathol. Commun. 2015, 3, 31. [Google Scholar] [CrossRef] [PubMed] [Green Version]
  38. Miller, J.A.; Woltjer, R.L.; Goodenbour, J.M.; Horvath, S.; Geschwind, D.H. Genes and pathways underlying regional and cell type changes in Alzheimer’s disease. Genome Med. 2013, 5, 48. [Google Scholar] [CrossRef] [PubMed] [Green Version]
  39. Orre, M.; Kamphuis, W.; Osborn, L.M.; Melief, J.; Kooijman, L.; Huitinga, I.; Klooster, J.; Bossers, K.; Hol, E.M. Acute isolation and transcriptome characterization of cortical astrocytes and microglia from young and aged mice. Neurobiol. Aging 2014, 35, 1–14. [Google Scholar] [CrossRef] [PubMed]
  40. Wes, P.D.; Easton, A.; Corradi, J.; Barten, D.M.; Devidze, N.; Decarr, L.B.; Truong, A.; He, A.; Barrezueta, N.X.; Polson, C.; et al. Tau Overexpression Impacts a Neuroinflammation Gene Expression Network Perturbed in Alzheimer’s Disease. PLoS ONE 2014, 9, e106050. [Google Scholar] [CrossRef]
  41. Zhang, B.; Gaiteri, C.; Bodea, L.-G.; Wang, Z.; McElwee, J.; Podtelezhnikov, A.A.; Zhang, C.; Xie, T.; Tran, L.; Dobrin, R.; et al. Integrated Systems Approach Identifies Genetic Nodes and Networks in Late-Onset Alzheimer’s Disease. Cell 2013, 153, 707–720. [Google Scholar] [CrossRef] [PubMed] [Green Version]
  42. Abdollahi, M.R.; Huang, S.; Rodriguez, S.; Guthrie, P.A.I.; Smith, G.D.; Ebrahim, S.; Lawlor, D.A.; Day, I.N.M.; Gaunt, T.R. Homogeneous Assay of rs4343, anACEI/D Proxy, and an Analysis in the British Women’s Heart and Health Study (BWHHS). Dis. Markers 2008, 24, 11–17. [Google Scholar] [CrossRef] [Green Version]
  43. Hinds, D.A.; Kloek, A.P.; Jen, M.; Chen, X.; Frazer, K.A. Common deletions and SNPs are in linkage disequilibrium in the human genome. Nat. Genet. 2006, 38, 82–85. [Google Scholar] [CrossRef]
  44. McCarroll, S.A.; Huett, A.; Kuballa, P.; Chilewski, S.D.; Landry, A.; Goyette, P.; Zody, M.C.; Hall, J.L.; Brant, S.R.; Cho, J.H.; et al. Deletion polymorphism upstream of IRGM associated with altered IRGM expression and Crohn’s disease. Nat. Genet. 2008, 40, 1107–1112. [Google Scholar] [CrossRef] [PubMed]
  45. Machiela, M.J.; Chanock, S.J. LDlink: A web-based application for exploring population-specific haplotype structure and linking correlated alleles of possible functional variants. Bioinformatics 2015, 31, 3555–3557. [Google Scholar] [CrossRef]
  46. Ariga, T.; McDonald, M.P.; Yu, R.K. Thematic Review Series: Sphingolipids. Role of ganglioside metabolism in the pathogenesis of Alzheimer’s disease—A review. J. Lipid Res. 2008, 49, 1157–1175. [Google Scholar] [CrossRef] [PubMed] [Green Version]
  47. Yanagisawa, K. Role of gangliosides in Alzheimer’s disease. Biochim. Biophys. Acta (BBA) Biomembr. 2007, 1768, 1943–1951. [Google Scholar] [CrossRef] [Green Version]
  48. Salminen, A.; Kaarniranta, K. Siglec receptors and hiding plaques in Alzheimer’s disease. J. Mol. Med. 2009, 87, 697–701. [Google Scholar] [CrossRef]
  49. Griciuc, A.; Patel, S.; Federico, A.N.; Choi, S.H.; Innes, B.J.; Oram, M.K.; Cereghetti, G.; McGinty, D.; Anselmo, A.; Sadreyev, R.I.; et al. TREM2 Acts Downstream of CD33 in Modulating Microglial Pathology in Alzheimer’s Disease. Neuron 2019, 103, 820–835.e827. [Google Scholar] [CrossRef]
  50. Keren-Shaul, H.; Spinrad, A.; Weiner, A.; Matcovitch-Natan, O.; Dvir-Szternfeld, R.; Ulland, T.K.; David, E.; Baruch, K.; Lara-Astaiso, D.; Toth, B.; et al. A Unique Microglia Type Associated with Restricting Development of Alzheimer’s Disease. Cell 2017, 169, 1276–1290.e1217. [Google Scholar] [CrossRef]
  51. Ebbert, M.T.W.; Jensen, T.D.; Jansen-West, K.; Sens, J.P.; Reddy, J.S.; Ridge, P.G.; Kauwe, J.S.K.; Belzil, V.; Pregent, L.; Carrasquillo, M.M.; et al. Systematic analysis of dark and camouflaged genes reveals disease-relevant genes hiding in plain sight. Genome. Biol. 2019, 20, 97. [Google Scholar] [CrossRef] [PubMed] [Green Version]
Figure 1. Identification of the SIGLEC14 deletion site. Coordinates in both are for reference genome. Exons 1-3 of SIGLEC14 and SIGLEC5 are identical which confounds exact determination of the crossover event. The yellow region depicts SIGLEC14, the blue region depicts SIGLEC5, while the green region depicts the 692 bp region of complete identity where the crossover deletion occurs.
Genes 12 01008 g001
Figure 2. SIGLEC14 CNVs detected in ADNI and ADSP cohorts. Read depth shown by chromosomal position of whole-genome sequencing in a representative example of each CNV detected. Exon/intron maps for SIGLEC14 and SIGLEC5 at figure top for reference. Purple: copy number variation. Inset: expanded view of locus. Red dotted line: location of copy number variation assay. The dotted line in the insets shows the boundaries of the full-size image.
Genes 12 01008 g002
Figure 3. SIGLEC14 expression correlates with microglial gene AIF1 and SIGLEC14 CNV. (A) SIGLEC14 is expressed in microglia (p < 0.0001, F1,48 = 33.19, r2 = 0.409). (B) SIGLEC14 CNV strongly correlates with SIGLEC14 gene expression (p = 0.0002, F2,47 = 10.679), Tukey’s post-hoc multiple comparisons test. ** p < 0.01. We do not have statistical power to compare expression with CNV > 2, given its low MAF.
Genes 12 01008 g003
Figure 4. SIGLEC5 expression inversely correlates with SIGLEC14 CNV. SIGLEC5 expression increases with fewer copies of SIGLEC14, presumably due to proximity to regulatory elements (p = 0.0220, F2,46 = 4.151), Tukey’s post-hoc multiple comparisons test. * p = 0.0389.
Genes 12 01008 g004
Table 1. Genes that are nominally significant for AD association with strong pQTL signal.
GeneSNPP (pQTL)β (pQTL)P (AD)β (AD)N (AD)ITIM/
ITAM
CD33rs124594190 −0.947.13 × 10−9−0.01330458,744ITIM
FCGR3Brs109195433.20 × 10−670.440.0003170.00806445,293ITAM
LILRA5rs7598192.50 × 10−111−0.540.001860.00717454,216ITAM
LILRB2rs3730327.60 × 10−146−0.720.002270.00763463,880ITIM
SIGLEC9rs20758030 −1.230.007030.00576466,252ITIM
SIRPB1rs38487881.20 × 10−2130.750.009420.00582458,092ITAM
COLEC12rs28466679.30 × 10−120.200.01770.00586449,987ITAM
FCRL1rs49711556.30 × 10−26−0.260.0197−0.00520403,829ITAM
NCR1rs22784281.10 × 10−15−0.360.02490.00815466,252ITAM
SIGLEC14rs11064760 −1.190.02840.00736458,063ITAM
FCRL3rs75286841.40 × 10−1120.530.04−0.00434458,744Both
MRC2rs1463850501.30 × 10−11−0.220.041−0.00612396,686ITAM
SLAMF6rs112915642.60 × 10−120.200.042−0.0245017,477ITAM
† The p-value in the analyzed summary statistics was reported as exactly 0. This does not impact our analysis, as our threshold was any cis-pQTL at p < 0.05.
Table 2. Overlap of pQTL and AD signals.
pQTLsITIM/ITAM (%)Not ITIM/ITAM (%)Total
AD p < 0.0513 (28)54 (10)67
AD p > 0.0534 (72)488 (90)522
Total47 (100)542 (100)589
Table 3. Evaluation of rs1106476 as a proxy for SIGLEC14 deletion.
SIGLEC14 Copiesrs1106476 T/Trs1106476 A/Trs1106476 A/ATotal
0 0112
1 613019
2 390039
3 2204
Total4716164
Blue = predicted correlation of SIGLEC14 deletion vs. rs1106476. Each cell represents the number of DNA samples with the indicated SIGLEC14 copy number and rs1106476 genotype.
Table 4. Summary of the SIGLEC14 CNV in the 3095 sample ADSP WGS dataset.
SIGLEC14 Copy NumberCaucasianAfrican AmericanOtherTotal
0247444142
1304348316968
26925226521866
3215343117
40112
Total104199810563095
Deletion MAF0.16910.24850.19130.2023
Addition MAF0.01010.02760.02130.0195
MAF: Minor allele frequency.
Publisher’s Note: MDPI stays neutral with regard to jurisdictional claims in published maps and institutional affiliations.

