

Genome-Wide Association Study Reveals Genomic Regions Associated with Fusarium Wilt Resistance in Common Bean

 ,
, 
Abstract
1. Introduction
2. Materials and Methods
2.1. Plant Material
2.2. DNA Extraction, Genotyping and SNP Calling
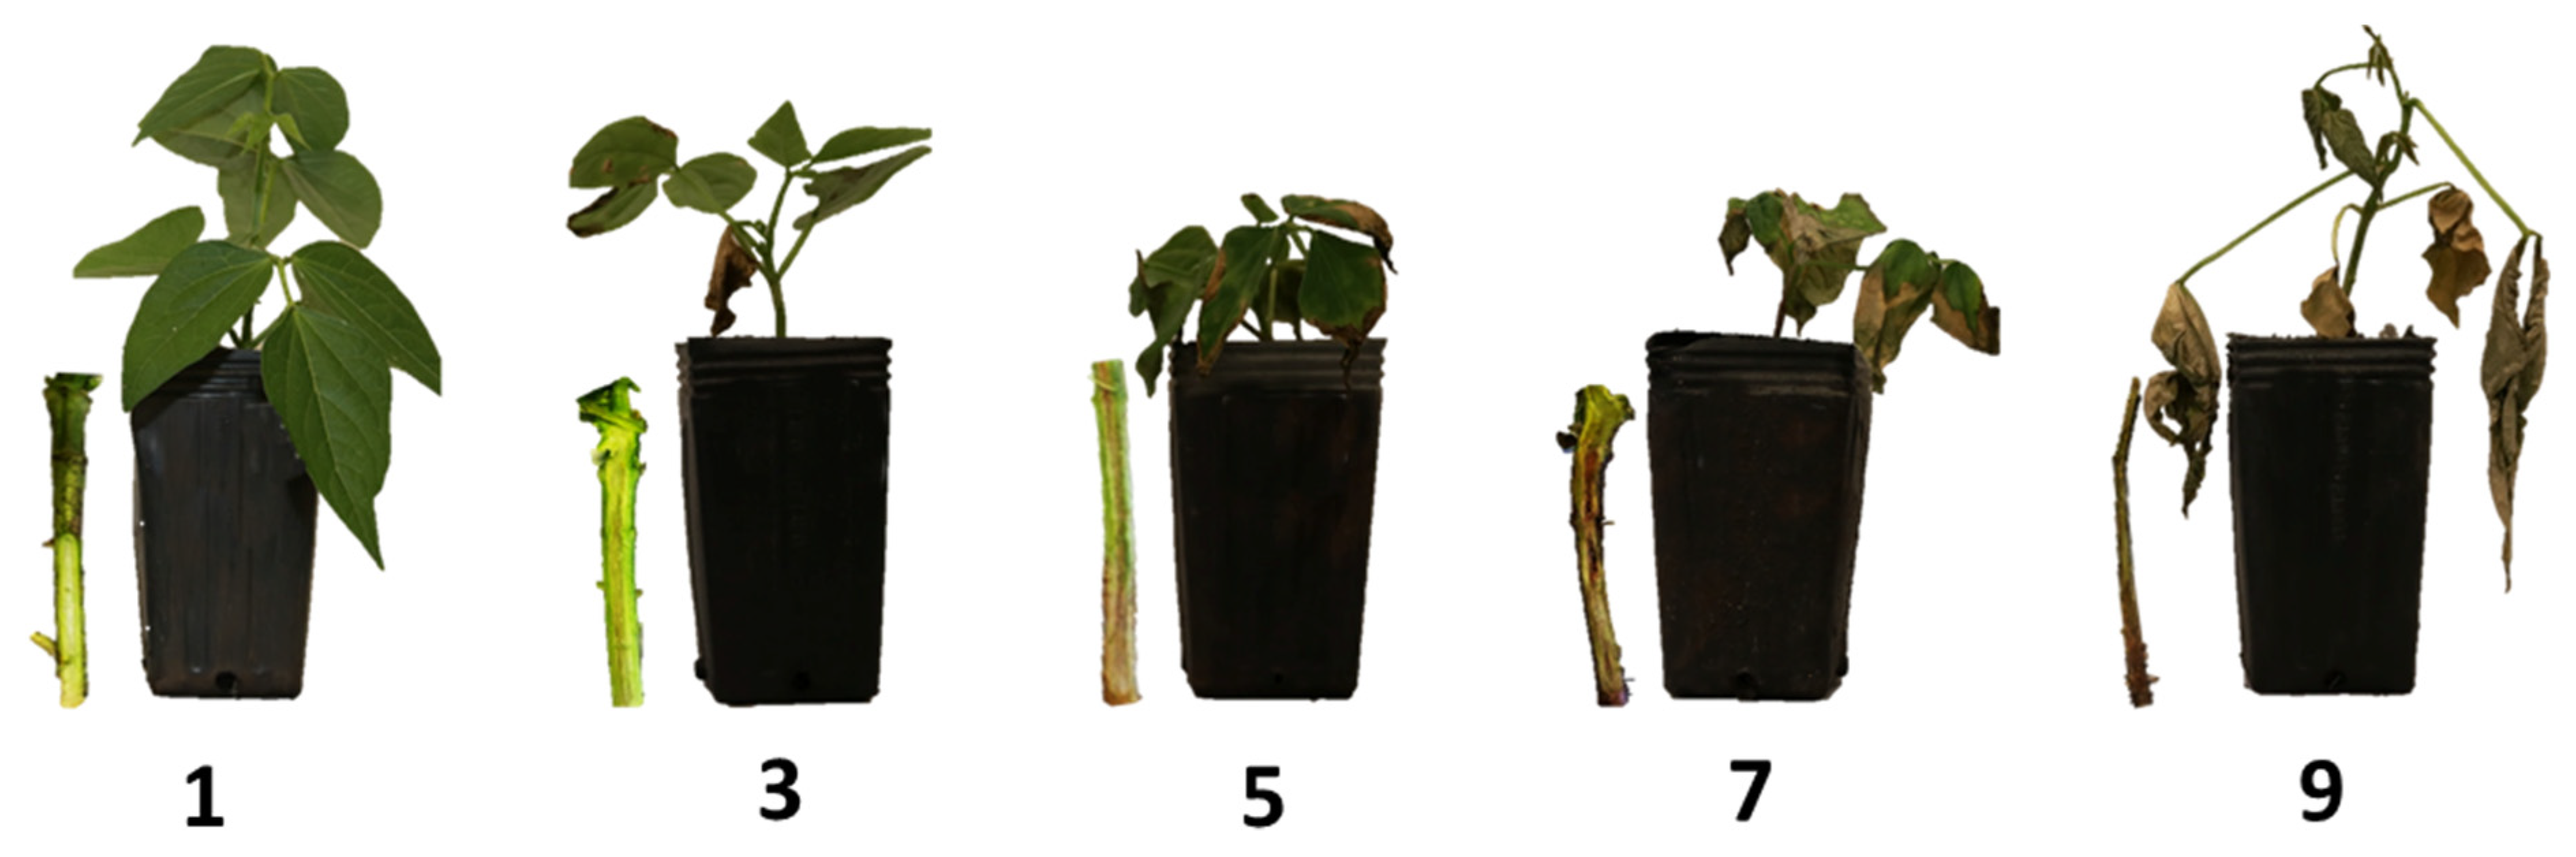
2.3. Inoculation and Evaluation of Fop Strains in Common Beans
2.4. Statistical Analysis and Prediction of Genotipic Values
2.5. Genome-Wide Association Studies
2.6. Candidate Gene Identification
3. Results
3.1. Evaluation of Fusarium Wilt Severity in Common Beans
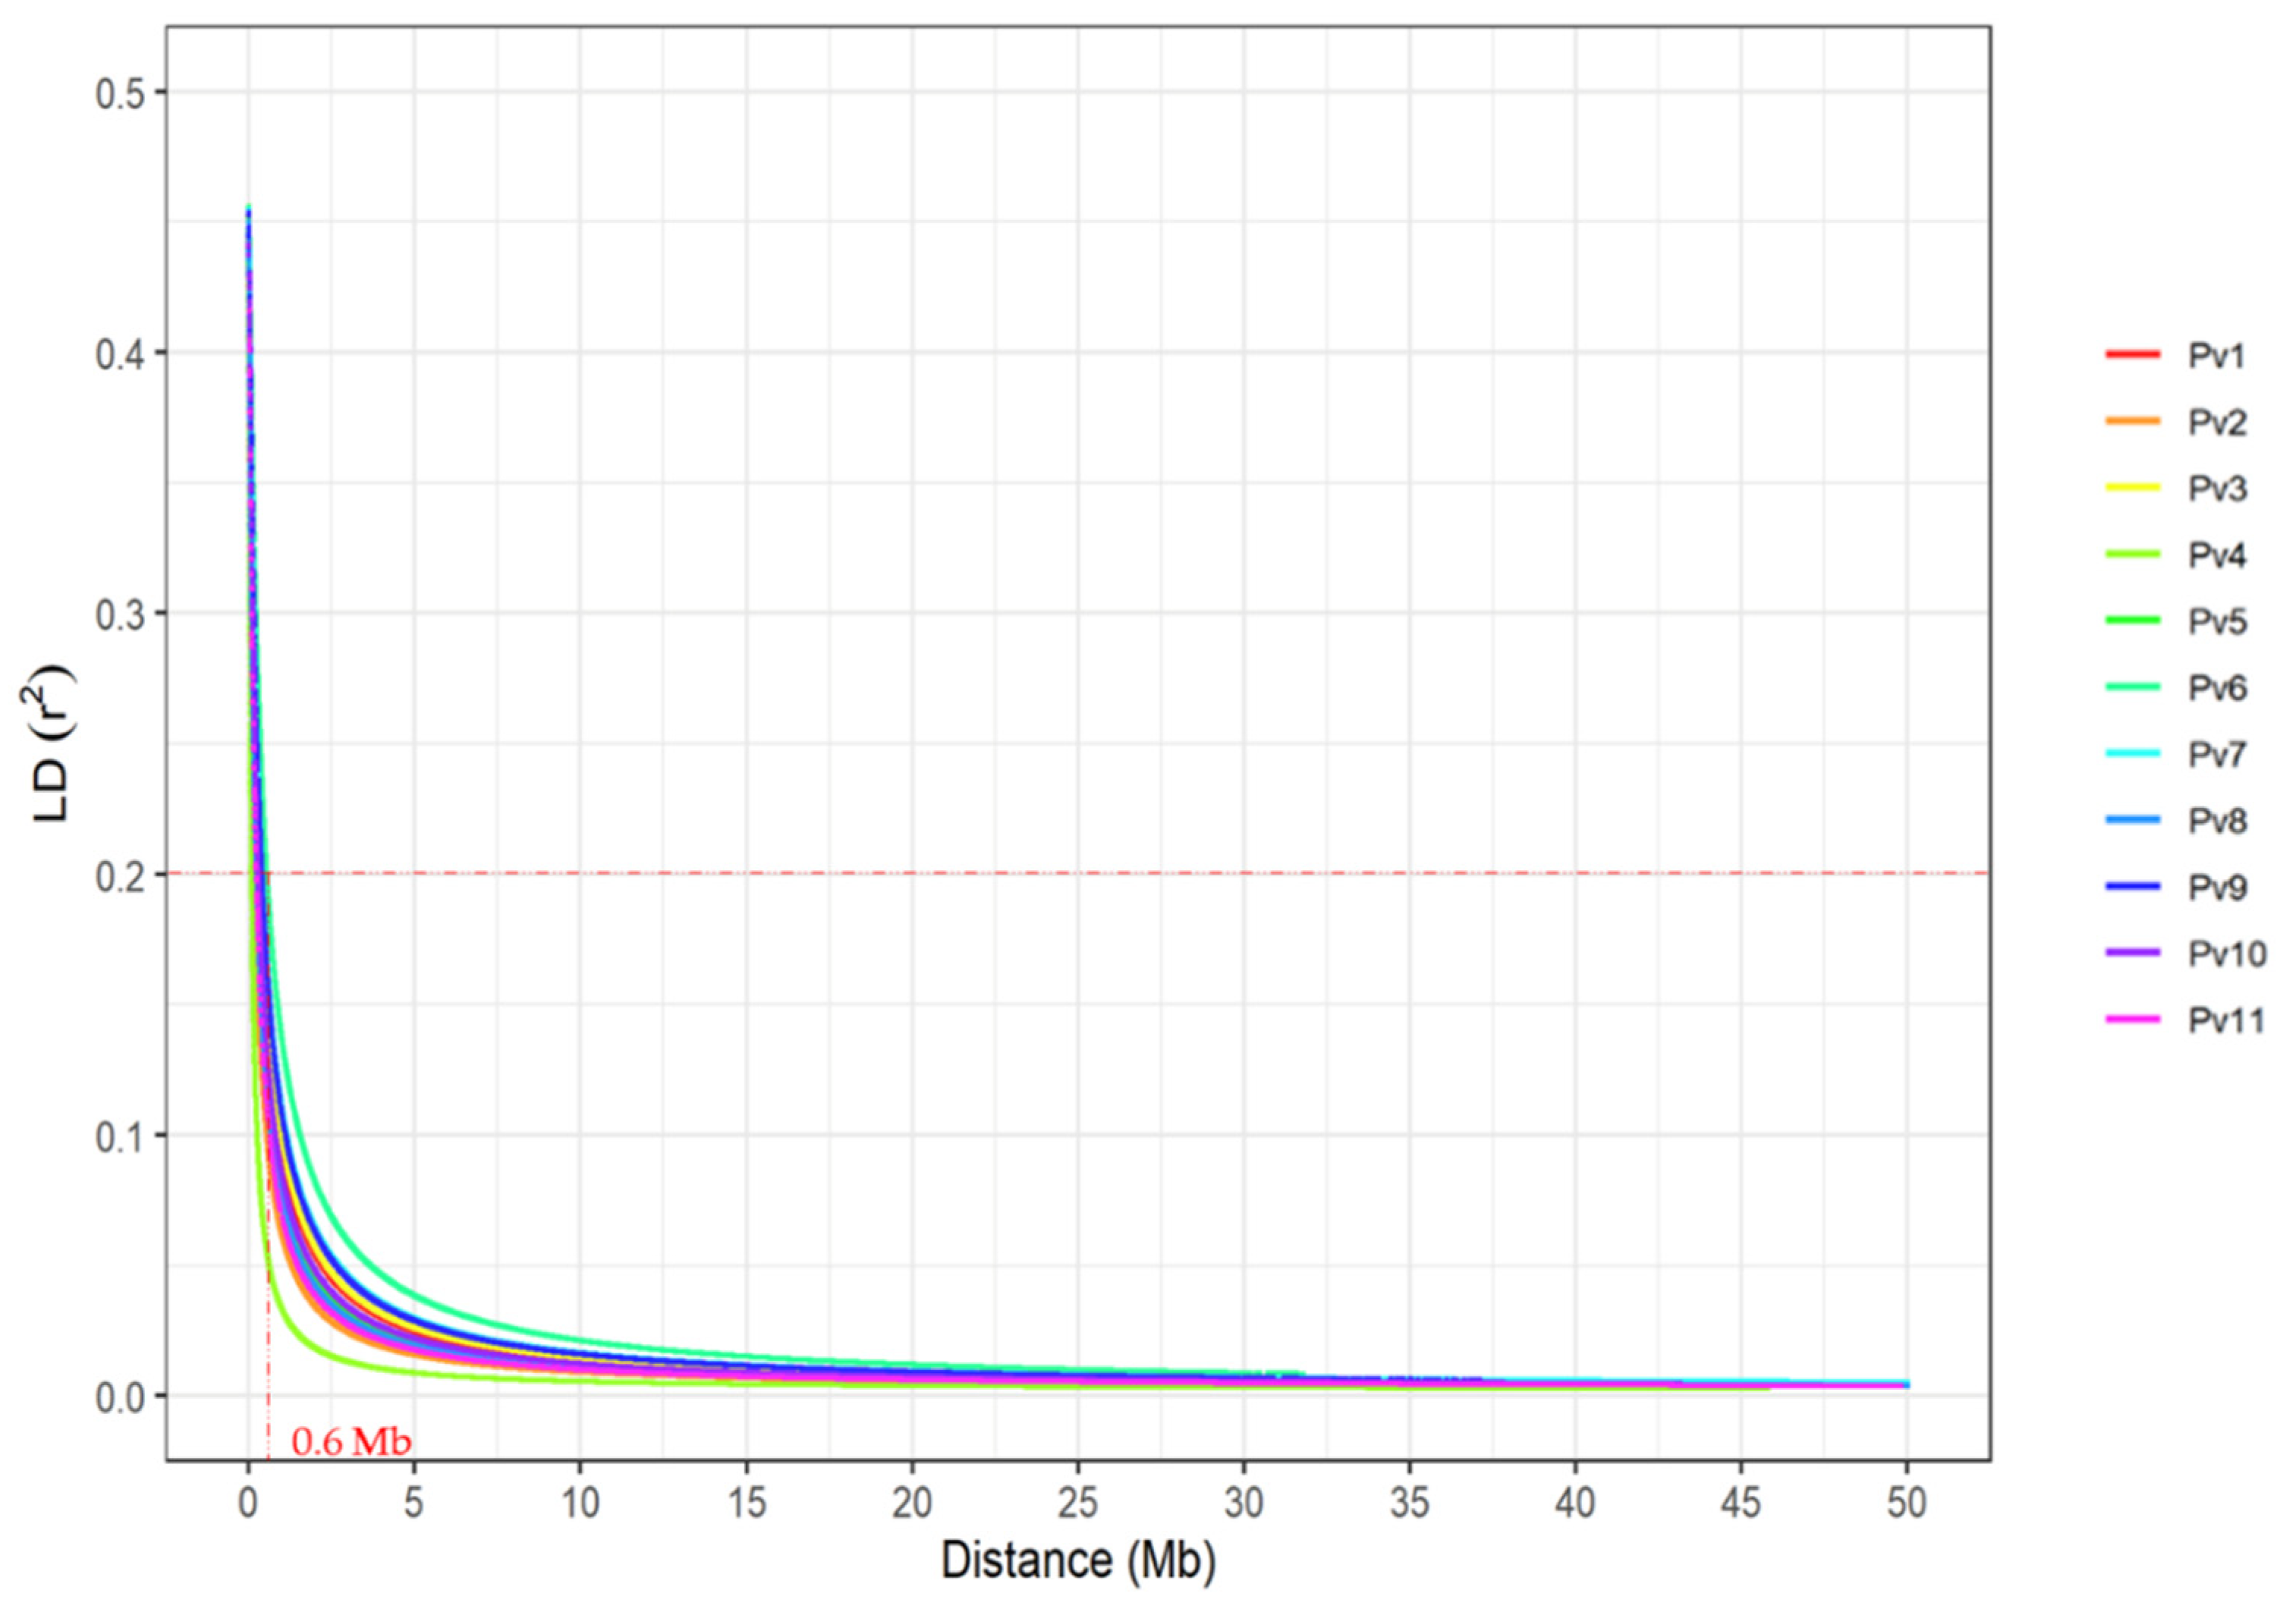
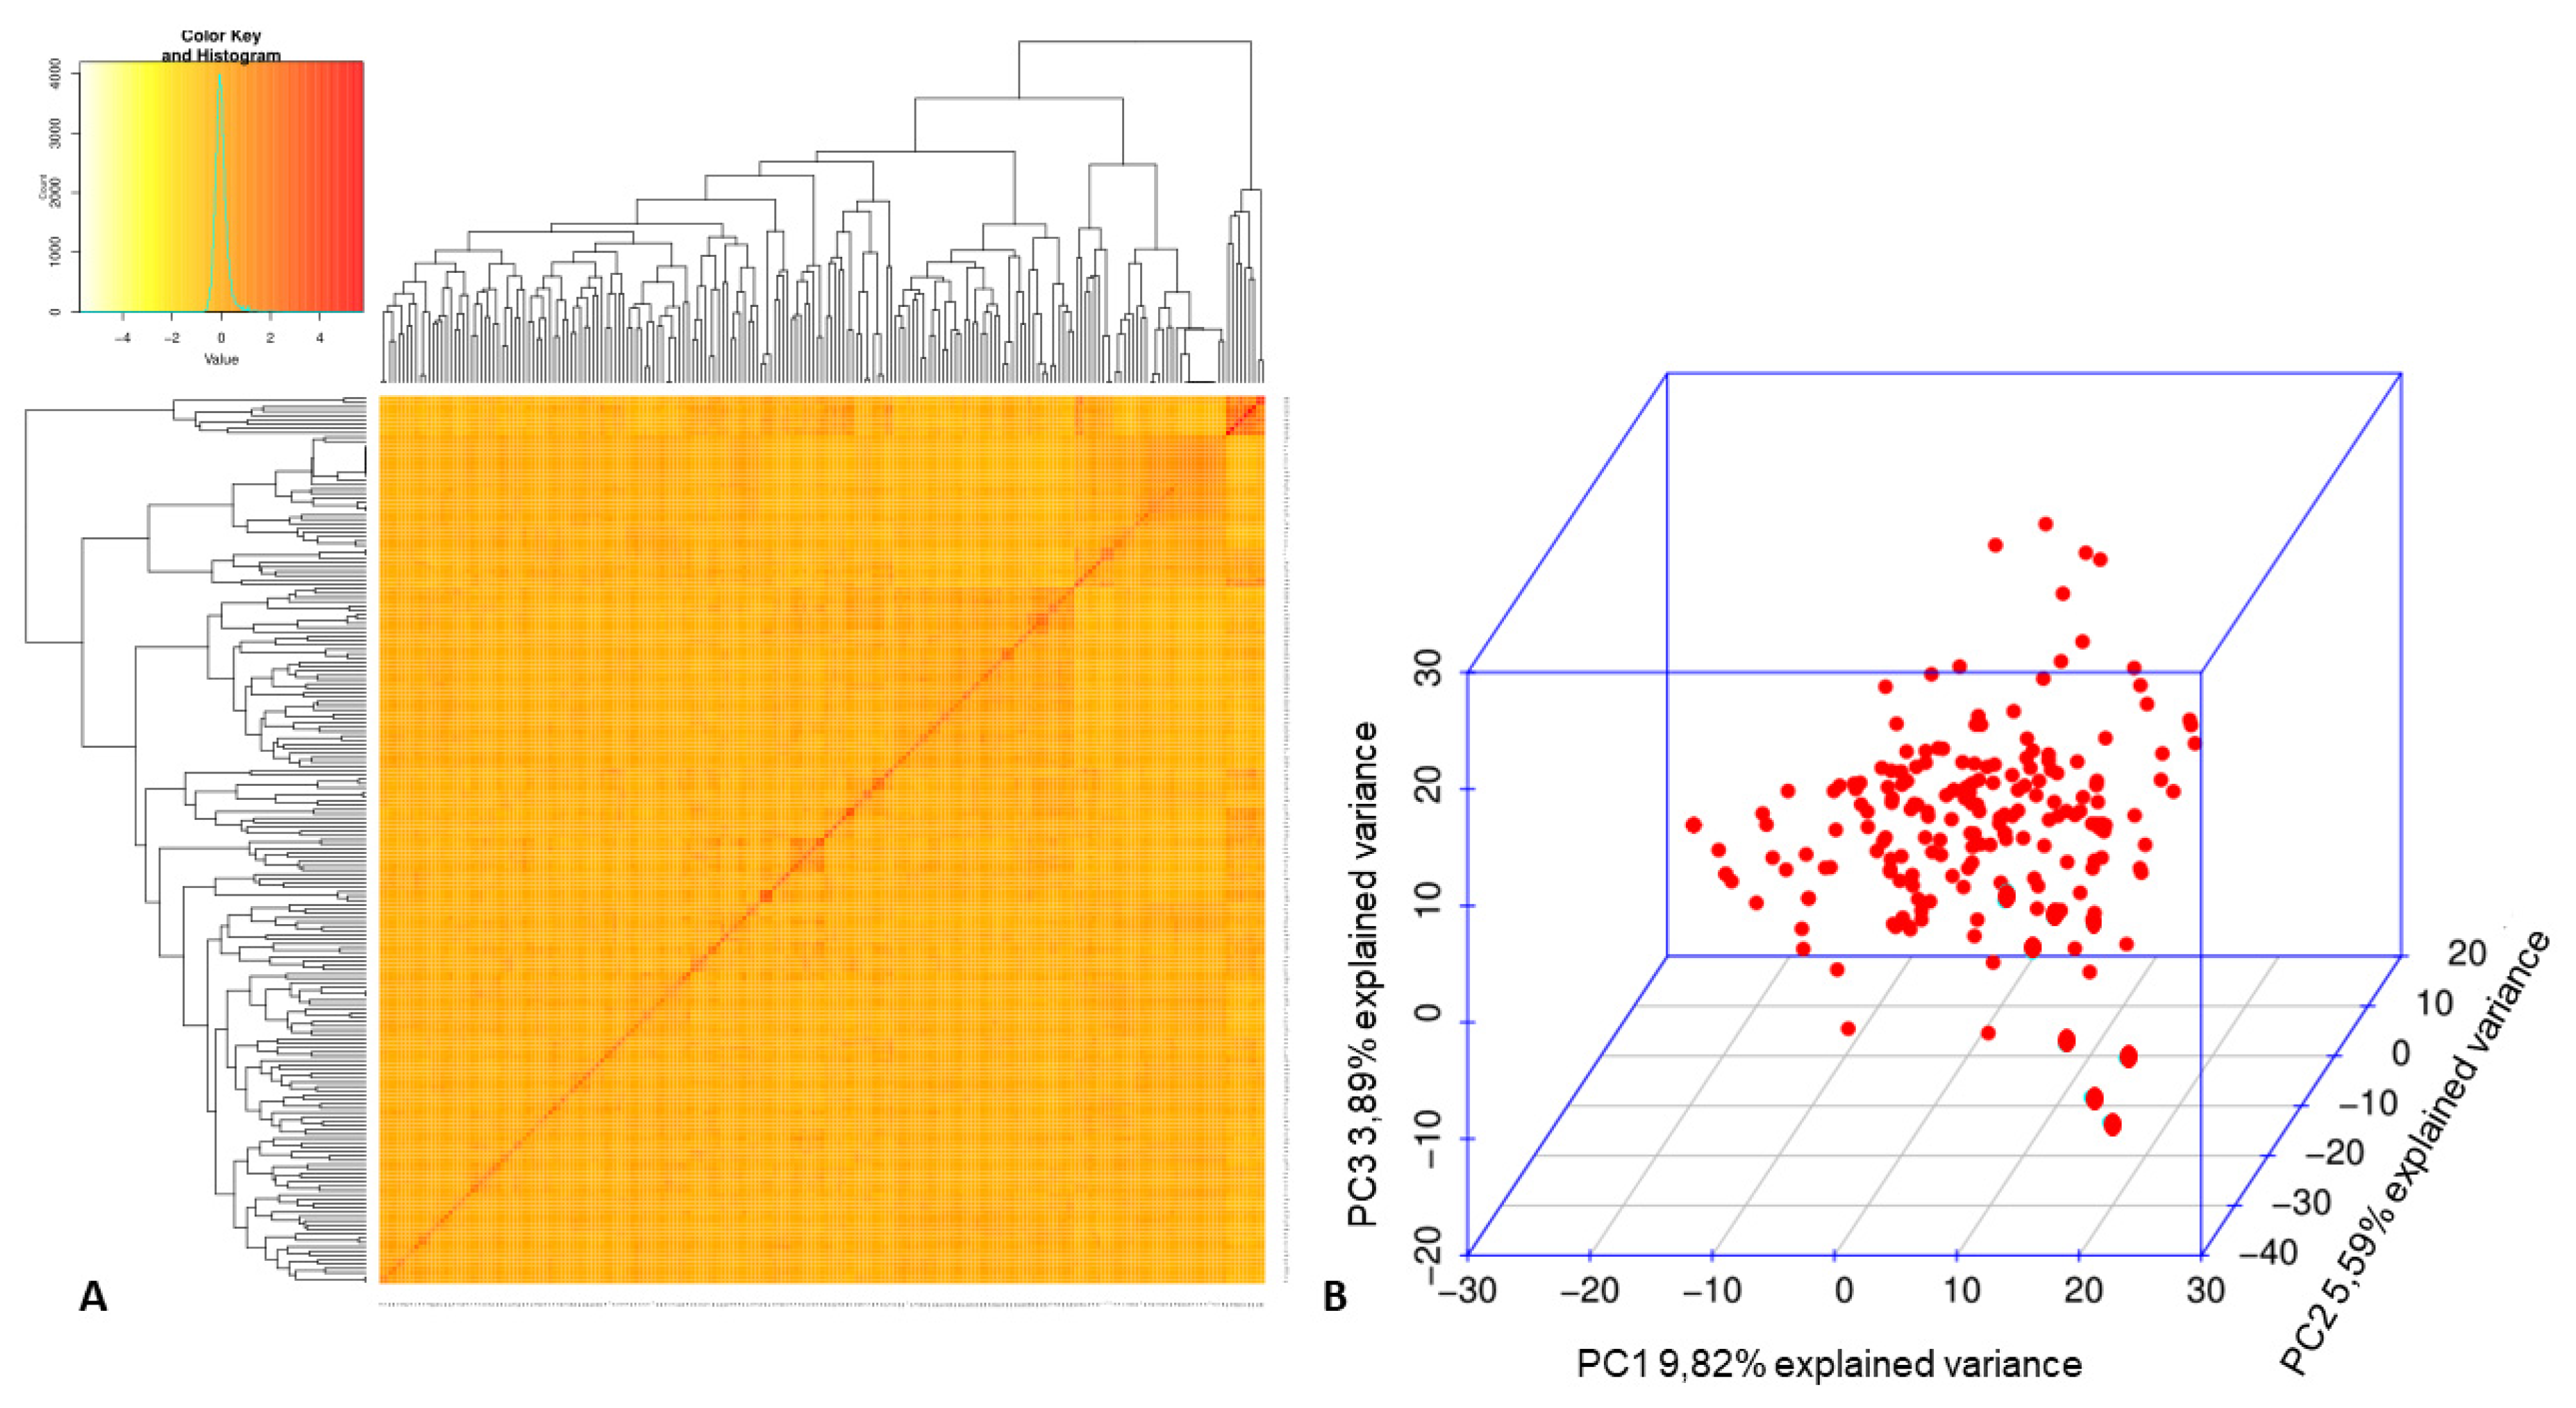
3.2. Association Mapping for Fusarium Wilt Resistance in the Mesoamerican Diversity Panel
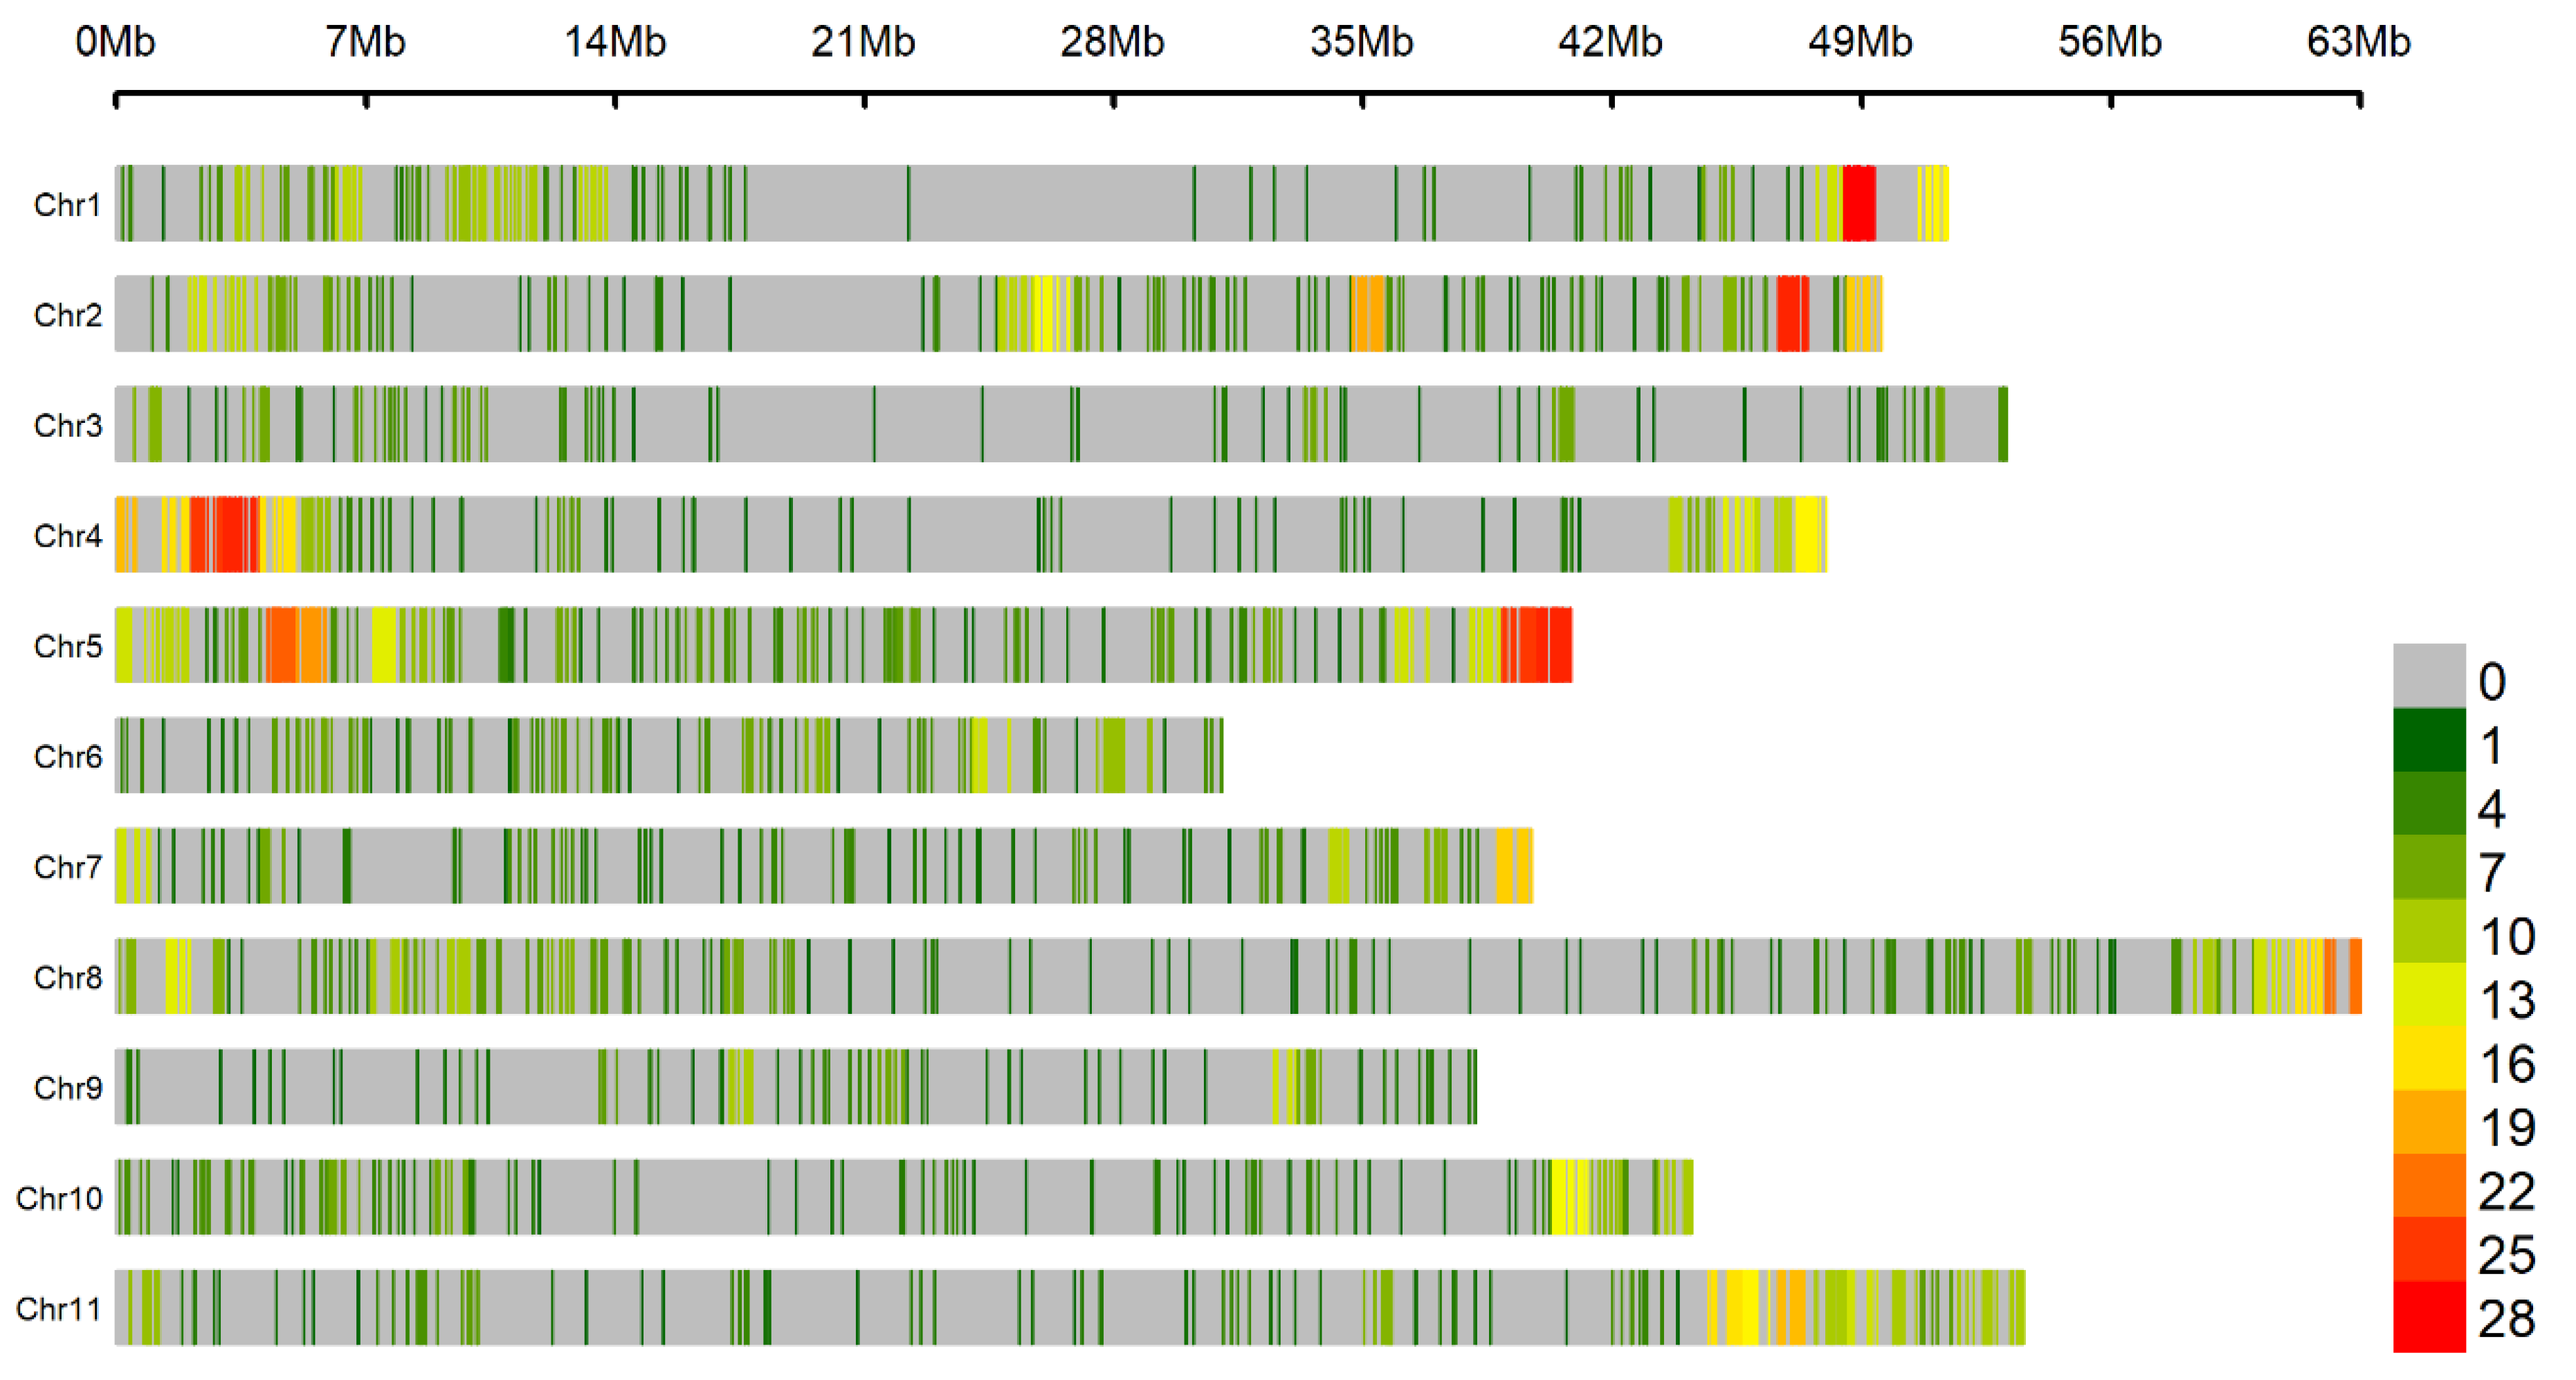
3.3. Genomic Regions Associated with Fusarium Wilt Resistance
4. Discussion
5. Conclusions
Supplementary Materials
Author Contributions
Funding
Institutional Review Board Statement
Informed Consent Statement
Data Availability Statement
Acknowledgments
Conflicts of Interest
References
- Bitocchi, E.; Bellucci, E.; Giardini, A.; Rau, D.; Rodriguez, M.; Biagetti, E.; Santilocchi, R.; Spagnoletti Zeuli, P.; Gioia, T.; Logozzo, G.; et al. Molecular analysis of the parallel domestication of the common bean (Phaseolus vulgaris) in Mesoamerica and the Andes. New Phytol. 2013, 197, 300–313. [Google Scholar] [CrossRef]
- Mamidi, S.; Rossi, M.; Annam, D.; Moghaddam, S.; Lee, R.; Papa, R.; McClean, P. Investigation of the domestication of common bean (Phaseolus vulgaris) using multilocus sequence data. Funct. Plant Biol. 2011, 38, 953–967. [Google Scholar] [CrossRef]
- De Ron, A.M.; Santalla, M. Phaseolus vulgaris (Beans). In Brenner’s Encyclopedia of Genetics, 2nd ed.; Elsevier Inc.: Amsterdam, The Netherlands, 2013; pp. 290–292. ISBN 9780080961569. [Google Scholar]
- Singh, S.P.; Gepts, P.; Debouck, D.G. Races of common bean (Phaseolus vulgaris, Fabaceae). Econ. Bot. 1991, 45, 379–396. [Google Scholar] [CrossRef]
- Burle, M.L.; Fonseca, J.R.; Kami, J.A.; Gepts, P. Microsatellite diversity and genetic structure among common bean (Phaseolus vulgaris L.) landraces in Brazil, a secondary center of diversity. Theor. Appl. Genet. 2010, 121, 801–813. [Google Scholar] [CrossRef]
- Blair, M.W.; Izquierdo, P.; Astudillo, C.; Grusak, M.A. A legume biofortification quandary: Variability and genetic control of seed coat micronutrient accumulation in common beans. Front. Plant. Sci. 2013, 4. [Google Scholar] [CrossRef] [PubMed]
- Chacón, S.M.I.; Pickersgill, B.; Debouck, D.G. Domestication patterns in common bean (Phaseolus vulgaris L.) and the origin of the Mesoamerican and Andean cultivated races. Theor. Appl. Genet. 2005, 110, 432–444. [Google Scholar] [CrossRef]
- Gepts, P.; Osborn, T.C.; Rashka, K.; Bliss, F.A. Phaseolin-protein Variability in Wild Forms and Landraces of the Common Bean (Phaseolus vulgaris): Evidence for Multiple Centers of Domestication. Econ. Bot. 1986, 40, 451–468. [Google Scholar] [CrossRef]
- Gepts, P.; Bliss, F.A. Dissemination pathways of common bean (Phaseolus vulgaris, Fabaceae) deduced from phaseolin electrophoretic variability. II. Europe and Africa. Econ. Bot. 1988, 42, 86–104. [Google Scholar] [CrossRef]
- FAO. FAOSTAT Food and Agriculture Organization of the United Nations (FAO); FAO Statistics Division: Rome, Italy, 2019.
- Companhia Nacional de Abastecimento (CONAB). Acompanhamento da safra brasileira de grãos: Safra 2018/19-Décimo segundo levantamento. Cia. Nac. de Abast. 2019, 6, 1–126. [Google Scholar]
- Panth, M.; Hassler, S.C.; Baysal-Gurel, F. Methods for management of soilborne diseases in crop production. Agriculture 2020, 10, 16. [Google Scholar] [CrossRef]
- De Toledo-Souza, E.D.; da Silveira, P.M.; Café-Filho, A.C.; Lobo Junior, M. Fusarium wilt incidence and common bean yield according to the preceding crop and the soil tillage system. Pesquisa Agropecuária Brasileira 2012, 47, 1031–1037. [Google Scholar] [CrossRef]
- Pereira, A.C.; Cruz, M.F.A.; Paula Júnior, T.J.; Rodrigues, F.A.; Carneiro, J.E.S.; Vieira, R.F.; Carneiro, P.C.S. Infection process of Fusarium oxysporum f. sp. phaseoli on resistant, intermediate and susceptible bean cultivars. Trop. Plant Pathol. 2013, 38, 323–328. [Google Scholar] [CrossRef]
- Garcés-Fiallos, F.R.; de Borba, M.C.; Schmidt, É.C.; Bouzon, Z.L.; Stadnik, M.J. Delayed upward colonization of xylem vessels is associated with resistance of common bean to Fusarium oxysporum f. sp. phaseoli. Eur. J. Plant Pathol. 2017, 149, 477–489. [Google Scholar] [CrossRef]
- Niño-Sánchez, J.; Tello, V.; Casado-del Castillo, V.; Thon, M.R.; Benito, E.P.; Díaz-Mínguez, J.M. Gene expression patterns and dynamics of the colonization of common bean (Phaseolus vulgaris L.) by highly virulent and weakly virulent strains of Fusarium oxysporum. Front. Microbiol. 2015, 6, 234. [Google Scholar] [CrossRef] [PubMed]
- Cross, H.; Brick, M.A.; Schwartz, H.F.; Panella, L.W.; Byrne, P.F. Inheritance of Resistance to Fusarium Wilt in Two Common Bean Races. Crop. Sci. 2000, 40, 954–958. [Google Scholar] [CrossRef]
- Singh, S.P.; Schwartz, H.F. Breeding common bean for resistance to diseases: A review. Crop. Sci. 2010, 50, 2199–2223. [Google Scholar] [CrossRef]
- Paulino, J.F.D.C.; De Almeida, C.P.; Gonçalves, G.D.M.C.; Bueno, C.J.; Carbonell, S.A.M.; Chiorato, A.F.; Bechimol-Reis, L.L. Assessment of resistance in common bean to Fusarium oxysporum f. sp. phaseoli using different inoculation and evaluation methods. Crop. Breed. Appl. Biotechnol. 2020, 20, 2020. [Google Scholar] [CrossRef]
- Cruz, A.F.; Silva, L.F.; Sousa, T.V.; Nicoli, A.; de Paula Junior, T.J.; Caixeta, E.T.; Zambolim, L. Molecular diversity in Fusarium oxysporum isolates from common bean fields in Brazil. Eur. J. Plant Pathol. 2018, 152, 343–354. [Google Scholar] [CrossRef]
- Petkar, A.; Harris-Shultz, K.; Wang, H.; Brewer, M.T.; Sumabat, L.; Ji, P. Genetic and phenotypic diversity of Fusarium oxysporum f. sp. niveum populations from watermelon in the southeastern United States. PLoS ONE 2019, 14, e0219821. [Google Scholar] [CrossRef]
- Ribeiro, R.L.; Hagedorn, D. Screening for Resistance to and Pathogenic Specialization of Fusarium oxysporum f. sp. phaseoli, the Causal Agent of Bean Yellows. Phytopathology 1979, 69, 272–276. [Google Scholar] [CrossRef]
- Fall, A.L.; Byrne, P.F.; Jung, G.; Coyne, D.P.; Brick, M.A.; Schwartz, H.F. Detection and mapping of a major locus for fusarium wilt resistance in common bean. Crop. Sci. 2001, 41, 1494–1498. [Google Scholar] [CrossRef]
- Cândida, D.V.; Costa, J.G.C.; Rava, C.A.; Carneiro, M.S. Genetic control of Fusarium wilt in common bean. Trop. Plant Pathol. 2009, 34, 379–384. [Google Scholar] [CrossRef]
- Leitao, S.T.; Malosetti, M.; Song, Q.; Van Eeuwijk, F.; Rubiales, D.; Vaz Patto, M.C. Natural variation in Portuguese common bean germplasm reveals new sources of resistance against fusarium oxysporum f. sp. phaseoli and resistance-associated candidate genes. Phytopathology 2020, 110, 633–647. [Google Scholar] [CrossRef] [PubMed]
- Pereira, T.; Coelho, C.M.; Bogo, A.; Guidolin, A.F.; Miquelluti, D.J. Diversity in common bean landraces from south Brazil. Acta Bot. Croat. 2009, 68, 79–92. [Google Scholar]
- Chen, L.; Wu, Q.; He, W.; He, T.; Wu, Q.; Miao, Y. Combined De Novo Transcriptome and Metabolome Analysis of Common Bean Response to Fusarium oxysporum f. sp. phaseoli Infection. Int. J. Mol. Sci. 2019, 20, 6278. [Google Scholar] [CrossRef]
- Doerge, R.W. Mapping and analysis of quantitative trait loci in experimental populations. Nat. Rev. Genet. 2002, 3, 43–52. [Google Scholar] [CrossRef]
- Keller, B.; Manzanares, C.; Jara, C.; Lobaton, J.D.; Studer, B.; Raatz, B. Fine-mapping of a major QTL controlling angular leaf spot resistance in common bean (Phaseolus vulgaris L.). Theor. Appl. Genet. 2015, 128, 813–826. [Google Scholar] [CrossRef]
- Yu, Z.; Chang, F.; Lv, W.; Sharmin, R.A.; Wang, Z.; Kong, J.; Akhter Bhat, J.; Zhao, T. Identification of QTN and Candidate Gene for Seed-flooding Tolerance in Soybean [Glycine max (L.) Merr.] using Genome-Wide Association Study (GWAS). Genes 2019, 10, 957. [Google Scholar] [CrossRef]
- Wang, T.; Wei, L.; Wang, J.; Xie, L.; Li, Y.Y.; Ran, S.; Ren, L.; Lu, K.; Li, J.; Timko, M.P.; et al. Integrating GWAS, linkage mapping and gene expression analyses reveals the genetic control of growth period traits in rapeseed (Brassica napus L.). Biotechnol. Biofuels 2020, 13. [Google Scholar] [CrossRef]
- Bartoli, C.; Roux, F. Genome-wide association studies in plant pathosystems: Toward an ecological genomics approach. Front. Plant. Sci. 2017, 8, 8. [Google Scholar] [CrossRef]
- Zan, Y.; Carlborg, Ö. A multilocus association analysis method integrating phenotype and expression data reveals multiple novel associations to flowering time variation in wild-collected Arabidopsis thaliana. Mol. Ecol. Resour. 2018, 18, 798–808. [Google Scholar] [CrossRef] [PubMed]
- Wang, J.; McClean, P.E.; Lee, R.; Goos, R.J.; Helms, T. Association mapping of iron deficiency chlorosis loci in soybean (Glycine max L. Merr.) advanced breeding lines. Theor. Appl. Genet. 2008, 116, 777–787. [Google Scholar] [CrossRef]
- Wen, L.; Chang, H.X.; Brown, P.J.; Domier, L.L.; Hartman, G.L. Genome-wide association and genomic prediction identifies soybean cyst nematode resistance in common bean including a syntenic region to soybean Rhg1 locus. Hortic. Res. 2019, 6, 1–12. [Google Scholar] [CrossRef] [PubMed]
- Oladzad, A.; Zitnick-Anderson, K.; Jain, S.; Simons, K.; Osorno, J.M.; McClean, P.E.; Pasche, J.S. Genotypes and Genomic Regions Associated With Rhizoctonia solani Resistance in Common Bean. Front. Plant Sci. 2019, 10. [Google Scholar] [CrossRef] [PubMed]
- De Almeida, C.P.; Paulino, J.F.D.C.; Carbonell, S.A.M.; Chiorato, A.F.; Song, Q.; Di Vittori, V.; Rodriguez, M.; Papa, R.; Benchimol-Reis, L.L. Genetic Diversity, Population Structure, and Andean Introgression in Brazilian Common Bean Cultivars after Half a Century of Genetic Breeding. Genes 2020, 11, 1298. [Google Scholar] [CrossRef]
- Song, Q.; Jia, G.; Hyten, D.L.; Jenkins, J.; Hwang, E.-Y.; Schroeder, S.G.; Osorno, J.M.; Schmutz, J.; Jackson, S.A.; Mcclean, P.E.; et al. SNP Assay Development for Linkage Map Construction, Anchoring Whole-Genome Sequence, and Other Genetic and Genomic Applications in Common Bean. G3 Genes Genomes Genet. 2015. [Google Scholar] [CrossRef] [PubMed]
- Cichy, K.A.; Porch, T.G.; Beaver, J.S.; Cregan, P.; Fourie, D.; Glahn, R.P.; Grusak, M.A.; Kamfwa, K.; Katuuramu, D.N.; McClean, P.; et al. A Phaseolus vulgaris diversity panel for andean bean improvement. Crop. Sci. 2015, 55, 2149–2160. [Google Scholar] [CrossRef]
- De Lima Castro, S.A.; Gonçalves-Vidigal, M.C.; Gilio, T.A.S.; Lacanallo, G.F.; Valentini, G.; da Silva Ramos Martins, V.; Song, Q.; Galván, M.Z.; Hurtado-Gonzales, O.P.; Pastor-Corrales, M.A. Genetics and mapping of a new anthracnose resistance locus in Andean common bean Paloma. BMC Genom. 2017, 18. [Google Scholar] [CrossRef]
- Gonçalves-Vidigal, M.C.; Gilio, T.A.S.; Valentini, G.; Vaz-Bisneta, M.; Vidigal Filho, P.S.; Song, Q.; Oblessuc, P.R.; Melotto, M. New Andean source of resistance to anthracnose and angular leaf spot: Fine-mapping of disease-resistance genes in California Dark Red Kidney common bean cultivar. PLoS ONE 2020, 15, e0235215. [Google Scholar] [CrossRef]
- Hurtado-Gonzales, O.P.; Valentini, G.; Gilio, T.A.S.; Martins, A.M.; Song, Q.; Pastor-Corrales, M.A. Fine mapping of Ur-3, a historically important rust resistance locus in common bean. G3 Genes Genomes Genet. 2017, 7, 557–569. [Google Scholar] [CrossRef]
- Kamfwa, K.; Cichy, K.A.; Kelly, J.D. Genome-Wide Association Study of Agronomic Traits in Common Bean. Plant Genome 2015, 8, plantgenome2014-09. [Google Scholar] [CrossRef] [PubMed]
- Zuiderveen, G.H.; Padder, B.A.; Kamfwa, K.; Song, Q.; Kelly, J.D. Genome-Wide association study of anthracnose resistance in andean beans (Phaseolus vulgaris). PLoS ONE 2016, 11, e0156391. [Google Scholar] [CrossRef] [PubMed]
- Bello, M.H.; Moghaddam, S.M.; Massoudi, M.; McClean, P.E.; Cregan, P.B.; Miklas, P.N. Application of in silico bulked segregant analysis for rapid development of markers linked to Bean common mosaic virus resistance in common bean. BMC Genom. 2014, 15, 1–13. [Google Scholar] [CrossRef] [PubMed]
- Nakedde, T.; Ibarra-Perez, F.J.; Mukankusi, C.; Waines, J.G.; Kelly, J.D. Mapping of QTL associated with Fusarium root rot resistance and root architecture traits in black beans. Euphytica 2016, 212, 51–63. [Google Scholar] [CrossRef]
- Vidigal Filho, P.S.; Gonçalves-Vidigal, M.C.; Vaz Bisneta, M.; Souza, V.B.; Gilio, T.A.S.; Calvi, A.A.; Lima, L.R.L.; Pastor-Corrales, M.A.; Melotto, M. Genome-wide association study of resistance to anthracnose and angular leaf spot in Brazilian Mesoamerican and Andean common bean cultivars. Crop. Sci. 2020, 60, 2931–2950. [Google Scholar] [CrossRef]
- Diniz, A.L.; Giordani, W.; Costa, Z.P.; Margarido, G.R.A.; Perseguini, J.M.K.C.; Benchimol-Reis, L.L.; Chiorato, A.F.; Garcia, A.A.F.; Vieira, M.L.C. Evidence for strong kinship influence on the extent of linkage disequilibrium in cultivated common beans. Genes 2019, 10, 5. [Google Scholar] [CrossRef]
- Blair, M.W.; Brondani, R.V.P.; Díaz, L.M.; Del Peloso, M.J. Diversity and Population Structure of Common Bean from Brazil. Crop. Sci. 2013, 53, 1983–1993. [Google Scholar] [CrossRef]
- CIMMYT. Laboratory Protocols: CIMMYT Applied Molecular Genetics Laboratory Protocols, 3rd ed.; CIMMYT: Mexico City, Mexico, 2005. [Google Scholar]
- Schmutz, J.; McClean, P.E.; Mamidi, S.; Wu, G.A.; Cannon, S.B.; Grimwood, J.; Jenkins, J.; Shu, S.; Song, Q.; Chavarro, C.; et al. A reference genome for common bean and genome-wide analysis of dual domestications. Nat. Genet. 2014, 46, 707–713. [Google Scholar] [CrossRef]
- Bradbury, P.J.; Zhang, Z.; Kroon, D.E.; Casstevens, T.M.; Ramdoss, Y.; Buckler, E.S. TASSEL: Software for association mapping of complex traits in diverse samples. Bioinform. Appl. 2007, 23, 2633–2635. [Google Scholar] [CrossRef]
- Browning, B.L.; Zhou, Y.; Browning, S.R. A One-Penny Imputed Genome from Next-Generation Reference Panels. Am. J. Hum. Genet. 2018, 103, 338–348. [Google Scholar] [CrossRef]
- Alves-Santos, F.M.; Cordeiro-Rodrigues, L.; Sayagues, J.M.; Martin-Dominguez, R.; Garcia-Benavides, P.; Crespo, M.C.; Diaz-Minguez, J.M.; Eslava, A.P. Pathogenicity and race characterization of Fusarium oxysporum f. sp. phaseoli isolates from Spain and Greece. Plant Pathol. 2002, 51, 605–611. [Google Scholar] [CrossRef]
- Batista, R.O.; E Oliveira, A.M.C.; Silva, J.L.O.; Nicoli, A.; Carneiro, P.C.S.; Júnior, T.J.D.P.; De Queiroz, M.V.; Carneiro, J.E.D.S. Resistance to Fusarium wilt in common bean. Crop. Breed. Appl. Biotechnol. 2016, 16, 226–233. [Google Scholar] [CrossRef][Green Version]
- Pastor-Corrales, M.A.; Abawi, G.S. Reactions of Selected Bean Germ Plasms to Infection by Fusarium oxysporum f. sp. phaseoli. Plant Dis. 1987, 71, 990. [Google Scholar] [CrossRef]
- Shaner, G.; Finney, R.E. The effect of nitrogen fertilization on the expression of slow-mildewing resistance in knox wheat. Phytopathology 1997, 70, 1183–1186. [Google Scholar] [CrossRef]
- Matias, F.I.; Granato, I.; Fritsche-Neto, R. Be-Breeder: An R/Shiny application for phenotypic data analyses in plant breeding. Crop. Breed. Appl. Biotechnol. 2018, 18, 241–243. [Google Scholar] [CrossRef]
- Liu, X.; Huang, M.; Fan, B.; Buckler, E.S.; Zhang, Z. Iterative Usage of Fixed and Random Effect Models for Powerful and Efficient Genome-Wide Association Studies. PLoS Genet. 2016, 12. [Google Scholar] [CrossRef] [PubMed]
- Schwarz, G. Estimating the Dimension of a Model. Ann. Stat. 1978, 6, 461–464. [Google Scholar] [CrossRef]
- Yu, J.; Pressoir, G.; Briggs, W.H.; Bi, I.V.; Yamasaki, M.; Doebley, J.F.; McMullen, M.D.; Gaut, B.S.; Nielsen, D.M.; Holland, J.B.; et al. A unified mixed-model method for association mapping that accounts for multiple levels of relatedness. Nat. Genet. 2006, 38, 203–208. [Google Scholar] [CrossRef] [PubMed]
- VanRaden, P.M. Efficient methods to compute genomic predictions. J. Dairy Sci. 2008, 91, 4414–4423. [Google Scholar] [CrossRef]
- Churchill, G.A.; Doerge, R.W. Empirical threshold values for quantitative trait mapping. Genetics 1994, 138, 963–971. [Google Scholar] [CrossRef]
- Bonferroni, C. Teoria statistica delle classi e calcolo delle probabilità. Pubblicazioni del R Istituto Superiore di Scienze Economiche e Commericiali di Firenze 1963, 8, 3–62. [Google Scholar]
- Dandine-Roulland, C.; Perdry, H. Genome-wide data manipulation, association analysis and heritability estimates in R with Gaston 1.5. Hum. Hered. 2017, 83, 1–29. [Google Scholar]
- Hill, W.G.; Weir, B.S. Variances and covariances of squared linkage disequilibria in finite populations. Theor. Popul. Biol. 1988, 33, 54–78. [Google Scholar] [CrossRef]
- Goodstein, D.M.; Shu, S.; Howson, R.; Neupane, R.; Hayes, R.D.; Fazo, J.; Mitros, T.; Dirks, W.; Hellsten, U.; Putnam, N.; et al. Phytozome: A comparative platform for green plant genomics. Nucleic Acids Res. 2012, 40. [Google Scholar] [CrossRef]
- Augusto Morais Carbonell, S.; Fernando Chiorato, A.; Bolonhezi, D.; Lúcia Paes de Barros, V.N.; Luis Barbosa Borges, W.; Ticelli, M.; Boller Gallo, P.; Luis Finoto, E.; Cristina Belmiro dos Santos, N. ‘IAC Milênio’-Common bean cultivar with high grain quality. Crop. Breed. Appl. Biotechnol. 2014, 14, 273–276. [Google Scholar] [CrossRef]
- Chiorato, A.F.; Carbonell, S.A.M.; Gonçalves, J.G.R.; da Silva, D.A.; Benchimol-Reis, L.L.; Carvalho, C.R.L.; de Barros, V.L.N.P.; de Freitas, R.S.; Ticelli, M.; Gallo, P.B.; et al. IAC sintonia: New carioca common bean cultivar. Crop. Breed. Appl. Biotechnol. 2018, 18, 338–342. [Google Scholar] [CrossRef]
- Mendes, L.W.; Raaijmakers, J.M.; De Hollander, M.; Mendes, R.; Tsai, S.M. Influence of resistance breeding in common bean on rhizosphere microbiome composition and function. ISME J. 2018, 12, 212–224. [Google Scholar] [CrossRef]
- Melo, L.C.; Pereira, H.S.; De Faria, L.C.; De Souza, T.L.P.O.; Wendland, A.; Díaz, J.L.C.; De Carvalho, H.W.L.; Da Costa, A.F.; Magaldi, M.C.D.S. BRS FC402: High-yielding common bean cultivar with carioca grain, resistance to anthracnose and fusarium wilt. Crop. Breed. Appl. Biotechnol. 2017, 17, 67–71. [Google Scholar] [CrossRef]
- Teixeira, A.; Da Silva, D.A.; Gonçalves, J.G.R.; Esteves, J.A.F.; Carbonell, S.A.M.; Chiorato, A.F. Root characterization of bean genotypes (Phaseolus vulgaris) under drought stress. Genet. Mol. Res. 2019, 18. [Google Scholar] [CrossRef]
- Recchia, G.H.; Caldas, D.G.G.; Beraldo, A.L.A.; da Silva, M.J.; Tsai, S.M. Transcriptional analysis of drought-induced genes in the roots of a tolerant genotype of the common bean (Phaseolus vulgaris L.). Int. J. Mol. Sci. 2013, 14, 7155–7179. [Google Scholar] [CrossRef]
- Briñez, B.; Perseguini, J.M.K.C.; Rosa, J.S.; Bassi, D.; Gonçalves, J.G.R.; Almeida, C.; Paulino, J.F.D.C.; Blair, M.W.; Chioratto, A.F.; Carbonell, S.A.M.; et al. Mapping QTLs for drought tolerance in a SEA 5 x AND 277 common bean cross with SSRs and SNP markers. Genet. Mol. Biol. 2017, 40, 813–823. [Google Scholar] [CrossRef]
- Gonçalves, J.G.R.; de Andrade, E.R.; da Silva, D.A.; de Fátima Esteves, J.A.; Chiorato, A.F.; Carbonell, S.A.M. Drought tolerance evaluated in common bean genotypes. Ciência Agrotecnologia 2019, 43, 1719. [Google Scholar] [CrossRef]
- Bush, W.S.; Moore, J.H. Chapter 11: Genome-Wide Association Studies. PLoS Comput. Biol. 2012, 8, e1002822. [Google Scholar] [CrossRef]
- Fritsche-Neto, R.; De Souza, T.L.P.O.; Pereira, H.S.; De Faria, L.C.; Melo, L.C.; Novaes, E.; Brum, I.J.B.; Jannink, J.L. Association mapping in common bean revealed regions associated with anthracnose and angular leaf spot resistance. Sci. Agric. 2019, 76, 321–327. [Google Scholar] [CrossRef]
- Blair, M.W.; Cortés, A.J.; Farmer, A.D.; Huang, W.; Ambachew, D.; Varma Penmetsa, R.; Carrasquilla-Garcia, N.; Assefa, T.; Cannon, S.B. Uneven recombination rate and linkage disequilibrium across a reference SNP map for common bean (Phaseolus vulgaris L.). PLoS ONE 2018, 13, e0189597. [Google Scholar] [CrossRef]
- Korte, A.; Farlow, A. The advantages and limitations of trait analysis with GWAS: A review. Plant Methods 2013, 9, 29. [Google Scholar] [CrossRef] [PubMed]
- Henrique, F.H.; Carbonell, S.A.M.; Ito, M.F.; Gonçalves, J.G.R.; Sasseron, G.R.; Chiorato, A.F. Classification of physiological races of Fusarium oxysporum f. sp. phaseoli in common bean. Bragantia 2015, 74, 84–92. [Google Scholar] [CrossRef]
- Sasseron, G.R.; Benchimol-Reis, L.L.; Perseguini, J.M.K.C.; Paulino, J.F.C.; Bajay, M.M.; Carbonell, S.A.M.; Chiorato, A.F. Fusarium oxysporum f. sp. phaseoli genetic variability assessed by new developed microsatellites. Genet. Mol. Biol. 2020, 43. [Google Scholar] [CrossRef]
- Alves-Santos, F.M.; Benito, E.P.; Eslava, A.P.; Díaz-Mínguez, J.M. Genetic diversity of Fusarium oxysporum strains from common bean fields in Spain. Appl. Environ. Microbiol. 1999, 65, 3335–3340. [Google Scholar] [CrossRef]
- Jiménez-Gasco, M.M.; Milgroom, M.G.; Jiménez-Díaz, R.M. Gene genealogies support Fusarium oxysporum f. sp. ciceris as a monophyletic group. Plant Pathol. 2002, 51, 72–77. [Google Scholar] [CrossRef]
- Lv, H.; Fang, Z.; Yang, L.; Zhang, Y.; Wang, Y. An update on the arsenal: Mining resistance genes for disease management of Brassica crops in the genomic era. Hortic. Res. 2020, 7, 34. [Google Scholar] [CrossRef] [PubMed]
- Jha, U.C.; Bohra, A.; Pandey, S.; Parida, S.K. Breeding, Genetics, and Genomics Approaches for Improving Fusarium Wilt Resistance in Major Grain Legumes. Front. Genet. 2020, 11, 1001. [Google Scholar] [CrossRef] [PubMed]
- Rep, M.; Kistler, H.C. The genomic organization of plant pathogenicity in Fusarium species. Curr. Opin. Plant. Biol. 2010, 13, 420–426. [Google Scholar] [CrossRef]
- Thaines Bodah, E. Root Rot Diseases in Plants: A Review of Common Causal Agents and Management Strategies. Agric. Res. Technol. Open Access J. 2017, 5. [Google Scholar] [CrossRef]
- Gupta, A.; Sarkar, A.K.; Senthil-Kumar, M. Global transcriptional analysis reveals unique and shared responses in arabidopsis thaliana exposed to combined drought and pathogen stress. Front. Plant. Sci. 2016, 7. [Google Scholar] [CrossRef]
- Kumaran, D.; Eswaramoorthy, S.; Studier, F.W.; Swaminathan, S. Structure and mechanism of ADP-ribose-1″-monophosphatase (Appr-1″-pase), a ubiquitous cellular processing enzyme. Protein Sci. 2005, 14, 719–772. [Google Scholar] [CrossRef]
- Devoto, A.; Muskett, P.R.; Shirasu, K. Role of ubiquitination in the regulation of plant defence against pathogens. Curr. Opin. Plant. Biol. 2003, 6, 307–311. [Google Scholar] [CrossRef]
- Lyzenga, W.J.; Stone, S.L. Abiotic stress tolerance mediated by protein ubiquitination. J. Exp. Bot. 2012, 63, 599–616. [Google Scholar] [CrossRef]
- Lee, J.H.; Kim, W.T. Regulation of abiotic stress signal transduction by E3 ubiquitin ligases in arabidopsis. Mol. Cells 2011, 31, 201–208. [Google Scholar] [CrossRef]
- Lim, C.W.; Baek, W.; Jung, J.; Kim, J.H.; Lee, S.C. Function of ABA in stomatal defense against biotic and drought stresses. Int. J. Mol. Sci. 2015, 16, 15251–15270. [Google Scholar] [CrossRef]
- Mao, G.; Seebeck, T.; Schrenker, D.; Yu, O. CYP709B3, a cytochrome P450 monooxygenase gene involved in salt tolerance in Arabidopsis thaliana. BMC Plant Biol. 2013, 13, 169. [Google Scholar] [CrossRef] [PubMed]
- Xu, J.; Wang, X.Y.; Guo, W.Z. The cytochrome P450 superfamily: Key players in plant development and defense. J. Integr. Agric. 2015, 14, 1673–1686. [Google Scholar] [CrossRef]
- Sun, X.; Gilroy, E.M.; Chini, A.; Nurmberg, P.L.; Hein, I.; Lacomme, C.; Birch, P.R.J.; Hussain, A.; Yun, B.W.; Loake, G.J. ADS1 encodes a MATE-transporter that negatively regulates plant disease resistance. New Phytol. 2011, 192, 471–482. [Google Scholar] [CrossRef]
- Shoji, T.; Inai, K.; Yazaki, Y.; Sato, Y.; Takase, H.; Shitan, N.; Yazaki, K.; Goto, Y.; Toyooka, K.; Matsuoka, K.; et al. Multidrug and toxic compound extrusion-type transporters implicated in vacuolar sequestration of nicotine in tobacco roots. Plant Physiol. 2009, 149, 708–718. [Google Scholar] [CrossRef]
- Zhao, J.; Dixon, R.A. MATE transporters facilitate vacuolar uptake of epicatechin 3′-O-glucoside for proanthocyanidin biosynthesis in medicago truncatula and arabidopsis. Plant Cell 2009, 21, 2323–2340. [Google Scholar] [CrossRef]
- Debeaujon, I.; Peeters, A.J.M.; Léon-Kloosterziel, K.M.; Koornneef, M. The transparent testa12 gene of Arabidopsis encodes a multidrug secondary transporter-like protein required for flavonoid sequestration in vacuoles of the seed coat endothelium. Plant Cell 2001, 13, 853–871. [Google Scholar] [CrossRef]
- Pérez-Díaz, R.; Ryngajllo, M.; Pérez-Díaz, J.; Peña-Cortés, H.; Casaretto, J.A.; González-Villanueva, E.; Ruiz-Lara, S. VvMATE1 and VvMATE2 encode putative proanthocyanidin transporters expressed during berry development in Vitis vinifera L. Plant Cell Rep. 2014, 33, 1147–1159. [Google Scholar] [CrossRef] [PubMed]
- Zhang, H.; Zhu, H.; Pan, Y.; Yu, Y.; Luan, S.; Li, L. A DTX/MATE-type transporter facilitates abscisic acid efflux and modulates ABA sensitivity and drought tolerance in Arabidopsis. Mol. Plant 2014, 7, 1522–1532. [Google Scholar] [CrossRef] [PubMed]
- Mandal, S.; Mallick, N.; Mitra, A. Salicylic acid-induced resistance to Fusarium oxysporum f. sp. lycopersici in tomato. Plant. Physiol. Biochem. 2009, 47, 642–649. [Google Scholar] [CrossRef]
- Sharma, M.; Pandey, G.K. Expansion and function of repeat domain proteins during stress and development in plants. Front. Plant Sci. 2016, 6, 1218. [Google Scholar] [CrossRef] [PubMed]
- Yin, Y.; Huang, J.; Xu, Y. The cellulose synthase superfamily in fully sequenced plants and algae. BMC Plant Biol. 2009, 9, 99. [Google Scholar] [CrossRef] [PubMed]
- Ortiz, E.; Cruz, M.; Melgarejo, L.M.; Marquínez, X.; Hoyos-Carvajal, L. Características hispatologicas da infecção causada por Fusarium oxysporum e F. solani em maracujá-roxo (Passiflora edulis Sims). Summa Phytopathologica. Summa Phytopathol. 2014, 40, 134–140. [Google Scholar] [CrossRef]
- Gupta, S.K.; Rai, A.K.; Kanwar, S.S.; Sharma, T.R. Comparative analysis of zinc finger proteins involved in plant disease resistance. PLoS ONE 2012, 7, e42578. [Google Scholar] [CrossRef]
- Noman, A.; Aqeel, M.; Khalid, N.; Islam, W.; Sanaullah, T.; Anwar, M.; Khan, S.; Ye, W.; Lou, Y. Zinc finger protein transcription factors: Integrated line of action for plant antimicrobial activity. Microb. Pathog. 2019, 132, 141–149. [Google Scholar] [CrossRef] [PubMed]
- Wang, X.; Cai, X.; Xu, C.; Wang, Q.; Dai, S. Drought-responsive mechanisms in plant leaves revealed by proteomics. Int. J. Mol. Sci. 2016, 17, 1706. [Google Scholar] [CrossRef]
- Singh, D.; Yadav, N.S.; Tiwari, V.; Agarwal, P.K.; Jha, B. A SNARE-Like Superfamily Protein SbSLSP from the Halophyte Salicornia brachiata Confers Salt and Drought Tolerance by Maintaining Membrane Stability, K+/Na+ Ratio, and Antioxidant Machinery. Front. Plant Sci. 2016, 7, 737. [Google Scholar] [CrossRef] [PubMed]
- Erfatpour, M.; Navabi, A.; Pauls, K.P. Mapping the non-darkening trait from ‘Wit-rood boontje’ in bean (Phaseolus vulgaris). Theor. Appl. Genet. 2018, 131, 1331–1343. [Google Scholar] [CrossRef] [PubMed]
- Brick, M.A.; Byrne, P.F.; Schwartz, H.F.; Ogg, J.B.; Otto, K.; Fall, A.L.; Gilbert, J. Reaction to three races of fusarium wilt in the Phaseolus vulgaris core collection. Crop. Sci. 2006, 46, 1245–1252. [Google Scholar] [CrossRef]
- Banoo, A.; Nabi, A.; Rasool, R.S.; Farooq, M.; Shah, M.D.; Ahmad, M.; Sofi, P.A.; Nabi, A.; Itoo, H.; Sharma, P.N.; et al. North-Western Himalayan Common Beans: Population Structure and Mapping of Quantitative Anthracnose Resistance Through Genome Wide Association Study. Front. Plant Sci. 2020, 11, 1. [Google Scholar] [CrossRef]
- Bisneta, M.V.; Gonçalves-Vidigal, M.C. Integration of anthracnose resistance loci and RLK and NBS-LRR-encoding genes in the Phaseolus vulgaris L. genome. Crop. Sci. 2020. [Google Scholar] [CrossRef]
- Oladzad, A.; Porch, T.; Rosas, J.C.; Moghaddam, S.M.; Beaver, J.; Beebe, S.E.; Burridge, J.; Jochua, C.N.; Miguel, M.A.; Miklas, P.N.; et al. Single and multi-trait GWAS identify genetic factors associated with production traits in common bean under abiotic stress environments. G3 Genes Genomes Genet. 2019, 9, 1881–1892. [Google Scholar] [CrossRef]
- Steele, J.F.C.; Hughes, R.K.; Banfield, M.J. Structural and biochemical studies of an NB-ARC domain from a plant NLR immune receptor. PLoS ONE 2019, 14, e0221226. [Google Scholar] [CrossRef]
- Hoyos-Villegas, V.; Song, Q.; Kelly, J.D. Genome-wide Association Analysis for Drought Tolerance and Associated Traits in Common Bean. Plant Genome 2017, 10, plantgenome2015-12. [Google Scholar] [CrossRef]
- Myers, J.R.; Wallace, L.T.; Moghaddam, S.M.; Kleintop, A.E.; Echeverria, D.; Thompson, H.J.; Brick, M.A.; Lee, R.; McClean, P.E. Improving the health benefits of snap bean: Genome-wide association studies of total phenolic content. Nutrients 2019, 11, 2509. [Google Scholar] [CrossRef] [PubMed]
- Freixas Coutin, J.A.; Munholland, S.; Silva, A.; Subedi, S.; Lukens, L.; Crosby, W.L.; Pauls, K.P.; Bozzo, G.G. Proanthocyanidin accumulation and transcriptional responses in the seed coat of cranberry beans (Phaseolus vulgaris L.) with different susceptibility to postharvest darkening. BMC Plant Biol. 2017, 17, 89. [Google Scholar] [CrossRef]
- Zur, I.A.; Dubas, E.; Pociecha, E.; Dubert, F.; Kolasińska, I.; Płazek, A. Cytological analysis of infection process and the first defence responses induced in winter rye (Secale cereale L.) seedlings inoculated with Microdochium nivale. Physiol. Mol. Plant Pathol. 2011, 76, 189–196. [Google Scholar] [CrossRef]
- Piasecka, A.; Jedrzejczak-Rey, N.; Bednarek, P. Secondary metabolites in plant innate immunity: Conserved function of divergent chemicals. New Phytol. 2015, 206, 948–964. [Google Scholar] [CrossRef]
- Leitão, S.T.; Araújo, S.; Rubiales, D.; Vaz Patto, M.C. Abiotic and Biotic Stresses Interaction in Fabaceae Plants. Contributions from the Grain Legumes/Soilborne Vascular Diseases/Drought Stress Triangle. In The Plant Family Fabaceae; Springer: Singapore, 2020; pp. 237–260. [Google Scholar]
- Aung, K.; Jiang, Y.; He, S.Y. The role of water in plant-microbe interactions. Plant J. 2018, 93, 771–780. [Google Scholar] [CrossRef] [PubMed]
- Xue, R.; Wu, J.; Zhu, Z.; Wang, L.; Wang, X.; Wang, S.; Blair, M.W. Differentially Expressed Genes in Resistant and Susceptible Common Bean (Phaseolus vulgaris L.) Genotypes in Response to Fusarium oxysporum f. sp. phaseoli. PLoS ONE 2015, 10, e0127698. [Google Scholar] [CrossRef]
- Bigeard, J.; Colcombet, J.; Hirt, H. Signaling mechanisms in pattern-triggered immunity (PTI). Mol. Plant 2015, 8, 521–539. [Google Scholar] [CrossRef]


| Source of Variation | UFV01 Strain | IAC 18001 Strain | ||
|---|---|---|---|---|
| MDP | DSR | AUDPC | DSR | AUDPC |
| Genotypes | 1220.14 ** | 3075.29 ** | 1024.71 ** | 2367.56 ** |
| Broad-sense heritability | 0.63 ± 0.09 | 0.57 ± 0.09 | 0.55 ± 0.08 | 0.49 ± 0.08 |
| Selective accuracy | 0.91 | 0.89 | 0.88 | 0.86 |
| Mean resistant control 1 | 1.67 ± 0.20 | 10.00 ± 0.81 | 1.66 ± 0.11 | 9.33 ± 0.63 |
| Mean susceptible control 2 | 7.67 ± 0.56 | 28.00 ± 2.12 | 7.23 ± 0.86 | 24.60 ± 2.17 |
| Mean | 3.60 ± 1.73 | 17.40 ± 7.48 | 2.96 ± 1.35 | 13.60 ± 3.78 |
| Pearson Correlation 3 | 0.87 | 0.86 | ||
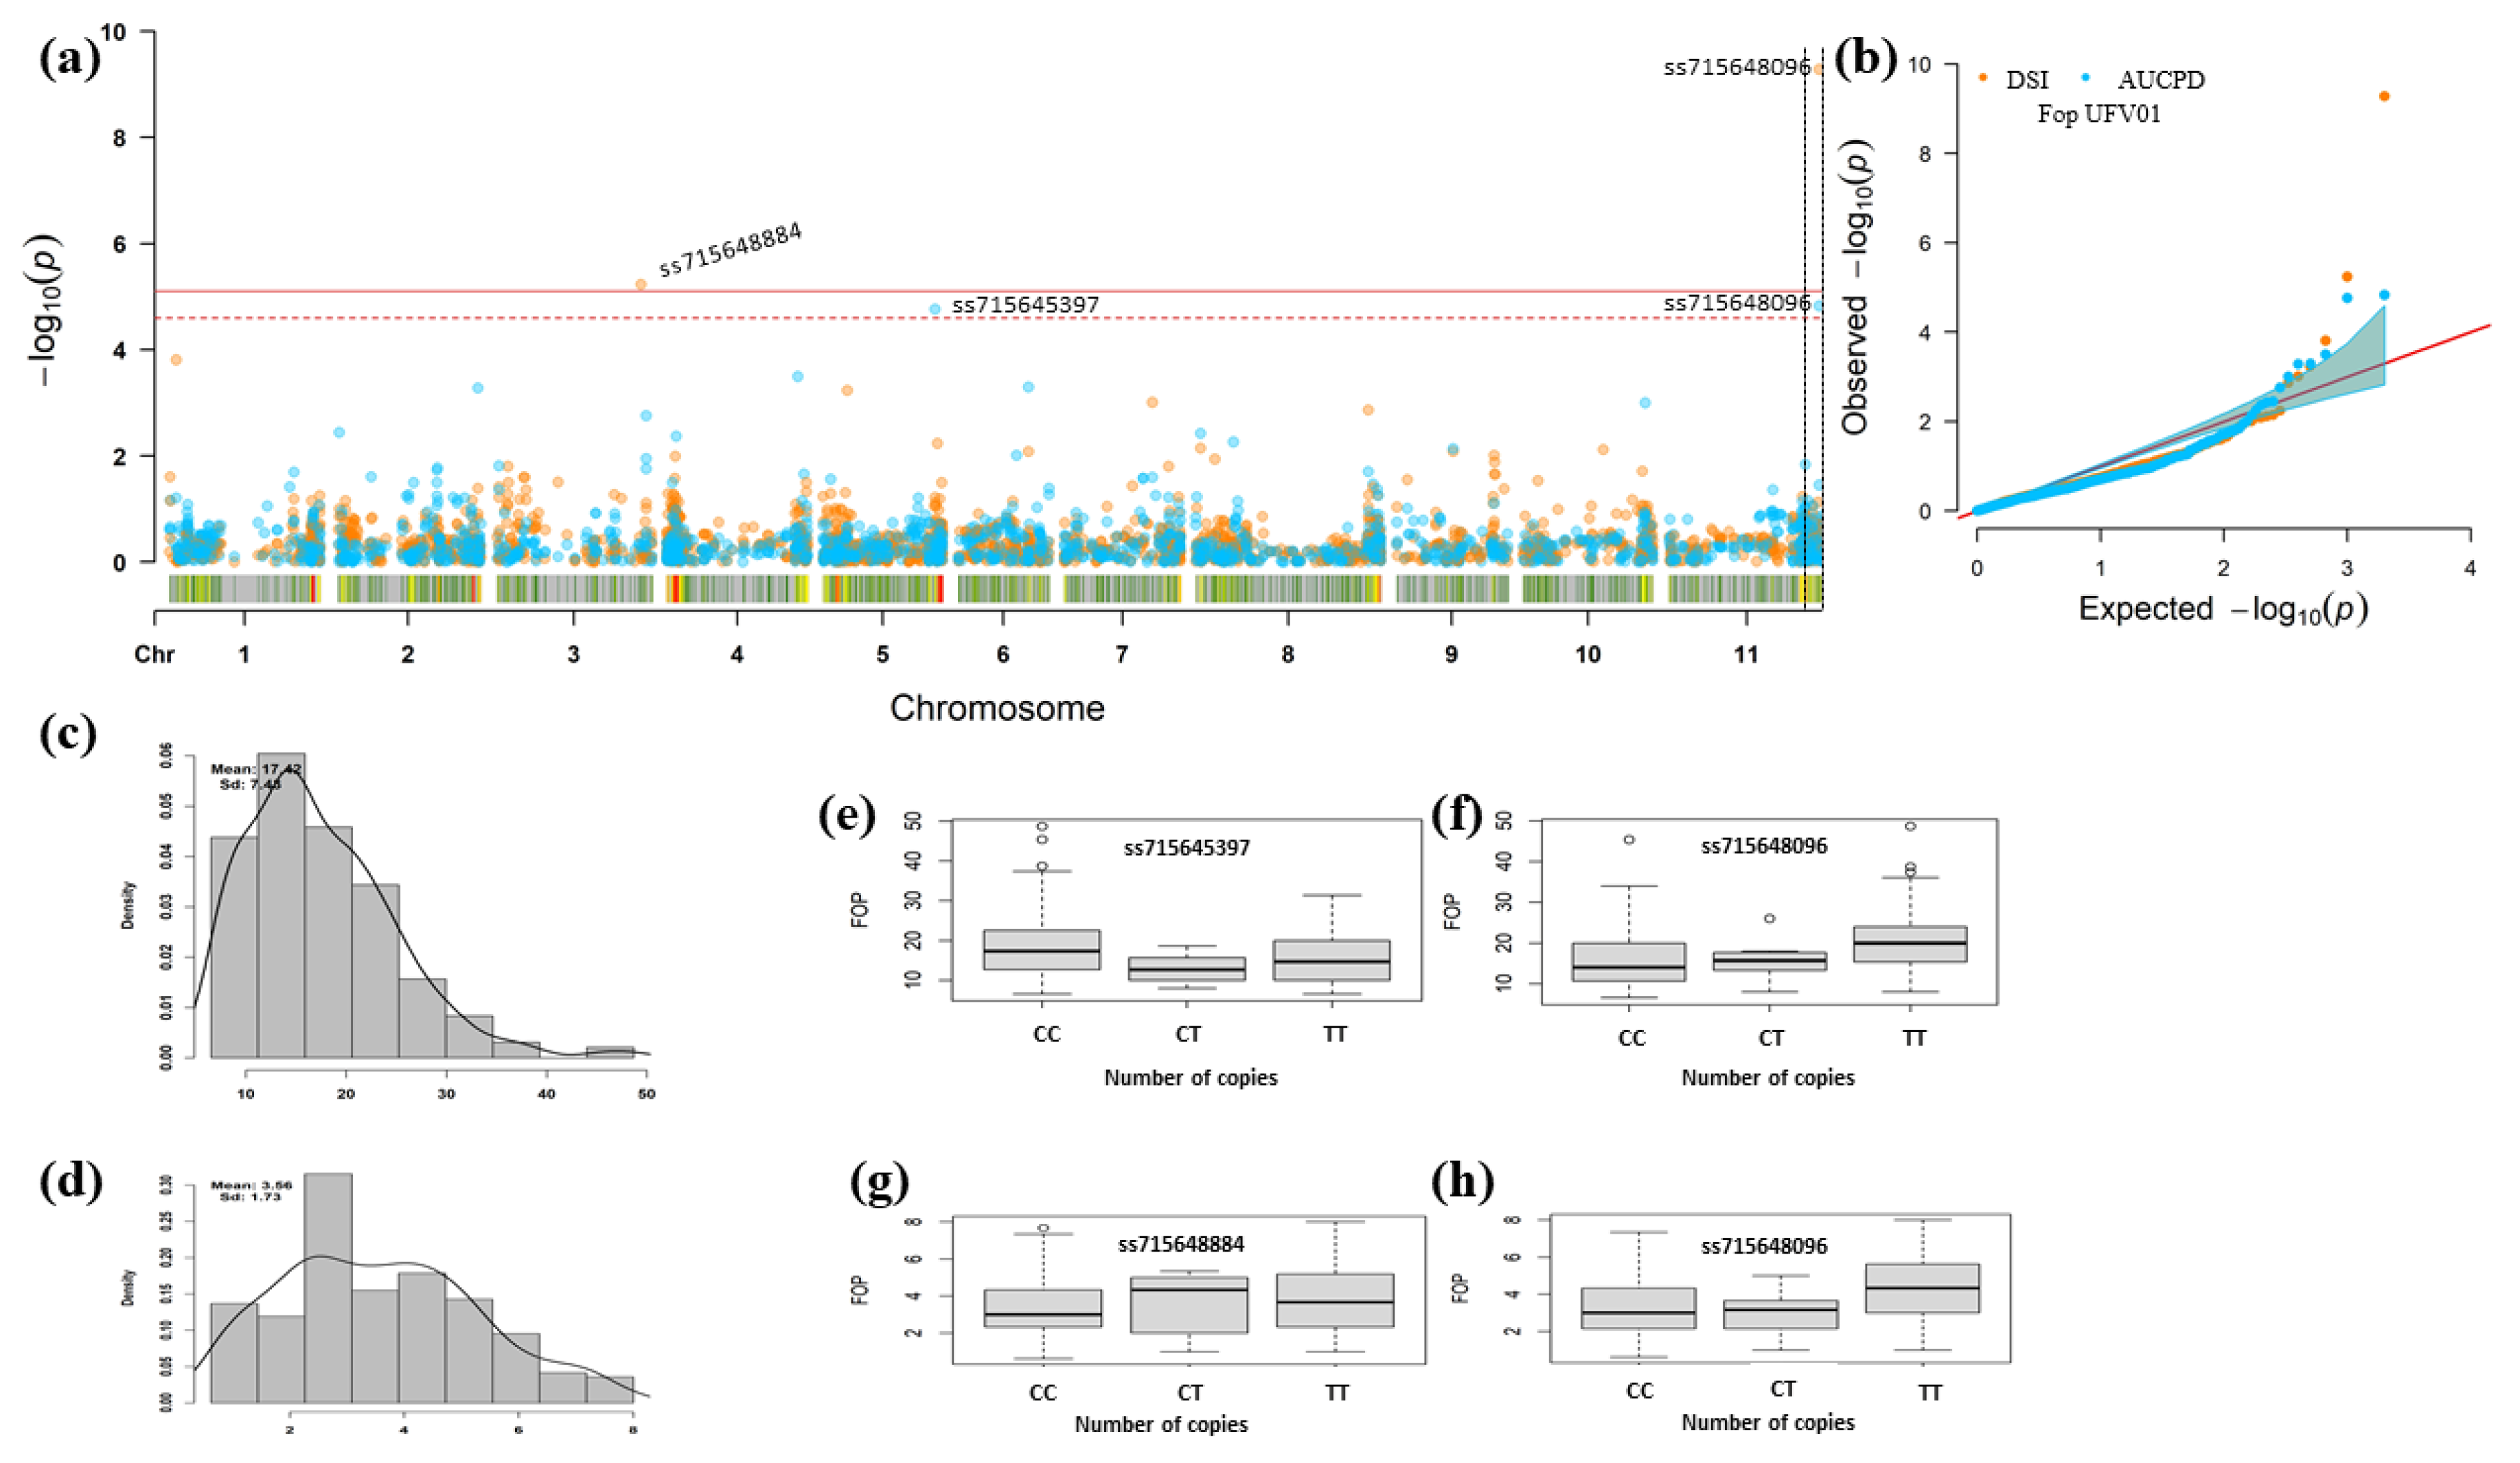
| Trait | Chr 1 | Position v2.1 2 | SNP | p-Value | MAF 3 | Effect 4 | Alleles | R2% 5 |
|---|---|---|---|---|---|---|---|---|
| DSR | Pv03 | 49,467,577 | ss715648884 | 5.81 × 10⁻⁶ | 0.21 | 0.63 | C e/T f | 0.16 |
| Pv11 | 51,500,684 | ss715648096 | 5.27 × 10⁻¹⁰ | 0.32 | 0.73 | C e/T f | 0.64 | |
| AUDPC | Pv05 | 38,267,303 | ss715645397 | 1.73 × 10⁻⁵ | 0.17 | −2.51 | C e/T f | 0.09 |
| Pv11 | 51,500,684 | ss715648096 | 2.59 × 10⁻⁵ | 0.32 | 2.08 | C e/T f | 0.09 |
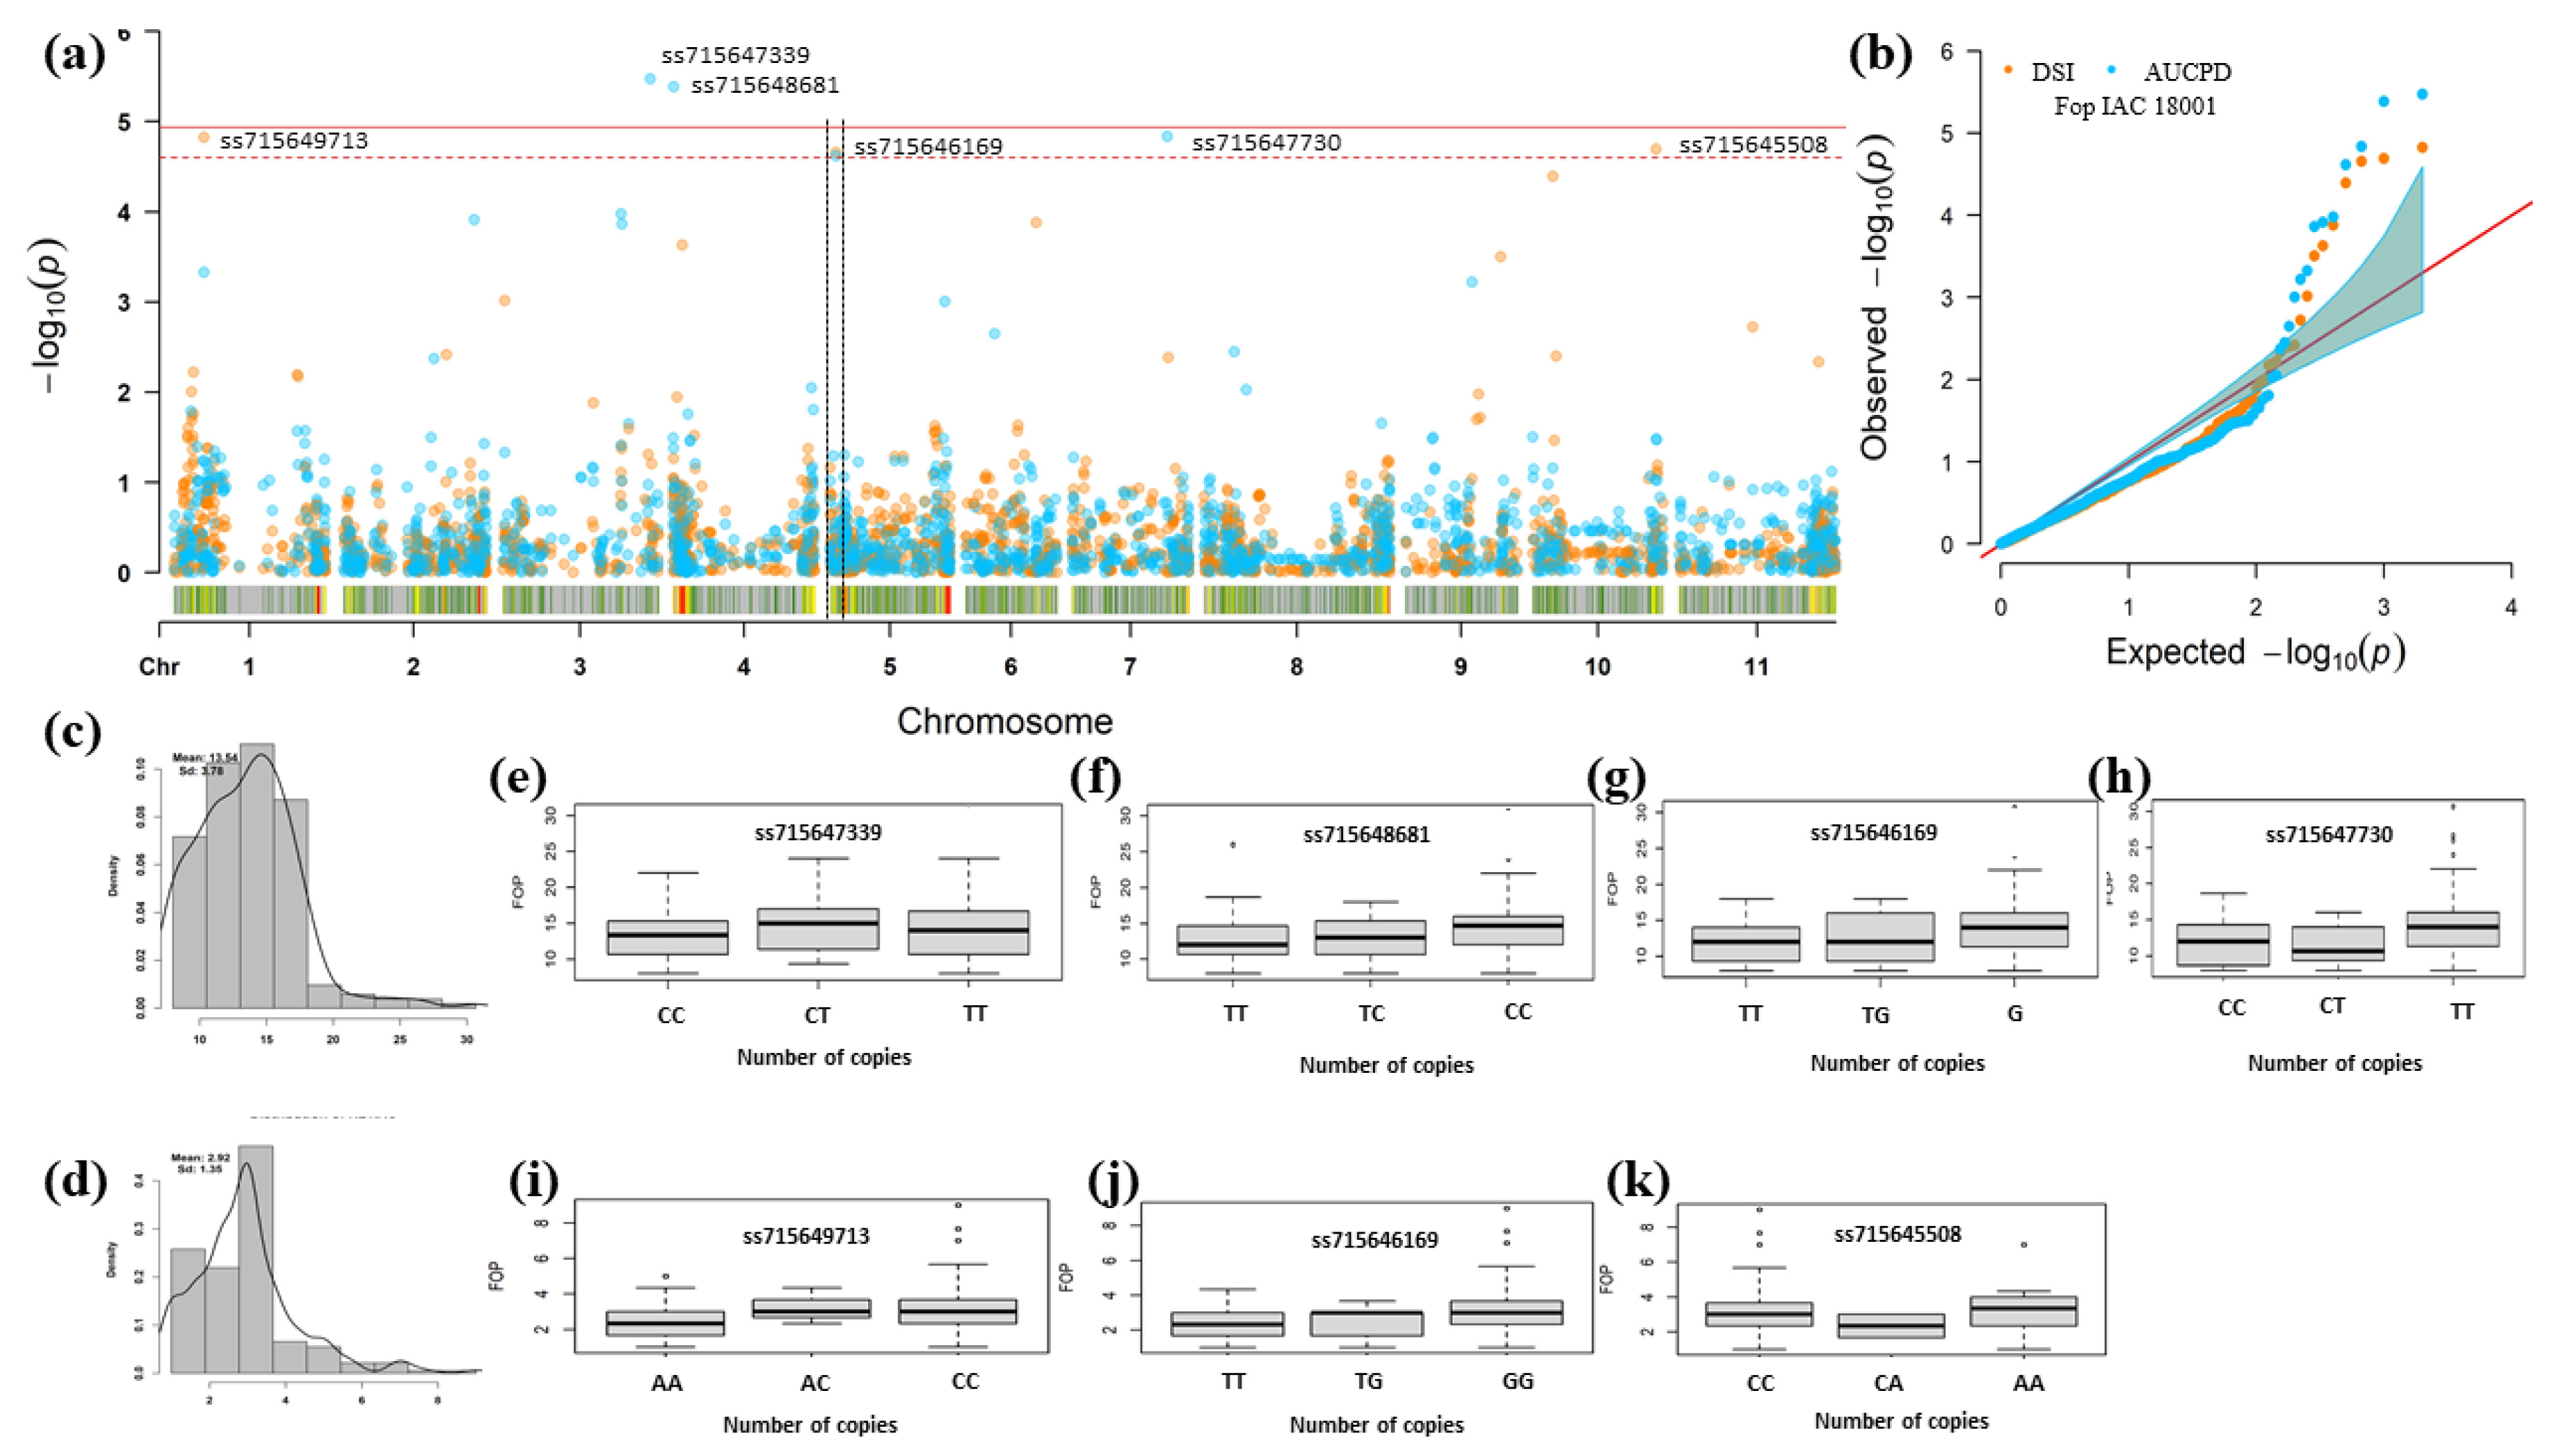
| Trait | Chr 1 | Position v2.1 2 | SNP | p-Value | MAF 3 | Effect 4 | Alleles | R2% 5 |
|---|---|---|---|---|---|---|---|---|
| DSR | Pv01 | 10,289,227 | ss715649713 | 1.50 × 10⁻⁵ | 0.18 | 0.45 | A e/C f | 0.09 |
| Pv05 | 1,990,853 | ss715646169 | 2.20 × 10⁻⁵ | 0.22 | 0.37 | T e/G f | 0.09 | |
| Pv10 | 41,966,104 | ss715645508 | 3.02 × 10⁻⁵ | 0.06 | 0.64 | C e/A f | 0.09 | |
| AUDPC | Pv03 | 50,473,206 | ss715647339 | 3.36 × 10⁻⁶ | 0.46 | 1.05 | C e/T f | 0.16 |
| Pv04 | 155,465 | ss715648681 | 4.13 × 10⁻⁶ | 0.50 | 0.98 | T e/C f | 0.09 | |
| Pv05 | 1,990,853 | ss715646169 | 2.42 × 10⁻⁵ | 0.22 | 1.15 | T e/G f | 0.09 | |
| Pv07 | 32,298,702 | ss715647730 | 3.02 × 10⁻⁵ | 0.19 | 1.21 | C e/T f | 0.09 |
| Gene | Distance 1 | Description |
|---|---|---|
| Phvul.011G200300 | 0.035 | NB-ARC domain-containing disease resistance protein |
| Phvul.011G200800 | 0.069 | LRR/NB-ARC domain-containing disease resistance protein |
| Phvul.011G200820 | 0.103 | NB-ARC domain-containing disease resistance protein |
| Phvul.011G200840 | 0.109 | LRR and NB-ARC domain-containing disease resistance protein |
| Phvul.011G200860 | 0.111 | NB-ARC domain-containing disease resistance protein |
| Phvul.011G200880 | 0.122 | LRR and NB-ARC domain-containing disease resistance protein |
| Phvul.011G200900 | 0.141 | NB-ARC domain-containing disease resistance protein |
| Phvul.011G201000 | 0.151 | LRR and NB-ARC domain-containing disease resistance protein |
| Phvul.011G201101 | 0.159 | NB-ARC domain-containing disease resistance protein |
| Phvul.011G202000 | 0.248 | NB-ARC domain-containing disease resistance protein |
| Phvul.011G202200 | 0.264 | LRR and NB-ARC domain-containing disease resistance protein |
| Phvul.011G202366 | 0.295 | NB-ARC domain-containing disease resistance protein |
| Phvul.011G202432 | 0.297 | NB-ARC domain-containing disease resistance protein |
| Phvul.011G202601 | 0.341 | LRR and NB-ARC domain-containing disease resistance protein |
| Phvul.011G202750 | 0.343 | LRR and NB-ARC domain-containing disease resistance protein |
| Phvul.011G202800 | 0.344 | Disease resistance protein (TIR-NBS-LRR class) family |
| Phvul.011G202900 | 0.347 | LRR and NB-ARC domain-containing disease resistance protein |
| Phvul.011G202966 | 0.365 | NB-ARC domain-containing disease resistance protein |
| Phvul.011G203032 | 0.388 | LRR and NB-ARC domain-containing disease resistance protein |
| Phvul.011G203100 | 0.393 | LRR and NB-ARC domain-containing disease resistance protein |
| Gene | Distance 1 | Description |
|---|---|---|
| Phvul.005G016200 | 0.561 | Zinc ion binding |
| Phvul.005G016300 | 0.556 | Late embryogenesis abundant protein, group 1 protein |
| Phvul.005G016500 | 0.541 | Disease resistance protein (TIR-NBS-LRR class), putative |
| Phvul.005G017000 | 0.510 | Protein kinase superfamily protein |
| Phvul.005G018300 | 0.415 | Proline-rich family protein |
| Phvul.005G019900 | 0.261 | Zinc finger (CCCH-type/C3HC4-type RING finger) protein |
| Phvul.005G020000 | 0.251 | Zinc finger (CCCH-type/C3HC4-type RING finger) protein |
| Phvul.005G020100 | 0.247 | Ubiquitin carboxyl-terminal hydrolase family protein |
| Phvul.005G020600 | 0.197 | Putative methyltransferase family protein |
| Phvul.005G021300 | 0.129 | Microtubule-associated proteins |
| Phvul.005G022000 | 0.018 | CCCH-type zinc finger protein with ARM repeat domain |
| Phvul.005G022100 | 0.000 | Cellulose synthase family protein |
| Gene | Distance 1 | Description |
|---|---|---|
| Phvul.003G258100 | 0.277 | Lateral root primordium (LRP) protein-related |
| Phvul.003G258400 | 0.348 | Cytochrome P450 superfamily protein |
| Phvul.003G258700 | 0.381 | Leucine-rich repeat (LRR) family protein |
| Phvul.003G258800 | 0.386 | Leucine-rich receptor-like protein kinase family protein |
| Phvul.003G259700 | 0.447 | Serine carboxypeptidase S28 family protein |
| Phvul.003G260000 | 0.465 | Serine carboxypeptidase S28 family protein |
| Phvul.003G260100 | 0.481 | B-box type zinc finger family protein |
| Phvul.003G260200 | 0.495 | ATP binding microtubule motor family protein |
| Phvul.003G260300 | 0.514 | Leucine-rich receptor-like protein kinase family protein |
Publisher’s Note: MDPI stays neutral with regard to jurisdictional claims in published maps and institutional affiliations. |
© 2021 by the authors. Licensee MDPI, Basel, Switzerland. This article is an open access article distributed under the terms and conditions of the Creative Commons Attribution (CC BY) license (https://creativecommons.org/licenses/by/4.0/).
Share and Cite
Paulino, J.F.d.C.; Almeida, C.P.d.; Bueno, C.J.; Song, Q.; Fritsche-Neto, R.; Carbonell, S.A.M.; Chiorato, A.F.; Benchimol-Reis, L.L. Genome-Wide Association Study Reveals Genomic Regions Associated with Fusarium Wilt Resistance in Common Bean. Genes 2021, 12, 765. https://doi.org/10.3390/genes12050765
Paulino JFdC, Almeida CPd, Bueno CJ, Song Q, Fritsche-Neto R, Carbonell SAM, Chiorato AF, Benchimol-Reis LL. Genome-Wide Association Study Reveals Genomic Regions Associated with Fusarium Wilt Resistance in Common Bean. Genes. 2021; 12(5):765. https://doi.org/10.3390/genes12050765
Chicago/Turabian StylePaulino, Jean Fausto de Carvalho, Caléo Panhoca de Almeida, César Júnior Bueno, Qijian Song, Roberto Fritsche-Neto, Sérgio Augusto Morais Carbonell, Alisson Fernando Chiorato, and Luciana Lasry Benchimol-Reis. 2021. "Genome-Wide Association Study Reveals Genomic Regions Associated with Fusarium Wilt Resistance in Common Bean" Genes 12, no. 5: 765. https://doi.org/10.3390/genes12050765
APA StylePaulino, J. F. d. C., Almeida, C. P. d., Bueno, C. J., Song, Q., Fritsche-Neto, R., Carbonell, S. A. M., Chiorato, A. F., & Benchimol-Reis, L. L. (2021). Genome-Wide Association Study Reveals Genomic Regions Associated with Fusarium Wilt Resistance in Common Bean. Genes, 12(5), 765. https://doi.org/10.3390/genes12050765